joseph fan, tj wong, and tianyu zhang asset specificity, accounting quality and family succession
TRANSCRIPT

Joseph Fan, TJ Wong, and Tianyu Zhang
Asset Specificity, Accounting Quality and Family Succession

2
Broad Research Questions
Using the sample of family succession of 3 Asian economies (HK, Singapore and Taiwan), we test if change in control across generations affect accounting quality Succession effect only
We test if degree of control by family and/or founder shapes its accounting quality Interacting family control and succession
effects
3
Motivation
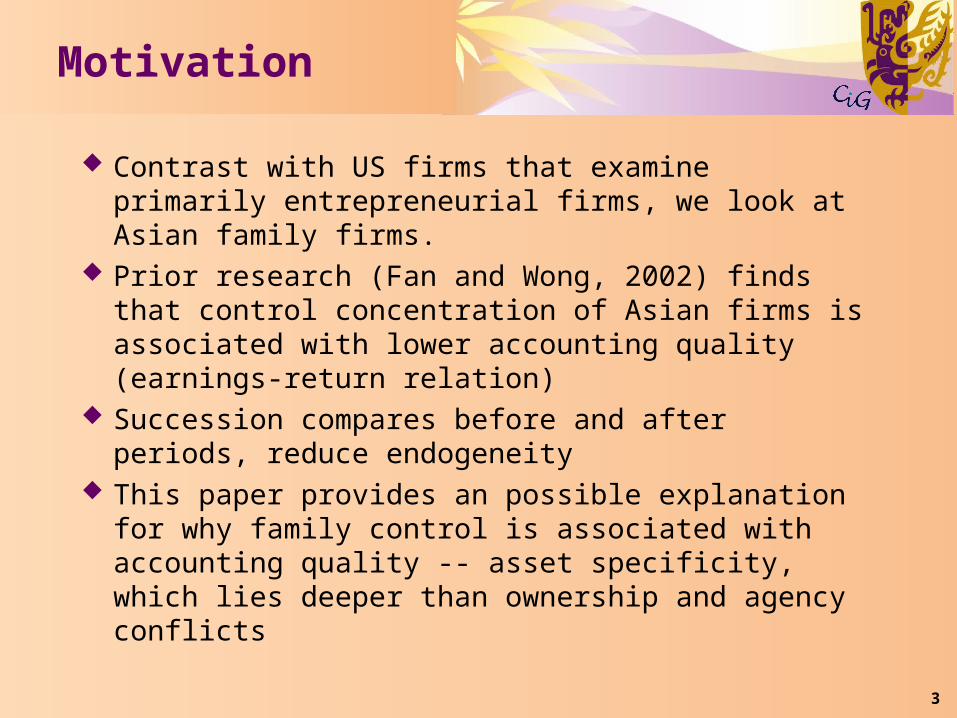
Contrast with US firms that examine primarily entrepreneurial firms, we look at Asian family firms.
Prior research (Fan and Wong, 2002) finds that control concentration of Asian firms is associated with lower accounting quality (earnings-return relation)
Succession compares before and after periods, reduce endogeneity
This paper provides an possible explanation for why family control is associated with accounting quality -- asset specificity, which lies deeper than ownership and agency conflicts

4
Definition of Succession
Succession as an event in which a controlling owner/manager steps down from the top executive (usually chairman in Asia) positions
It is anticipated that sometimes it will be ambiguous about when a succession starts and ends. Typically succession is a process that takes time to completeWe track firms from 5 years before to 5 years
after their chairman turnovers.The event window is set by data availability

5
Succession and Accounting
6
1. Family firms and their accounting system
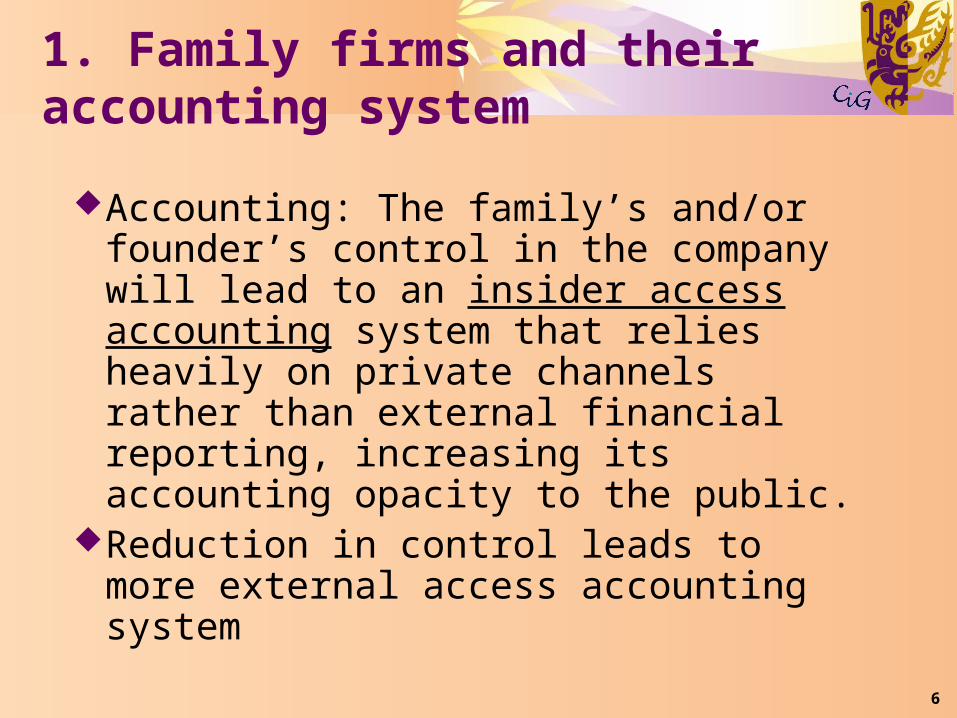
Accounting: The family’s and/or founder’s control in the company will lead to an insider access accounting system that relies heavily on private channels rather than external financial reporting, increasing its accounting opacity to the public.
Reduction in control leads to more external access accounting system

7
2. Specific Assets and Accounting
An important benefit of family ownership is to protect and capitalize on specific assets or non-transferable property rights (Alchian, 1965, 1969; Coase, 1937, 1960; Demsetz, 1964, 1967)e.g. family reputation, a secret formula, business
network and political connections or assets that generate amenity utilities
Specific assets are associated with opaque accountingOpacity helps to protection networks and connectionHard to account for specific assets and related
transactions e.g. reputation is not capitalized and its impairment is not associated with drop in earnings

8
2. Specific Assets and Accounting
Many of these specific assets are not fully transferable, not even to one’s children
This disruption during family succession allows us to examine if the reduction in asset specificity is associated with increase in accounting quality around successionSuccession --> higher accounting qualityInteraction: Reduction in family / founder
control, further increase in accounting quality

9
3. Predecessor’s Entrenchment
Founder or departing chairman tries to hang on to power
Asset specificity can be highly correlated with entrenchment (hard to separate)
Firm experiences poor performance prior to succession and tries to cover up
Firm performance and accounting quality improves after the succession

10
Measuring Accounting Quality
How to measure quality in literature?Accruals (unsigned discretionary accruals)
[Leuz et al.]Timely loss recognition [Bushman et al.]Earnings-return relations [Fan and Wong,
2002]

11
Discretionary Accruals Estimation
Modified Jones Model with contemporaneous ROA
Total Acc / TA = 1/TA + b1 (Sales-AR) / TA + b2 PPE / TA + e
NI = Total Acc + CF, so higher Total Acc, higher NI
Residual “e” is the unexpected change in accruals. Manipulated level
Unsigned discretionary accruals measure how much firms smooth earnings

12
Timely Loss Recognition
NI / MV = a + b1 Ret + b2 RD + b3 Ret x RD + e Ret, net-of-market annual stock returns, proxies for
economic earnings RD, dummy = 1 when Ret < 0, 0 otherwise Firms typical report bad news promptly, not good
news (conditional conservatism), b3 > 0 For firms that are opaque (insider access system), b3
is less positive. Insider system and less TLR
Bushman et al., countries with more SOEs tend to have less TLR
Ball et al. find that firms in code law countries have less TLR

13
Table 1 Sample
Hong Kong Singapore Taiwan1987 0 0 2 21988 0 0 3 31989 0 0 5 51990 0 0 6 61991 0 1 5 61992 0 5 6 111993 0 5 4 91994 0 6 7 131995 0 3 6 91996 4 5 11 201997 7 2 5 141998 4 3 7 141999 12 6 12 302000 14 5 13 322001 11 1 12 242002 9 3 0 122003 7 4 0 112004 2 1 0 32005 2 1 0 3Total 72 51 104 227
TotalEconomy
Turnover Year
14
Table 1 Sample
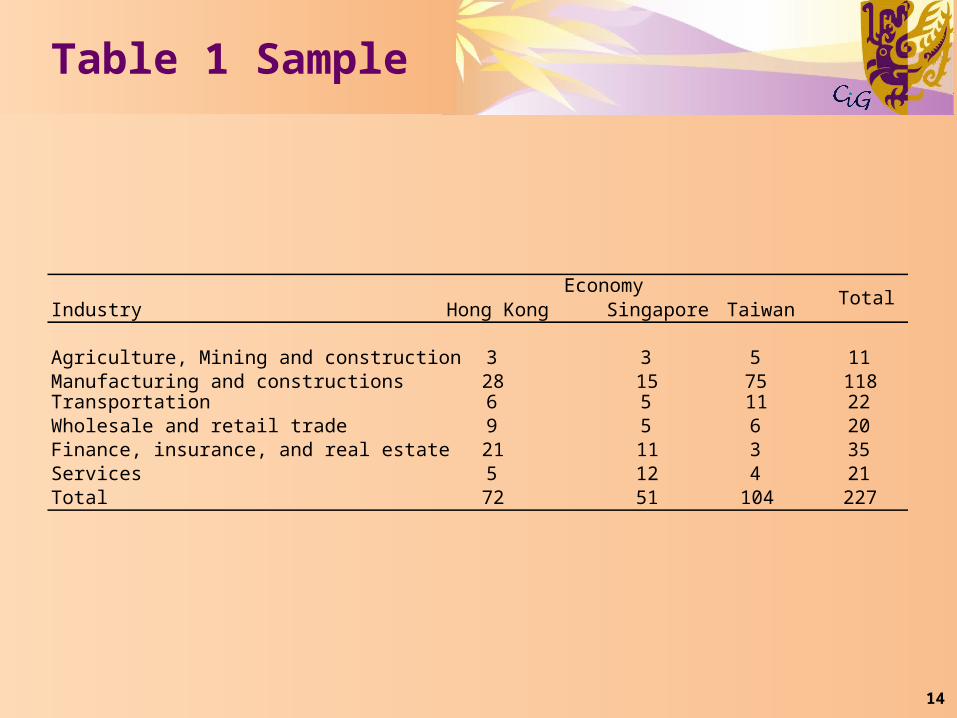
Industry Hong Kong Singapore Taiwan
Agriculture, Mining and construction 3 3 5 11Manufacturing and constructions 28 15 75 118Transportation 6 5 11 22Wholesale and retail trade 9 5 6 20Finance, insurance, and real estate 21 11 3 35Services 5 12 4 21Total 72 51 104 227
TotalEconomy

15
Accounting quality before and after succession
Question 1: We expect lower quality before and higher quality after
16
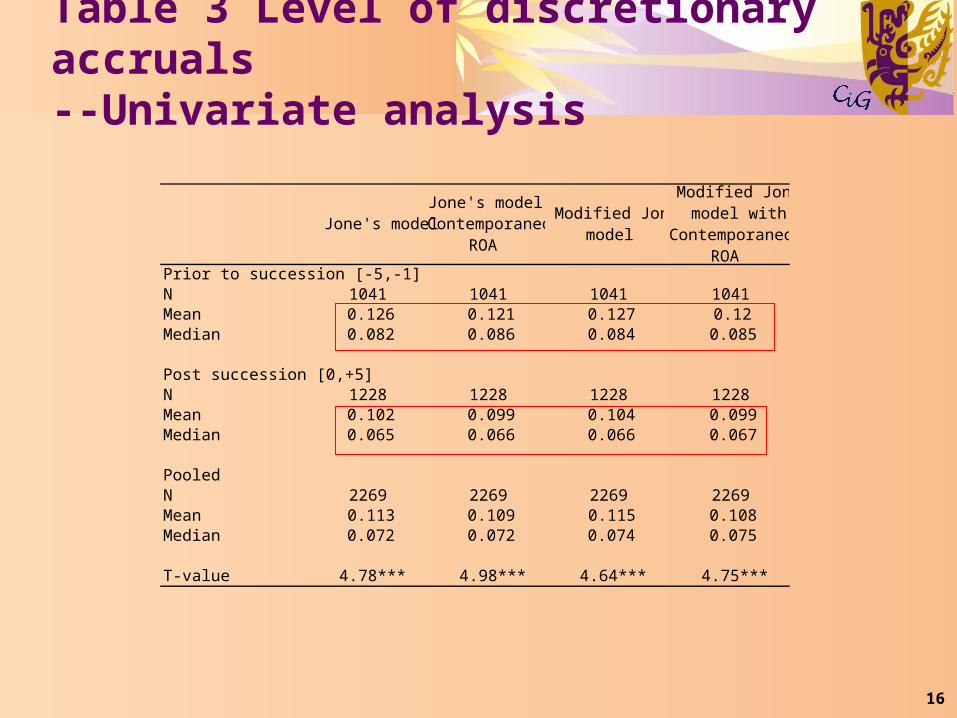
Table 3 Level of discretionary accruals--Univariate analysis
Jone's modelJone's model with Contemporaneous
ROA
Modified Jone's model
Modified Jone's model with
Contemporaneous ROA
Prior to succession [-5,-1]N 1041 1041 1041 1041Mean 0.126 0.121 0.127 0.12Median 0.082 0.086 0.084 0.085
Post succession [0,+5]N 1228 1228 1228 1228Mean 0.102 0.099 0.104 0.099Median 0.065 0.066 0.066 0.067
PooledN 2269 2269 2269 2269Mean 0.113 0.109 0.115 0.108Median 0.072 0.072 0.074 0.075
T-value 4.78*** 4.98*** 4.64*** 4.75***

17
Table 3 Level of discretionary accruals--multivariate analysis
Model (1) Model (2) Model (1) Model (2)
Jone's modelJone's model with Contemporaneous
ROA
Modified Jone's model
Modified Jone's model with
Contemporaneous ROA
Post Succession -0.017 -0.017 -0.016 -0.015(3.21)*** (3.61)*** (3.06)*** (3.36)***
Size -0.016 -0.013 -0.016 -0.012(6.76)*** (6.03)*** (6.50)*** (5.93)***
Leverage 0.053 0.034 0.050 0.029(3.71)*** (2.77)*** (3.55)*** (2.36)**
MB 0.011 0.011 0.011 0.011(6.09)*** (6.89)*** (6.18)*** (7.10)***
Constant 0.420 0.376 0.432 0.382(7.20)*** (8.53)*** (7.33)*** (8.45)***
Observations 2269 2269 2269 2269Adjusted R-squared 0.158 0.129 0.153 0.127
18
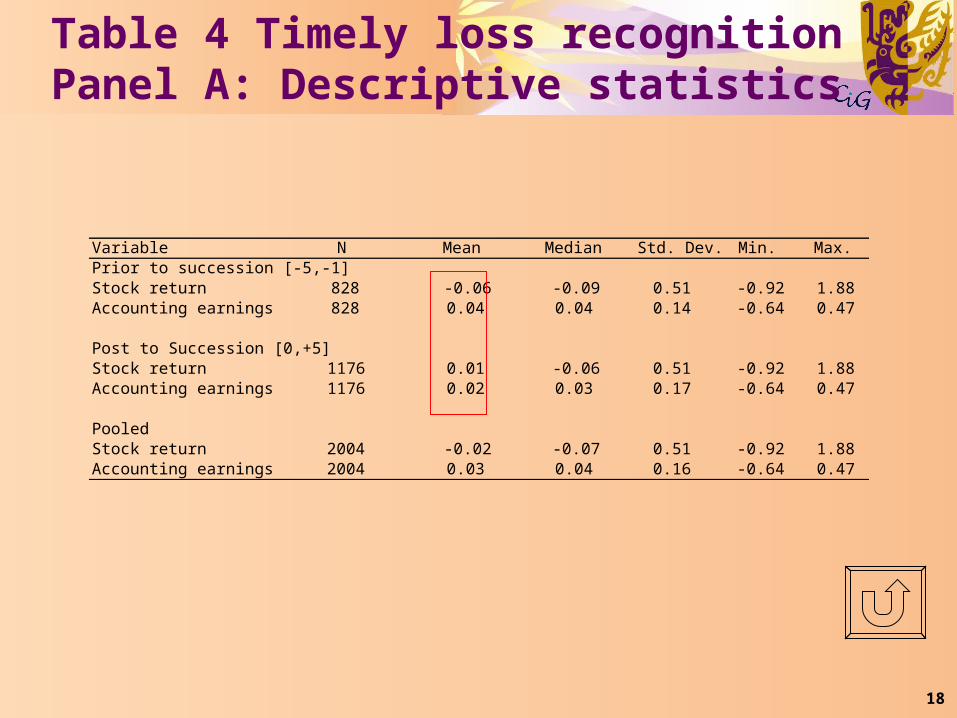
Table 4 Timely loss recognitionPanel A: Descriptive statistics
Variable N Mean Median Std. Dev. Min. Max.Prior to succession [-5,-1]Stock return 828 -0.06 -0.09 0.51 -0.92 1.88Accounting earnings 828 0.04 0.04 0.14 -0.64 0.47
Post to Succession [0,+5]Stock return 1176 0.01 -0.06 0.51 -0.92 1.88Accounting earnings 1176 0.02 0.03 0.17 -0.64 0.47
PooledStock return 2004 -0.02 -0.07 0.51 -0.92 1.88Accounting earnings 2004 0.03 0.04 0.16 -0.64 0.47

19
Table 4 Timely loss recognitionPanel B: Succession v.s. non-succession
Independent Var iable Succession Sample
Non-succession Sample Before After
Return 0.017 0.014 0.004 (3.28)*** (0.81) (0.25) RD -0.003 -0.009 0.005 (0.58) (0.63) (0.37) Return*RD 0.138 0.045 0.159 (13.55)*** (1.51) (4.96)*** Constant 0.070 0.060 0.045 (19.28)*** (5.81)*** (4.68)*** Observations 11562 828 1176 Adjusted R-squared 0.06 0.02 0.04
20
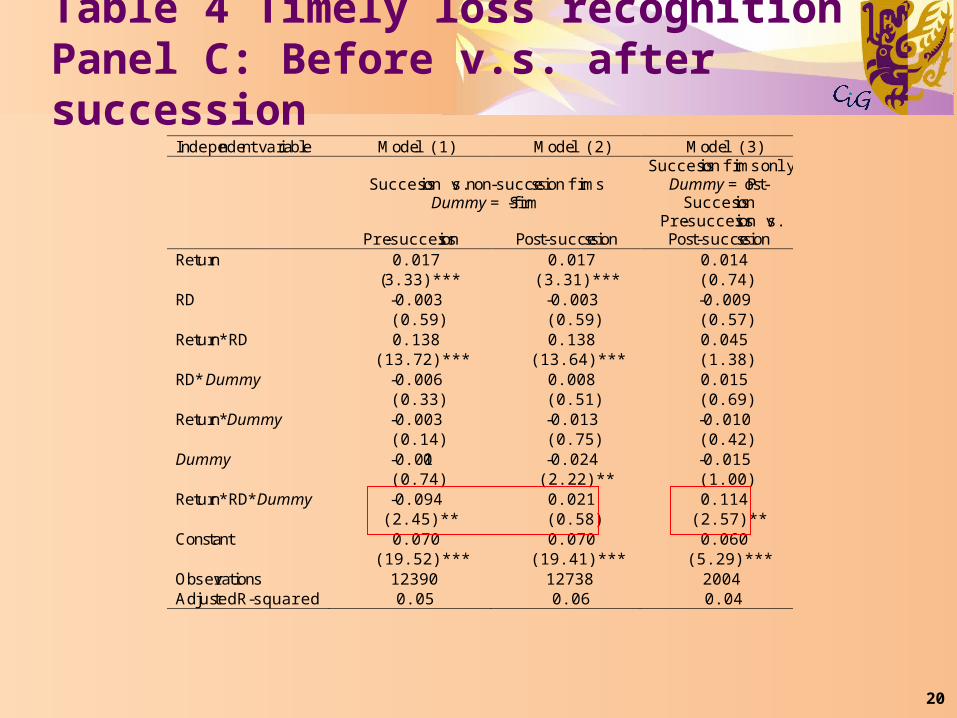
Table 4 Timely loss recognitionPanel C: Before v.s. after succession
Independent variable Model (1) Model (2) Model (3)
Succession vs. non-succession firms
Dummy = S-firm
Succession firms only Dummy = Post-
Succession
Pre-succession Post-succession Pre-succession vs. Post-succession
Return 0.017 0.017 0.014 (3.33)*** (3.31)*** (0.74) RD -0.003 -0.003 -0.009 (0.59) (0.59) (0.57) Return*RD 0.138 0.138 0.045 (13.72)*** (13.64)*** (1.38) RD*Dummy -0.006 0.008 0.015 (0.33) (0.51) (0.69) Return*Dummy -0.003 -0.013 -0.010 (0.14) (0.75) (0.42) Dummy -0.010 -0.024 -0.015 (0.74) (2.22)** (1.00) Return*RD*Dummy -0.094 0.021 0.114 (2.45)** (0.58) (2.57)** Constant 0.070 0.070 0.060 (19.52)*** (19.41)*** (5.29)*** Observations 12390 12738 2004 Adjusted R-squared 0.05 0.06 0.04
21
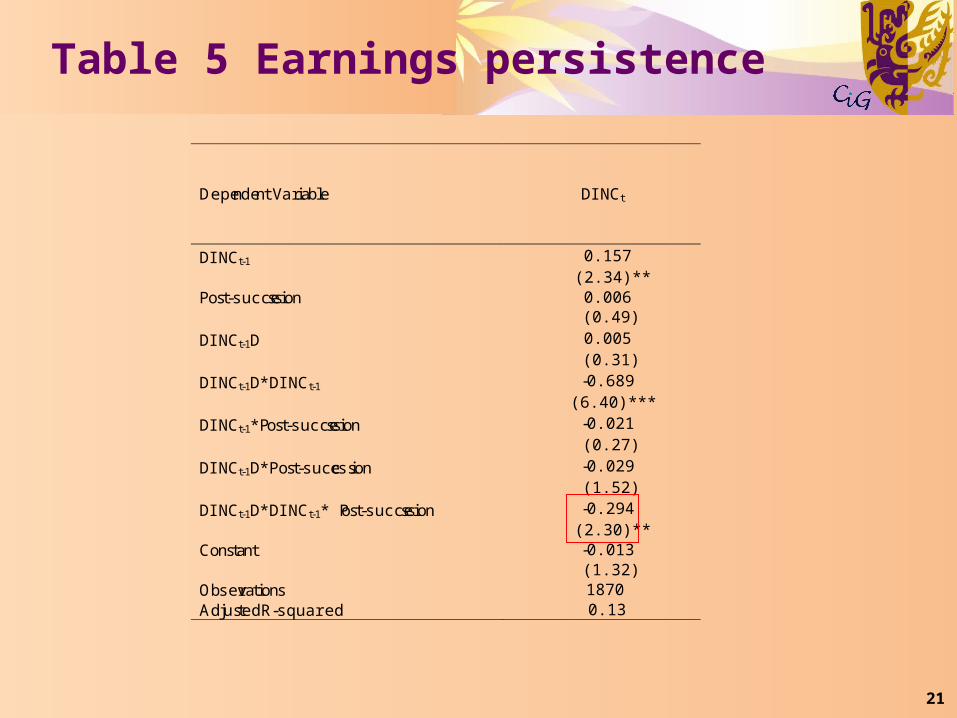
Table 5 Earnings persistence
Dependent Var iable DINCt
DINCt-1 0.157 (2.34)** Post-succession 0.006 (0.49)
DINCt-1D 0.005 (0.31)
DINCt-1D*DINCt-1 -0.689 (6.40)***
DINCt-1*Post-succession -0.021 (0.27)
DINCt-1D*Post-succession -0.029 (1.52)
DINCt-1D*DINCt-1* Post-succession -0.294 (2.30)** Constant -0.013 (1.32) Observations 1870 Adjusted R-squared 0.13

22
Family/Founder control and accounting quality
Question 2: Family/founder control is associated bigger change in Discretionary Accruals and TLR before and after succession

23
Proxies for Family/Founder Control
Control concentrationFamily ownership concentrationVoting and control rights divergence
Board control prior to successionFamily % control of boardFounder as predecessor
Family control after successionDeparting chairmen remains in managementHeir successor
Regulated and amenity industries (asset specificity)
24
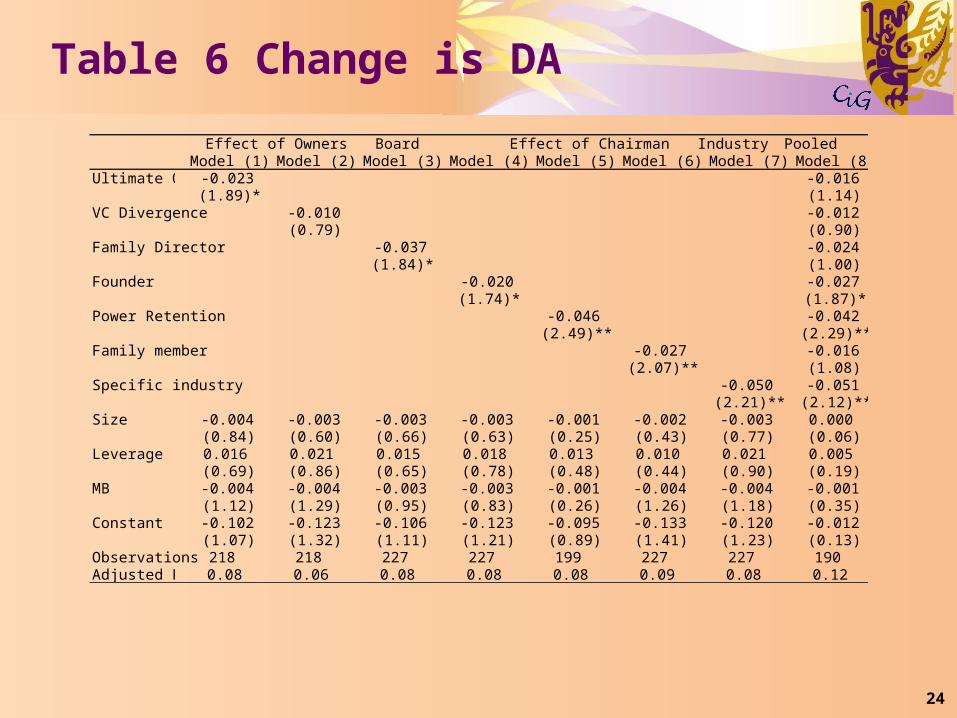
Table 6 Change is DA
Board Industry PooledModel (1) Model (2) Model (3) Model (4) Model (5) Model (6) Model (7) Model (8)
Ultimate Ownership-0.023 -0.016(1.89)* (1.14)
VC Divergence -0.010 -0.012(0.79) (0.90)
Family Director -0.037 -0.024(1.84)* (1.00)
Founder -0.020 -0.027(1.74)* (1.87)*
Power Retention -0.046 -0.042(2.49)** (2.29)**
Family member -0.027 -0.016(2.07)** (1.08)
Specific industry -0.050 -0.051(2.21)** (2.12)**
Size -0.004 -0.003 -0.003 -0.003 -0.001 -0.002 -0.003 0.000(0.84) (0.60) (0.66) (0.63) (0.25) (0.43) (0.77) (0.06)
Leverage 0.016 0.021 0.015 0.018 0.013 0.010 0.021 0.005(0.69) (0.86) (0.65) (0.78) (0.48) (0.44) (0.90) (0.19)
MB -0.004 -0.004 -0.003 -0.003 -0.001 -0.004 -0.004 -0.001(1.12) (1.29) (0.95) (0.83) (0.26) (1.26) (1.18) (0.35)
Constant -0.102 -0.123 -0.106 -0.123 -0.095 -0.133 -0.120 -0.012(1.07) (1.32) (1.11) (1.21) (0.89) (1.41) (1.23) (0.13)
Observations 218 218 227 227 199 227 227 190Adjusted R-squared0.08 0.06 0.08 0.08 0.08 0.09 0.08 0.12
Effect of Ownershp Effect of Chairman
25
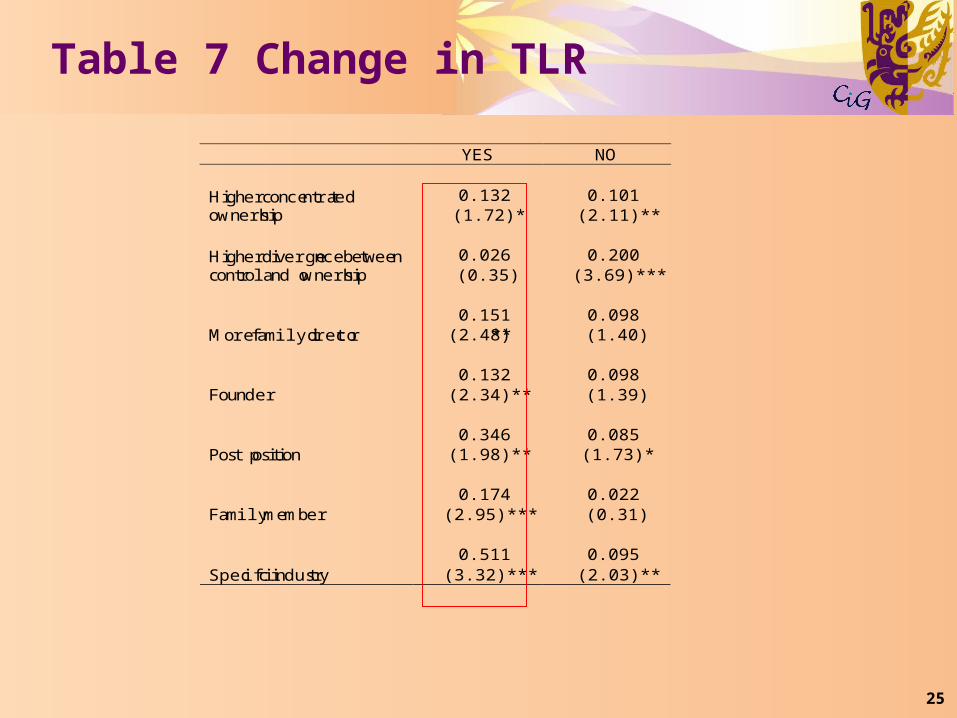
Table 7 Change in TLR
YES NO
0.132 0.101 Higher concentrated ownership (1.72)* (2.11)**
0.026 0.200 Higher divergence between control and ownership (0.35) (3.69)***
0.151 0.098 More family director (2.48)** (1.40)
0.132 0.098 Founder (2.34)** (1.39)
0.346 0.085 Post position (1.98)** (1.73)*
0.174 0.022 Family member (2.95)*** (0.31)
0.511 0.095 Specific industry (3.32)*** (2.03)**

26
Asset specificity and accounting quality
TLR and Discretionary Accruals prior to succession
27
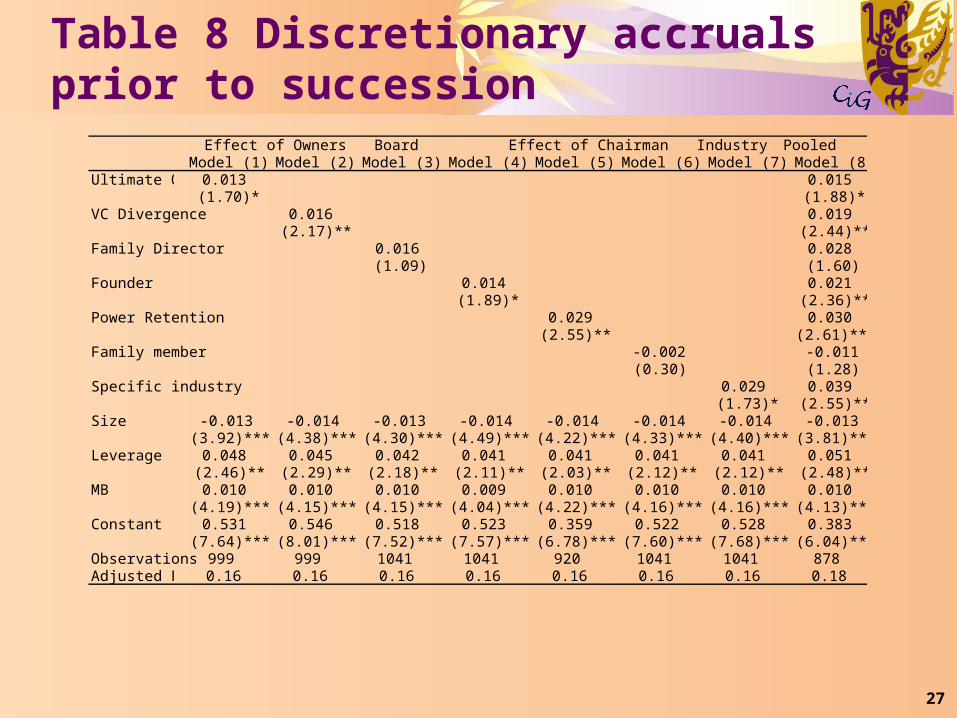
Table 8 Discretionary accruals prior to succession
Board Industry PooledModel (1) Model (2) Model (3) Model (4) Model (5) Model (6) Model (7) Model (8)
Ultimate Ownership0.013 0.015(1.70)* (1.88)*
VC Divergence 0.016 0.019(2.17)** (2.44)**
Family Director 0.016 0.028(1.09) (1.60)
Founder 0.014 0.021(1.89)* (2.36)**
Power Retention 0.029 0.030(2.55)** (2.61)***
Family member -0.002 -0.011(0.30) (1.28)
Specific industry 0.029 0.039(1.73)* (2.55)**
Size -0.013 -0.014 -0.013 -0.014 -0.014 -0.014 -0.014 -0.013(3.92)*** (4.38)*** (4.30)*** (4.49)*** (4.22)*** (4.33)*** (4.40)*** (3.81)***
Leverage 0.048 0.045 0.042 0.041 0.041 0.041 0.041 0.051(2.46)** (2.29)** (2.18)** (2.11)** (2.03)** (2.12)** (2.12)** (2.48)**
MB 0.010 0.010 0.010 0.009 0.010 0.010 0.010 0.010(4.19)*** (4.15)*** (4.15)*** (4.04)*** (4.22)*** (4.16)*** (4.16)*** (4.13)***
Constant 0.531 0.546 0.518 0.523 0.359 0.522 0.528 0.383(7.64)*** (8.01)*** (7.52)*** (7.57)*** (6.78)*** (7.60)*** (7.68)*** (6.04)***
Observations 999 999 1041 1041 920 1041 1041 878Adjusted R-squared0.16 0.16 0.16 0.16 0.16 0.16 0.16 0.18
Effect of Ownershp Effect of Chairman

28
Table 9 TLR prior to succession
Co-efficient Stratification criteria (Absolute T value)
(1.33) Higher concentrated ownership 0.059
0.131 Higher divergence between
control and ownership (2.20)**
-0.237 More family director (3.95)***
-0.120 Founder (1.82)*
-0.050 Post position (0.48)
-0.192 Family member
(3.10)***
-0.210 Specific industry (1.23)

29
Need further analysis
Entrenchment? Predecessor holding on to power, thus opaque accounting.Low accounting quality prior to succession. No
difference after succession.Passing control to heir successor or chairman hangs
on to power, there is improvement in accounting but mainly due to poorer accounting prior to succession and not superior accounting after succession.
However, no significant drop in earnings prior to succession. Also there is no earnings management or shifting.
30
Further analysis
Asset specificity There is significant drop in stock returns but no significant drop in
earnings We don’t find significantly positive discretionary accruals prior to
succession (earnings management to sustain positive earnings) There is also lower TLR prior to succession, and the TLR is lower for
firms with more family and/or founder control prior to succession and those that pass the control to an heir.
What explains the drop in share value? Specific assets are more like unrecognized goodwill. Their impairment
will be reflected in the share value but not in earnings. At the succession, there is a dissipation in value of the specific assets,
which is reflected in the negative stock returns but there is little drop in short term earnings.
31
Conclusion
Succession affects accounting qualityFamily control and asset specificity
measures matter. Need to know more about
combination of asset specificity, way of transfer of control and accounting properties

32
Future Directions
Entrepreneurial firms are becoming important in China
China now has about 300 firms ultimately controlled by an non-state entity
These firms, when cross-listed in HK, have many accounting scandals. Why?
What shapes their governance structure and financial reporting incentives?
How can their governance and accounting be improved in the future?