journal experimental evaluation of seismic performance
DESCRIPTION
Journal Experimental Evaluation of Seismic Performance..TRANSCRIPT
This article was downloaded by: [UQ Library]On: 25 August 2015, At: 15:38Publisher: Taylor & FrancisInforma Ltd Registered in England and Wales Registered Number: 1072954 Registeredoffice: 5 Howick Place, London, SW1P 1WG
Click for updates
Journal of Earthquake EngineeringPublication details, including instructions for authors andsubscription information:http://www.tandfonline.com/loi/ueqe20
Experimental Evaluation of SeismicPerformance of Squat RC Structural Wallswith Limited Ductility Reinforcing DetailsBing Lia, Zuanfeng Panb & Weizheng Xiangc
a School of Civil and Environment Engineering, NanyangTechnological University, Singaporeb College of Civil Engineering at Tongji University, Shanghai, Chinac DNV consultants, SingaporePublished online: 13 Jan 2015.
To cite this article: Bing Li, Zuanfeng Pan & Weizheng Xiang (2015) Experimental Evaluation ofSeismic Performance of Squat RC Structural Walls with Limited Ductility Reinforcing Details, Journalof Earthquake Engineering, 19:2, 313-331, DOI: 10.1080/13632469.2014.962669
To link to this article: http://dx.doi.org/10.1080/13632469.2014.962669
PLEASE SCROLL DOWN FOR ARTICLE
Taylor & Francis makes every effort to ensure the accuracy of all the information (the“Content”) contained in the publications on our platform. However, Taylor & Francis,our agents, and our licensors make no representations or warranties whatsoever as tothe accuracy, completeness, or suitability for any purpose of the Content. Any opinionsand views expressed in this publication are the opinions and views of the authors,and are not the views of or endorsed by Taylor & Francis. The accuracy of the Contentshould not be relied upon and should be independently verified with primary sourcesof information. Taylor and Francis shall not be liable for any losses, actions, claims,proceedings, demands, costs, expenses, damages, and other liabilities whatsoever orhowsoever caused arising directly or indirectly in connection with, in relation to or arisingout of the use of the Content.
This article may be used for research, teaching, and private study purposes. Anysubstantial or systematic reproduction, redistribution, reselling, loan, sub-licensing,systematic supply, or distribution in any form to anyone is expressly forbidden. Terms &

Conditions of access and use can be found at http://www.tandfonline.com/page/terms-and-conditions
Dow
nloa
ded
by [
UQ
Lib
rary
] at
15:
38 2
5 A
ugus
t 201
5

Journal of Earthquake Engineering, 19:313–331, 2015Copyright © A. S. ElnashaiISSN: 1363-2469 print / 1559-808X onlineDOI: 10.1080/13632469.2014.962669
Experimental Evaluation of Seismic Performanceof Squat RC Structural Walls with Limited Ductility
Reinforcing Details
BING LI 1 , ZUANFENG PAN 2, and WEIZHENG XIANG 3
1School of Civil and Environment Engineering, Nanyang TechnologicalUniversity, Singapore2College of Civil Engineering at Tongji University, Shanghai, China3DNV consultants, Singapore
This article describes an experimental study carried out on of reinforced concrete (RC) walls of lessconfining reinforcement than that recommended by ACI 318. A total of eight RC walls with boundaryelements comprising of five walls with aspect ratio of 1.125 and three walls with aspect ratio of1.625 were tested by subjecting them to low levels of axial compression loading and simulated seismicloading, to examine the structural performance of the walls with limited transverse reinforcement.Conclusions are reached concerning the failure mode, drift capacity, strength capacity, componentsof top deformation, and energy dissipation characteristics of walls on the seismic behavior withlimited transverse reinforcement. The influences of axial loading, transverse reinforcement in the wallboundary elements, and the presence of construction joints at the wall base on the seismic behaviorof walls are also studied in this paper. Lastly, reasonable strut-and-tie models are developed to helpin understanding the force transfer mechanism in the walls tested.
Keywords Structural Walls; Limited Transverse Reinforcement; Construction Joint; SeismicPerformance; Deformation Capacity; Strength Capacity; Strut-and-Tie Model
1. Introduction
Reinforced Concrete (RC) structural walls used in buildings are designed primarily toresist lateral loads imposed by wind and earthquakes. In recent years, extensive research[Wallace, 1985; Wallace and Thomsen, 1985; Maier and Thurlimann, 1985; Wood, 1990;Lefas et al., 1990; Salonikios et al., 1999, 2000; Massone et al., 2009; Preti and Giuriani,2011] was conducted to assess the validity of the current design provisions [ACI, 2008;NZS, 1995] for cyclic shear in squat RC walls. These walls are usually detailed accordingto the current provisions and are aimed at achieving full ductile behavior of structural walls.Presently, various countries have recommendations for confining reinforcement to ensurethat the required ductility demands can be met. These consider many factors including theamount of confining reinforcement, the limitation of stirrup spacing, and the length of con-fined potential plastic hinge regions. However, in low seismicity regions such as Singapore,Hong Kong. and the east coast of the United States of America, the ductility demands maynot be the same as that of higher seismicity zones. In such situations, a lower ductilitydemand can be expected and therefore the required quantities of reinforcements, especially
Received 4 November 2013; accepted 17 August 2014.Address correspondence to Bing Li, School of Civil and Envivonmental Engineering, Nanyang
Technological University, Singapore 639798 China. E-mail: [email protected] versions of one or more of the figures in the article can be found online at www.tandfonline.com/ueqe.
313
Dow
nloa
ded
by [
UQ
Lib
rary
] at
15:
38 2
5 A
ugus
t 201
5

314 B. Li, Z. Pan, and W. Xiang
the transverse reinforcement in the web and boundary elements, can be ostensibly reduced.In this study, the seismic performance of eight squat RC walls with boundary barbells,which contains less confining reinforcement than that recommended by ACI [2008], areexamined. Moreover, many wall structures possess a considerable amount of inherent lat-eral strength before the capacity design procedures are introduced, which is in excess ofthat predicted for fully ductile systems. In practice, these types of walls should not be con-sidered dangerous during earthquakes as long as their shear strength remains greater thanthat needed for a fully ductile structure and energy dissipation is considered to be accept-able. As such, the potential strength of structural walls is in excess of that required whenconsidering a fully ductile response to the design for earthquakes. Thus, it is important toidentify the strength capacity, drift capacity, and energy dissipation capacity of this type ofwalls when its elastic limit is displaced. Currently, although several experimental investi-gations [Mestyanek, 1986; Oh et al., 2002] have been conducted into the behavior of squatRC walls with limited transverse reinforcement under simulated seismic loading, there isstill insufficient information regarding the available drift capacities of walls with axial com-pression. Moreover, currently available experimental data related to the behavior of squatRC walls with weak interface like construction joints is rather inconclusive. This studyis hence motivated by the need to better understand the seismic behavior of such walls.Conclusions are reached concerning the failure mode, the displacement capacity, strengthcapacity, components of top deformation, and the energy dissipation characteristics shownby the seismic behavior of walls with limited transverse reinforcement. The influences ofaxial compression, transverse reinforcements in the wall boundary elements, and the pres-ence of construction joints at the wall base on the seismic behavior of walls are also studied.Finally, reasonable strut-and-tie models are developed to help in understanding the forcetransfer mechanism in the walls tested.
2. Experimental Program
2.1 Wall Details
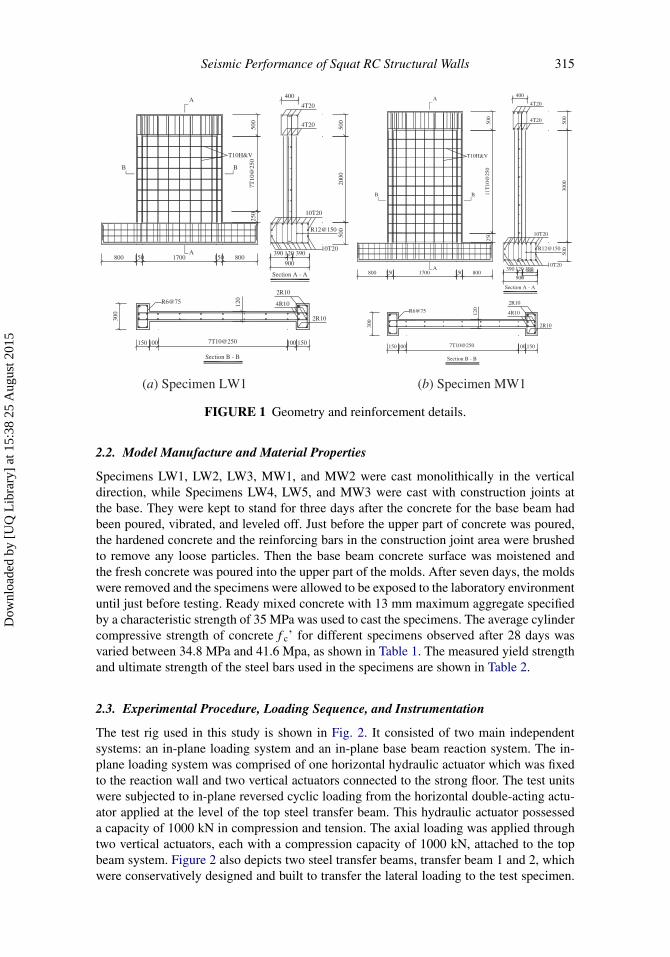
A total of eight specimens, referred to as Specimens LW1∼LW5 (low aspect ratio walls)and Specimens MW1∼MW3 (medium aspect ratio walls), were tested as isolated can-tilever walls in the program. The low aspect ratio walls (h/lw = 1.125) were 2000 mmwide × 2500 mm high × 120 mm thickness, while the medium aspect ratio walls (h/lw =1.625) were 2000 mm wide × 3500 mm high × 120 mm thickness. h is the vertical dis-tance between the lateral loading point and the wall base, and lw is the horizontal lengthof the wall. The overall dimensions and reinforcement details of the controlled SpecimensLW1 and MW1 are shown in Fig. 1. All specimens had the same web reinforcements, con-sisting of two curtains (orthogonal grids) of 10mm diameter high yield steel bars spacedat 250 mm This gives a reinforcement ratio of 0.50%. The 150 mm × 300 mm boundaryelements were reinforced with eight mild steel bars of 10mm diameter, giving a reinforcingratio of 1.40%. In Specimens LW1, LW2, LW4, LW5, MW1, and MW3, confinement inthe boundary elements was provided by 6mm diameter closed stirrups spaced at 75 mm,while the vertical spacing of the hoops in the boundary elements of Specimens LW3 andMW2 was 200 mm. The corresponding volumetric ratio of transverse reinforcement ρbt
of each specimen was listed in Table 1. Take Specimen LW5 for example, the trans-verse confining reinforcement for boundary elements of special structural walls requiredby ACI [2008] is 2.46%, while ρbt of Specimen LW5 is 0.97% corresponding to 40% ofthe transverse confining reinforcement required by the ACI code.
Dow
nloa
ded
by [
UQ
Lib
rary
] at
15:
38 2
5 A
ugus
t 201
5
Seismic Performance of Squat RC Structural Walls 315
Section B - B
800 150 1700 150 800
150
390 120
900
250
7T10
@25
050
0
2000
100 1007T10@250
2R10
4R10R6@75
300
T10H&V
Section A - A
500
A
A
B B
150
2R10
390
10T20
10T20
500R12@150
120
4T20
4T20
400
150 100 1007T10@250
2R10
4R10R6@75
300
150
2R10
120
Section B - B
800 150 1700 150 800390 120 390
900
250
11T
10@
250
500
3000
T10H&V
Section A - A
500
A
A
B B
390
10T20
10T20
500R12@150
4T20
4T20
400
(a) Specimen LW1 (b) Specimen MW1
FIGURE 1 Geometry and reinforcement details.
2.2. Model Manufacture and Material Properties
Specimens LW1, LW2, LW3, MW1, and MW2 were cast monolithically in the verticaldirection, while Specimens LW4, LW5, and MW3 were cast with construction joints atthe base. They were kept to stand for three days after the concrete for the base beam hadbeen poured, vibrated, and leveled off. Just before the upper part of concrete was poured,the hardened concrete and the reinforcing bars in the construction joint area were brushedto remove any loose particles. Then the base beam concrete surface was moistened andthe fresh concrete was poured into the upper part of the molds. After seven days, the moldswere removed and the specimens were allowed to be exposed to the laboratory environmentuntil just before testing. Ready mixed concrete with 13 mm maximum aggregate specifiedby a characteristic strength of 35 MPa was used to cast the specimens. The average cylindercompressive strength of concrete f c’ for different specimens observed after 28 days wasvaried between 34.8 MPa and 41.6 Mpa, as shown in Table 1. The measured yield strengthand ultimate strength of the steel bars used in the specimens are shown in Table 2.
2.3. Experimental Procedure, Loading Sequence, and Instrumentation
The test rig used in this study is shown in Fig. 2. It consisted of two main independentsystems: an in-plane loading system and an in-plane base beam reaction system. The in-plane loading system was comprised of one horizontal hydraulic actuator which was fixedto the reaction wall and two vertical actuators connected to the strong floor. The test unitswere subjected to in-plane reversed cyclic loading from the horizontal double-acting actu-ator applied at the level of the top steel transfer beam. This hydraulic actuator possesseda capacity of 1000 kN in compression and tension. The axial loading was applied throughtwo vertical actuators, each with a compression capacity of 1000 kN, attached to the topbeam system. Figure 2 also depicts two steel transfer beams, transfer beam 1 and 2, whichwere conservatively designed and built to transfer the lateral loading to the test specimen.
Dow
nloa
ded
by [
UQ
Lib
rary
] at
15:
38 2
5 A
ugus
t 201
5
TA
BL
E1
Exp
erim
enta
lpar
amet
ers
and
prin
cipa
lres
ults
ofw
alls
test
ed
Rei
nfor
cem
entr
atio
(%)
Hor
izon
tall
oadi
ngle
vel(
kN)
Spec
imen
f c′
(MPa
)h l w
ρt
ρv
ρbf
ρbt
P
f c′ A
g
Ki
(kN
/m
m)
Loa
ddi
rect
ion
“+”
(“-”
)V
1V
2V
3V
u
ν√
f c′
(MPa
)D
F(%
)μ
max
VA
CI
(kN
)V
i
(kN
)V
st
(kN
)V
u
Vst
LW1
40.2
1.12
50.
500.
501.
400.
970
60.6
(58.
4)21
0.0
268.
830
1.0
361.
00.
237
1.0
4.3
724.
332
137
9.5
0.95
LW2
41.6
1.12
50.
500.
501.
400.
970.
0584
.7(7
5.7)
275.
048
1.5
400.
057
9.9
0.37
51.
354.
986
6.3
500
566.
01.
02LW
334
.81.
125
0.50
0.50
1.40
0.37
0.05
73.5
(83.
3)27
0.4
387.
640
2.3
523.
80.
370
0.67
2.4
866.
350
056
6.0
0.93
LW4
39.8
1.12
50.
500.
501.
400.
970
58.4
(53.
5)20
3.5
268.
830
0.6
365.
10.
241
1.0
4.0
724.
332
137
9.5
0.96
LW5
35.6
1.12
50.
500.
501.
400.
970.
0576
.9(8
3.3)
310.
437
6.3
387.
052
0.0
0.36
31.
03.
486
6.3
500
566.
00.
92M
W1
41.2
1.62
50.
500.
501.
400.
970.
0541
.2(3
9.5)
301.
031
0.5
375.
042
4.6
0.27
61.
03.
570
337
543
0.0
0.99
MW
239
.61.
625
0.50
0.50
1.40
0.37
0.05
41.7
(41.
2)29
4.1
291.
634
0.0
410.
20.
272
1.0
3.6
703
375
430.
00.
95M
W3
40.3
1.62
50.
500.
501.
400.
970.
0537
.5(3
8.3)
291.
229
5.3
322.
041
0.3
0.26
91.
34.
270
337
543
0.0
0.95
Not
e:ρ
t=
hori
zont
alw
ebre
info
rcem
ent
ratio
;ρ
v=
vert
ical
web
rein
forc
emen
tra
tio;ρ
bf=
flexu
ral
rein
forc
emen
tra
tioin
boun
dary
elem
ent;
ρbt
=vo
lum
etri
cra
tioof
tran
sver
sere
info
rcem
enti
nbo
unda
ryel
emen
t;P
=ap
plie
dax
iall
oadi
ng;A
g=
gros
sar
eaof
sect
ion;
Ki=
initi
alst
iffn
ess;
V1=
hori
zont
allo
adin
gle
vela
tini
tiatio
nof
flexu
ral
crac
king
;V
2=
hori
zont
allo
adin
gle
vel
atin
itiat
ion
ofin
clin
edcr
acki
ng;
V3
=ho
rizo
ntal
load
ing
leve
lat
first
-yie
ldof
tens
ion;
Vu
=ul
timat
est
reng
th;ν
=ul
timat
esh
ear
stre
ss;
DF
=dr
ift
ratio
;μ
max
=m
axim
umdi
spla
cem
ent
duct
ility
leve
l;V
AC
I=
shea
rst
reng
thca
lcul
ated
usin
gth
em
etho
din
AC
I31
8-08
;V
i=
the
max
imum
idea
lfle
xura
lst
reng
th;V
st=
the
ultim
ate
shea
rfo
rce
calc
ulat
edby
the
prop
osed
stru
t-an
d-tie
mod
el.
316
Dow
nloa
ded
by [
UQ
Lib
rary
] at
15:
38 2
5 A
ugus
t 201
5

Seismic Performance of Squat RC Structural Walls 317
TABLE 2 Properties of steel bars
Type f y(MPa) f ul(Mpa)
T10 427 497T20 519 613R6 261 324R10 308 385
FIGURE 2 Elevation of test-rig assembly.
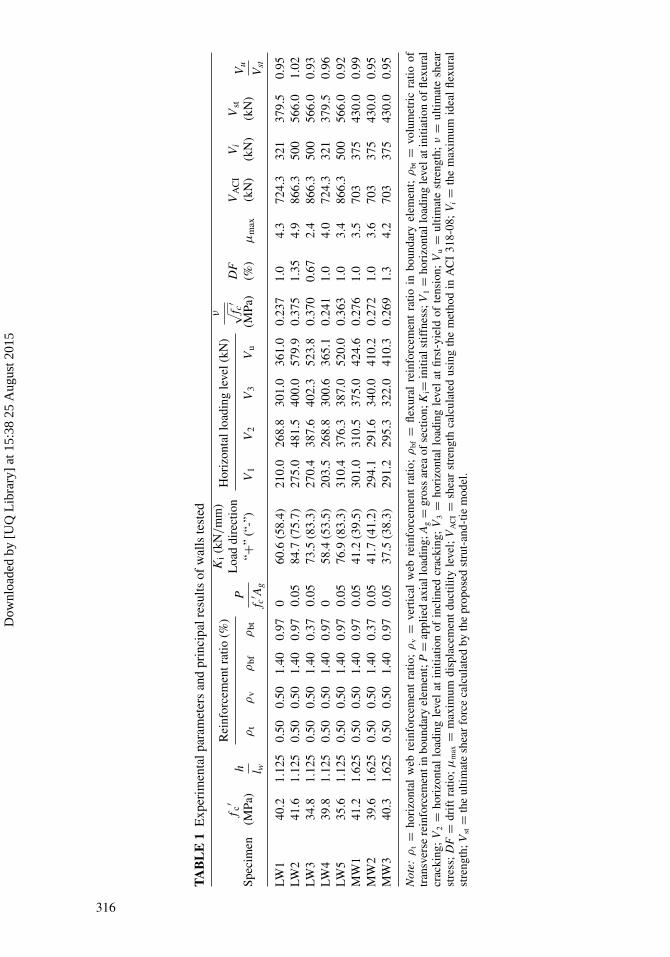
Two levels of constant axial load were adopted in the testing program. They correspondedto 0 and 0.05f c’Ag which were considered representative of the amount of axial load at thebase of the wall of a single-story and a low-rise building, respectively. After the total con-stant vertical axial force was applied, the horizontal loading would be introduced throughthe top steel beam of the specimens. The base beam of the specimens was anchored to thelaboratory floor with 12 high strength rods that prevent uplifting of the specimens and hor-izontal sliding of the units along the floor during the application of the horizontal loading.Every high strength rod was pre-stressed to efficiently restrain the rotation and sliding ofthe specimen during the test. During the experimental, laser point machines were employedto ensure that the center lines of the three actuators and the specimen tested are in the samevertical plane. This is to avoid out-of-plane buckling of walls during testing. The loadingprocedure consisting of displacement-controlled steps is illustrated in Fig. 3. The speci-men was subjected to two cycles at each displacement level except that only one cycle wasapplied to the specimen at a drift ratio of 1/2000. The test specimens had been extensivelyinstrumented with measuring devices internally and externally. Shear and flexural defor-mation was recorded based on the reading of a number of LVDT sets located throughoutthe height of the specimens [Xiang, 2007]. Strain gauges were mounted to capture strainson both longitudinal and transverse reinforcements at critical locations.
3. Experimental Results
3.1. Crack Patterns and Failure Modes
Table 1 illustrates the main results of the tests, including the load levels corresponding tothe initiation of flexural cracking, initiation of inclined cracking, first yield of the tensile
Dow
nloa
ded
by [
UQ
Lib
rary
] at
15:
38 2
5 A
ugus
t 201
5
318 B. Li, Z. Pan, and W. Xiang
0 2 4 6 8 10 12 14 16 18–50
–40
–30
–20
–10
0
10
20
30
40
50
θ = 1/1000
θ = 1/600
θ = 1/400
θ = 1/300
θ = 1/200
θ = 1/150
θ = 1/100
θ = 1/75
Dis
plac
emen
t (m
m)
Cycle Number
For LW Series of Specimens
For MW Series of Specimens
θ = 1/2000
FIGURE 3 Applied loading history.
(a) LW2 (DF = 1.35%) (b) LW3 (DF = 0.67%) (c) LW4 (DF = 1.0%) (d) LW5 (DF = 1.0%)
(e) MW1 (DF = 1.0%) (f) MW3 (DF = 1.3%)
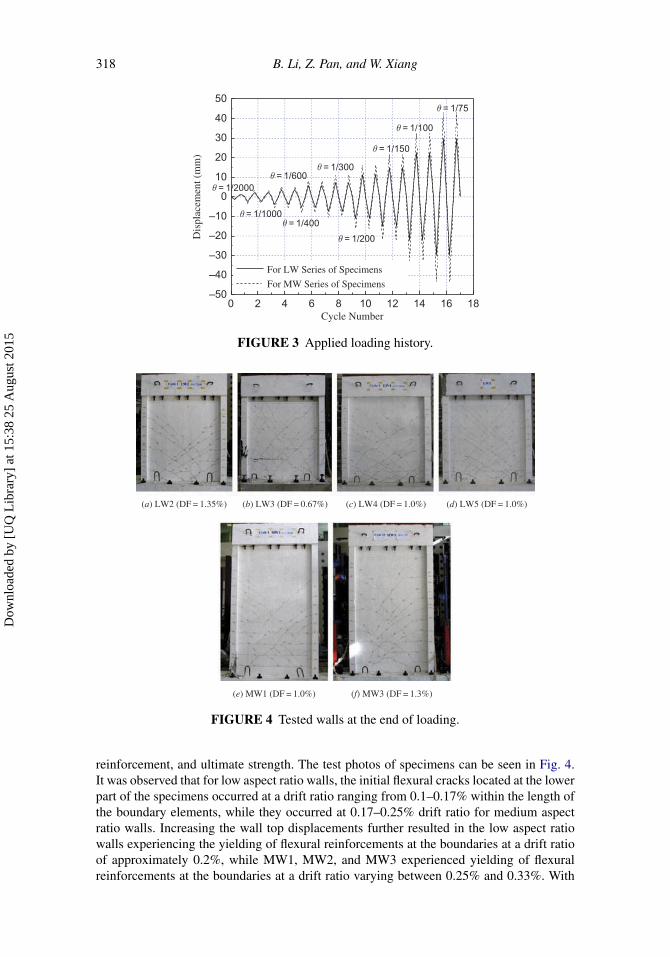
FIGURE 4 Tested walls at the end of loading.
reinforcement, and ultimate strength. The test photos of specimens can be seen in Fig. 4.It was observed that for low aspect ratio walls, the initial flexural cracks located at the lowerpart of the specimens occurred at a drift ratio ranging from 0.1–0.17% within the length ofthe boundary elements, while they occurred at 0.17–0.25% drift ratio for medium aspectratio walls. Increasing the wall top displacements further resulted in the low aspect ratiowalls experiencing the yielding of flexural reinforcements at the boundaries at a drift ratioof approximately 0.2%, while MW1, MW2, and MW3 experienced yielding of flexuralreinforcements at the boundaries at a drift ratio varying between 0.25% and 0.33%. With
Dow
nloa
ded
by [
UQ
Lib
rary
] at
15:
38 2
5 A
ugus
t 201
5
Seismic Performance of Squat RC Structural Walls 319
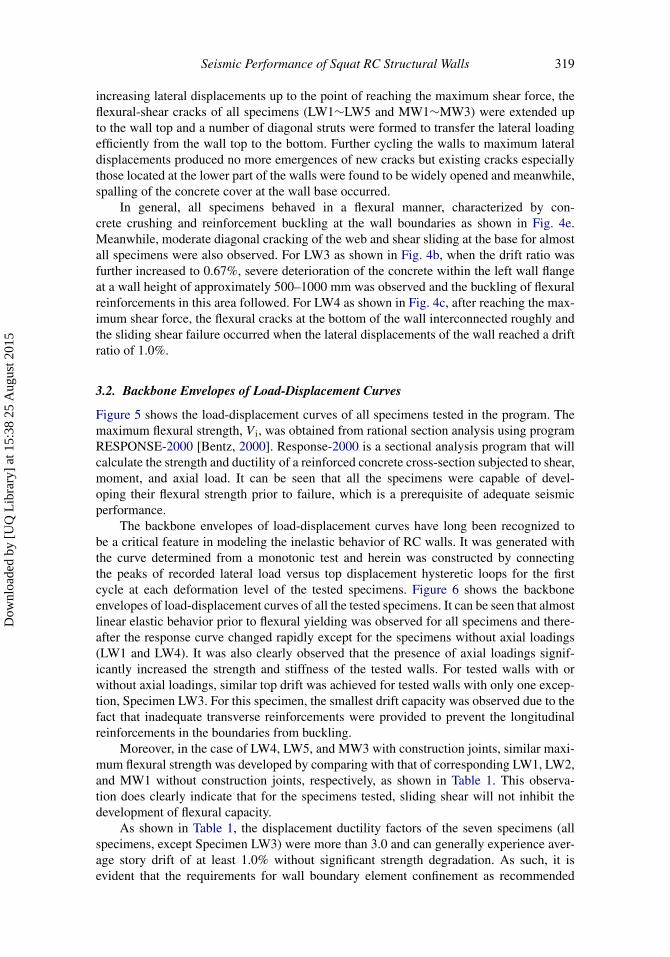
increasing lateral displacements up to the point of reaching the maximum shear force, theflexural-shear cracks of all specimens (LW1∼LW5 and MW1∼MW3) were extended upto the wall top and a number of diagonal struts were formed to transfer the lateral loadingefficiently from the wall top to the bottom. Further cycling the walls to maximum lateraldisplacements produced no more emergences of new cracks but existing cracks especiallythose located at the lower part of the walls were found to be widely opened and meanwhile,spalling of the concrete cover at the wall base occurred.
In general, all specimens behaved in a flexural manner, characterized by con-crete crushing and reinforcement buckling at the wall boundaries as shown in Fig. 4e.Meanwhile, moderate diagonal cracking of the web and shear sliding at the base for almostall specimens were also observed. For LW3 as shown in Fig. 4b, when the drift ratio wasfurther increased to 0.67%, severe deterioration of the concrete within the left wall flangeat a wall height of approximately 500–1000 mm was observed and the buckling of flexuralreinforcements in this area followed. For LW4 as shown in Fig. 4c, after reaching the max-imum shear force, the flexural cracks at the bottom of the wall interconnected roughly andthe sliding shear failure occurred when the lateral displacements of the wall reached a driftratio of 1.0%.
3.2. Backbone Envelopes of Load-Displacement Curves
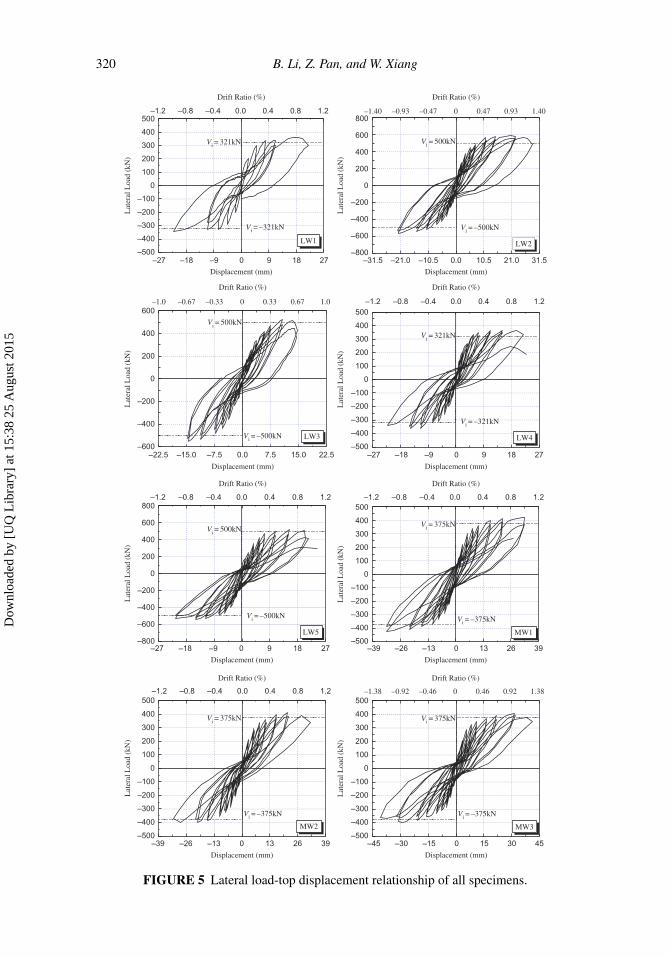
Figure 5 shows the load-displacement curves of all specimens tested in the program. Themaximum flexural strength, V i, was obtained from rational section analysis using programRESPONSE-2000 [Bentz, 2000]. Response-2000 is a sectional analysis program that willcalculate the strength and ductility of a reinforced concrete cross-section subjected to shear,moment, and axial load. It can be seen that all the specimens were capable of devel-oping their flexural strength prior to failure, which is a prerequisite of adequate seismicperformance.
The backbone envelopes of load-displacement curves have long been recognized tobe a critical feature in modeling the inelastic behavior of RC walls. It was generated withthe curve determined from a monotonic test and herein was constructed by connectingthe peaks of recorded lateral load versus top displacement hysteretic loops for the firstcycle at each deformation level of the tested specimens. Figure 6 shows the backboneenvelopes of load-displacement curves of all the tested specimens. It can be seen that almostlinear elastic behavior prior to flexural yielding was observed for all specimens and there-after the response curve changed rapidly except for the specimens without axial loadings(LW1 and LW4). It was also clearly observed that the presence of axial loadings signif-icantly increased the strength and stiffness of the tested walls. For tested walls with orwithout axial loadings, similar top drift was achieved for tested walls with only one excep-tion, Specimen LW3. For this specimen, the smallest drift capacity was observed due to thefact that inadequate transverse reinforcements were provided to prevent the longitudinalreinforcements in the boundaries from buckling.
Moreover, in the case of LW4, LW5, and MW3 with construction joints, similar maxi-mum flexural strength was developed by comparing with that of corresponding LW1, LW2,and MW1 without construction joints, respectively, as shown in Table 1. This observa-tion does clearly indicate that for the specimens tested, sliding shear will not inhibit thedevelopment of flexural capacity.
As shown in Table 1, the displacement ductility factors of the seven specimens (allspecimens, except Specimen LW3) were more than 3.0 and can generally experience aver-age story drift of at least 1.0% without significant strength degradation. As such, it isevident that the requirements for wall boundary element confinement as recommended
Dow
nloa
ded
by [
UQ
Lib
rary
] at
15:
38 2
5 A
ugus
t 201
5
320 B. Li, Z. Pan, and W. Xiang
–27 –18 –9 0 9 18 27–500
–400
–300
–200
–100
0
100
200
300
400
500–1.2 –0.8 –0.4 0.0 0.4 0.8 1.2
Drift Ratio (%)
Vi = 321kN
Lat
eral
Loa
d (k
N)
Displacement (mm)
Vi = –321kN
LW1
–31.5 –21.0 –10.5 0.0 10.5 21.0 31.5–800
–600
–400
–200
0
200
400
600
800
Drift Ratio (%)
Vi = 500kN
Lat
eral
Loa
d (k
N)
Displacement (mm)
Vi = –500kN
LW2
0–1.40 –0.93 –0.47 0.47 0.93 1.40
–22.5 –15.0 –7.5 0.0 7.5 15.0 22.5–600
–400
–200
0
200
400
600
Drift Ratio (%)
Vi = 500kN
Lat
eral
Loa
d (k
N)
Displacement (mm)
Vi = –500kN LW3
–1.0 –0.67 –0.33 0 0.33 0.67 1.0
–27 –18 –9 0 9 18 27–500
–400
–300
–200
–100
0
100
200
300
400
500–1.2 –0.8 –0.4 0.0 0.4 0.8 1.2
Drift Ratio (%)
Vi = 321kNL
ater
al L
oad
(kN
)
Displacement (mm)
Vi = –321kN
LW4
–27 –18 –9 0 9 18 27–800
–600
–400
–200
0
200
400
600
800–1.2 –0.8 –0.4 0.0 0.4 0.8 1.2
Drift Ratio (%)
Vi = 500kN
Lat
eral
Loa
d (k
N)
Displacement (mm)
Vi = –500kN
LW5
–39 –26 –13 0 13 26 39–500
–400
–300
–200
–100
0
100
200
300
400
500–1.2 –0.8 –0.4 0.0 0.4 0.8 1.2
Drift Ratio (%)
Vi = 375kN
Lat
eral
Loa
d (k
N)
Displacement (mm)
Vi = –375kN
MW1
–39 –26 –13 0 13 26 39–500
–400
–300
–200
–100
0
100
200
300
400
500–1.2 –0.8 –0.4 0.0 0.4 0.8 1.2
Drift Ratio (%)
Vi = 375kN
Lat
eral
Loa
d (k
N)
Displacement (mm)
Vi = –375kN
MW2
–45 –30 –15 0 15 30 45–500
–400
–300
–200
–100
0
100
200
300
400
500
Drift Ratio (%)
Vi = 375kN
Lat
eral
Loa
d (k
N)
Displacement (mm)
Vi = –375kN
MW3
1.380.920.460–0.46–0.92–1.38
FIGURE 5 Lateral load-top displacement relationship of all specimens.
Dow
nloa
ded
by [
UQ
Lib
rary
] at
15:
38 2
5 A
ugus
t 201
5

Seismic Performance of Squat RC Structural Walls 321
–31.5 –21.0 –10.5 0.0 10.5 21.0 31.5–800
–600
–400
–200
0
200
400
600
800Sh
ear
Forc
e (k
N)
Lateral Displacement (mm)
LW1LW2LW3LW4LW5
–1.40 –0.93 –0.47 0 0.930.47 1.40
Drift Ratio (%)
–45 –30 –15 0 15 30 45–500
–400
–300
–200
–100
0
100
200
300
400
5001.380.920.460–0.46–0.92
Shea
r Fo
rce
(kN
)
Lateral Displacement (mm)
MW1MW2MW3
–1.38
Drift Ratio (%)
(a) Low aspect ratio walls (b) Medium aspect ratio walls
FIGURE 6 Backbone envelopes of load-displacement curves for all specimens.
by ACI 318 can be relaxed for structural walls to some extent. In contrast, the displace-ment ductility of Specimen LW3 with an aspect ratio of 1.125 and which contained 15% ofthe ACI 318 specified quantity of transverse reinforcement, was 2.4. It’s worth noting thatalthough ρbt of Specimen MW2 is the same as that of LW3, the ductility level of SpecimenMW2 is 3.6 due to the higher aspect ratio, compared with Specimen LW3.
3.3. Components of Top Deformation
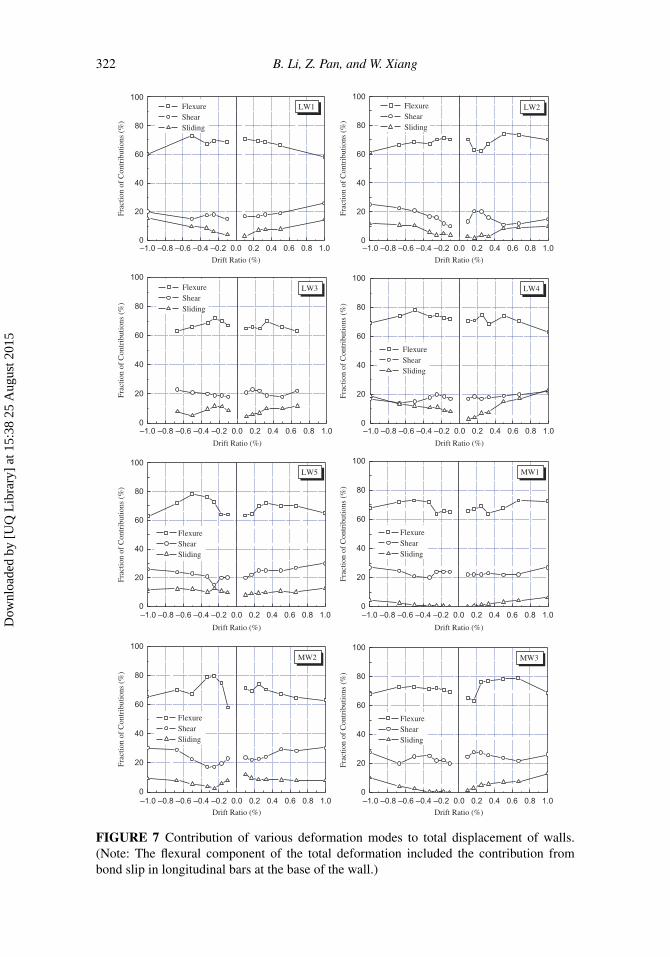
The top deformation of walls in this test was mainly caused by flexural displacement, panelshear displacement, and sliding displacement. The calculation method of the flexural dis-placement, panel shear displacement, and sliding displacement with the readings of LVDTcan be found in Wu [2002]. Note that the flexural component of the total deformationalso included the contribution from bond slip in longitudinal bars at the base of the wall.Figure 7 illustrates the ratios of three displacement components to the total deformationwith respect to wall drift ratios, the relative contribution of three displacement componentsvaried in terms of the wall drift ratios with the observed behavior that with increasing lat-eral displacements up to wall failure, the contribution of flexural deformations decreasedwhile the ratios of the other two components tended to rise slightly. In general, the flexuraldeformations dominated the response because they accounted for more than 60% of thetotal displacement up to the final loading stage for all specimens.
For the reference wall LW1, the sliding shear components initially accounted foraround 5% of the total displacement in both loading directions, but accounted for 15%close to failure. This varied trend was more pronounced for LW4 with construction jointsat the base and without axial loading due to the fact that the sliding components madeup approximately 23% at the final stage and meanwhile, exceeded the contributions fromshear displacements which were generally observed to be higher than the sliding contri-butions in other specimens. However, in the case of the walls subjected to axial loadingincluding LW5 with construction joints at the base, the contribution of sliding shear didnot exceed 13%. This indicated that the axial loading played a favorable role in controllingthe wall sliding deformations as expected. Under axial compression, the presence of theconstruction joints at the wall base had a minor effect with respect to sliding, as only up toapproximately 13% of the total displacement of LW5 was due to this mode compared with10% of that contribution in the comparable LW2 and LW3.
Dow
nloa
ded
by [
UQ
Lib
rary
] at
15:
38 2
5 A
ugus
t 201
5
322 B. Li, Z. Pan, and W. Xiang
–1.0 –0.8 –0.6 –0.4 –0.2 0.0 0.2 0.4 0.6 0.8 1.00
20
40
60
80
100
Drift Ratio (%)
FlexureShearSliding
LW1
–1.0 –0.8 –0.6 –0.4 –0.2 0.0 0.2 0.4 0.6 0.8 1.00
20
40
60
80
100
Drift Ratio (%)
FlexureShearSliding
LW2
–1.0 –0.8 –0.6 –0.4 –0.2 0.0 0.2 0.4 0.6 0.8 1.00
20
40
60
80
100
Drift Ratio (%)
FlexureShearSliding
LW3
–1.0 –0.8 –0.6 –0.4 –0.2 0.0 0.2 0.4 0.6 0.8 1.00
20
40
60
80
100
Drift Ratio (%)
FlexureShearSliding
LW4
–1.0 –0.8 –0.6 –0.4 –0.2 0.0 0.2 0.4 0.6 0.8 1.00
20
40
60
80
100
Drift Ratio (%)
Flexure Shear Sliding
LW5
–1.0 –0.8 –0.6 –0.4 –0.2 0.0 0.2 0.4 0.6 0.8 1.00
20
40
60
80
100
Drift Ratio (%)
Flexure Shear Sliding
MW1
–1.0 –0.8 –0.6 –0.4 –0.2 0.0 0.2 0.4 0.6 0.8 1.00
20
40
60
80
100
Frac
tion
of C
ontr
ibut
ions
(%
)Fr
actio
n of
Con
trib
utio
ns (
%)
Frac
tion
of C
ontr
ibut
ions
(%
)Fr
actio
n of
Con
trib
utio
ns (
%)
Frac
tion
of C
ontr
ibut
ions
(%
)Fr
actio
n of
Con
trib
utio
ns (
%)
Frac
tion
of C
ontr
ibut
ions
(%
)Fr
actio
n of
Con
trib
utio
ns (
%)
Drift Ratio (%)
Flexure Shear Sliding
MW2
–1.0 –0.8 –0.6 –0.4 –0.2 0.0 0.2 0.4 0.6 0.8 1.00
20
40
60
80
100
Drift Ratio (%)
Flexure Shear Sliding
MW3
FIGURE 7 Contribution of various deformation modes to total displacement of walls.(Note: The flexural component of the total deformation included the contribution frombond slip in longitudinal bars at the base of the wall.)
Dow
nloa
ded
by [
UQ
Lib
rary
] at
15:
38 2
5 A
ugus
t 201
5
Seismic Performance of Squat RC Structural Walls 323
As shown in Fig. 7, in contrast with the contributions of various deformation modes forLW3, the flexural displacement contribution of Specimen LW2 tends to be a little greater(73% compared with 62% in the positive loading direction, and 66% compared with 62%in the negative loading direction) at a drift ratio of 0.67% while the shear components oftotal displacements became less at that stage (12% compared with 21% in the positive load-ing direction, and 22% compared with 23% in the negative loading direction). The flexuraldisplacement contribution of Specimen MW1 tends to be a little greater (72% comparedwith 62% in the positive loading direction, and 68% compared with 62% in the negativeloading direction) at ultimate stage of testing than that of Specimen MW2 while the shearcomponents of total displacements for Specimen MW1 becomes slightly less at that stage(26% compared with 30% in the positive loading direction, and 26% compared with 30%in the negative loading direction). This suggested that for LW2 and MW1 with more con-tent of the transverse reinforcements in wall boundaries, the flexural contribution of thetotal deformation became a little greater while the sliding component of both walls wasobserved to be almost the same. Hence, it can be considered that the content of transversereinforcement in the boundary barbells could have an important effect in achieving a moreductile hysteretic response.
3.4. Stiffness Characteristics
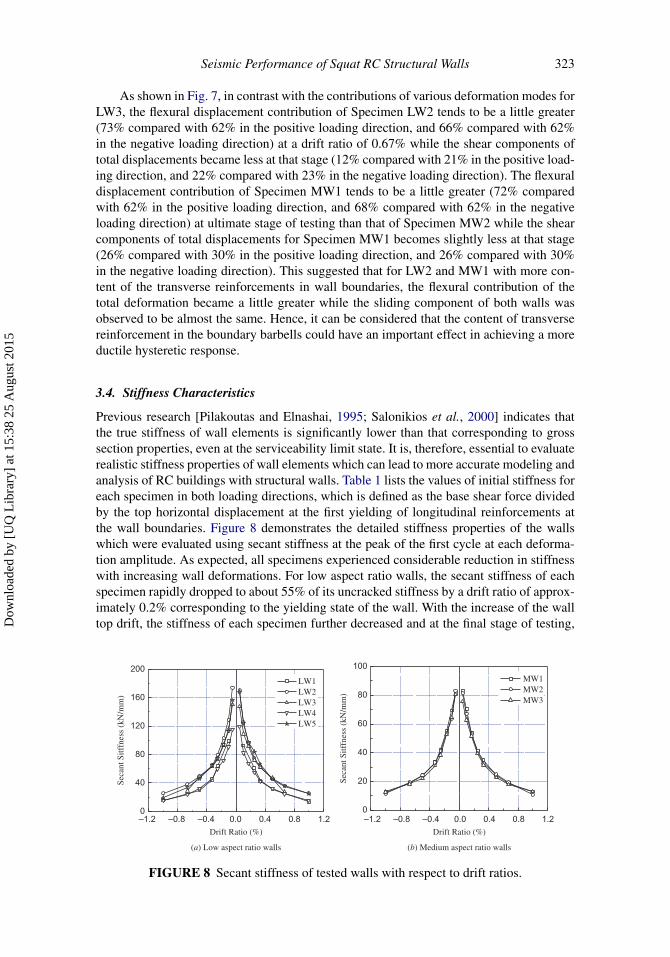
Previous research [Pilakoutas and Elnashai, 1995; Salonikios et al., 2000] indicates thatthe true stiffness of wall elements is significantly lower than that corresponding to grosssection properties, even at the serviceability limit state. It is, therefore, essential to evaluaterealistic stiffness properties of wall elements which can lead to more accurate modeling andanalysis of RC buildings with structural walls. Table 1 lists the values of initial stiffness foreach specimen in both loading directions, which is defined as the base shear force dividedby the top horizontal displacement at the first yielding of longitudinal reinforcements atthe wall boundaries. Figure 8 demonstrates the detailed stiffness properties of the wallswhich were evaluated using secant stiffness at the peak of the first cycle at each deforma-tion amplitude. As expected, all specimens experienced considerable reduction in stiffnesswith increasing wall deformations. For low aspect ratio walls, the secant stiffness of eachspecimen rapidly dropped to about 55% of its uncracked stiffness by a drift ratio of approx-imately 0.2% corresponding to the yielding state of the wall. With the increase of the walltop drift, the stiffness of each specimen further decreased and at the final stage of testing,
–1.2 –0.8 –0.4 0.0 0.4 0.8 1.20
40
80
120
160
200
Seca
nt S
itffn
ess
(kN
/mm
)
Drift Ratio (%)
LW1LW2LW3LW4LW5
–1.2 –0.8 –0.4 0.0 0.4 0.8 1.20
20
40
60
80
100
Seca
nt S
itffn
ess
(kN
/mm
)
Drift Ratio (%)
MW1MW2MW3
(a) Low aspect ratio walls (b) Medium aspect ratio walls
FIGURE 8 Secant stiffness of tested walls with respect to drift ratios.
Dow
nloa
ded
by [
UQ
Lib
rary
] at
15:
38 2
5 A
ugus
t 201
5

324 B. Li, Z. Pan, and W. Xiang
it only accounted for 15% of its uncracked stiffness. By comparing LW2 and LW5 whichwere subjected to axial loadings, more severe degradation of stiffness for LW3 with inad-equate transverse reinforcements provided at the wall boundaries was observed at a driftratio of 0.67%. For medium aspect ratio walls, at the early stage of testing, the stiffness ofeach specimen rapidly dropped to about 25% of its uncracked stiffness by a drift ratio ofapproximately 0.15%; with the increase in the wall top drift, the stiffness of each speci-men further decreased and at the final stage of testing, it remained at rather low levels withapproximately 30% of its initial stiffness.
The degradation ratio of secant stiffness, which was evaluated by dividing the valuesof secant stiffness at the initial loading stages by those corresponding to the final loadingstages, was achieved to be about 85% for all specimens with or without axial loadings. Thissuggested that such low levels of axial loadings had a minor effect on the degradation rateof secant stiffness despite the fact that the presence of axial compression in specimens canlead to higher secant stiffness in contrast with those not subjected to axial loadings at thesame drift ratios. In addition, Fig. 8 suggests that the content of transverse reinforcementsin the wall boundary element and the presence of construction joints at the wall base havenegligible effects on the stiffness characteristics of the tested walls under such levels ofaxial compression.
4. Causes of Wall Resistance and Failure Mechanism
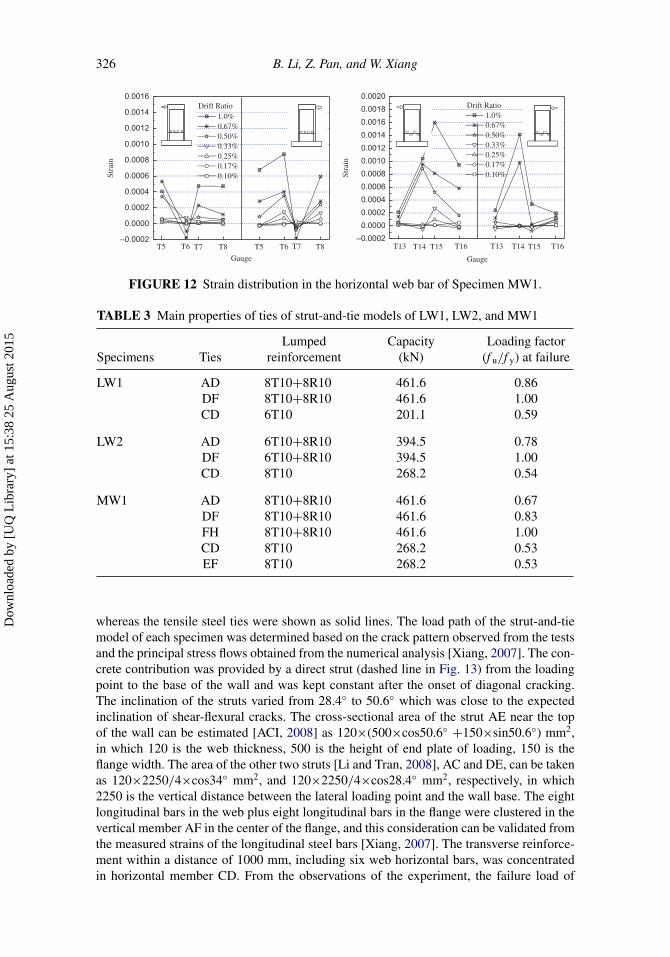
Strut-and-tie models have been used intuitively for many years in design of concrete struc-tures, whereby complex stress fields inside a structural member arising from applied loadsare simplified into discrete compressive and tensile force paths. With the aid of the strut-and-tie model, a better visualization and understanding of the distribution of internal forceand the mechanism of force transfer can be achieved. The shear force transfer mecha-nism of squat RC walls has been investigated by many researchers [Park and Paulay, 1975;Paulay et al., 1982] and was comprehensively outlined by Park and Paulay [1975] in whichthe shear force is transferred to the wall base by a middle strut and a truss in the trian-gular region beside the strut. This mechanism of shear force transfer in the tested squatwalls can be verified by the observations from the strain histories of gauges in the webhorizontal reinforcements of tested specimens. Taking LW1, LW2, and MW1 for example,Figs. 10–12 depict the typical strain distribution with the variation of the wall drift ratiosfor two different horizontal web bars [Xiang, 2007], respectively. The two horizontal barswere located at the wall heights of 250 mm and 750 mm from the base (shown in Fig. 9)and in each horizontal bar, the strain values obtained from four strain gauges were plottedunder both positive and negative loading directions. From Figs. 11 and 12, in the positiveloadings, larger strain values are observed to occur along the diagonal struts (T7, T8, T14,T15) and this is likewise obvious under the negative loadings (T5, T6, and T13, T14). ForLW1, it can be observed from Fig. 10 that the tensile strain of the horizontal bars in gaugesalong the diagonal strut was normally larger than that of gauges away from the strut.
The following assumption were made in the development of the strut-and-tie modelsof Specimens: (1) All reinforcements were lumped into one tie, and its position was locatedin the centroidal axis of the reinforcement lumped into it; (2) the strut position was deter-mined by keeping the concrete compressive stress in it lower than the strength limitationssuggested by Schlaich et al. [1987], which is 0.68f c
′ for a concrete strut with cracks paral-lel to it or 0.51 f c
′ for a concrete strut with skew cracks; (3) the struts were idealized intoprismatic shape instead of bottle-shaped stress field; and (4) the node was not a problemfor tensile and compressive failure, which occurs at the mid-strut length rather than at thenode.
Dow
nloa
ded
by [
UQ
Lib
rary
] at
15:
38 2
5 A
ugus
t 201
5

Seismic Performance of Squat RC Structural Walls 325
150 1700 15025
050
0
225 500 250 500 225
T5 T6 T7 T8
T13 T14 T15 T16
150 1700 150
250
500
225 500 250 500 225
T5 T6 T7 T8
T13 T14 T15 T16
(a) Low aspect ratio walls (b) Medium aspect ratio walls
FIGURE 9 Gauge arrangements in specimens (in mm, 1 mm = 0.0394 in).
–0.0002
0.0000
0.0002
0.0004
0.0006
0.0008
0.0010
0.0012
0.0014
0.0016
0.0018
0.0020
1.0% 0.50% 0.33% 0.25% 0.10%
T8T7T6T5T8T7T6
Stra
in
Gauge
T5
Drift Ratio
–0.0002
0.0000
0.0002
0.0004
0.0006
0.0008
0.0010
0.0012
0.0014
0.0016
0.0018
0.0020
1.0% 0.50% 0.33% 0.25% 0.10%
T16T15T14T13T16T15T14
Stra
in
Gauge
T13
Drift Ratio
FIGURE 10 Strain distribution in the horizontal web bar of Specimen LW1.
–0.0002
0.0000
0.0002
0.0004
0.0006
0.0008
0.0010
0.0012
0.0014
0.0016
1.0% 0.67% 0.50% 0.33% 0.25% 0.17% 0.10%
T8T7T6T5T8T7T6
Stra
in
Gauge
T5
Drift Ratio
–0.0002
0.0000
0.0002
0.0004
0.0006
0.0008
0.0010
0.0012
0.0014
0.0016
0.0018
0.0020
1.0% 0.67% 0.50% 0.33% 0.25% 0.17% 0.10%
T16T15T14T13T16T15T14
Stra
in
Gauge
T13
Drift Ratio
FIGURE 11 Strain distribution in the horizontal web bar of Specimen LW2.
The primary properties of the ties and struts were listed in Tables 3 and 4, respectively.The strut-and-tie model shown in Fig. 13 has been proposed to simulate the behavior of thereference specimen LW1. In the model, the compression struts were shown as dotted lines,
Dow
nloa
ded
by [
UQ
Lib
rary
] at
15:
38 2
5 A
ugus
t 201
5
326 B. Li, Z. Pan, and W. Xiang
–0.0002
0.0000
0.0002
0.0004
0.0006
0.0008
0.0010
0.0012
0.0014
0.0016
1.0% 0.67% 0.50% 0.33% 0.25% 0.17% 0.10%
T8T7T6T5T8T7T6
Stra
in
Gauge
T5
Drift Ratio
–0.0002
0.0000
0.0002
0.0004
0.0006
0.0008
0.0010
0.0012
0.0014
0.0016
0.0018
0.0020
1.0% 0.67% 0.50% 0.33% 0.25% 0.17% 0.10%
T16T15T14T13T16T15T14
Stra
in
Gauge
T13
Drift Ratio
FIGURE 12 Strain distribution in the horizontal web bar of Specimen MW1.
TABLE 3 Main properties of ties of strut-and-tie models of LW1, LW2, and MW1
Specimens TiesLumped
reinforcementCapacity
(kN)Loading factor
(f u/f y) at failure
LW1 AD 8T10+8R10 461.6 0.86DF 8T10+8R10 461.6 1.00CD 6T10 201.1 0.59
LW2 AD 6T10+8R10 394.5 0.78DF 6T10+8R10 394.5 1.00CD 8T10 268.2 0.54
MW1 AD 8T10+8R10 461.6 0.67DF 8T10+8R10 461.6 0.83FH 8T10+8R10 461.6 1.00CD 8T10 268.2 0.53EF 8T10 268.2 0.53
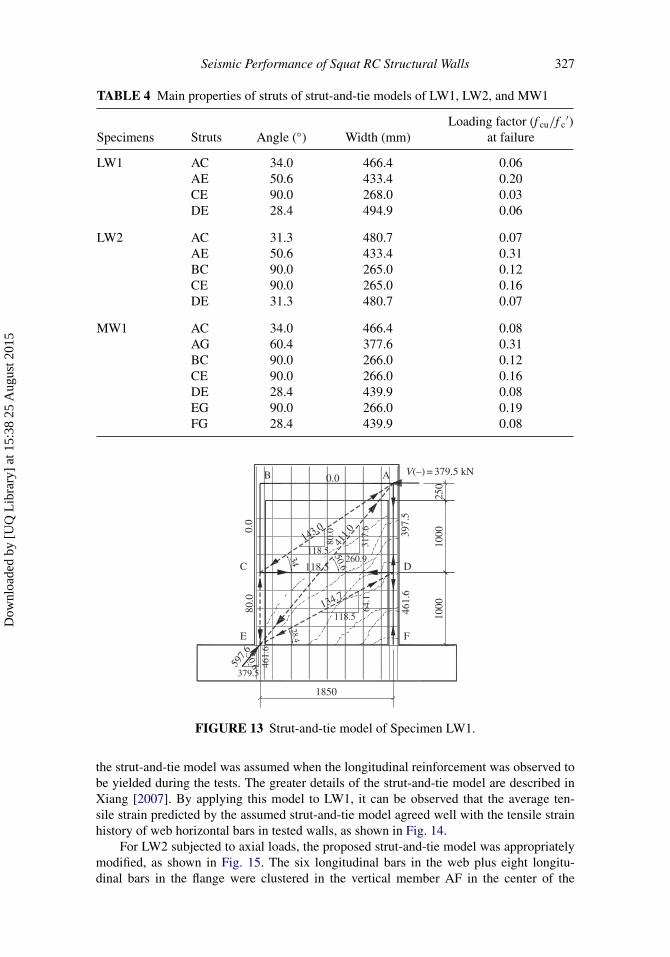
whereas the tensile steel ties were shown as solid lines. The load path of the strut-and-tiemodel of each specimen was determined based on the crack pattern observed from the testsand the principal stress flows obtained from the numerical analysis [Xiang, 2007]. The con-crete contribution was provided by a direct strut (dashed line in Fig. 13) from the loadingpoint to the base of the wall and was kept constant after the onset of diagonal cracking.The inclination of the struts varied from 28.4◦ to 50.6◦ which was close to the expectedinclination of shear-flexural cracks. The cross-sectional area of the strut AE near the topof the wall can be estimated [ACI, 2008] as 120×(500×cos50.6◦ +150×sin50.6◦) mm2,in which 120 is the web thickness, 500 is the height of end plate of loading, 150 is theflange width. The area of the other two struts [Li and Tran, 2008], AC and DE, can be takenas 120×2250/4×cos34◦ mm2, and 120×2250/4×cos28.4◦ mm2, respectively, in which2250 is the vertical distance between the lateral loading point and the wall base. The eightlongitudinal bars in the web plus eight longitudinal bars in the flange were clustered in thevertical member AF in the center of the flange, and this consideration can be validated fromthe measured strains of the longitudinal steel bars [Xiang, 2007]. The transverse reinforce-ment within a distance of 1000 mm, including six web horizontal bars, was concentratedin horizontal member CD. From the observations of the experiment, the failure load of
Dow
nloa
ded
by [
UQ
Lib
rary
] at
15:
38 2
5 A
ugus
t 201
5
Seismic Performance of Squat RC Structural Walls 327
TABLE 4 Main properties of struts of strut-and-tie models of LW1, LW2, and MW1
Specimens Struts Angle (◦) Width (mm)Loading factor (f cu/f c
′)at failure
LW1 AC 34.0 466.4 0.06AE 50.6 433.4 0.20CE 90.0 268.0 0.03DE 28.4 494.9 0.06
LW2 AC 31.3 480.7 0.07AE 50.6 433.4 0.31BC 90.0 265.0 0.12CE 90.0 265.0 0.16DE 31.3 480.7 0.07
MW1 AC 34.0 466.4 0.08AG 60.4 377.6 0.31BC 90.0 266.0 0.12CE 90.0 266.0 0.16DE 28.4 439.9 0.08EG 90.0 266.0 0.19FG 28.4 439.9 0.08
1000
1850
E
C
F
D
A V(–) = 379.5 kN
260.9
317.
6
411.
0
118.5
80.0
143.0
118.5
118.5
64.1134.7
397.
546
1.6
80.0
379.5
461.
6
597.
6
50.6
B
0.0
0.0
50.6
1000
250
28.434
FIGURE 13 Strut-and-tie model of Specimen LW1.
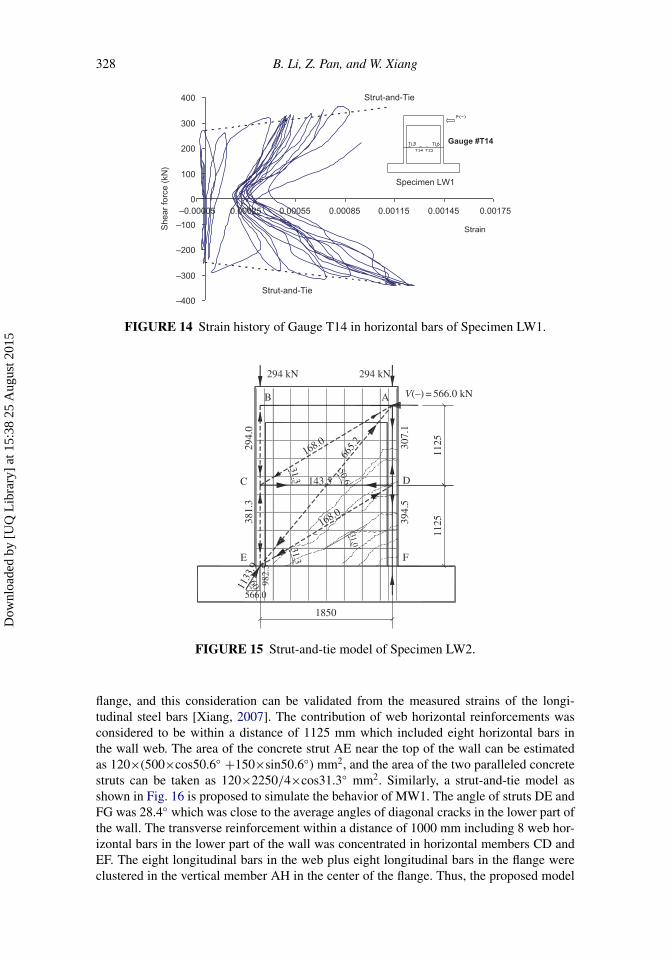
the strut-and-tie model was assumed when the longitudinal reinforcement was observed tobe yielded during the tests. The greater details of the strut-and-tie model are described inXiang [2007]. By applying this model to LW1, it can be observed that the average ten-sile strain predicted by the assumed strut-and-tie model agreed well with the tensile strainhistory of web horizontal bars in tested walls, as shown in Fig. 14.
For LW2 subjected to axial loads, the proposed strut-and-tie model was appropriatelymodified, as shown in Fig. 15. The six longitudinal bars in the web plus eight longitu-dinal bars in the flange were clustered in the vertical member AF in the center of the
Dow
nloa
ded
by [
UQ
Lib
rary
] at
15:
38 2
5 A
ugus
t 201
5
328 B. Li, Z. Pan, and W. Xiang
–400
–300
–200
–100
0
100
200
300
400
–0.00005 0.00025 0.00055 0.00085 0.00115 0.00145 0.00175
StrainShe
ar fo
rce
(kN
)
Gauge #T14
Specimen LW1
Strut-and-Tie
Strut-and-Tie
FIGURE 14 Strain history of Gauge T14 in horizontal bars of Specimen LW1.50.6
31.0
1125
1125
1850
E
C
F
D
A V(–) = 566.0 kN
665.
2
168.0
143.5
168.0
307.
139
4.5
381.
3
566.0
982.
5
1133
.9
31.331.3
B
294.
0
294 kN 294 kN
60
FIGURE 15 Strut-and-tie model of Specimen LW2.
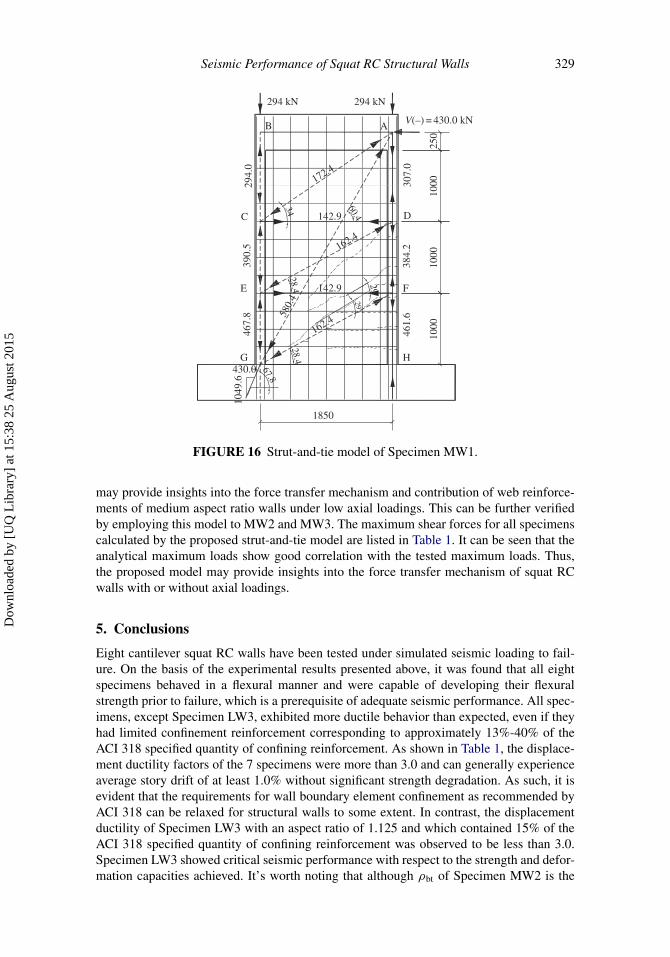
flange, and this consideration can be validated from the measured strains of the longi-tudinal steel bars [Xiang, 2007]. The contribution of web horizontal reinforcements wasconsidered to be within a distance of 1125 mm which included eight horizontal bars inthe wall web. The area of the concrete strut AE near the top of the wall can be estimatedas 120×(500×cos50.6◦ +150×sin50.6◦) mm2, and the area of the two paralleled concretestruts can be taken as 120×2250/4×cos31.3◦ mm2. Similarly, a strut-and-tie model asshown in Fig. 16 is proposed to simulate the behavior of MW1. The angle of struts DE andFG was 28.4◦ which was close to the average angles of diagonal cracks in the lower part ofthe wall. The transverse reinforcement within a distance of 1000 mm including 8 web hor-izontal bars in the lower part of the wall was concentrated in horizontal members CD andEF. The eight longitudinal bars in the web plus eight longitudinal bars in the flange wereclustered in the vertical member AH in the center of the flange. Thus, the proposed model
Dow
nloa
ded
by [
UQ
Lib
rary
] at
15:
38 2
5 A
ugus
t 201
5
Seismic Performance of Squat RC Structural Walls 329
294 kN294 kN
V(–) = 430.0 kNAB
C D
HG
294.
0
307.
038
4.2
390.
5
1850
28.434 60.4
461.
6
467.
8
FE
1000
1000
1000
28.4
172.4
142.9
162.4
162.4
142.958
0.4
430.0
1049
.6
67.8
250
29
29
FIGURE 16 Strut-and-tie model of Specimen MW1.
may provide insights into the force transfer mechanism and contribution of web reinforce-ments of medium aspect ratio walls under low axial loadings. This can be further verifiedby employing this model to MW2 and MW3. The maximum shear forces for all specimenscalculated by the proposed strut-and-tie model are listed in Table 1. It can be seen that theanalytical maximum loads show good correlation with the tested maximum loads. Thus,the proposed model may provide insights into the force transfer mechanism of squat RCwalls with or without axial loadings.
5. Conclusions
Eight cantilever squat RC walls have been tested under simulated seismic loading to fail-ure. On the basis of the experimental results presented above, it was found that all eightspecimens behaved in a flexural manner and were capable of developing their flexuralstrength prior to failure, which is a prerequisite of adequate seismic performance. All spec-imens, except Specimen LW3, exhibited more ductile behavior than expected, even if theyhad limited confinement reinforcement corresponding to approximately 13%-40% of theACI 318 specified quantity of confining reinforcement. As shown in Table 1, the displace-ment ductility factors of the 7 specimens were more than 3.0 and can generally experienceaverage story drift of at least 1.0% without significant strength degradation. As such, it isevident that the requirements for wall boundary element confinement as recommended byACI 318 can be relaxed for structural walls to some extent. In contrast, the displacementductility of Specimen LW3 with an aspect ratio of 1.125 and which contained 15% of theACI 318 specified quantity of confining reinforcement was observed to be less than 3.0.Specimen LW3 showed critical seismic performance with respect to the strength and defor-mation capacities achieved. It’s worth noting that although ρbt of Specimen MW2 is the
Dow
nloa
ded
by [
UQ
Lib
rary
] at
15:
38 2
5 A
ugus
t 201
5
330 B. Li, Z. Pan, and W. Xiang
same as that of LW3, the ductility level of Specimen MW2 is 3.6 due to the higher aspectratio, compared with Specimen LW3.
It was also found in the testing that the level of axial compression had a minor effecton the degradation rate of secant stiffness despite the fact that the presence of axial com-pression in specimens can lead to higher secant stiffness as opposed to those without axialloadings. For the specimens subjected to axial compression, the amount of energy dissi-pated was larger than that corresponding to specimens without axial compression due tothe favorable effect of the axial compression with regard to controlling the pinching ofhysteresis loops.
For the specimens with more transverse reinforcements in the wall boundary elements,the flexural contribution of the total deformation became greater. This clearly indicatesthat seismic performance such as drift and energy dissipation capacity can be enhancedby increasing the amount of transverse reinforcement in the boundary elements of a wall.However, the amount of transverse reinforcement in the wall boundary elements and thepresence of construction joints at the wall base have negligible effects on the overallstiffness characteristics of the tested walls under such levels of axial compressions.
Strut-and-tie models for RC squat structural walls with and without axial loading,accounting for different contributions of horizontal and longitudinal web reinforcements,were developed to accurately reflect the force transfer mechanisms of squat structural wallsunder the lateral loading. The tensile strains in the horizontal web bars of squat RC wallscould be predicted by the use of the assumed strut-and-tie model which agreed well withthe tested data. This provides evidence that the assumed strut-and-tie models are reasonablemodels for the flow of forces and contribution of web reinforcements in the walls tested.
References
American Concrete Institute (ACI) [2008] Building Code Requirements for Structural Concrete(ACI 318-08) and Commentary (ACI 318R-08), American Concrete Institute, Farmington Hills,Michigan.
Bentz, E. C. [2000] “Sectional analysis of RC members,” Ph.D. Dissertation, University of Toronto,Canada.
Lefas, L. D., Kotsovos, M. D., and Ambraseys, N. N. [1990] “Behavior of reinforced concrete struc-tural walls: strength, deformation characteristic, and failure mechanism,” ACI Structural Journal87(1), 23–31.
Li, B. and Tran, C. T. N. [2008] “Reinforced concrete beam analysis supplementing concretecontribution in truss models,” Engineering Structures 30(11), 3285–3294.
Maier, J. and Thurlimann, B. [1985] Shear Wall Tests, The Swiss Federal Institute of Technology,Zurich, Switzerland.
Massone, L. M., Orakcal, K., and Wallace, J. W. [2009] “Modeling of squat structural walls controlledby shear,” ACI Structural Journal 106(5), 646–655.
Mestyanek, J. M. [1986] “The earthquake of resistance of reinforced concrete structural walls oflimited ductility,” Master Thesis, University of Canterbury, Christchurch, New Zealand.
New Zealand Standard (NZS) [1995] New Zealand Standard Code of Practice for the Design ofConcrete Structures, “NZS 3101: Part 1, 185pp; Commentary NZS 3101: Part 2, 247pp,” StandardAssociation of New Zealand, Wellington, New Zealand.
Oh, Y. H., Han, S. W., and Lee, L. H. [2002] “Effect of boundary element details on the seismic defor-mation capacity of structural walls,” Earthquake Engineering and Structural Dynamics 31(8),1583–1602.
Park, R. and Paulay, T. [1975] Reinforced Concrete Structures, John Wiley & Sons, New York.Paulay, T., Priestley, M. J. N., and Synge, A. J. [1982] “Ductility in earthquake resisting squat
shearwalls,” ACI Journal Proceeding 79(4), 257–269.
Dow
nloa
ded
by [
UQ
Lib
rary
] at
15:
38 2
5 A
ugus
t 201
5
Seismic Performance of Squat RC Structural Walls 331
Pilakoutas, K. and Elnashai, A. S. [1995] “Cyclic behavior of reinforced concrete cantilever walls,Part I: experimental results,” ACI Material Journal 92(3), 425–434.
Preti, M. and Giuriani, E. [2011] “Ductility of a structural wall with spread rebars tested in full scale,”Journal of Earthquake Engineering 15(8), 1238–1259.
Salonikios, T. N., Kappos, A. J., Tegos, I. A., and Penelis, G. G. [1999] “Cyclic load behavior oflow-slenderness reinforced concrete walls: design basis and test results,” ACI Structural Journal96(4), 649–660.
Salonikios, T. N., Kappos, A. J., Tegos, I. A., and Penelis, G. G. [2000] “Cyclic load behavior ofbow-slenderness reinforced concrete walls: failure modes, strength and deformation analysis, anddesign implications,” ACI Structural Journal 97(1), 132–142.
Schlaich, J., Schäfer, K., and Jennewein, M. [1987] “Toward a consistent design of structuralconcrete.” PCI Journal 32(3), 74–150.
Wallace, J. W. [1995] “Seismic design of RC structural walls. Part I: new code format,” Journal ofStructural Engineering 121(1), 75–87.
Wallace, J. W. and Thomsen, J. H. [1995] “Seismic design of RC structural walls. Part II:applications,” Journal of Structural Engineering 121(1), 88–101.
Wood, S. L. [1990] “Shear strength of low-rise reinforced concrete walls,” ACI Structural Journal87(1), 99–107.
Wu, Y. [2002] “Experimental and analytical study of reinforced concrete interior beam-wide col-umn joints for seismic performance,” Ph.D. Dissertation, Nanyang Technological University,Singapore.
Xiang, W. [2007] “Seismic performance of structural walls with limited transverse reinforcement,”Ph.D. Dissertation, Nanyang Technological University, Singapore.
Dow
nloa
ded
by [
UQ
Lib
rary
] at
15:
38 2
5 A
ugus
t 201
5