journal forestry gis - esri · esri international user conference july 12–16, 2010 san diego,...
TRANSCRIPT
In This IssueESRI • Fall 2005 GIS for xxxxxx
continued on page 3
ESRI News p2
Imagery: A Core Component of GIS p3
GIS Tree Inventory Project Aids Park p4
GIS Featured at Australasian Forestry Conference
p5
Carbon Sequestration Assessment p5
Sustainable Forest Management in North Rhine-Westphalia
p6
Forest Service’s GIS Web Server p8
Urban Ecologist Uses GIS to Study Urban Forestry, Natural Systems, and Human Networks
p9
GIS Forestry Tool Lowers Costs of Finnish Forest Management
p10
Guyana Carbon Accounting p11
ESRI • Spring 2010 GIS for Forestry and Timberland Management
Forestry GISJournal
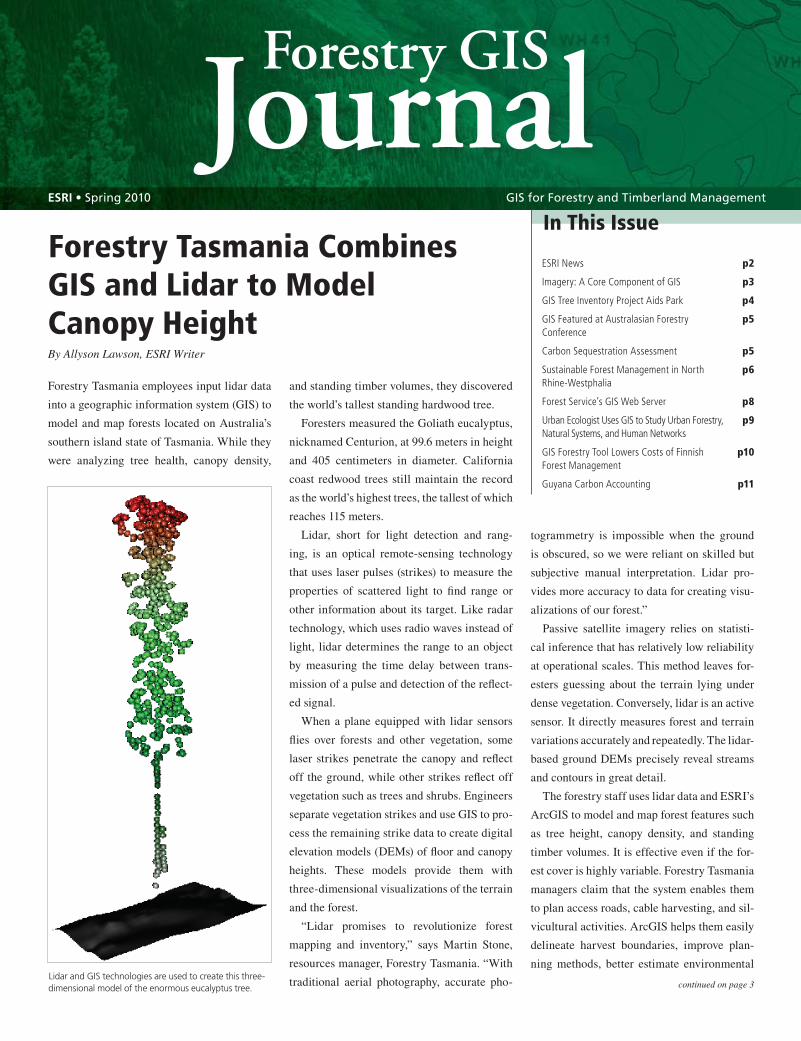
Forestry Tasmania employees input lidar data
into a geographic information system (GIS) to
model and map forests located on Australia’s
southern island state of Tasmania. While they
were analyzing tree health, canopy density,
Forestry Tasmania Combines GIS and Lidar to Model Canopy Height By Allyson Lawson, ESRI Writer
and standing timber volumes, they discovered
the world’s tallest standing hardwood tree.
Foresters measured the Goliath eucalyptus,
nicknamed Centurion, at 99.6 meters in height
and 405 centimeters in diameter. California
coast redwood trees still maintain the record
as the world’s highest trees, the tallest of which
reaches 115 meters.
Lidar, short for light detection and rang-
ing, is an optical remote-sensing technology
that uses laser pulses (strikes) to measure the
properties of scattered light to find range or
other information about its target. Like radar
technology, which uses radio waves instead of
light, lidar determines the range to an object
by measuring the time delay between trans-
mission of a pulse and detection of the reflect-
ed signal.
When a plane equipped with lidar sensors
flies over forests and other vegetation, some
laser strikes penetrate the canopy and reflect
off the ground, while other strikes reflect off
vegetation such as trees and shrubs. Engineers
separate vegetation strikes and use GIS to pro-
cess the remaining strike data to create digital
elevation models (DEMs) of floor and canopy
heights. These models provide them with
three-dimensional visualizations of the terrain
and the forest.
“Lidar promises to revolutionize forest
mapping and inventory,” says Martin Stone,
resources manager, Forestry Tasmania. “With
traditional aerial photography, accurate pho-
togrammetry is impossible when the ground
is obscured, so we were reliant on skilled but
subjective manual interpretation. Lidar pro-
vides more accuracy to data for creating visu-
alizations of our forest.”
Passive satellite imagery relies on statisti-
cal inference that has relatively low reliability
at operational scales. This method leaves for-
esters guessing about the terrain lying under
dense vegetation. Conversely, lidar is an active
sensor. It directly measures forest and terrain
variations accurately and repeatedly. The lidar-
based ground DEMs precisely reveal streams
and contours in great detail.
The forestry staff uses lidar data and ESRI’s
ArcGIS to model and map forest features such
as tree height, canopy density, and standing
timber volumes. It is effective even if the for-
est cover is highly variable. Forestry Tasmania
managers claim that the system enables them
to plan access roads, cable harvesting, and sil-
vicultural activities. ArcGIS helps them easily
delineate harvest boundaries, improve plan-
ning methods, better estimate environmental Lidar and GIS technologies are used to create this three-dimensional model of the enormous eucalyptus tree.

2 Forestry GIS Journal www.esri.com/forestry
Euro Forest 2010 June 30, 2010
Bourgogne, Francewww.euroforest-2010.eu/
ACF National ConferenceJune 26–30, 2010
Louisville, Kentucky, USA www.acf-foresters.org
Commonwealth Forestry Association June 28–July 2, 2010
Edinburgh, United Kingdomwww.cfc2010.org
ESRI International User ConferenceJuly 12–16, 2010
San Diego, California, USA www.esri.com/events
23 IUFRO World CongressAugust 23–28, 2010
Seoul, Republic of Koreawww.iufro2010.com
Society of American Foresters October 27–31, 2010
Albuquerque, New Mexico, USAwww.safnet.org/natcon10/
COP 16 United Nations Climate Change Conference
December 2010Mexico City, Mexico
www.cop16.mx
ESRI NewsESRI on the Road
Consultant/Project Manager—Natural Resources/Environmental
Use your consulting and project management experience in the natural resources and environ-
mental markets to help clients transform
real-world needs into state-of-the-art,
GIS technology-driven solutions. This
is a challenging opportunity to lead
project teams and manage the entire
GIS implementation process. Learn
more and apply at www.esri.com/
careers/consulting.
ESRI Career Opportunity
Domtar’s Forest Products Group
in Toronto, Ontario, Canada, has
signed an enterprise license agree-
ment (ELA) with ESRI Canada
Limited. The ELA allows Domtar to
expand its usage of ESRI’s GIS so-
lutions, gain better operational vis-
ibility, and enhance forest operations
management.
The system will help Domtar man-
age its harvesting activity to protect forest values such as fish and wildlife, flora, water resources,
tourism, and natural heritage and manage assets such as bridges, culverts, and roads. Domtar also
uses GIS to support third-party forest certification, regulatory reporting, and public consultation
with external stakeholders for forest management planning.
“Businesses with complex operations need solutions that can help them gain better visibility
and control over their activities and reduce their environmental impact,” said James Wickson,
vice president of ESRI Canada’s sales and professional services. “ESRI’s leading GIS technology
provides the capability to produce a comprehensive picture of Domtar’s operations in real time,
enabling staff to make critical decisions quickly and effectively.”
The ELA provides customers with affordable, unlimited access to ESRI software, maintenance,
services, and training. It also allows them to leverage the latest version of ESRI’s ArcGIS software
suite, which provides comprehensive functionality for authoring, managing, and sharing geographic
information on servers, desktops, and mobile devices as well as over the Web. ArcGIS helps organi-
zations increase operational efficiency, improve communication, and enhance decision making.
For more information on ESRI ArcGIS, visit www.esricanada.com/products/arcgis. For more in-
formation about ESRI Canada’s ELA program, contact your nearest ESRI Canada regional office.
Domtar to Enhance Forest Operations Management with ESRI TechnologyBy Joy Chan, ESRI Canada Limited

Forestry GIS Journal 3www.esri.com/forestry
Sponsor a GIS Day Event
outcomes, efficiently maintain timber inven-
tories, and accurately map the forest’s spatial
variation.
Lidar forest inventory datasets are quite
large. An average of two lidar strikes per
square meter of forested land is captured. This
is a lot of data to store and process. Forestry
Tasmania’s data management system includes
an Oracle Spatial relational database. The data
in Oracle is efficiently replicated to a separate
geodatabase, where ESRI’s ArcGIS Desktop
is used to perform advanced geoprocessing
and analysis on it. The output is a range of
derived products that can be published as GIS
layers such as DEMs, timber volume surfaces,
contours, and drainage lines.
“Our organization has become spatially
aware, and everyone uses GIS in some form,
especially in the field offices,” says Luke Ellis,
GIS manager for Forestry Tasmania. “Our em-
ployees regularly use ArcGIS to browse and
query data and publish maps. We use it to per-
continued from page 1
Forestry Tasmania Combines GIS and Lidar to Model Canopy Height
form everyday work tasks such as processing
lidar data, modeling and analyzing the state
of the forest, computing statistics for spatial
analysis, monitoring sustainability indicators
for annual reporting, and visualizing our for-
est’s attributes.”
GIS gives foresters a better picture of what
resides in the forest, such as the very special
Centurion tree. The tree has lived in the forest
for 400 years and survived recent threats such
as logging operations in the 1950s and two
massive wildfires, one in 1934 that passed just
to the west of the tree and another in 1966 on
its east side.
“No one was looking out for the tree in those
days,” Stone remarks. “We didn’t know it was
there. But thanks to lidar and GIS, it now has a
name and is, literally, on the map.” Centurion
has been formally classified as a giant tree, and
the area surrounding it has been designated as
a protected reserve.
Several years ago, ESRI launched a major
program to enhance support for the use, ex-
ploitation, and analysis of imagery across its
product line. This began with the introduction
of ArcGIS Image Server, a product that allows
users to manage and disseminate vast quanti-
ties of imagery quickly and easily. This tech-
nology has continued to mature, and last year it
became an extension to ArcGIS Server. At the
same time, image services, which optimize the
delivery of imagery over the Web, were built
into the core ArcGIS Server product.
In the next version, ArcGIS 10, ESRI will
continue to integrate image services and, at
the same time, improve the performance and
capabilities of all its products with regard to
imagery. Its desktop product will include basic
image analysis with focused imagery tools and
Imagery: A Core Component of GISBy Lawrie Jordan, ESRI Director of Imagery Solutions
fast image display capabilities. This will allow
intuitive and high-performance capabilities
for navigating imagery integrated with map
displays. ESRI is improving its image data
modeling, management, and visualization and
adding dynamic analytic tools in a way that
supports the typical workflows associated
with geospatial imagery.
With the additional imagery capabilities in
ArcGIS 10, ESRI is making imagery a funda-
mental component of ArcGIS. ESRI’s strat-
egy for providing increased imagery support
includes highly scalable image data manage-
ment, new desktop image display and analysis
tools, and the ability to leverage the strengths
of key technology partners.
Learn about ESRI products at www.esri
.com/products.
GIS Day will be November 17, 2010. That’s still six months away, you might say. But planning takes time, so we have compiled several tips on how to organize a GIS Day event. Get started today.
www.gisday.com

4 Forestry GIS Journal www.esri.com/forestry
In the heart of Houston, Texas, is Hermann
Park. The 445-acre park is home to a zoo, out-
door theater, outdoor railroad, garden center,
and golf course that provide Houston’s citizens
and visitors with a beautiful place to enjoy the
day. To improve park grounds, the Hermann
Park Conservancy (HPC), a nonprofit citizens’
organization, is using GIS to enhance and
maintain the park.
HPC has used ArcGIS software as part of
its ongoing tree inventory project. The goal
of the project is to record information on the
species, diameter, and location of every tree in
the park. The user can visualize this digitized
GIS Tree Inventory Project Aids Park Improvement Plan
geographic data on maps and use it for plan-
ning park maintenance and improvement.
With a notebook, pen, handheld Garmin
60CSx GPS unit, and measuring tape, summer
interns have surveyed nearly the entire park
and are continually updating the inventory
when old trees are removed or new trees are
planted.
After uploading the inventory information
as a layer in ArcGIS, the interns created maps
that aid in tree maintenance. Map outputs
include the distribution of different species,
the sites of the park’s most valuable trees, the
spread of invasive species, and the locations
of dead trees that need to be removed. This
information is used to make informed deci-
sions on the best locations for planting sites
A summer intern captures data to include in a city park GIS tree inventory project.
A beautiful set of maps and descriptions cre-
ated by people working in the forestry industry
from around the world is presented in the ESRI
Press book Mapping Forestry. From logging
feasibility to operations management to sus-
tainability planning applications, GIS increases
productivity and efficiencies. Mapping Forestry
highlights GIS-produced forestry maps devel-
oped for a full range of research, planning, and
operational forestry activities. In addition to
maps and descriptions, contributors offer reci-
pes for map-building success for you to follow
in creating similar GIS projects.
Editor: Peter Eredics
ESRI Press, 2010
80 pages, $39.95
ISBN: 978-1-58948-209-8
Mapping Forestry
that will enhance the park’s
biodiversity and preserve its
canopy cover. HPC has also
produced GIS maps that show
the species and diameter dis-
tribution in each of the park’s
pruning divisions and zones to
aid pruning contractors in esti-
mating the cost of a project.
With ArcGIS, HPC has been
able to expand its inventory
project to include information
on all park structures, includ-
ing buildings, sculptures, park-
ing lots, paths, the tracks of the
miniature train, and user ame-
nities such as trash cans and
picnic tables. HPC hopes to eventually use this
information in conjunction with the tree inven-
tory data to create a complete picture of the
park and its offerings to the public. HPC has
used these additional layers to create maps of
newly completed construction projects show-
ing trees, buildings, planting structures, and
every new amenity installed for public use.
ArcGIS provides an invaluable tool for as-
sessing the results of completed park improve-
ment projects and planning new ones.
Thanks to Barbara Jo Harwell, conserva-
tion director, Hermann Park Conservancy, for
sharing this story.
Learn more about ArcGIS at www.esri.com/
arcgis.
Foresters, policy makers, and businesses are
using GIS to measure and support the forest’s
natural ability to clean carbon dioxide (CO2)
emissions from earth’s atmosphere and re-
duce the greenhouse effect on climate change.
Download this free ESRI Best Practices PDF
to read GIS case studies about GIS for forest
carbon management at www.esri.com/library/
bestpractices/forest-carbon-management.pdf.
GIS for Forest Carbon Management—Free Booklet Download

Forestry GIS Journal 5www.esri.com/forestry
Allowing the earth’s forests to thrive and do
their job of carbon sequestration is essen-
tial to reducing the threat of climate change.
Technology offers hope to the greenhouse
phenomenon caused by industrial society. One
such technology is ESRI’s ArcGIS, which of-
fers scientists, decision makers, and policy
implementers a critical tool for obtaining and
using information they need for healing our
planet. GIS allows temporal climate data to
be visualized, contrasted, and forecasted. Use
it to study current land use, land-use change,
and what-if scenarios for responsible planning.
Turn to ArcGIS for
• Robust imagery management—Handle
hundreds or thousands of files. Publish
image services that you get directly from
your source imagery. Fast access func-
tionality quickens imagery data retrieval
and lowers bandwidth requirements.
• Geospatial metadata—Document how,
when, where, and by whom the data was
collected; information on its availability
and distribution; its projection, scale, res-
olution, and accuracy; and its reliability.
Use GIS for a Science-Based Approach to Carbon Sequestration Assessment
• Multiple imagery management—Use
robust imagery capability formats; projec-
tions; and resolution from multiple sources,
such as ground truthing data, for assess-
ment that goes beyond satellite imagery.
• Integration—Use many management
systems to broaden analysis solutions.
• Spatial modeling and analysis—Ana-
lyze cell-based raster data, perform inte-
grated raster/vector analysis, derive new
information from existing data, query in-
formation across multiple data layers, and
fully integrate raster data with traditional
vector data sources.
• Spatial data exploration using sophis-
ticated statistical methods—Create a
surface from limited data measurements
in situations in which extensive data col-
lection is impractical or impossible.
• Infrastructure that supports sharing—
Share data across disciplinary boundar-
ies that span the environmental and social
science fields. Better analyze the cross-
sector studies of a symbiotic relationship
between climate change, sustainable de-
velopment, and the conservation of natu-
ral resources.
The robust functionalities provided by ArcGIS
help scientists gain a better understanding of
the structure and content of geographic infor-
mation and ensure proper model specification
and validation. ArcGIS also provides govern-
ments with methodologies to make decisions
and employ solutions for a better world.
GIS was a featured technology at the
ForestTECH 2009 conference in New Zealand.
Peter Eredics, ESRI’s forestry solutions manag-
er, showcased groundbreaking GIS applications
for the forest industry. In recent years, the role
of GIS has evolved from merely a stand inven-
tory tool to a full enterprise solution. Eredics, a
world-renowned forestry geographic technolo-
gies authority, showcased real-world forestry
applications such as forest management systems,
field data collection solutions, and image man-
agement tools.
The Forest Industry Engineering Association
(FIEA), which hosts ForestTECH, uses the ven-
ue to further its goal of transferring new tech-
nology to wood product and forest management
companies in the Australasian region. More than
GIS Featured at Australasian Forestry Conference
200 forestry managers, forest owners, technical
foresters, forestry consultants, plantation forestry
researchers, and key suppliers to Australian and
New Zealand forestry companies attended the
New Zealand and Australian event in November
2009. Attendees of Eredics’ presentation gained
a wider understanding of the technologies that
will assist them in making key operational, plan-
ning, and strategic decisions.
Eagle Technology Group, Ltd. (www.eagle
.co.nz/gis), ESRI’s distributor in New Zealand,
supports ForestTECH alongside a number of
New Zealand ESRI business partners including
Explorer Graphics Ltd, Geographic Business
Solutions Ltd., and ATLAS Technology.
Learn more about ForestTECH at
www.foresttechevents.com.
Peter Eredics, ESRI’s Forest Solutions Manager
ESRI International User Conference Supports Foresters
ESRI invites foresters and timberland managers to the ESRI International User Conference. See how GIS improves the efficiency of your forest service operations, from tree inventory to roads development to contract management and sustainable forest compliance. When: July 12–16, 2010Where: San Diego Convention Center, San Diego, California, USALearn more and register: www.esri.com/events/user-conference
6 Forestry GIS Journal www.esri.com/forestry
To sustainably manage Germany’s North Rhine-
Westphalia (NRW), forest owners and admin-
istrators use ArcGIS to study forest conditions
and surrounding infrastructure. GIS helps them
identify areas that are most suitable for indus-
trial timber production and make informed de-
cisions for sustainable forest management.
NRW has approximately 900,000 hectares
of private and municipal forestland next to a
high-density population (18 million people).
To support the region’s forestland owners,
Landesbetrieb Wald und Holz NRW (LWH)
provides comprehensive maps about the con-
ditions and infrastructure related to forestry
property. The staff uses GIS to describe its
forest management recommendations.
LWH analysts designed a model for
visualizing the resource utilization potential
of forests. The model gives forest owners an
overview of four important aspects of their
forest lands: operating limitations for harvest-
ing and transportation equipment, physical
soil stability, resource development, and bio-
mass productivity. LWH maintains a forestry
database from which it creates different types
of maps available for the whole federal state
of NRW. Here are descriptions of these maps
using the example of National Park Eifel:
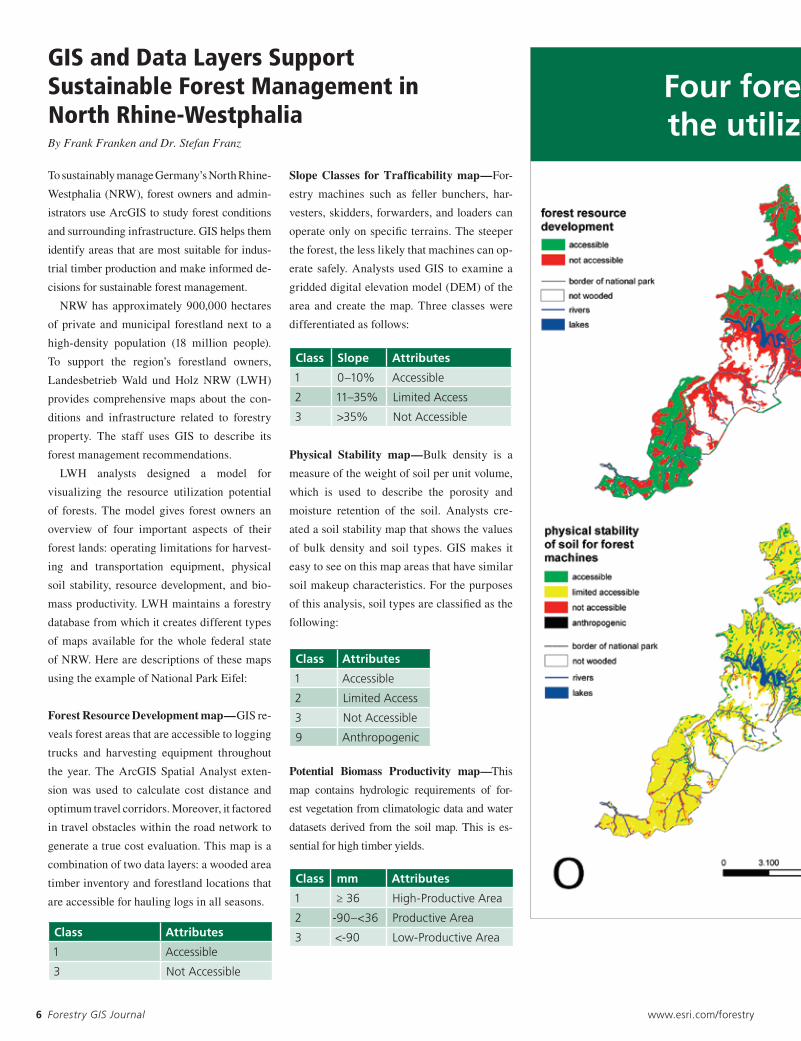
Forest Resource Development map—GIS re-
veals forest areas that are accessible to logging
trucks and harvesting equipment throughout
the year. The ArcGIS Spatial Analyst exten-
sion was used to calculate cost distance and
optimum travel corridors. Moreover, it factored
in travel obstacles within the road network to
generate a true cost evaluation. This map is a
combination of two data layers: a wooded area
timber inventory and forestland locations that
are accessible for hauling logs in all seasons.
GIS and Data Layers Support Sustainable Forest Management in North Rhine-WestphaliaBy Frank Franken and Dr. Stefan Franz
Slope Classes for Trafficability map—For-
estry machines such as feller bunchers, har-
vesters, skidders, forwarders, and loaders can
operate only on specific terrains. The steeper
the forest, the less likely that machines can op-
erate safely. Analysts used GIS to examine a
gridded digital elevation model (DEM) of the
area and create the map. Three classes were
differentiated as follows:
Physical Stability map—Bulk density is a
measure of the weight of soil per unit volume,
which is used to describe the porosity and
moisture retention of the soil. Analysts cre-
ated a soil stability map that shows the values
of bulk density and soil types. GIS makes it
easy to see on this map areas that have similar
soil makeup characteristics. For the purposes
of this analysis, soil types are classified as the
following:
Potential Biomass Productivity map—This
map contains hydrologic requirements of for-
est vegetation from climatologic data and water
datasets derived from the soil map. This is es-
sential for high timber yields.
Class Attributes
1 Accessible
3 Not Accessible
Class Attributes
1 Accessible
2 Limited Access
3 Not Accessible
9 Anthropogenic
Class mm Attributes
1 ≥ 36 High-Productive Area
2 -90–<36 Productive Area
3 <-90 Low-Productive Area
Four forest functions to determine the utilization potential of forests
Class Slope Attributes
1 0–10% Accessible
2 11–35% Limited Access
3 >35% Not Accessible

Forestry GIS Journal 7www.esri.com/forestry
Each of these GIS-generated maps helps
LWH convey forest information in an easy-
to-understand way, thereby improving forest
managers’ decisions. Data layers for individual
forest maps were combined to create a compre-
hensive map (page 8). LWH added analysis to
the map classes by assigning priority ratings ac-
cording to importance and significance levels.
GIS then incorporated these priorities into the
maps.
The map output from this model is the re-
source utilization potential of forests, which
shows area-to-timber priority levels along with
jurisdictional boundaries and rivers.
Learn more about ArcGIS and the ArcGIS
Spatial Analyst extension at www.esri.com/
arcgis.
Contact the authors: Frank Franken, Hessen-
Forst FENA, Gießen, Germany (e-mail: frank
[email protected]), or Dr. Stefan Franz,
Landesbetrieb Wald und Holz NRW, Münster,
Germany (e-mail: stefan.franz@wald-und-holz
.nrw.de.
Class Range Utilization
1 1–1,4 Timber Production:
High Priority
2 1,41–1,8 Timber Production:
Priority
3 1,81–2,2 Timber Production:
Potential Priority
4 2,21–
2,6
Timber Production:
No Priority
5 2,61–
3,0
Other: Nature
Conservation or
Landscape Protection
X > 3,0 or
< 1,0
Anthropogenic
Influenced Soil: No
Conclusion Possible
Four Forest Functions to Determine the Utilization Potential of Forests
Four forest functions to determine the utilization potential of forests
continued on page 8

8 Forestry GIS Journal www.esri.com/forestry
Used by the U.S Department of Agriculture
Forest Service (USFS), FSTopo enables fast pro-
duction and maintenance of basemap products
covering the lands managed by USFS. Built on
ArcGIS Server and ArcIMS, FSTopo provides
the enterprise with GIS Web services and portal
functionality that let users access basemaps any-
time from any USFS computer.
To create FSTopo, ESRI’s Professional
Services deployed ArcGIS Server and ArcIMS.
The database-driven system enables on-the-fly
Forest Service’s GIS Web Server Speeds Enterprise-wide Map Access and Production
continued from page 7
GIS and Data Layers Support Sustainable Forest Management in North Rhine-Westphalia
The North Rhine-Westphalia utilization map prioritizes areas for timber productivity. This map makes it easy for responsible forest
owners to quickly understand land-use options for a range of timber production priorities.
generation and downloading of large-scale topo-
graphic maps. The Web-based interface allows
users to browse and select data, then produce the
desired map.
The USFS Geospatial Service and Technology
Center (GSTC) is responsible for producing and
disseminating geospatial data and manages the
FSTopo system. GSTC reports that FSTopo is
able to quickly meet production requirements.
Staff can make minor changes and respond to
customers much faster. In contrast to previous
work with a film-based workflow, the turnaround
time for minor revisions has been reduced from
more than 10 years to approximately 3–6 months.
Moreover, the costs and overhead associated with
film-based printing have been eliminated. The
FSTopo site provides 365/24/7 access to USFS
users.
For more information, contact Byron
Taylor, GSTC project manager, USFS (e-mail:
[email protected]), or Shree Rajagopalan,
ESRI (e-mail: [email protected]).

Forestry GIS Journal 9www.esri.com/forestry
An advocate of using
technology to integrate
human and natural sys-
tems, Gary Moll has
been a force in bringing
the value of urban ecol-
ogy to the attention of
federal and local lead-
ers. Moll is the senior vice president of the
Urban Ecosystem Center at American Forests
and is one of the nation’s foremost authorities
on urban forestry and urban ecosystems.
Along his life path as a conservationist,
Moll has successfully worked with Congress
to increase funding for urban forestry and with
the U.S. Forest Service (USFS) to expand ur-
ban forestry programs to 50 states. His work
in the development of GIS software program
CITYGreen helps local governments measure
urban forests and harness their benefits.
“The human network needs to be built
with the natural system in mind,” posits Moll.
“Urban forests and green infrastructure are
part of the city ecosystem. GIS shows the re-
lationships between social and ecological sys-
tems and offers a means for us to weave the
city structure into the natural system.”
Moll and his team developed the ArcGIS
extension CITYGreen. This program makes it
possible for local communities to calculate the
functions of their natural system, attach dol-
lar values to storm water and air quality, and
use this information to make better decisions
about managing their communities.
Here is how it works. CITYGreen us-
ers classify remotely sensed data (satellite
or aerial imagery) along with climate data
from the National Oceanic and Atmospheric
Administration (NOAA) and soils data from
the Natural Resources Conservation Service
(NRCS). This data drives the scientific and
engineering models that produce accurate
measurements of how land cover affects the
movement of air and water in a particular
place. Once these volumes or quantities are
Urban Ecologist Uses GIS to Study Urban Forestry, Natural Systems, and Human NetworksBy Barbara Shields, ESRI Writer
known, they are converted to dollar estimates
that decision makers can use. The software in-
cludes models for storm water, air pollution,
carbon storage and sequestration, land-cover
breakdown, and alternate scenarios. Based
on a current land-cover map, the Alternate
Scenario model calculates the effects of future
land-cover change before those changes are
made.
For example, Mecklenburg County, North
Carolina, was the subject of a land-cover assess-
ment that used CITYGreen. The county has un-
dergone enormous growth in population. From
1984 to 2001, the county saw a 127 percent in-
crease in areas covered by impervious surfaces
(streets, parking lots, etc.). Moll’s research team
used Landsat imagery, high-resolution aerial
imagery, and GIS to assess the region. They
then calculated storm water runoff and air
quality benefits of the tree cover in the city of
Charlotte and the county as a whole.
Recently, Moll and his team studied the
Piedmont Crescent, which lies north of
Birmingham, Alabama; extends up into
southern Virginia; and includes areas within
North and South Carolina, the Appalachian
Mountains, Tennessee, and Kentucky. The task
to collect the data and maps about the region’s
many different systems was long and, at times,
tedious. Using GIS to analyze data from the
USGS, NOAA, USFS, the Census Bureau, and
the Army Corps of Engineers, the team found
the area to be much different than expected.
Ninety-nine percent of the southern forest of
the Piedmont area is gone, and 93 percent of
the forest of the Smoky Mountains is gone.
The system is in total disarray. These findings
have been published in the map book Piedmont
Crescent. One of the study’s biggest surprises
was that all of the thousands of rivers in the
Piedmont Crescent area had been altered—
every single one. In reality, the area is not a
natural system but actually an unnatural one.
A complex question is, If expansion of the
human network is inevitable, how do we man-
age its impact? It is important to determine
ways in which the human network can move
through these places without destroying them.
Questions need to be asked: What economic
and social patterns are driving the develop-
ment of a region? Where are the transportation
corridors? Where are the economic corridors?
What metro areas are nearby? How are they
linked? How is expansion and change happen-
ing? How do air and water move through these
ecosystems?
“The solution to building better communi-
ties in the future lies in learning how to interact
the natural system with the human network,”
advises Moll. “The first step is to understand
how the natural system functions, and the sec-
ond is to understand the human network’s real
needs. GIS technology can help people under-
stand how the two will interact and help guide
them to better decision making.”
Read more about American Forests at
www.americanforest.org. Download a free PDF
version of the booklet 2009 Co-Evolution at
www.americanforest.org/Co-Evolution. Contact
Gary Moll by e-mail at [email protected].
Percent Change
1986 2001 2008 1986–2008 1986–2001 2001–2008
Open Space 187.20 210.89 181.92 -2.90 11.23 -15.92
Trees 212.49 161.67 142.74 -48.86 -31.43 -13.26
Urban 126.90 155.18 202.69 37.39 18.22 23.44
Water 23.10 21.94 22.34 -3.40 -5.25 1.76
This table indicates that Mecklenburg’s urban growth occurred at the expense of trees, as opposed to open space conversion in the more distant suburbs.
Gary Moll studies natural systems.

10 Forestry GIS Journal www.esri.com/forestry
Forestry Development Centre Tapio of Finland
is using ESRI’s ArcGIS software and a solution
designed by Tieto, an ESRI business partner, to
meet Forestry Centres’ goal to decrease forest
inventory costs by 40 percent. The solution is de-
signed to improve productivity, cost efficiency,
and cooperation between organizations, includ-
ing data procurement and two-way dataflow.
It will also increase customer use of Forestry
Centre services and advice.
Working with Finland’s Ministry of
Agriculture and Forestry, Tapio supports for-
est management planning for the country’s
13 regional Forestry Centres by providing them
with information systems. To make operative
planning more effective, Tapio deployed Tieto’s
solution, which is built on ArcGIS, ESRI’s GIS
software. ArcGIS has been used to support forest
management solutions for decades. The system
enables Forestry Centres to maintain an up-to-
date, high-quality forest resource database for
the entire country.
“GIS makes geographic information easier to
use and increases the value of the data produced
by Forestry Centres and other organizations,”
says Kirsi Valanne, geographic information spe-
cialist at Tapio. “Eventually, we will expand the
system to support other operations performed by
Forestry Centres.”
GIS Forestry Tool Lowers Costs of Finnish Forest Management
Finland is a significant contributor to the
world’s commercial production of sawn goods
and pulp production. With 66 percent of Finland’s
land use dedicated to productive forests, Forestry
Centres have a lot of data to manage. Tapio proj-
ect manager Henry Schneider notes, “With this
new system, Forestry Centres can increase the
amount of annually collected forest resource
data and, at the same time, reduce the costs of
data collection per hectare.” The new GIS is
designed to support a new concept for field data
procurement based on laser scanning and aerial
photographs. This dramatically reduces the need
for fieldwork.
Each Forestry Centre provides information
that plays a key role in promoting regional
development projects, building cooperation
between forest organizations, and counseling
forest owners. Tapio’s GIS will enhance this
ability via a centralized database that contains
forest resource and management planning data.
This includes proposed cuttings and silvicultural
work; key biotopes required by the Forest Act;
cadastral data; aerial photographs; laser scan-
ning data; and external geographic data such as
topographic maps, groundwater areas, protected
areas, and prehistoric monuments.
Tapio anticipates that 400 users will interact
with the data. Eventually, Tapio hopes to expand
the user group to 850 people, who will access
GIS for forestry law supervision, forest extension
service (through public funding), forest manage-
ment planning, and forest improvement projects.
The client application is built on ArcGIS
Desktop tools. An Oracle database is connect-
ed by ArcGIS Server using SQL*Net (or Net8)
protocol. GIS interfaces with Tapio’s PDA field
data collection program, forest data calculation
application, customer relationship management
(CRM) system, financial management applica-
tions, and data transfer service. Users will be
able to connect to map servers via the Internet.
Tieto has full responsibility for the delivery of
the project. Its strong experience in implement-
ing large geographic information solutions and
its in-depth knowledge about the wood-process-
ing value chain will aid the development and im-
plementation of this project. ESRI’s distributor
ESRI Finland Oy is providing the GIS software
for the project via an enterprise license software
purchasing agreement as well as maintenance,
support services, and training.
Find out more by visiting www.tapio.fi/home
and www.Tieto.com.
Built on ArcGIS, Tapio’s project facilitates data procurement and delivers two-way dataflow between Finland’s forestry centers.
ESRI and Eagle’s Forestry ELA Reduces Software Costs
ESRI and its New Zealand software distributor Eagle Technology Group, Ltd., have launched the New Zealand Small Forestry Enterprise License Agreement (ELA) program. The agreement offers forestry companies access to ESRI software, maintenance, and training for a set annual fee based on hectares of land under management/ownership. An ELA strengthens program delivery by extending the functionality of the ArcGIS platform throughout the entire organization. This means that foresters can build a standard service infrastructure within existing budget constraints while saving time on procurement and applications development, release, and deployment. Contact a forestry representative at www.esri.com/forestry/contacts.html or www.eagle.co.nz/gis.
GIS application
Web servicesExternalgeographicdatabases
Datatransferservice
Forest datacalculationapplication
Field datacalculationapplication
Products and services:• Public funding• Customer funding, i.e., forest
management plans
Data acquisition:• Regional forest data
(inventorying and updating)• Forest management planning
Other applications inForestry Centres• CRM• Forest Authority• Forest improvement
(drainage/road construction)
• Nature management• Reporting
Imageserver
Forestdatabase
Forest owner
“UMT”
Forestry actors

Forestry GIS Journal 11www.esri.com/forestry
In an effort to mitigate the effects of climate
change, the South American nation of Guyana
is developing the world’s first national low-
carbon development strategy (LCDS). It uses
enterprise GIS technology and expertise from
ESRI. The environmental technology compa-
ny will provide Guyana with software for use
in national carbon accounting and sustainable
management of forests.
In a national announcement, Guyana’s
president, Bharrat Jagdeo, described the goal
of LCDS: “Our low-carbon strategy combats
deforestation, a factor contributing to climate
change, without slowing down national devel-
opment or compromising our people’s sover-
eignty over the forest. The emerging carbon
market provides us with a unique opportunity
to use the global economy to save the world’s
rain forests by putting a value on them.”
ESRI president Jack Dangermond met with
President Jagdeo at the office of Guyana’s
Permanent Mission to the United Nations
and committed ESRI to support the country’s
LCDS initiative.
“ESRI’s commitment brings vital technol-
ogy for studying the effects of the forest on the
planet,” said Jagdeo. “The combination of GIS
software, training, and other capacity-building
efforts will provide Guyana with the tools it
needs to scientifically measure and analyze
our natural resources effectively. With GIS, we
can support responsible resource management
decisions that benefit generations to follow.”
“ESRI’s support stems from a longtime goal
to advance sustainable environments and econ-
omies,” noted Dangermond. “GIS has become
an integral component in the development of
new carbon accounting methodologies. It adds
the rigor of science to a decision support sys-
tem that validates a credible carbon exchange
mechanism.”
The government of Norway, the World Bank,
the Clinton Climate Initiative, and McKinsey
& Company are working with Guyana to
implement the LCDS. Norway is one of the
ESRI Supports Guyana’s GIS Technology for Carbon Accounting and Tropical Forest Management
key countries backing Guyana’s move to use
its forests for carbon financing and payment
for forest conservation now. This arrange-
ment allows future innovations, including an
eventual forest carbon credit system as such a
market evolves. This strategy aligns with the
United Nations Collaborative Programme on
Reducing Emissions from Deforestation and
Forest Degradation in Developing Countries
(UN-REDD), a climate change mitigation
scheme created to pay developing countries
for conserving their tropical forests.
GIS is the core technology of Guyana’s
monitoring, reporting, and verification (MRV)
system. Building on work done in-country, the
MRV system will integrate field observations
with satellite imagery and other geographic
data using methodologies consistent with the
Intergovernmental Panel on Climate Change
(IPCC) guidelines for measuring, reporting,
and verification. Guyana will have an MRV
system for data sharing and the cross-sector
analysis that is essential for effective climate
change research, mitigation, and adaptation
planning. This enterprise approach enables
the transparent disclosure of land-use dy-
namics and the status of natural resources for
Guyana’s citizens, indigenous communities,
investors, partners, and the international car-
bon science community.
ESRI continues to work with countries
around the world, such as New Zealand,
Australia, Canada, and the United States, to
design solution models that offer a credible
scientific approach to measuring, reporting,
and verifying carbon emissions and sequestra-
tion. These systems incorporate ESRI’s robust
imagery management, integrated workflows,
spatial modeling, and analysis capabilities to
help countries use reliable data and consider
scientific evidence in their decision-making
processes.
Jagdeo presented Guyana’s LCDS at the 2009
United Nations Climate Change Conference
in Copenhagen, Denmark. Representatives of
participating nations also discussed establish-
ing emissions targets for industrialized coun-
tries and a method for financing mitigation and
adaptation actions by developing countries.
Guyana president Bharrat Jagdeo and ESRI president Jack Dangermond meet to discuss GIS for the carbon accounting program.

ESRI 380 New York Street Redlands, CA 92373-8100
Presorted Standard
U.S. Postage PaidESRI
Copyright © 2010 ESRI. All rights reserved. ESRI, the ESRI globe logo, ArcGIS, GIS Day, www.gisday.com, The Geographic Advantage, ArcIMS, @esri.com, and www.esri.com are trademarks, registered trademarks, or service marks of ESRI in the United States, the European Community, or certain other jurisdictions. Other companies and products mentioned herein may be trademarks or registered trademarks of their respective trademark owners.
11979111M5/10sp
Forestry GIS Journal is a publication of
the Forestry Group of ESRI.
To contact the ESRI Desktop Order Center,
call
1-800-447-9778
within the United States
or
909-793-2853, ext. 1-1235,
outside the United States.
View Forestry GIS Journal online at
www.esri.com/forestrygisjournal.
To submit articles for publication in Forestry GIS Journal, contact the editor, Barbara Shields, at [email protected].
Advertisers can contact [email protected]. To subscribe to ESRI publications, visit www.esri.com/subscribe. To unsubscribe from ESRI publications, visit www.esri.com/unsubscribe.
Requests for back issues, missed issues, and other circulation services may also be sent via [email protected]; by calling 909-793-2853, extension 1-2778; or by faxing to 909-307-3051.
To update your mailing address, visit www.esri.com/coa or use any e-mail, phone, or fax option.
If you are from outside the United States, please contact your international distributor to subscribe, unsubscribe, or change your address. For a directory of distributors, visit www.esri.com/distributors.
ESRI Forest Solutions GroupPeter Eredics, Forestry ManagerE-mail: [email protected]: 909-793-2853, ext. 1-2707
Mike DaLuzU.S. Forest Service Account ManagerE-mail: [email protected]: 303-449-7779, ext. 1-8283
Tim Clark, Forestry Software Engineer E-mail: [email protected]: 303-449-7779, ext. 1-8240