journal of comparative economics - daniel j. d’amico
TRANSCRIPT

Journal of Comparative Economics 43 (2015) 595–612
Contents lists available at ScienceDirect
Journal of Comparative Economics
journal homepage: www.elsevier .com/ locate/ jce
Do legal origins affect cross-country incarceration rates?
http://dx.doi.org/10.1016/j.jce.2014.11.0020147-5967/Published by Elsevier Inc. on behalf of Association for Comparative Economic Studies.
⇑ Corresponding author.E-mail addresses: [email protected] (D.J. D’Amico), [email protected] (C. Williamson).
Daniel J. D’Amico a, Claudia Williamson b,⇑a The Political Theory Project, Brown University, United Statesb Mississippi State University, United States
a r t i c l e i n f o
Article history:Received 13 May 2014Revised 29 October 2014Available online 20 November 2014
JEL classification:K14K33P5F55
Keywords:IncarcerationPrisonsLegal originsCrime
a b s t r a c t
D’Amico, Daniel J., and Williamson, Claudia—Do legal origins affect cross-countryincarceration rates?
Prison populations vary tremendously across countries. This paper investigates the poten-tial relationship between incarceration rates and legal origins in a large cross-section ofcountries. We argue that legal origins alter the relative costs associated with imprison-ment as a means for social control. Using panel data from 2001 to 2011, we find countrieswith civil legal origins have lower prison populations. Our empirical results are highlyrobust after controlling for crime rates, criminal justice resources, economic factors, polit-ical institutions, and social factors. In addition, our results do not appear to be driven bythe variation in criminalized activities. To explain these results, we conjecture thatimprisonment is a lower cost mechanism for enforcing social order in common lawcountries. In civil law countries, bureaucratic infrastructures allow for methods such asday-fines, community service, seizure of property, and probation as more affordable alter-natives to imprisonment. Journal of Comparative Economics 43 (3) (2015) 595–612. ThePolitical Theory Project, Brown University, United States; Mississippi State University,United States.
Published by Elsevier Inc. on behalf of Association for Comparative Economic Studies.
1. Introduction
‘‘The chief means of coercion at the disposal of government is punishment. Under the rule of law, government can infringe aperson’s protected private sphere only as punishment for breaking an announced rule.’’
[F.A. Hayek (1960, p. 206)]
Controlling crime is crucial for the maintenance of social order. Punishment by imprisonment is a standard method ofcriminal sanctioning to enforce government laws in virtually every nation; however, the scale of its usage varies greatly.For example, as of 2011, the United States imprisons approximately 715 per 100,000 citizens, the second highest rate inthe world. The majority of countries hold less than 150 inmates per 100,000 citizens. Burkina Faso hosts the fewest (30per 100,000) followed by Japan and Cyprus (55 per 100,000).
Casual observation of the data suggests that countries with similar levels of imprisonment range across levels of income,growth rates, geographic conditions, and regions (Mauer, 1995; Newman, 1999; Walmsley, 1999–2011, 2003). What canexplain the pattern of incarceration across countries? If a society fosters more violence and crime, a larger prison population

596 D.J. D’Amico, C. Williamson / Journal of Comparative Economics 43 (2015) 595–612
might be expected. Also, if a legal system criminalizes more behaviors, greater imprisonment will likely result. In addition,law enforcement may be more effective at catching criminals in certain countries. As such, a nation’s legal institutions mayprovide insight into how incarceration is used to control social disorder differently across countries.
Legal origins represent how a nation’s legal processes are organized based on different historical experiences, specificallywhether a nation was founded or colonized by English common law or French, German, or Scandinavian civil law. Startingwith La Porta et al. (1997, 1998) an extensive body of work illustrates that common law countries harbor financial and eco-nomic institutions more conducive to property rights, capital accumulation, trade, the freedom of contract, and foreigninvestment (see: Acemoglu et al., 2001; Glaeser and Shleifer, 2002; La Porta et al., 2008 for thorough surveys). Collectively,these findings suggest that common law nations have less hierarchical regulations and more market-oriented processes ofsocial control relative to civil law.
Legal origins also relate to social outcomes beyond the financial and economic realm such as military conscription(Mulligan and Shleifer, 2005a) and government ownership of media (Djankov et al., 2003a). Additional works show corre-lation with legal origins and the extent of regulation effecting start-up firms, labor markets, and doing business more gen-erally (Djankov et al., 2002; Botero et al., 2004; Mulligan and Shleifer, 2005b), as well as the organizational features ofgovernment courts and judicial checks and balances (Djankov et al., 2003b, 2008; La Porta et al., 2004).
In this paper, we aim to explain how legal origins may shape outcomes for criminal punishment, specifically the use ofincarceration. To do so, we collect incarceration rates for a large cross section of countries from 2001 to 2011. Our investi-gation shows that countries with lower prison populations have civil legal origins. A country colonized by English commonlaw as opposed to French, German, or Scandinavian civil law appears to host more imprisonment per capita. Specifically, civillaw is associated with smaller prison populations ranging from approximately 144 (French), 109 (German), and 185 (Scan-dinavian) fewer inmates per 100,000 citizens than common law.1 This result remains highly robust after controlling for crimerates, criminal justice resources, economic factors, political institutions, and social factors. In addition, our results do not appearto be driven by the variation in criminalizing different activities such as drugs. Our findings hold when we examine the incar-ceration of total prisoners and non-drug related prisoners.
At first our findings seem at odds with the body of work surrounding legal origins. Common law countries have less reg-ulated economic, financial, and social outcomes compared to civil law. For example, La Porta et al. (2008) write, ‘‘[i]n all thesespheres [currently researched], civil law is associated with a heavier hand of government ownership and regulation thancommon law (286).’’ However, in our study it is civil law that hosts less governmental incarceration. To explain this apparentcontradiction, we conjecture that imprisonment is likely a lower cost way for deterring crime, punishing lawbreakers, andcontrolling social disorder in common law countries; whereas civil law countries rely more affordably on bureaucratic meth-ods such as day-fines, community service, seizure of property, loss of driving rights, psychiatric treatment, drug rehabilita-tion, and probation.2
The basis for this argument can be found in Djankov et al. (2003c) where they model the institutional possibilities of acountry as an optimization of social order. The costs of private disorder are weighed against dictatorship given a nation’sunique social circumstance. ‘‘[Private] [d]isorder refers to the risk to individuals and their property of private expropriationin such forms as banditry, murder, theft, violation of agreements, torts, or monopoly pricing (p. 598).’’ Furthermore, Glaeserand Shleifer (2002, p. 1196) write, ‘‘[p]eople demand a dictatorship when they fear a dictator less than they fear each other(Olson, 1993; Grossman, 2002).’’ In reaction to their respective levels of private disorder a country’s government can imple-ment ‘‘market discipline, private legal action through courts, public enforcement through regulation, and state ownership(Djankov et al., 2003c, p. 598),’’ with each representing a marginal increase in state power and greater reliance on govern-ment institutions.3
Within this model, legal origins represent alternative frameworks for responding to private disorder. Glaeser and Shleifer(2002) suggest the early, more-peaceable social climate of England allowed greater reliance on private adjudication mech-anisms as opposed to the hierarchical controls needed to fend off greater disorder amidst the French revolution. As early asthe twelfth and thirteenth centuries, France aimed to bureaucratically unify and control its territory. England was moredecentralized and relied upon competitive lay judges and trials by jury (Dawson, 1960; Berman, 1983; Damaska, 1986).Hence, the civil legal tradition tends to have more centrally enforced and formally defined legal rules regarding financialand economic procedures than common law. La Porta et al. (2008, pp. 305–6) emphasize how different legal origin historiescreated unique opportunities and consequences for legal adaptations and subsequent policy trends.4
Given the greater prominence of bureaucratic institutions throughout civil law countries, alternative forms of punish-ment enforced through bureaucracies may substitute for imprisonment. This includes day-fines, community service, seizureof property, loss of driving rights, psychiatric treatment, drug rehabilitation, and probation. In civil law countries, these
1 Calculations are based on the average coefficients in Table 3.2 This perspective complements a variety of theoretical and empirical accounts for cross national prison populations highlighting the inverse relationship
between social welfare spending and incarceration. See: Beckett and Western (2001), Garland (2001), Lacey (2008, 2012), Harcourt (2011), Cavadino andDignan (2006a, 2006b).
3 Leeson (2008a, 2008b, 2009) argue self-enforcing exchange is more durable than commonly recognized and at least possible in some larger heterogeneouscases.
4 The distinctive criminal legal sphere of the common law developed relatively late in legal history between the sixteenth and nineteenth centuries with agreater role of government authority therein compared to economic and financial spheres (Berman 1983, 2001, pp. 306–29).

Table 1Legal origins, crime and incarceration.
Dependentvariables
Panel A: Crime rates Panel B: Criminaljustice
Panel C: Criminal enforcement
Theft Homicide Drugs Police Judges Prosecuted Convicted Convict.Rate
DrugConvict.Rate
PrisonPop.
French �175.76* �2.03* �89.79*** 26.35 8.75*** �494.96* �1405.94*** �0.12 �32.30** �143.46***
(97.765) (1.205) (19.154) (21.016) (0.848) (259.567) (312.654) (0.724) (15.902) (25.435)German �66.32 �5.74*** �60.74** �42.47* 18.99*** �591.33** �1576.11*** �1.56* �32.35* �133.84***
(88.307) (0.938) (23.203) (22.320) (1.279) (272.008) (306.673) (0.793) (17.049) (25.073)Scan. 1523.49*** �4.88*** 259.78*** �191.24*** 8.07*** 863.04 �483.31 �1.12 30.32 �233.51***
(207.802) (0.899) (44.303) (23.680) (0.603) (574.716) (398.832) (1.071) (33.318) (22.957)Log gdp pc 489.65*** �3.62*** 58.50*** 53.99*** 3.04*** 429.79*** 171.86*** �0.46 16.79*** �13.85*
(41.859) (0.457) (7.157) (7.819) (0.474) (73.233) (49.188) (0.613) (3.730) (7.308)Constant �3672.64*** 44.59*** �396.93*** �189.07** �25.28*** �2575.60*** 526.05 6.87 �104.90** 445.80***
(393.718) (4.860) (61.764) (70.322) (4.814) (601.690) (546.394) (5.808) (43.485) (81.014)Observ. 677 665 392 596 523 505 522 406 60 760Overall R2 0.38 0.15 0.45 0.11 0.33 0.11 0.15 0.01 0.33 0.12
Notes: Pooled OLS model with robust clustered (by country) standard errors in parentheses.See Appendix A for all variable description.
* p < 0.1.** p < 0.05.
*** p < 0.01.
D.J. D’Amico, C. Williamson / Journal of Comparative Economics 43 (2015) 595–612 597
alternative penalties are, on the margin, more affordable and can be more easily monitored and publically administered thanunder the common law.5 Although, incarceration represents a relatively formalized technique of legal punishment, it may carryhigher perceived benefits and lower marginal costs under common compared to civil law (Djankov et al., 2008, p. 437). In otherwords, different organizational structures across legal origins shape the relative costs and benefits of incarceration. Withoutextensive bureaucracies already in place, common law territories opt for more severe and codified penalties via imprisonmentover civil law countries.
The observed relationship between common law and prison populations might be explained by multiple arguments.For example, economic performance could drive the level of incarceration. Higher incomes may foster incentives forcriminal behavior through inequality or social disruption (Rusche and Kirchheimer, 1939; Foucault, 1975; Wilkins,1991; Wacquant, 1999, 2001; De Giorgi, 2006). Also, wealthier countries can afford to imprison criminals (Levitt,1998; Kessler and Levitt, 1999). In contrast, a wealthier country can afford to develop rules and enforcement mecha-nisms to deter criminal activity reducing the need to incarcerate (Kleiman, 2009). In addition, the effectiveness of thecourt system determines the ease of both prosecution and conviction. This could affect both sentencing policies andthe use of imprisonment.
To address these concerns, we present basic preliminary results examining the differences between civil and common lawcountries in crime rates, criminal justice resources, and criminal enforcement. We also examine the relationship betweenlegal origins with drug offenses and drug conviction rates. This is done to minimize concerns that common law countriescriminalize more activities thus driving higher incarceration. We present these results in Table 1 below. For each specifica-tion, we use a pooled OLS model and control for French, German, and Scandinavian legal origins as well as log GDP per capita.
In panel A, our dependent variables are types of crime rates. We use homicide rate (per 100,000), theft (per 100,000), andthe number of drug offences (per 100,000). As illustrated in columns (1)–(3), there is no systematic evidence that, on average,civil law countries have lower crime rates. Homicide rates are significantly lower in civil law countries. Scandinavian coun-tries have a strong positive association with theft and drug offences, while French countries have significantly lower theftsand drug offences. German countries have a negative and significant relationship with drug offences. Income per capita doesnot consistently predict crime. It is positively and significantly related to theft and drug offences but negatively related tohomicide rates.
In Panel B, we measure criminal justice resources with the number of judges (per 100,000) and the number of police (per100,000). German and Scandinavian countries have significantly fewer police. All civil law countries have significantly morejudges, consistent with legal origins theory. Income per capita positively and significantly relates to both judges and police aswealthier countries can afford to hire more judges and police.
5 The country reports for France (Borricand, 1993), Germany (Aronowitz, 1993), Sweden (Wikstrom and Dolmen, 1993), and Finland (Joutsen, 1993),compiled as part of the World Fact Book of Criminal Justice Systems (Newman et al., 2002), list the following as alternative penalties to imprisonment: fines,seizure of property, closing down of establishments, and community service (France), day-fines based upon the offender’s income, instruction, declaration ofguilt without imposition, community service and probation (Germany), psychiatric treatment, probation, community service, treatment within the socialservices, and fines (Sweden), day-fines and community service (Finland).

598 D.J. D’Amico, C. Williamson / Journal of Comparative Economics 43 (2015) 595–612
Lastly, in Panel C, we proxy for criminal punishment by the number prosecuted per 100,000, convicted per 100,000, theconviction rate (measured as conviction per prosecution), the drug conviction rate, and our main variable of interest, theincarceration rate per 100,000. An interesting result emerges—civil legal origins are not consistently related to any othercriminal enforcement measure but incarceration. French and German countries prosecute and convict significantly less indi-viduals. Only German countries have significantly lower overall conviction rates, while both French and German countrieshave fewer drug convictions.6 The last column shows that all three civil legal origins are negatively and significantly correlatedwith prison population rates. French legal nations have smaller prison populations by approximately 143 inmates (per 100,000),German by about 133 (per 100,000), and Scandinavian by approximately 233 (per 100,000). Income per capita is negative andsignificant.
Collectively, these results provide support for our core thesis that common law countries rely on incarceration more thancivil law countries for reasons other than differences in crime, criminal justice resources, and the ability to prosecute or con-vict criminals. In fact, there are no systematic differences between the convictions of criminals across civil law countries. Theonly significant difference is the manner in which criminals are punished. We provide additional support for this relationshipin the empirical section below.
Investigations of the potential relationships between diverse legal institutions and prison outcomes are limited (see:Cavadino and Dignan, 2006a, pp. 3–30; Brodeur, 2007; Lacey, 2008, pp. 3–55; 2012 for thorough surveys).7 We narrow thisgap by drawing from the legal origins literature. First, we offer theoretical insight arguing that the alternative frameworks forreacting to social disorder represented by legal origins shape the costs and benefits of incarceration. Second, we trace theinfluence of legal origins beyond the financial and economic spheres. Given that imprisonment is a primary means of criminalpunishment and regulatory compliance around the world, recognizing the institutional sources of different incarceration ratesmay be central to understanding how legal origins and historical experiences shape institutions more generally.
2. Empirical strategy and data description
We implement pooled OLS8 analysis on an unbalanced panel from 2001 to 2011 using 113 countries, as data is not availablefor most countries across every year.9 This is a common issue when analyzing cross-country data (Acemoglu et al., 2001, 2002;Soares, 2004a, 2004b; La Porta et al., 2008).10 We use pooled OLS over random effects given its simplicity and straightforwardassumptions. However, we rerun all regressions presented in the following tables below using a random effects model. Theseresults can be found in the online Appendix. The results are unchanged.
Due to the limited nature of the data, we recognize potential reverse causality and endogeneity; therefore, we emphasizethe difficulty in claiming strong causal inferences. We seek to provide preliminary explanation for our observations consis-tent with previous works surrounding legal origins.11 Appendix A provides a detailed list of all variables including data andsource information. Appendix B lists all countries included in the analysis. We briefly summarize our variables below.
To measure incarceration rates (our dependent variable), we rely on the United Nations Office on Drug and Crime(UNODC) Survey on Crime Trends and the Operations of Criminal Justice Systems.12 Prison population is measured as totalpersons held in penal institutions per 100,000 inhabitants.
A country’s legal origin is measured by its respective tradition using dummy variables classified as English, German,French, or Scandinavian. The data is collected from La Porta et al. (2008). This most recent classification no longer distin-guishes legal origins by socialist tradition. Instead, former socialist countries are reclassified as either German or Frenchaccording to the main historical influence on their new legal system. For example, Russia is classified as having French legal
6 We note that in the random effects model, as shown in the online Appendix Table 1, there is no significant relationship between any measure of civil lawand conviction rates including drug crimes.
7 In a sample of the 100 wealthiest nations using OLS techniques, Ruddell (2005) finds similar correlation between imprisonment and common legal origin,represented by Newman’s (1999) dummy variables. Greenberg and West (2008) find correlation between common law (as measured by Mukherjee and Reichel1999) and the death penalty. In an online working paper, Spamann (2008 unpublished) investigates the relationship between legal origins and prisonpopulations. The sample includes 214 observations for a single year where his main correlation with legal origins is similar to ours.
8 Standard errors are clustered by country.9 Prison population for a small subset of countries is available before 2001. However, we choose 2001 as our starting point due to the much larger number of
countries that are included.10 Most studies analyzing international incarceration rates limit their analysis to advanced democracies or OECD countries. Sutton (2004) performs pooled
regression from 15 nations over a 30-year period finding literate, developed, non-socialist but leftist democracies are less likely to have the death penalty.11 Some research contests the meaningfulness of the legal origins categories (Graff, 2008; Helland and Klick, 2011). Others question the exogenous nature of
legal origins as colonial strategies differed across English common law and French civil traditions (Klerman et al., 2011; Dari-Mattiacci and Guerriero, 2011).Similarly, Spamann (2010) finds ‘‘no systematic difference in the complexity, formalism, duration, or cost of procedure in courts of first instance (149).’’Guerriero (2011) argues legal origins are proxies for the weakness of democracy and cultural heterogeneity but agrees that institutional forms related toeconomic performance are slow changing and historically shaped. We do not believe these criticisms are of concern for our analysis as our investigationdepends only upon the slow changing and historically embedded nature of institutional differences. In addition, legal origins seem relatively exogenouscompared to contemporary penal policies and prison population outcomes regardless of colonial strategies.
12 Objective national measures of crime and punishment for comparative purposes are difficult to obtain as various regimes criminalize different behaviors(Newman, 1999), sometimes produce unreliable reports (Soares, 2004a, 2004b), and use alternative punitive techniques (Reichel, 2002). Most researchersadmit some incommensurability of prison rates as an indicator of general severity across legal regimes (Pease, 1992, 1994). China for example, executes agreater number for more menial violations than the United States. Despite such challenges, incarceration rates have proven useful and remain the bestmeasures available of criminal punishment by detainment.

Table 2Summary statistics.
Variable Panel A: Panel summary statistics Panel B: Mean by legal origins
Observ Mean Std Dev Min Max English French German Scan.
Prison Pop Rate 771 199.44 198.84 27.09 2901 281.95 158.50 180.11 63.93English 771 0.25 0.43 0.00 1.00 1.00 0.00 0.00 0.00French 771 0.46 0.50 0.00 1.00 0.00 1.00 0.00 0.00German 771 0.23 0.42 0.00 1.00 0.00 0.00 1.00 0.00Scan 771 0.07 0.25 0.00 1.00 0.00 0.00 0.00 1.00Log GDP pc 760 9.63 1.03 6.53 11.75 9.38 9.23 9.77 10.67Homicide 674 6.84 11.06 0.00 91.40 12.46 9.83 3.08 1.14Theft 686 1095.5 1193.3 0.91 9295 973.49 644.68 1019.8 3007.3Safe Alone 674 61.59 14.90 27.60 94.40 64.44 57.19 60.96 78.11Assaulted 676 5.58 4.12 1.00 28.00 6.60 7.46 3.65 3.19Property Stolen 676 13.28 6.06 3.20 43.00 15.63 14.11 11.54 11.44Judges 525 14.42 11.70 0.19 59.59 5.92 11.53 21.46 15.17Police 601 322.59 180.10 10.70 17656 347.26 341.13 314.70 196.79Drugs 398 138.88 187.09 0.12 891.74 133.41 67.51 108.39 490.42Growth 771 3.74 4.62 �17.96 34.50 2.85 4.54 4.08 1.85Unemp 763 8.59 5.45 0.40 37.30 9.00 8.90 9.81 5.40Male LF Part. 771 72.35 7.82 44.90 95.30 76.53 74.65 66.83 71.13EFW 666 7.15 0.89 2.88 9.07 7.09 6.79 7.20 7.73Urban 771 0.66 0.20 0.10 1.00 0.55 0.64 0.65 0.85Arms imports 545 16.07 40.79 0.00 522.79 35.29 7.40 7.84 29.12Polity2 719 6.62 5.37 �10.00 10.00 4.33 4.55 7.25 10.00Voice 711 0.79 0.20 0.00 1.00 0.72 0.69 0.84 0.99Political Stab. 711 0.76 0.09 0.46 0.98 0.72 0.74 0.77 0.83Rule of Law 711 0.70 0.21 0.08 1.00 0.66 0.61 0.73 1.00Corruption 711 0.51 0.22 0.00 1.00 0.48 0.41 0.47 0.90Communism 616 0.18 0.29 0.00 0.83 0.00 0.16 0.45 0.00Jud. Indepd. 324 0.81 0.26 0.00 1.00 0.94 0.65 0.78 1.00Death Penalty 643 0.36 0.48 0.00 1.00 0.68 0.38 0.24 0.00Protestant 637 14.51 26.24 0.00 97.80 12.26 1.52 13.08 90.22Catholic 637 37.76 38.74 0.00 97.30 21.88 47.12 31.71 0.62Education 683 103.46 7.58 67.66 139.16 104.88 104.50 102.84 99.79Ethnic Frac 637 0.34 0.23 0.00 0.93 0.43 0.41 0.32 0.08Lang. Frac 628 0.31 0.23 0.00 0.92 0.44 0.32 0.30 0.12Relig. Frac 637 0.40 0.23 0.00 0.86 0.49 0.31 0.52 0.22Trust 586 27.86 13.81 6.90 63.77 30.24 20.71 26.54 56.35Prefer Prison 292 32.93 16.52 10.00 76.00 48.28 33.99 30.96 20.14Nondrug Prison Rate 410 134.15 105.88 25.74 562.27 167.15 132.77 159.51 49.01Drug Prison Rate 410 35.00 62.75 4.01 402.91 69.51 31.09 15.72 14.93Drug Prison Ratio 410 0.19 0.12 0.02 0.58 0.22 0.21 0.11 0.24GDP per capita 760 23,057 19,649 688 126,818 22,203 18,021 20,660 43,880
D.J. D’Amico, C. Williamson / Journal of Comparative Economics 43 (2015) 595–612 599
origin. Of the 24 former socialist countries in our sample, 11 have French and 13 have German origin. The empirical modelspecifications include French, German, and Scandinavian legal origins omitting English legal origin (Djankov et al., 2008; LaPorta et al., 2008).
In addition to legal origins, all specifications control for income per capita measured by log gross domestic product percapita (PPP, constant 2011 international dollar) collected from World Development Indicators (2014).
We control for actual crime rates, including theft and homicide, as more crime could relate to higher incarceration rates.We also include the number of drug offences. All crime variables are collected from UNODC statistics and measured per100,000 persons. In addition, we include three measures from Gallup WorldPoll to capture perceptions of crime. First, weinclude the percentage of respondents who feel safe walking alone. The second captures those who have personally had,or have a household member who has had, money or property stolen in the past twelve months. We also include the per-centage of individuals reported being assaulted or mugged in the past twelve months. Lastly, we include two criminal justicemeasures, the number of police and the number of judges, per 100,000 (also collected from UNODC).
We also include a variety of economic and political variables to minimize omitted variable bias. Standard economic con-trols include economic growth, unemployment rates, male labor force participation, percent urban population, and armsimports (collected from World Development Indicators, 2014). We include a measure of economic freedom to control foreconomic institutions (Gwartney et al., 2013).
Next, we introduce a variety of measures to capture the quality and type of political institutions. Four measures comefrom the Worldwide Governance Indicators (2013) including voice and accountability, political stability, rule of law, and con-trol of corruption. We also include a variable that captures a country’s history with communism (Barro and McCleary, 2003).Lastly, judicial independence is included (La Porta et al., 2004).
600 D.J. D’Amico, C. Williamson / Journal of Comparative Economics 43 (2015) 595–612
In order to provide an overview of the dataset and differences among legal traditions, we present summary statistics andthe mean value of each variable by legal origin in Table 2. We include 34 common law countries, 54 French, 19 German, and5 Scandinavian legal origin countries.
Over the entire sample, the average incarceration rate is approximately 199 per 100,000 with a standard deviation of 199per 100,000 highlighting the wide variation. As highlighted in Panel B, the average prison population in common law coun-tries is approximately 282—over 50 percent higher than any of the civil law country averages (French 159, German 180, andScandinavian 64).
The average GDP per capita is $23,057 with a standard deviation of about $19,649. Scandinavian countries record thehighest incomes per capita of $43,880. Common law countries record the next highest with average incomes close to themean ($22,203). German countries have an average income per capita of $20,660. French countries record the lowest with$18,021 average income per capita.
3. Empirical results
3.1. Benchmark results
Table 3 presents benchmark regressions examining cross country incarceration rates and legal origins. We control forlegal origins, log gdp per capita, crime rates, and criminal justice measures. We include controls separately as well assimultaneously.
French, German, and Scandinavian civil legal origins are negative and highly significant. Column (1) reports the bench-mark specification provided in Table 1 for comparison purposes. Column (2) includes homicide rates and theft to captureboth violent and property crime. Homicide is positively and significantly related to incarceration; theft is positive but notsignificant. For example, a one standard deviation increase in homicide rates (about 11 per 100,000) increases the numberof prisoners by about 60 (per 100,000). Legal origins remain negative and significant after controlling for crime.13
Next, we include two measures of criminal justice resources, the number of judges and the number of police. The resultsare shown in column (3); both are positive but only police is significant at the 10% level. A one standard deviation increase inpolice increases incarceration by about 28 inmates (per 100,000). Homicide remains significant and theft is now positive andsignificant. Legal origins remain significant.
In column (4), we switch from measuring crime rates collected from UNOCD to crime collected from Gallup World Poll(2012) survey data, including feeling safe walking alone, if someone had property stolen, or if an individual had beenassaulted. All three enter negatively in the regression, but only feeling safe walking alone and assaulted is significant. Forexample, a one standard deviation increase in feeling safe walking alone is associated with about 65 (per 100,000) fewerprisoners. Most importantly, all three measures of legal origins remain negative and significant but with lower coefficients.
In column (5), we include all measures of crime as well as judges and police. French, German, and Scandinavian legal ori-gins remain negative and highly significant with fewer inmates (per 100,000) ranging from 132 (German) to 163 (French) to192 (Scandinavian).
Lastly, in column (6), we include the number of drug offences to proxy for differences in criminalizing behaviors. Thecriminality of drugs is common across most countries, yet drug enforcement varies tremendously with countries like theUnited States declaring a ‘war on drugs.’ Few others like Portugal have significantly relaxed enforcements against a varietyof substances (Loo et al., 2002; Hughes and Stevens, 2010). The results show German legal origin loses significance with thisinclusion. French and Scandinavian countries still host lower prison populations, 109 and 99 per 100,000, respectively. Drugoffences are not significant. The number of observations drops significantly making it difficult to compare the results. Wefurther examine the criminalization of drugs and incarceration in a later section.
The R-squareds vary based on the specification with the highest coming from the last specification controlling for drugcrimes (0.43) and the lowest when only controlling for legal origins (0.12).
3.2. Economic controls
Next, we examine the robustness of legal origins by incorporating the relationship between economic outcomes andincarceration rates. We introduce a wide range of economic controls including economic growth, economic freedom, unem-ployment rate, male labor force participation, percent urban population, and arms imports.
Previous theoretical literature suggests a relationship between economic institutions, outcomes and prison populations.For example, business cycle volatility may negatively relate to prison populations as worsening economic conditions incen-tivize crime (Rusche and Kirchheimer, 1939; Cavadino and Dignan, 2006a, 2006b); however, the empirical results are ambig-uous (Neapolitan, 2001; Sutton, 2000, 2004; Ruddell, 2005). In addition to log GDP per capita, we also include the annualeconomic growth rate to incorporate this argument. In addition, we also examine the role of economic freedom as it is
13 To show the parallel nature of cross sectional OLS results we offer this brief summary: civil law origins were associated with smaller prison populationsranging from approximately 124 (French), 108 (German) and 182 (Scandinavian) fewer inmates per 100,000 citizens than common law nations. These resultsare available upon request.

Table 3Incarceration and legal institutions benchmark model.
Dependent variable: Prison population per 100,000
(1) (2) (3) (4) (5) (6)
French �143.46*** �157.62*** �203.96*** �94.42*** �163.63*** �109.09**
(25.435) (29.384) (31.928) (21.869) (30.836) (38.586)German �133.84*** �115.68*** �151.62*** �97.79*** �132.34*** �30.10
(25.073) (27.274) (33.808) (21.374) (34.592) (36.261)Scan. �233.51*** �234.95*** �217.37*** �136.95*** �192.00*** �99.82***
(22.957) (31.906) (33.829) (20.297) (34.236) (22.466)Log gdp pc �13.85* �18.59 �74.73*** �4.43 �35.95** �93.36***
(7.308) (13.008) (17.713) (8.187) (17.855) (22.342)Homicide 5.44*** 2.48*** 2.74** 1.26
(1.117) (0.732) (0.982) (0.972)Theft 0.01 0.01** 0.00 0.01*
(0.008) (0.006) (0.004) (0.004)Judges �0.67 �0.18 �1.38**
(0.523) (0.586) (0.681)Police 0.16* �0.10 0.03
(0.090) (0.060) (0.061)Safe Alone �4.35*** �3.03**
(0.529) (0.924)Assaulted �7.59** �8.18**
(2.575) (4.107)Property Stolen �0.21 3.19
(1.800) (2.193)Drugs �0.01
(0.035)Constant 445.80*** 452.98** 1019.93*** 614.91*** 879.07*** 1155.19***
(81.014) (138.462) (176.776) (92.682) (166.400) (245.803)Observ. 760 617 415 663 395 224Overall R2 0.12 0.21 0.34 0.19 0.34 0.43
Notes: Pooled OLS model with robust clustered (by country) standard errors in parentheses.See Appendix A for all variable description.
* p < 0.1.** p < 0.05.
*** p < 0.01.
D.J. D’Amico, C. Williamson / Journal of Comparative Economics 43 (2015) 595–612 601
documented that economically free countries experience higher economic growth, less violent crime, and better reporting ofcrimes (Easton and Walker, 1997; Gwartney et al., 1999; Mahoney, 2001; Soares, 2004a, 2004b; Stringham and Levendis,2010).
Labor market conditions may also relate to incarceration rates (Western and Beckett, 1999; Western and Pettit, 2000) butprevious literature is inconclusive on this relationship. Intuitively, it makes economic sense that imprisonment is positivelyrelated to unemployment (Chiricos and Delone, 1992) and negatively related with higher employment (Marvel and Moody,1994). However, Sutton (2004) finds (surprisingly) high labor force participation positively and significantly impacts incar-ceration rates. As such, we include two measures related to employment, the unemployment rate and male labor force par-ticipation. Unemployment refers to the share of the labor force that is without work but available for and seekingemployment. Labor force participation rate is the proportion of the male population ages 15–64 that is economically active.
Urban population may relate to crime as higher concentrations of more diverse populations represent a greater opportu-nity for private disorder and the organization of criminal networks (Glaeser, 1999); therefore, we include the percentage ofthe population living in an urban area. The availability of handguns and firearms via imports may also relate to crime, thoughprecisely how is unclear. Higher quantities make guns more available for criminals but also more accessible for self-defense(Lott and Mustard, 1997). We include arms imports to control for these effects.
Table 4 above introduces the economic controls. In all seven regressions, French, German, and Scandinavian legal originsnegatively and significantly relate to incarceration rates. Based on the average of all specifications, both French and Germanlegal origins lower incarceration by about 116 inmates per 100,000. Scandinavian legal origin has almost twice the impactreducing the number of prisoners by approximately 205 per 100,000, slightly higher than the mean of incarceration.
The only economic controls that are significant relate to employment. The unemployment rate is positive and significantwhile male labor force participation rate is positive and significant.14 Overall, these results suggest that legal origins hold amore robust relationship to incarceration than economic institutions or outcomes. In addition, the R-squareds are almost iden-tical when only controlling for legal origins (see Table 3 above).
14 In the random effects model shown in the online Appendix Table 3, all economic controls are insignificant.

Table 4Incarceration and Legal Institutions with Economic Controls.
Dependent variable: Prison population per 100,000
(1) (2) (3) (4) (5) (6) (7)
French �145.19*** �98.38*** �147.83*** �104.09*** �142.86*** �80.24*** �98.87***
(25.300) (18.086) (25.000) (19.093) (24.553) (21.546) (21.165)German �134.76*** �94.05*** �147.88*** �130.32*** �133.68*** �78.34*** �114.19***
(24.971) (18.882) (24.053) (19.357) (24.790) (23.206) (24.521)Scan. �232.34*** �192.19*** �232.42*** �208.21*** �232.88*** �166.77*** �177.37***
(23.187) (17.802) (23.040) (18.885) (22.367) (22.215) (23.472)Log gdp pc �13.06* �5.80 �11.75 3.72 �12.83 �2.53 2.37
(7.342) (6.688) (7.265) (11.508) (8.838) (8.612) (13.553)Growth 1.53 1.18
(1.189) (1.592)Unemp. 2.12** 4.67**
(0.901) (1.430)Male LF Part. �2.56** �2.09**
(0.836) (0.971)EFW �11.73 1.86
(10.450) (9.687)Urban �6.84 45.24
(44.952) (57.440)Arms �0.05 �0.10
(0.114) (0.132)Constant 433.43*** 306.80*** 632.81*** 323.87*** 440.08*** 265.13** 311.55**
(82.037) (70.697) (87.924) (82.968) (79.770) (81.834) (122.838)Observ. 760 752 760 655 760 534 494Overall R2 0.12 0.12 0.13 0.14 0.12 0.09 0.14
Notes: Pooled OLS model with robust clustered (by country) standard errors in parentheses.See Appendix A for all variable description.
* p < 0.1.** p < 0.05.
*** p < 0.01.
602 D.J. D’Amico, C. Williamson / Journal of Comparative Economics 43 (2015) 595–612
3.3. Political controls
Next, we examine how political institutions relate to incarceration by including a variety of measures to proxy for thequality and type of political institutions. We include a broad measure of democracy, voice and accountability. This measurecaptures the extent to which a country’s citizens are able to participate in selecting their government, the level of militaryinvolvement in politics, the freedom of expression and association, and a free media. Given previous findings, democracymay act as a constraint on forms of dictatorial power (Mulligan et al., 2004) perhaps including incarceration. However, publicopinion also shapes democratic outcomes implying that if the public desires more severity, democracy will foster punitivityand thus correlate with higher incarceration (Scheingold, 1984; Pratt, 2007; Enns, 2014).
In addition, we include measures of political stability, rule of law, and control of corruption. Political instability couldcreate opportunities and incentives for crime. In addition, political dissent is more likely criminalized in unstable regimes.The rule of law may impact incarceration as a weak rule of law could imply a high rate of false or frivolous imprisonment.Previous research demonstrates a consistent relationship between the extent of legal formalism within civil law contextsand the level of corruption (Shleifer and Vishny, 1993). As such, it seems reasonable for incarceration to be more leveragedby corrupt regimes.
We also include a country’s history with communism, measured by average number of years under communism from1925 to 2000 (Barro and McCleary, 2003). Under communism the scope of ‘‘dictatorship’’ was radically expanded, ‘‘in whichall economic policy is a tool used to maintain the political control by the Communist party (Kornai, 1992; Djankov et al.,2003c, p. 604).’’ As such, communist governments required enforcement techniques beyond the capacities of bureaucraticinfrastructures often resulting in totalitarian methods. Communism’s legacy had lasting influence on the efficacies of tran-sition (Treisman and Shleifer, 2005); thus it is not surprising for enforcement trends such as incarceration to persist.
Lastly, judicial independence is included as it is arguably the cornerstone of common law, thus capturing the beneficialflexibility of legal rules.
In Table 5 below, we present the robustness of legal origins with the inclusion of political institutions. In all regressions,legal origins retain their respective sign and significance. For example, in column (1), with the inclusion of voice and account-ability, French legal origin reduces the prison population rate by about 98 inmates (per 100,000), German legal origin hosts89 fewer inmates (per 100,000), and Scandinavian legal origin incarcerates 186 fewer inmates (per 100,000). Voice is positivebut not significant. In all regressions, rule of law significantly reduces the rate of incarceration. A one standard deviation

Table 5Incarceration and legal institutions with political controls.
Dependent variable: Prison population per 100,000
(1) (2) (3) (4) (5) (6) (7) (8) (9)
French �98.06*** �99.20*** �107.02*** �108.61*** �114.58*** �72.29*** �78.56*** �159.33*** �112.51***
(19.131) (19.136) (18.365) (18.972) (19.142) (18.191) (17.222) (27.733) (22.567)German �89.03*** �94.61*** �91.86*** �104.77*** �104.23*** �142.72*** �135.93*** �235.10*** �220.48***
(20.718) (19.620) (18.929) (19.547) (21.171) (22.307) (21.048) (27.907) (26.675)Scan. �186.82*** �195.82*** �162.19*** �152.76*** �147.78*** �181.17*** �145.98*** �198.92*** �191.80***
(19.630) (19.010) (17.921) (20.110) (20.181) (21.558) (19.544) (26.845) (25.842)Log gdp pc �4.05 �10.03 12.20 11.13 16.76* 31.22*** 70.34*** 54.26** 78.89***
(8.974) (7.632) (7.901) (8.323) (8.797) (6.415) (10.066) (16.695) (14.985)Voice �50.17 11.63 �179.66*** 126.18* �72.50
(38.495) (42.376) (37.237) (73.554) (48.864)Political Stab. 32.92 94.50 106.56** 68.16 107.25
(68.675) (67.240) (53.022) (65.340) (66.475)Rule of Law �179.12*** �142.28*** �137.61*** �406.53*** �305.06***
(29.164) (33.559) (34.149) (64.202) (56.821)Corruption �163.04*** �111.98** �26.37 11.31 77.46
(37.404) (43.746) (38.792) (59.732) (48.596)Communism 238.89*** 223.64*** 257.02**
(22.579) (24.540) (121.947)Jud. Indep. 32.77 5.40
(27.445) (28.342)Constant 344.42*** 340.03*** 275.90*** 246.13** 187.44** �86.94 �287.62*** �132.84 �371.58**
(78.893) (82.698) (73.450) (76.544) (79.610) (54.060) (66.155) (138.117) (114.555)Observ. 700 700 700 700 700 609 587 321 310Overall R2 0.12 0.12 0.15 0.14 0.15 0.25 0.31 0.29 0.33
Notes: Pooled OLS model with robust clustered (by country) standard errors in parentheses.See Appendix A for all variable description.
* p < 0.1.** p < 0.05.
*** p < 0.01.
D.J. D’Amico, C. Williamson / Journal of Comparative Economics 43 (2015) 595–612 603
increase in rule of law decreases the number of inmates, on average, by approximately 49 per 100,000. Controlling corrup-tion is negative and significant in two of the five regressions.15
In column (6), we introduce a measure of how long a country was under communist rule. Legal origins remain negativeand significant; however the coefficient on French legal origin is reduced by this inclusion. The measure of communism ispositive and highly significant. Comparing a country that never experienced communism, for example, Japan, to a countryunder the longest communist rule, e.g. Russia, incarceration rates are larger under communism by about 239 inmates(per 100,000).16 A one standard deviation increase in the length of communism (the difference between Germany and Poland’sexperience) increases the prison population rate by about 69 inmates (per 100,000).
In column (7), we include voice, political stability, rule of law, control of corruption, and communism. Legal origins andcommunism retain their respective signs and significance with similarly sized coefficients. In column (9), we introduce judi-cial independence. It is not significant. In column (10), we include all measures of political controls. Legal origins remainsignificant.
Collectively, these results suggest that, on average, French, German, and Scandinavian legal origins host lower prison pop-ulation rates by approximately 105, 134, and 173, per 100,000, respectively. In addition, nations experiencing a long historyof communism have greater prison populations by about 239 inmates per 100,000. By including communism, the adjusted R-squareds increase from 0.12 to 0.25.
In Table 6, we include both economic and political controls for robustness. For comparison purposes, column (1) is abenchmark replication from a regression in Table 2 controlling for legal origins, log GDP per capita, homicide, theft, judges,and police. In column (2), we include all benchmark controls as well as all economic controls. Legal origin remains negativeand significant. In column (3), we add the main political controls with a similar finding. Lastly, in column (4), we include thebenchmark economic and political controls now including communism. We find similar results.
4. Sensitivity tests
To provide additional support for our results, we include two robustness checks controlling for additional variables and analternative measure of incarceration—non-drug prisoners. Our results hold. French, German, and Scandinavian legal tradi-tions remain negative and significant.
15 This significance goes away in the random effects model presented in the online Appendix.16 Countries that have the longest experience with communism are Russia, Ukraine, Armenia, Azerbaijan, Belize, Georgia, and Kyrgyz Republic.

Table 6Incarceration and Legal Institutions with Economic and Political Controls.
Dependent variable: Prison population per 100,000
(1) (2) (3) (4)
French �203.96*** �169.01*** �143.94*** �112.98***
(31.928) (35.946) (32.992) (29.169)German �151.62*** �145.87*** �140.88*** �191.74***
(33.808) (42.557) (38.831) (35.331)Scan. �217.37*** �216.79*** �162.32*** �200.54***
(33.829) (42.249) (35.678) (33.146)Log gdp pc �74.73*** �1.77 42.95 109.52***
(17.713) (26.941) (31.629) (27.513)Homicide 2.48*** 3.45** 2.58* 4.85***
(0.732) (1.254) (1.475) (1.190)Theft 0.01** �0.00 0.01 0.00
(0.006) (0.005) (0.005) (0.005)Judges �0.67 �0.76 �0.14 1.05
(0.523) (0.671) (0.711) (0.689)Police 0.16* 0.02 �0.12 �0.19**
(0.090) (0.092) (0.091) (0.078)Growth 0.07 �0.91 �0.71
(1.934) (1.756) (1.279)Unemp. 1.49 3.23 2.71
(2.209) (2.139) (1.652)Male LF Part. �6.38*** �6.67*** �1.35
(1.313) (1.563) (1.281)EFW 11.59 57.69*** 26.01*
(13.468) (15.784) (14.230)Urban 77.97 26.12 26.29
(70.507) (74.902) (67.000)Arms �0.32 �0.83** �0.91**
(0.249) (0.308) (0.293)Voice �400.59*** �498.97***
(106.098) (101.043)Political Stab. �84.00 13.19
(89.377) (80.802)Rule of Law 122.10 187.28**
(91.288) (77.496)Corruption �253.55** �145.43*
(85.159) (82.064)Communism 286.04***
(30.102)Constant 1019.93*** 673.18** 416.72 �571.73**
(176.776) (236.467) (308.875) (214.112)Observ. 415 300 299 284Overall R2 0.34 0.27 0.36 0.48
Notes: Pooled OLS model with robust clustered (by country) standard errors in parentheses.See Appendix A for all variable description.
* p < 0.1.** p < 0.05.
*** p < 0.01.
604 D.J. D’Amico, C. Williamson / Journal of Comparative Economics 43 (2015) 595–612
4.1. Social controls
The first robustness check introduces a variety of social controls including the death penalty, religion, education, socialheterogeneity, civic capital, and severity for criminal punishment.
First, we include a proxy for public opinion regarding harshness toward criminal penalties. This includes a death penaltydummy variable equal to 1 if a country has the death penalty in law (regardless of actual use); equal to 0 otherwise. This iscollected from Amnesty International (2014). Previous literature suggests incarceration and the death penalty correlate asboth reflect public preferences for punitivity (Mukherjee and Reichel, 1999; Ruddell, 2005; Greenberg and West, 2008;Spamann, 2008 unpublished). In addition, we include a proxy for preferences toward punishment. This variable comes fromthe International Crime Victims Survey (ICVS) (van Dijk et al., 2007) capturing the public’s punishment preferences mea-sured as a percentage of the public preferring imprisonment instead of community service for recidivist burglary.
We include a measure for the percentage of the population that is Protestant or Catholic. It is argued that religion impactsthe level of government intervention (La Porta et al., 1999) and that theological doctrine significantly shapes penal philos-ophy through history (Berman, 1983, 2001). We also measure education as a percent of the population enrolled in primaryeducation (World Development Indicators, 2014) as the positive externalities of education likely include deterrent effectsupon crime (Everingham and Rydell, 1994; Tauchen et al., 1994; Usher, 1997). Measures of ethnic, linguistic and religious

Table 7Incarceration and Legal Institutions with Social-Economic Controls.
Dependent variable: Prison population per 100,000
(1) (2) (3) (4) (5) (6) (7)
French �116.44*** �91.14*** �101.17** �123.64*** �60.73** �115.41*** �146.01***
(28.394) (23.410) (31.166) (31.912) (25.579) (28.650) (34.945)German �174.25*** �184.81*** �205.12*** �184.53*** �162.37*** �171.45*** �190.32***
(33.296) (29.277) (37.965) (38.498) (30.550) (33.692) (34.257)Scan. �209.16*** �170.41*** �341.80*** �221.43*** �126.07*** �220.12*** �186.47***
(33.948) (26.059) (66.965) (39.891) (27.375) (40.757) (29.274)Log gdp pc 56.24*** 46.16*** 43.55*** 55.34*** 55.57*** 56.65*** 221.25***
(12.544) (11.406) (10.766) (16.247) (14.035) (12.691) (51.340)Homicide 5.34*** 3.86*** 4.28*** 5.25*** 3.58** 5.07*** 8.64***
(0.564) (0.571) (0.488) (0.641) (1.195) (0.539) (2.007)Theft 0.00 0.01** �0.00 �0.00 �0.00 0.00 �0.01**
(0.004) (0.005) (0.004) (0.004) (0.004) (0.004) (0.004)Judges �1.04** �0.46 �1.37** �1.26** �1.80*** �1.16** 0.91
(0.477) (0.560) (0.515) (0.535) (0.507) (0.493) (0.674)Police �0.06 �0.03 �0.03 �0.09 �0.04 �0.05 0.17**
(0.057) (0.042) (0.051) (0.066) (0.050) (0.055) (0.080)Communism 319.22*** 398.89*** 352.21*** 321.15*** 307.65*** 337.25*** 433.60***
(30.234) (24.566) (31.473) (33.401) (35.945) (29.958) (56.790)Death Penalty 159.12***
(20.219)Protestant 1.85**
(0.591)Catholic 0.01
(0.151)Education �0.83
(1.140)Ethnic Frac 177.19**
(62.229)Language Frac �76.53*
(41.879)Religion Frac 139.20**
(44.189)Trust 0.79
(0.699)Prefer Prison 2.97***
(0.856)Constant �310.50** �290.38** �194.85* �190.22 �398.43** �346.35** �2196.25***
(121.016) (109.158) (111.324) (145.854) (145.609) (127.715) (546.255)Observ. 367 339 339 342 331 348 195Overall R2 0.42 0.59 0.47 0.43 0.48 0.42 0.53
Notes: Pooled OLS model with robust clustered (by country) standard errors in parentheses.See Appendix A for all variable description.
* p < 0.1.** p < 0.05.
*** p < 0.01.
D.J. D’Amico, C. Williamson / Journal of Comparative Economics 43 (2015) 595–612 605
fractionalization are also included to capture social heterogeneity (Alesina et al., 2003). As civic capital inversely relates toprivate disorder (Djankov et al., 2003c), we include survey data for levels of generalized trust (World Values Survey 2000,2005) measured as the percentage of respondents who answered ‘most people can be trusted’ (The European ValuesStudy Foundation and World Values Survey Association, 2006).
In Table 7, we report the results. In column (1), we replicate our benchmark specification including communism for com-parison. The relationship between legal origins and incarceration is not sensitive to these additional variables, as all threemeasures of civil law remain negative and significant. The average effect across these specifications suggests a lower prisonpopulation rate by 107, 181, and 210, per 100,000, by French, German, and Scandinavian legal origin, respectively.
Column (2) shows that a country having a death penalty incarcerates approximately 159 additional inmates (per100,000). Protestant religion is positively and significantly related to incarceration. All three measures of fractionalizationare significant. Ethnic and religion fractionalization are both positive while language fractionalization is negative. Lastly, apreference for prison sentencing is significantly related to incarceration with a one standard deviation increase leading toabout 49 additional inmates per 100,000.17 In addition, the adjusted R-squareds suggest minimal explanatory power fromthese additional controls.
17 These social controls are no longer significant in the random effects model in Appendix Table 6.

Table 8Non-Drug Related Incarceration and Legal Institutions.
Dependent variable: Non-drug related prison population per 100,000
(1) (2) (3) (4) (5)
French �58.00*** �68.26*** �53.74*** �44.78** �28.50(14.145) (12.153) (15.979) (19.463) (17.996)
German �107.91*** �103.86*** �76.09*** �115.97*** �100.27***
(16.121) (14.331) (20.926) (21.186) (17.935)Scan. �113.05*** �115.42*** �110.17*** �109.04*** �100.05***
(12.110) (10.843) (15.660) (18.896) (18.103)Log gdp pc 22.14** 32.14*** 47.27*** 38.38* 38.82**
(8.418) (8.923) (12.981) (19.603) (16.767)Communism 279.42*** 287.71*** 333.83*** 378.45*** 342.15***
(28.111) (25.160) (35.391) (35.009) (28.410)Homicide 5.05*** 4.89*** 4.16*** 4.00***
(0.747) (0.787) (0.790) (1.115)Theft 0.01** 0.01** �0.00 0.00
(0.002) (0.003) (0.002) (0.003)Judges �2.10*** �1.31** �0.43
(0.573) (0.458) (0.651)Police �0.04 0.02 �0.00
(0.059) (0.054) (0.059)Growth �0.04 �0.97
(0.933) (0.879)Unemp. 1.14 0.01
(1.273) (1.344)Male LF Part. �1.47 �2.85*
(1.373) (1.461)EFW 17.20 36.24**
(13.352) (15.355)Urban 270.27*** 149.76**
(64.851) (51.182)Arms �0.20* �0.40**
(0.104) (0.131)Voice �326.95***
(52.500)Political Stab. �96.91
(59.806)Rule of Law 150.51**
(58.637)Corruption 12.76
(51.020)Constant �73.19 �201.56** �326.73** �468.28** �185.07
(89.927) (92.875) (142.051) (184.831) (185.626)Observ. 392 356 275 222 222Overall R2 0.45 0.53 0.59 0.62 0.69
Notes: Pooled OLS model with robust clustered (by country) standard errors in parentheses.See Appendix A for all variable description.
* p < 0.1.** p < 0.05.
*** p < 0.01.
606 D.J. D’Amico, C. Williamson / Journal of Comparative Economics 43 (2015) 595–612
4.2. Drug incarceration
As discussed earlier, our results may be sensitive to common law countries criminalizing more activities than civil lawcountries with particular influence from drug prohibition. For example, it is estimated that half of Federal inmates in theUnited States from 2001 to 2013 are in prison due to drug charges (Carson, 2014, p. 17). Thus, investigating total versusnon-drug prison populations provides an opportunity to minimize concern over stricter criminalization in common lawcountries.
We retest our main specifications on non-drug related prison populations (per 100,000). To calculate this measure, wecombine two different data sources. We use our prison population data from UNODC and the drug prison population ratiofrom Bewley-Taylor et al. (2009). Drug prison population ratio is only available for one point in time.18 The authors calculate
18 Drug related incarceration includes drug offenders, combining both ‘possession and use’ and ‘trafficker and dealing’ figures. This data is only available for 54countries.
D.J. D’Amico, C. Williamson / Journal of Comparative Economics 43 (2015) 595–612 607
this measure with data as close to 2008 as possible. We create a measure of non-drug related prison populations acrosscountries and years by assuming the ratio of drug prisoners is constant over time. This assumption allows for an increase indrug prison population but at the same rate as the increase in the overall prison population.
We first calculate the drug prison population by using the ratio of drug prisoners (held constant) multiplied by the prisonpopulation rate from UNODC for each year from 2001 to 2011. Non-drug related prison population is calculated by subtract-ing drug prison population from total prison population from UNODC.
The results are present in Table 8 above. We first present a stripped down benchmark specification controlling for legalorigin, log GDP per capita, and communism. As we found previously with total prison population rates, legal origin is neg-atively and significantly related to non-drug related prison population. For example, French, German, and Scandinavian legalorigins reduce non-drug related inmates by about 58, 107, and 113, per 100,000, respectively. Communism increases non-drug related inmates by about 279 per 100,000.
This relationship holds throughout the specifications as we introduce additional controls including crime rates, criminaljustice measures, economic, and political controls. The adjusted R-squareds suggest these specifications, on average,explain over half of the variation in non-drug related incarceration rates. As an additional robustness check (not reported),we replace the dependent variable with drug prison population rate and find similar results. Collectively, these findingsmitigate much of the concern that the unique criminality of drugs explains the relationship between incarceration andlegal origin.
These results support our main argument. In so far as drug crimes are perceived as a threat to social order, monitoring,regulation, and sanctioning by public bureaucracies under civil law represent a smaller increase in marginal enforcementcosts when compared to reliance on imprisonment. However, with prison facilities in place, common law countries facelower marginal costs of additional imprisonment compared to bureaucratic enforcement techniques. Collectively, this sug-gests that common law countries tend to rely upon incarceration for enforcement against criminal behaviors and social con-trols more so than civil law nations.
After running several additional robustness tests including rerunning all specifications on a cross section of the data,using a random effect model, and dropping two observations that were detected as outliers, the results hold.19 In addition,we use a measure for property rights instead of economic freedom, additional public opinion variables on crime and safety, anda measure of executive constraints for political institutions. These variables are insignificant and our main findings areunchanged. The random effects specifications are reported in the online Appendix. The additional sensitivity tests are notreported to save space but they are available upon request.
5. Conclusions
In previous work, legal origins are argued to shape contemporary economic performance indirectly through historicallegacies of good governance (La Porta et al., 1999). Our findings suggest that it also shapes incentives to more systemat-ically rely upon incarceration. Historical processes within civil legal territories, while less effective at promoting economicprosperity, create bureaucratic means of enforcement that can be utilized at lower marginal costs than punishment byimprisonment. This logic supports the conjecture that alternative frameworks for responding to disorder and maintainingsocial control within legal origins relate to incarceration outcomes. Thus, we consider our findings to support the literatureshowing that legal origins shape not only financial and economic consequences but other social institutional outcomes aswell.
Our findings do not carry normative or optimality implications. Such assessments require knowledge outside thescope of our analysis. For example, we would need to know the deterrent effects as well as the full scope of financialand social costs of incarceration relative to bureaucratic monitoring. Our study offers an explanation for why greaterprison populations in common law countries may be contextually efficient, but it lacks the ability to claim commonlaw incarceration rates as either socially optimal or excessive. In addition, our analysis suggests a perhaps sober reali-zation regarding prison reform as legal origins represent deeply ingrained incentive structures pertaining to socialcontrol.
Acknowledgments
We thank the editor and two anonymous reviewers for valuable comments and suggestions. We thank BhanupriyaShanmugam for data collection and research assistance. We also thank Adam Martin, Shaomeng Jia, Jesse Shapiro, andparticipants at the political economy seminar at King’s College London for comments.
19 The outlier observations are St. Vincent and the Grenadines in 2004 and 2005. The methodology used in the bacon test using a percentile of 0.25 in Stata assuggested by Weber (2010).

608 D.J. D’Amico, C. Williamson / Journal of Comparative Economics 43 (2015) 595–612
Appendix A. Data description
Abbreviation
Description SourcePrison Pop
Total number of adult inhabitants in prisons, penal or correctionalinstitutions (excluding temporary jail lock-ups) per 100,000. ‘‘Prisons,penal or correctional institutions’’ means all publicly and privatelyfinanced institutions where persons are deprived of their libertyUN Office on Drug andCrime
French
Dummy variable coded 0 or 1: 1 indicates that a country was colonizedby France and French legal code was transferred; 0 indicates that acountry inherited English, German, or ScandanavianLa Porta et al. (2008)
German
Dummy variable coded 0 or 1: 1 indicates that a country was colonizedby Germany and German legal code was transferred; 0 indicates that acountry inherited French, English, or ScandanavianLa Porta et al. (2008)
Scandinavian
Dummy variable coded 0 or 1: 1 indicates that a country was colonizedby Scandinavian countries and Scandinavian legal code wastransferred; 0 indicates that a country inherited French, German, orEnglishLa Porta et al. (2008)
Log GDP PC
Log of gross domestic product per capita, PPP, constant 2011international dollarWorld DevelopmentIndicators 2014
Homicide
Homicides per 100,000. Intentional homicide is defined as unlawfuldeath purposefully inflicted on a person by another personUN Office on Drug andCrime
Theft
Number of police recorded thefts per 100,000 at the national level.Theft means depriving a person or organization of property withoutforce with the intent to keep it. Excludes burglary; housebreaking;robbery; and theft of a motor vehicle, which are recorded separatelyUN Office on Drug andCrime
Judges
Total number of professional judges/magistrates per 100,000.Professional Judges or Magistrates means both full-time and part-timeofficials authorized to hear civil, criminal and other cases, including inappeal courts, and to make dispositions in a court of law. Also includesauthorized associate judges and magistratesUN Office on Drug andCrime
Police
Total police personnel per 100,000. Police Personnel means personnelin public agencies whose principal functions are the prevention,detection and investigation of crime and the apprehension of allegedoffendersUN Office on Drug andCrime
Prosecuted
Total number of persons prosecuted per 100,000. This refers to allegedoffenders against whom prosecution commenced in the reporting year.Persons may be prosecuted by the public prosecutor or the lawenforcement agency responsible for prosecution, at the national level,irrespective of the case-ending decisionUN Office on Drug andCrime
Convicted
Total number of persons convicted per 100,000. This refers to personsfound guilty by any legal body authorized to pronounce a convictionunder national criminal law, whether or not the conviction was laterupheld. The total number of persons convicted should also includepersons convicted of serious special law offences but exclude personsconvicted of minor road traffic offences and other petty offencesUN Office on Drug andCrime
Conviction Rate
Total number convicted/total number prosecuted UN Office on Drug andCrimeDrug ConvictionRate
Total number convicted/total number prosecuted, for all drug offenses
UN Office on Drug andCrimeSafe Alone
Measured as a percentage of respondents answering ‘yes’ to thequestion: Do you feel safe walking alone at night in the city or areawhere you live? Averaged 2006–2010Gallup WorldPoll
Assaulted
Measured as a percentage of respondents answering ‘yes’ to thequestion: Within the past 12 months, have you been assaulted ormugged? Averaged 2006–2010Gallup WorldPoll
(continued on next page)

D.J. D’Amico, C. Williamson / Journal of Comparative Economics 43 (2015) 595–612 609
Appendix A. (continued)
Abbreviation
Description SourceProperty Stolen
Measured as a percentage of respondents answering ‘yes’ to thequestion: Within the past 12 months, have you had money or propertystolen from you or another household member? Averaged 2006–2010Gallup WorldPoll
Drugs
Total drug offenses per 100,000 is all intentional acts that involve thecultivation, production, manufacture, extraction, preparation, offeringfor sale, distribution, purchase, sale, delivery on any terms, brokerage,dispatch, dispatch in transit, transport, importation, exportation, andpossession or trafficking of internationally controlled drugsUN Office on Drug andCrime
Growth
Growth of GDP per capita, PPP, constant 2011 international dollars World DevelopmentIndicators 2014Unemp.
Unemployment refers to the share of the labor force that is withoutwork but available for and seeking employmentWorld DevelopmentIndicators 2014
Male LF Part.
Labor force participation rate is the proportion of the male populationages 15–64 that is economically active: all people who supply labor forthe production of goods and servicesWorld DevelopmentIndicators 2014
EFW
Economic freedom is measured on a scale from zero to ten, with tenrepresenting a greater degree of freedom. The index is captures size ofgovernment, monetary policy and price stability, legal structure andsecurity of private ownership, freedom to trade with foreigners, andregulation of credit, business, and laborGwartney et al. (2013)
Urban
Percent of population living in an urban area World DevelopmentIndicators 2014Arms
Arms imports is the supply of military weapons through sales, aid,gifts, and those made through manufacturing licensesWorld DevelopmentIndicators 2014
Voice
Voice and accountability captures perceptions of the extent to which acountry’s citizens are able to participate in selecting their government,as well as freedom of expression, freedom of association, and a freemedia. Captures the level of military involvement in politics anddemocratic accountabilityWorldwide GovernanceIndicators (2013)
Political Stab.
Political Stability and Absence of Violence/Terrorism measuresperceptions of the likelihood that the government will be destabilizedor overthrown by unconstitutional or violent means, includingpolitically-motivated violence and terrorismWorldwide GovernanceIndicators (2013)
Rule of Law
Rule of law captures perceptions of the extent to which agents haveconfidence in and abide by the rules of society, and in particular thequality of contract enforcement, property rights, the police, and thecourts, as well as the likelihood of crime and violenceWorldwide GovernanceIndicators (2013)
Corruption
Measures control of corruption using multiple sources. Captures theassessment of the intrusiveness of the country’s bureaucracyWorldwide GovernanceIndicators (2013)
Communism
Measures a history of communism. The average of dummy variablesequal to 1 for whether a country is communist at six points during the20th century, every 15 years starting in 1925. We average all sixdummies to get a measure of the share of the century a country wascommunistBarro and McCleary(2003)
Jud. Indep.
Judicial Independence is computed as the sum of three variables: thetenure of Supreme Court judges (highest court in any country), thetenure of highest ranked judges ruling on administrative cases, and theexistence of a case law. The variable is normalized from zero to onewhere higher values equal a higher degree of judicial independence.This variable is measured as of 1995La Porta et al. (2004)
Death Penalty
Death Penalty coded 0 or 1: 1 indicates the country has the deathpenalty in law, 0 suggests otherwise. As of March 2014Amnesty International
Protestant
Measured as the percentage of population in 1980 (or for 1990–1995for countries formed more recently) that belonged to ProtestantreligionLa Porta et al. (1999)
(continued on next page)
610 D.J. D’Amico, C. Williamson / Journal of Comparative Economics 43 (2015) 595–612
Appendix A. (continued)
Abbreviation
Description SourceCatholic
Measured as the percentage of population in 1980 (or for 1990–1995for countries formed more recently) that belonged to Roman CatholicreligionLa Porta et al. (1999)
Education
Percentage enrolled in primary education. Can exceed 100% due toinclusion of over- and under-aged studentsWorld Development2014
Ethnic Frac
Measures the degree of ethnic heterogeneity Alesina et al. (2003) Language Frac Measures the degree of language heterogeneity Alesina et al. (2003) Religion Frac Measures the degree of religious heterogeneity Alesina et al. (2003) Trust Trust is the percentage of respondents who answered that ‘‘Mostpeople can be trusted. Average from 1982 to 2007
World Values Survey1981–2007Prefer Prison
Percentage of the public opting for imprisonment as punishment forrecidivist burglar in 2004/05 plus results from earlier surveys incountries and main cities. Average results from 2001 to 2005 wereusedvan Dijk et al. (2007)
Non-drug RelatedPrison Population
Drug prison population is calculated by using the ratio of drugprisoners (held constant) multiplied by the prison population ratefrom UNODC for each year from 2001 to 2011. Non-drug related prisonpopulation is calculated by subtracting drug prison population fromtotal prison population from UNODC
Bewley-Taylor et al.(2009)
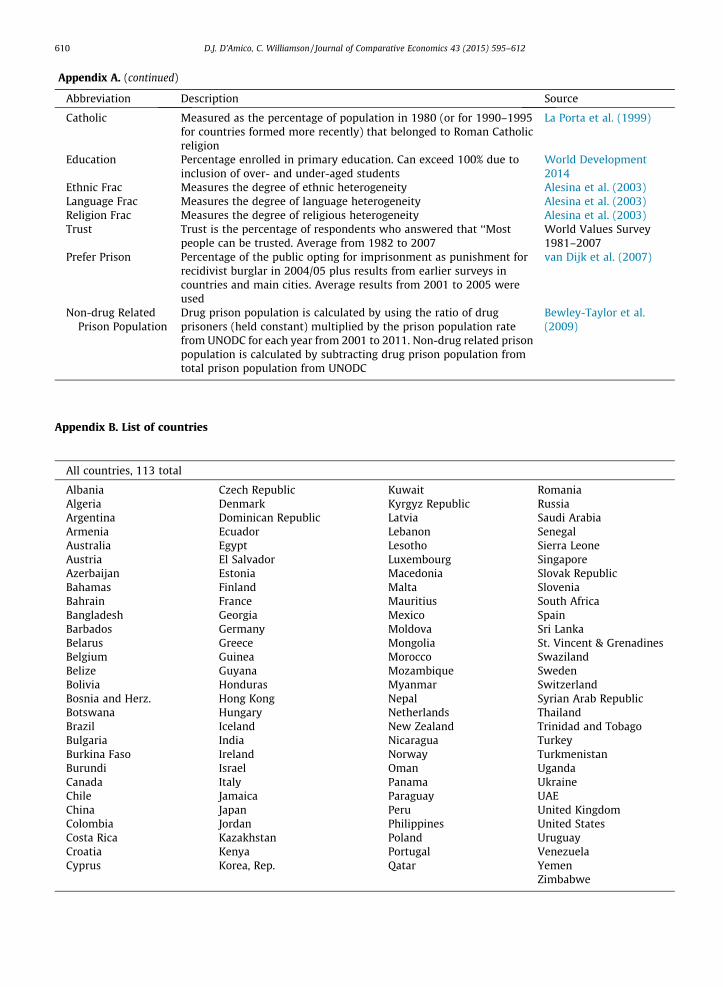
Appendix B. List of countries
All countries, 113 total
Albania
Czech Republic Kuwait Romania Algeria Denmark Kyrgyz Republic Russia Argentina Dominican Republic Latvia Saudi Arabia Armenia Ecuador Lebanon Senegal Australia Egypt Lesotho Sierra Leone Austria El Salvador Luxembourg Singapore Azerbaijan Estonia Macedonia Slovak Republic Bahamas Finland Malta Slovenia Bahrain France Mauritius South Africa Bangladesh Georgia Mexico Spain Barbados Germany Moldova Sri Lanka Belarus Greece Mongolia St. Vincent & Grenadines Belgium Guinea Morocco Swaziland Belize Guyana Mozambique Sweden Bolivia Honduras Myanmar Switzerland Bosnia and Herz. Hong Kong Nepal Syrian Arab Republic Botswana Hungary Netherlands Thailand Brazil Iceland New Zealand Trinidad and Tobago Bulgaria India Nicaragua Turkey Burkina Faso Ireland Norway Turkmenistan Burundi Israel Oman Uganda Canada Italy Panama Ukraine Chile Jamaica Paraguay UAE China Japan Peru United Kingdom Colombia Jordan Philippines United States Costa Rica Kazakhstan Poland Uruguay Croatia Kenya Portugal Venezuela Cyprus Korea, Rep. Qatar YemenZimbabwe

D.J. D’Amico, C. Williamson / Journal of Comparative Economics 43 (2015) 595–612 611
Appendix C. Supplementary material
Supplementary data associated with this article can be found, in the online version, at http://dx.doi.org/10.1016/j.jce.2014.11.002.
References
Acemoglu, Daron, Johnson, Simon, Robinson, James, 2001. The colonial origins of comparative development: an empirical investigation. The AmericanEconomic Review 91, 1369–1401.
Acemoglu, Daron, Johnson, Simon, Robinson, James, 2002. Reversal of fortune: geography and institutions in the making of the modern world incomedistribution. Quarterly Journal of Economics 117, 1231–1294.
Alesina, Alberto, Devleeschauwer, Arnaud, Easterly, William, Kurlat, Sergio, Wacziarg, Romain, 2003. Fractionalization. Journal of Economic Growth 8, 155–194.
Amnesty International, March 2014. <http://www.amnesty.org/en/death-penalty>.Aronowitz, Alexis, 1993. Germany. In: Newman, Graeme, Bouloukos, Adam, Cohen, Debra (Eds.), World Factbook of Criminal Justice Systems 2002. Bureau
of Justice Statistics. <http://www.bjs.gov/content/pub/html/wfcj.cfm>.Barro, Robert, McCleary, Rachel, 2003. Religion and economic growth. American Sociological Review 68, 760–781.Beckett, Katherine, Western, Bruce, 2001. Governing social marginality: welfare, incarceration, and the transformation of state policy. Punishment and
Society 3, 43–59.Berman, Harold, 1983. Law and Revolution: The Formation of the Western Legal Tradition. Harvard University Press, Cambridge.Berman, Harold, 2001. Law and Revolution II: The Impact of the Protestant Reformations on the Western Legal Tradition. Harvard University Press,
Cambridge.Bewley-Taylor, Dave, Hallam, Chris, Allen, Rob, 2009. The Incarceration of Drug Offenders: An Overview. The Beckley Foundation Drug Policy Programme,
Report 16. King’s College London, London, p. 1–18.Borricand, Jacques, 1993. France. In Newman, Graeme, Bouloukos, Adam, Cohen, Debra (Eds.), World Factbook of Criminal Justice Systems 2002. Bureau of
Justice Statistics. <http://www.bjs.gov/content/pub/html/wfcj.cfm>.Botero, Juan, Djankov, Simeon, Porta, Rafael La, Lopez-de.-Silanes, Florencio, Shleifer, Andrei, 2004. The regulation of labor. Quarterly Journal of Economics
119, 1339–1382.Brodeur, Jean-Paul, 2007. Comparative penology in perspective. Crime and Justice 36, 49–91.Carson, Elizabeth, 2014. Prisoners in 2013. Bulletin. Bureau of Justice Statistics, Washington, DC.Cavadino, Michael, Dignan, James, 2006a. Penal Systems: A Comparative Approach. Sage, Los Angeles.Cavadino, Michael, Dignan, James, 2006b. Penal policy and political economy. Criminology & Criminal Justice 6, 435–456.Chiricos, Theodore, Delone, Miriam, 1992. Labor surplus and punishment: a review and assessment of theory and evidence. Social Problems 39, 421–446.Damaska, Mirjan, 1986. The Faces of Justice and State Authority. Yale University Press, New Haven.Dari-Mattiacci, Giuseppe, Guerriero, Carmine, 2011. Law, economics and history: endogenous institutional change and legal innovation. In: Faure, Michael,
Smits, Jan (Eds.), Does Law Matter? On Law and Economic Growth. Intersentia, Cambridge, pp. 137–154.Dawson, John, 1960. A History of Lay Judges. Harvard University Press, Cambridge.De Giorgi, Alessandro, 2006. Rethinking the Political Economy of Punishment: Perspectives on Post-Fordism and Penal Politics. Aldershot, Hampshire.Djankov, Simeon, La Porta, Rafael, Lopez-de-Silanes, Florencio, Shlefier, Andrei, 2002. The regulation of entry. The Quarterly Journal of Economics 117, 1–37.Djankov, Simeon, Mcliesh, Caralee, Nenova, Tatiana, Shleifer, Andrei, 2003a. Who owns the media?. Journal of Law and Economics 46, 341–381.Djankov, Simeon, Glaeser, Edward, La Porta, Rafael, Lopez-de-Silanes, Florencio, Shleifer, Andrei, 2003b. Courts. Quarterly Journal of Economics 118, 453–
518.Djankov, Simeon, Glaeser, Edward, La Porta, Rafael, Lopez-de-Silanes, Florencio, Shleifer, Andrei, 2003c. The new comparative economics. Journal of
Comparative Economics 31, 595–619.Djankov, Simeon, La Porta, Rafael, Lopez-de-Silanes, Florencio, Shleifer, Andrei, 2008. The law and economics of self-dealing. Journal of Financial Economics
88, 430–465.Easton, Stephen, Walker, Michael, 1997. Income, growth, and economic freedom. American Economic Review 87, 328–332.Enns, Peter, 2014. The Public’s Increasing Punitiveness and Its Influence on Mass Incarceration in the United States. American Journal of Political Science.
Online First.Everingham, Susan, Rydell, Peter, 1994. Modeling the Demand for Cocaine. Rand, Santa Monica.Foucault, Michel, 1975. Discipline and Punish: The Birth of the Prison. Vintage Books, New York.Gallup World Poll. 2012. Gallup, Inc. <http://www.gallup.com/poll/world.aspx?ref=b>.Garland, David, 2001. Culture of Control: Crime and Social Order in Contemporary Society. University of Chicago Press, Chicago.Glaeser, Edward, 1999. Why is There More Crime in Cities. Journal of Political Economy 107, S225–S258.Glaeser, Edward, Shleifer, Andrei, 2002. Legal origins. The Quarterly Journal of Economics 117, 1193–1229.Graff, Michael, 2008. Law and finance: common-law and civil-law countries compared, an empirical critique. Economica 75, 60–83.Greenberg, David, West, Valerie, 2008. Siting the death penalty internationally. Law and Social Inquiry 33, 295–343.Grossman, Herschel, 2002. ‘‘Make us a King’’: anarchy, predation and the state. European Journal of Political Economy 18, 31–46.Guerriero, Carmine, 2011. Legal traditions and economic performances: theory and evidence. In: Bouckaert, Boudewijn, De Geest, Gerrit (Eds.), Encyclopedia
of Law and Economics. Edward Elgar, Cheltenham (Chapter 9).Gwartney, James, Lawson, Robert, Holcombe, Randall, 1999. Economic freedom and the environment for economic growth. Journal of Institutional and
Theoretical Economics 155, 1–21.Gwartney, James, Lawson, Robert, Hall, Josh, 2013. The Economic Freedom of the World: Annual Report. Fraser Institute, Vancouver.Harcourt, Bernard, 2011. Reducing mass incarceration: lessons from the deinstitutionalization of mental hospitals in the 1960s. Ohio State Journal of
Criminal Law 9, 53–196.Hayek, Frederick, 1960. The Constitution of Liberty. University of Chicago Press, Chicago.Helland, Eric, Klick, Jonathan, 2011. Legal origins and empirical credibility. In: Faure, Michael, Smits, Jan (Eds.), Does Law Matter? On Law and Economic
Growth. Intersentia, Cambridge, pp. 99–114.Hughes, Caitlin, Stevens, Alex, 2010. What can we learn from the Portuguese decriminalization of illicit drugs?. The British Journal of Criminology 50, 999–
1022.Joutsen, Matti, 1993. Finland. In: Newman, Graeme, Bouloukos, Adam, Cohen, Debra (Eds.), World Factbook of Criminal Justice Systems 2002. Bureau of
Justice Statistics. <http://www.bjs.gov/content/pub/html/wfcj.cfm>.Kessler, Daniel, Levitt, Steven, 1999. Using sentence enhancements to distinguish between deterrence and incapacitation. Journal of Law and Economics 42,
343–363.Kleiman, Mark, 2009. When Brute Force Fails: How to Have Less Crime and Less Punishment. Princeton University Press, Princeton.Klerman, Daniel, Mahoney, Paul, Spamann, Holger, Weinstein, Mark, 2011. Legal origin or colonial history?. Journal of Legal Analysis, 1–31.Kornai, Janos, 1992. The Socialist System: The Political Economy of Communism. Princeton University Press, Princeton.

612 D.J. D’Amico, C. Williamson / Journal of Comparative Economics 43 (2015) 595–612
La Porta, Rafael, Lopez-de-Silanes, Florencio, Shleifer, Anrea, 1997. Legal determinants of external finance. Journal of Finance 52, 1131–1150.La Porta, Rafael, Lopez-de-Silanes, Florencio, Shleifer, Andrei, Vishny, Robert, 1998. Law and finance. Journal of Political Economy 106, 1113–1155.La Porta, Rafael, Lopez-de-Silanes, Florencio, Shleifer, Andrei, Vishny, Robert, 1999. The quality of government. Journal of Law Economics and Organization
15, 222–279.La Porta, Rafael, Lopez-de-Silanes, Florencio, Pop-Eleches, Cristian, Shleifer, Andrei, 2004. Judicial checks and balances. Journal of Political Economy 112,
445–470.La Porta, Rafael, Lopez-de-Silanes, Florencio, Shleifer, Anrea, 2008. The economic consequences of legal origins. Journal of Economic Literature 46, 285–332.Lacey, Nicola, 2008. The Prisoners’ Dilemma: Political Economy and Punishment in Contemporary Democracies. Cambridge University Press, New York.Lacey, Nicola, 2012. Political systems and criminal justice: the prisoners’ dilemma after the coalition. Current Legal Problems 65, 1–37.Leeson, P., 2008a. An-arrgh-chy: the law and economics of pirate organization. Journal of Political Economy 115 (6), 1049–1094.Leeson, P., 2008b. Social distance and self-enforcing exchange. Journal of Legal Studies 37, 161–188.Leeson, P., 2009. The laws of lawlessness. Journal of Legal Studies 38, 471–503.Levitt, Steven, 1998. Why do increased arrest rates appear to reduce crime: deterrence, incapacitation, or measurement error?. Economic Inquiry 36, 353–
372.Loo, Mirjam, Beusekom, Ineke, Kahan, James, 2002. Decriminalization of drug use in Portugal: the development of a policy. Annals of the American Academy
of Political and Social Science 582, 49–63.Lott, John, Mustard, David, 1997. Crime, deterrence, and right-to-carry concealed handguns. Journal of Legal Studies 26, 1–68.Mahoney, Paul, 2001. The common law and economic growth: Hayek might be right. Journal of Legal Studies 30, 503–525.Marvel, Thomas, Moody, Carlisle, 1994. Prison population growth and crime reduction. Journal of Quantitative Criminology 10, 109–140.Mauer, Marc, 1995. Americans behind bars: the international use of incarceration. The Prison Journal 75, 113–123.Mukherjee, Satyanshu, Reichel, Philip, 1999. Bringing to justice. In: Newman, Graeme (Ed.), Global Report on Crime and Justice. Oxford University Press,
New York.Mulligan, Casey, Shleifer, Andrei, 2005a. Conscription as regulation. American Law and Economics Review 7, 85–111.Mulligan, Casey, Shleifer, Andrei, 2005b. The extent of the market and the supply of regulation. Quarterly Journal of Economics 120, 1445–1473.Mulligan, Casey, Gil, Richard, Sala-i-Martin, Xavier, 2004. Do democracies have different public policies than nondemocracies?. The Journal of Economic
Perspectives 18, 51–74.Neapolitan, Jerome, 2001. An examination of cross-national variation in punitiveness. International Journal of Offender Therapy and Comparative
Criminology 45, 691–710.Newman, Graeme (Ed.), 1999. Global Report on Crime and Justice. Oxford University Press, New York.Newman, Graeme, Bouloukos, Adam, Cohen, Debra (Eds.), 2002. World Factbook of Criminal Justice Systems. Bureau of Justice Statistics. <http://
www.bjs.gov/content/pub/html/wfcj.cfm>.Olson, Mancur, 1993. Dictatorship, democracy and development. American Political Science Review 87, 567–576.Pease, Ken, 1992. Punitiveness and prison populations: an international comparison. Justice of the Peace 27, 405–408.Pease, Ken, 1994. Cross-national imprisonment rates: limitations of method and possible conclusions. British Journal of Criminology 34, 116–130.Pratt, John, 2007. Penal Populism. Routledge, London.Reichel, Philip, 2002. Comparative Criminal Justice Systems: A Topical Approach. Prentice Hall, Upper Saddle River.Ruddell, Rick, 2005. Social disruption, state priorities, and minority threat. Punishment and Society 7, 7–28.Rusche, Georg, Kirchheimer, Otto, 1939. Punishment and Social Structure. Piscataway, Transaction.Scheingold, Stuart, 1984. The Politics of Law and Order: Street Crime and Public Policy. Quid Pro, New Orleans.Shleifer, Andrei, Vishny, Robert, 1993. Corruption. Quarterly Journal of Economics 109, 599–618.Soares, Rodrigo, 2004a. Crime reporting as a measure of institutional development. Economic Development and Cultural Change 52, 851–871.Soares, Rodrigo, 2004b. Development, crime and punishment: accounting for the international differences in crime rates. Journal of Development
Economics 73, 155–184.Spamann, Holger, 2008. ‘‘Legal Origins’’ of Crime and Punishment (unpublished). <http://www.utexas.edu/law/wp/wpcontent/uploads/centers/clbe/
spamann_legal_origins_of_crime_and_punishment.pdf>.Spamann, Holger, 2010. Legal origins, civil procedure, and the quality of contract enforcement. Journal of Institutional and Theoretical Economics 155, 149–
165.Stringham, E., Levendis, J., 2010. The relationship between economic freedom and homicide. In: Gwartney, Hall, Lawson (Eds.), Economic Freedom of the
World: Annual Report. Fraser Institute: 203-18 (Chapter 6).Sutton, John, 2000. Imprisonment and social classification in five common-law democracies, 1960–1985. American Journal of Sociology 106, 350–386.Sutton, John, 2004. The political economy of imprisonment in affluent western democracies, 1960–1990. American Sociological Review 69, 170–189.Tauchen, Helen, Witte, Ann, Griesinger, Harriet, 1994. Criminal deterrence: revisiting the issue with a birth cohort. The Review of Economics and Statistics
76, 399–412.The European Values Study Foundation and World Values Survey Association (EVSF-WVSA). 2006. European and World Values Surveys Four-Wave
Integrated Data File, 1981–2007, v. 20060423.Treisman, Daniel, Shleifer, Andrei, 2005. A normal country: Russia after communism. Journal of Economic Perspectives 19, 151–174.United Nations Office on Drug and Crime, Data as of 5/15/2014. <http://www.unodc.org/unodc/en/data-and-analysis/statistics/crime.html>.Usher, Dan, 1997. Education as a deterrent to crime. Canadian Journal of Economics 30, 367–384.van Dijk, Jan, Kesteren, John, Smit, Paul, 2007. Criminal Victimization in International Perspective. Tilburg University, Tilburg.Wacquant, Loic, 1999. ‘‘Suitable Enemies’’: foreigners and immigrants in the prisons of Europe. Punishment and Society 1, 215–222.Wacquant, Loic, 2001. Deadly symbiosis: when ghetto and prison meet and mesh. Punishment and Society 3, 95–134.Walmsley, Roy, 1999–2011. World Prison Population List, 1st–9th ed. International Centre for Prison Studies, London.Walmsley, Roy, 2003. Global incarceration and prison trends. Forum on Crime and Society 3, 65–78.Weber, Sylvain, 2010. Bacon: an effective way to detect outliers in multivariate data using Stata (and Mata). The Stata Journal 10, 331–338.Western, Bruce, Beckett, Katherine, 1999. How unregulated is the U.S. labor market? The penal system as a labor market institution. American Journal of
Sociology 104, 1030–1060.Western, Bruce, Pettit, Becky, 2000. Incarceration and racial inequality in men’s employment. Industrial and Labor Relations Review 54, 3–16.Wikstrom, Per-Olof, Dolmen, Lars, 1993. Sweden. In Newman, Graeme, Bouloukos, Adam, Cohen, Debra (Eds.) World Factbook of Criminal Justice Systems
2002. Bureau of Justice Statistics. <http://www.bjs.gov/content/pub/html/wfcj.cfm>.Wilkins, Leslie, 1991. Punishment, Crime and Market Forces. Dartmouth Pub Co., London.World Bank, 2013. Worldwide Governance Indicators. Washington, D.C.World Bank, 2014. World Development Indicators. Washington, D.C.