july 25, 2016 - info edge
TRANSCRIPT
Page 1 of 2
July 25, 2016 Unaudited financial results for the quarter ended June 30, 2016, Condensed Interim Financial Statement (CFS) as at June 30, 2016 and Transition to Ind AS reporting Beginning April 1, 2016, the Company has adopted Ind AS for the first time with a transition date of April 1, 2015. The unaudited financial results for the quarter ended June 30, 2016 have been prepared in accordance with the Companies (Indian Accounting Standards) Rules, 2015 (Ind AS) prescribed under Section 133 of the Companies Act, 2013 and other recognized accounting practices and policies to the extent applicable. The financial results are available on the corporate website www.infoedge.in The CFS is prepared by the company every quarter as per Accounting Standard 25 on Interim Financial Reporting on a voluntary basis. To facilitate continued referencing and understanding of our financial statements the unaudited CFS is prepared and presented in accordance with the previous Indian GAAP instead of Ind AS. The same is enclosed herewith. While the company has been preparing the unaudited CFS on a voluntary basis for its internal management purposes, the same is made available on its corporate website for information purposes only. As regards transition to Ind AS reporting the following details are additionally provided:
1. Reconciliation of profit & loss as reported in accordance with Indian GAAP to total comprehensive income in accordance with Ind AS is provided in annexure-1
2. Key Impact Areas in the opening financial statements as on April 01, 2015, FY 2015-16 and financial results of quarter ended June 30, 2016 and June 30, 2015 while transitioning to and as per Ind AS are as follows:
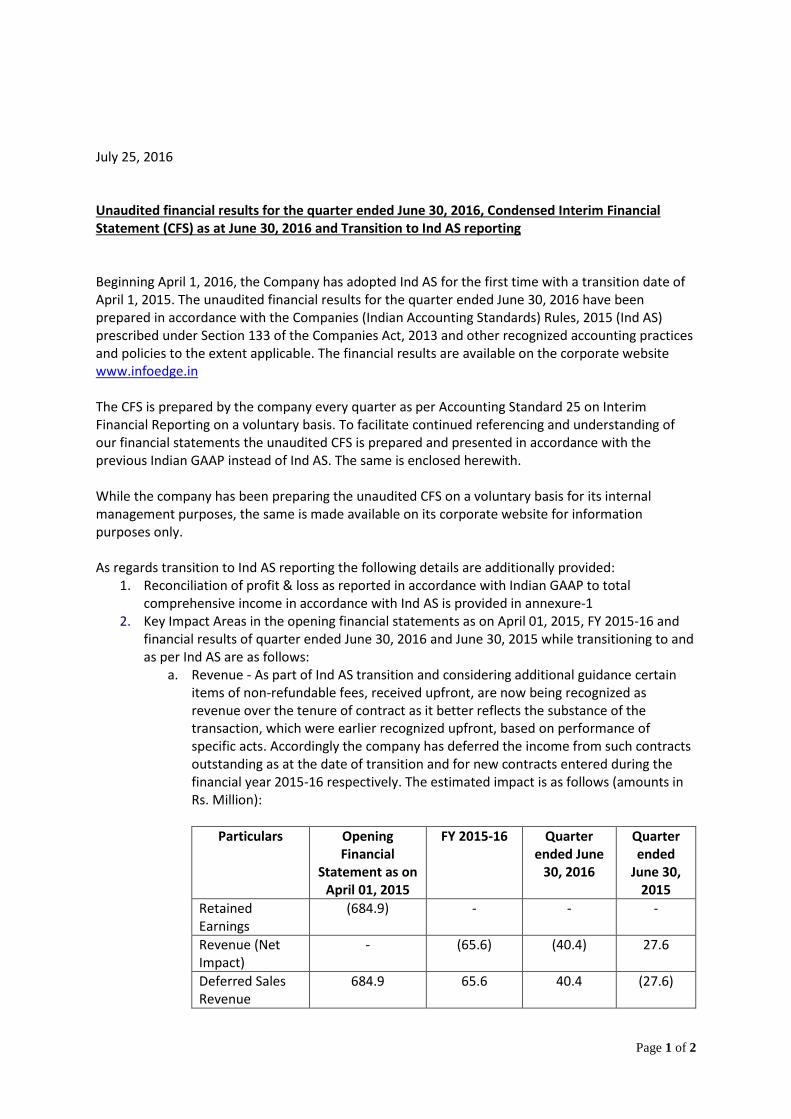
a. Revenue - As part of Ind AS transition and considering additional guidance certain items of non-refundable fees, received upfront, are now being recognized as revenue over the tenure of contract as it better reflects the substance of the transaction, which were earlier recognized upfront, based on performance of specific acts. Accordingly the company has deferred the income from such contracts outstanding as at the date of transition and for new contracts entered during the financial year 2015-16 respectively. The estimated impact is as follows (amounts in Rs. Million):
Particulars Opening Financial
Statement as on April 01, 2015
FY 2015-16 Quarter ended June
30, 2016
Quarter ended
June 30, 2015
Retained Earnings
(684.9) - - -
Revenue (Net Impact)
- (65.6) (40.4) 27.6
Deferred Sales Revenue
684.9 65.6 40.4 (27.6)

Page 2 of 2
b. ESOP Cost - As per Ind As 102 - Share based payments, the stock options granted are considered to be towards equity settled share based transactions and therefore the cost of such options are to be measured at fair value as at the grant date. Further, an exemption as per Ind AS - 101 "First time adoption of Indian Accounting Standards" relating to share based payments has been opted for whereby as at the transition date April 01, 2015 the fair value of options that are yet to be vested have been considered. The impact is as follows:
i. Retained Earnings as at April 1, 2015 reduced by Rs. 95.5 million ii. Additional ESOP cost of Rs. 162.4 million in FY 15-16
iii. Additional ESOP cost of Rs. 56.8 million and Rs. 42.8 million in quarter ended June 30, 2016 and June 30, 2015 respectively
c. Other Income - As per Ind AS 109- Financial instruments, the investment in mutual funds have been measured at Fair value as on the reporting date. The impact is as follows:
i. Retained Earnings as at April 1, 2015 increased by Rs. 64.6 million ii. Differential reversal of Rs. 47.5 million on net basis in FY 15-16.
iii. Differential income / (loss) of Rs. 4.8 million and Rs. (29.7) million on net basis in quarter ended June 30, 2016 and June 30, 2015 respectively
d. Investment through Preference shares - As per Ind AS 109- Financial instruments, the investments in other companies through redeemable / convertible preference shares recorded based on amortized value / fair value as at the respective reporting date. Accordingly, this will be accounted for and disclosed in audited financial statements as per Ind AS for respective periods. The interest income with regard to measurement at amortized cost using effective interest rate method on redeemable preference shares in subsidiary companies at:
i. Retained Earnings as at April 1, 2015 increased by Rs. 1.7 million ii. Incremental income of Rs. 37.2 million in FY 2015-16
iii. Incremental income of Rs. 11.8 million & Rs. 5.2 million respectively for quarter ended June 30, 2016 & quarter ended June 30, 2015
e. Net Income (interest on deposits) related to the "Infoedge Employee Stock Option
Plan Trust"
f. Tax component on account of above adjustments as applicable Thanking You, Chintan Thakkar, Director & CFO

Annexure-1
(` 'Mn)
IGAAP
Effects of
transition to Ind
AS
Ind AS IGAAP Effects of
transition to Ind AS Ind AS
Revenue from operations A 1,717.91 29.41 1,747.32 2,014.52 (38.54) 1,975.98
Other income B 212.92 (20.39) 192.53 221.36 21.81 243.17
Total revenue 1,930.83 9.02 1,939.85 2,235.88 (16.73) 2,219.15
EXPENSES:
Employee benefits expense C 759.27 32.30 791.57 914.98 48.08 963.06
Finance costs 0.18 - 0.18 0.25 - 0.25
Depreciation and amortisation expense 45.02 - 45.02 59.78 - 59.78
Advertising and promotion cost 461.09 - 461.09 257.98 - 257.98
Administration and other expenses D 202.94 1.32 204.26 217.34 (1.68) 215.66
Network, internet and other direct charges 56.25 - 56.25 61.52 - 61.52
Total expenses 1,524.75 33.62 1,558.37 1,511.85 46.40 1,558.25
Profit before exceptional items and tax 406.08 (24.60) 381.48 724.03 (63.13) 660.90
Exceptional items - - - - - -
Profit before tax 406.08 (24.60) 381.48 724.03 (63.13) 660.90
Tax expense
Current tax 120.65 4.59 125.24 257.80 (152.62) 105.18
Deferred tax E (2.05) (27.98) (30.03) (8.10) 120.27 112.17
Profit for the period 287.48 (1.21) 286.27 474.33 (30.78) 443.55
Other comprehensive income, net of income
taxA) Items that will not be reclassified to profit or loss
-Actuarial loss on defined benefit plans - 6.83 6.83 - 5.68 5.68
B) Items that will be reclassified to profit or loss - - - - - -
Total other comprehensive income, net of
income tax
6.83 6.83 - 5.68 5.68
Total comprehensive income for the period 287.48 (8.04) 279.44 474.33 (36.46) 437.87
Notes :
C) a) As per Ind AS 19 - Employee benefits, actuarial gains and losses are recognised in other comprehensive income and not reclassified to profit and loss in a subsequent period [(` 10.45 Mn) &
(` 8.69 Mn respectively for quarter ended June 30, 2015 & quarter ended June 30, 2016]
b) As per Ind As 102 - Share based payments, the stock options granted are towards equity settled share based transactions and therefore the cost has been measured at fair value as at the grant
date. Further, an exemption as per Ind AS - 101 "First time adoption of Indian Accounting Standards" relating to share based payments has been opted for whereby as at
the transition date April 01, 2015 the fair value of options that are yet to be vested have been considered [` 42.75 Mn & ` 56.77 Mn respectively for quarter ended June 30, 2015 & quarter
ended June 30, 2016]
D) As per Ind AS 109 - Financial instruments,
1) amortisation of prepaid rent in relation to certain interest free deposits which have been measured at amortised cost using effective interest rate method. [` 1.44 Mn & ` 2.05 Mn respectively
for quarter ended June 30, 2015 & quarter ended June 30, 2016]
2) adjustment for recognition of loss allowance for expected credit losses on trade receivables [(` 2.01 Mn) & (` 5.55 Mn) respectively for quarter ended June 30, 2015 & quarter
ended June 30, 2016]
3) other miscellaneous expense [` 1.89 Mn & ` 1.82 Mn respectively for quarter ended June 30, 2015 & quarter ended June 30, 2016]
E) Tax component on account of above adjustments, non-depreciable assets acquired on finance lease and carryforward of unused capital tax losses
A) As per Ind AS 18-Revenue, certain items of non-refundable fees, received upfront, are now being recognized as revenue over the tenure of contracts as it better reflects the substance of the
transaction, which were earlier recognized upfront, based on performance of specific acts.
B) a) As per Ind AS 109- Financial instruments,
1) the investment in mutual funds have been measured at fair value through Profit and Loss as on the reporting date; [ (` 29.65 Mn) & ` 4.81 Mn respectively for quarter ended
June 30, 2015 & quarter ended June 30, 2016]
2) interest income measurement at effective interest rate method on
(i) redeemable preference shares in subsidiary companies [` 5.23 Mn & ` 11.8 Mn respectively for quarter ended June 30, 2015 & quarter ended June 30, 2016] and
(ii) certain interest free security deposits [` 1.16 Mn & ` 1.76 Mn respectively for quarter ended June 30, 2015 & quarter ended June 30, 2016]
b) Income (interest on deposits) related to the "Infoedge Employee Stock Option Plan Trust" has been considered [` 2.87 Mn & ` 3.44 Mn respectively for quarter ended June 30,
2015 & quarter ended June 30, 2016]
Particulars Note Three months period ended
June 30, 2015
Three months period ended
June 30, 2016

INFO EDGE (INDIA) LIMITED
UNAUDITED CONDENSED INTERIM BALANCE SHEET AS AT JUNE 30, 2016 AS PER PREVIOUS INDIAN GAAP
Amount in ` Million (Mn)
As at As at
June 30, 2016 March 31, 2016(` 'Mn) (` 'Mn)
I. EQUITY AND LIABILITIES
(1) SHAREHOLDERS' FUNDS
(a) Share capital 2 1,209.16 1,209.16
(b) Reserves and surplus 3 16,917.48 16,430.95
(2) NON-CURRENT LIABILITIES
(a) Long-term borrowings 4 5.14 3.79
(b) Other long term liabilities 6 58.08 56.42
(3) CURRENT LIABILITIES(a) Trade payables
- total outstanding dues of micro enterprises and small
enterprises and - -
- total outstanding dues of creditors other than micro
enterprises and small enterprises 373.90 269.88
(b) Other current liabilities 6 2,368.39 2,178.45
(c) Short-term provisions 7 359.37 428.58
Total 21,291.52 20,577.23
II. ASSETS
(1) NON-CURRENT ASSETS
(a) Fixed assets
(i) Tangible assets 8 871.50 902.04
(ii) Intangible assets 8 15.06 19.90
(iii) Capital work-in-progress 94.88 94.88
(iv) Intangible assets under development 3.35 3.35
(b) Non-current investments 9 5,806.16 5,736.16
(c) Deferred tax assets 10 67.66 59.56
(d) Long-term loans and advances 11 130.80 140.56
(e) Other non-current assets 12 9,108.05 1,528.17
(2) CURRENT ASSETS
(a) Current investments 13 1,026.43 357.28
(b) Trade receivables 14 79.34 118.13
(c) Cash and bank balances 15 1,828.67 9,522.20
(d) Short-term loans and advances 11 344.35 346.84
(e) Other current assets 12 1,915.27 1,748.16
Total 21,291.52 20,577.23
For and on behalf of the Board of Directors
Hitesh Oberoi Chintan ThakkarManaging Director Director & CFO
Place : Noida
Date : July 25, 2016
Particulars Note
5
The accompanying notes are an integral part of these financial statements.
INFO EDGE (INDIA) LIMITED
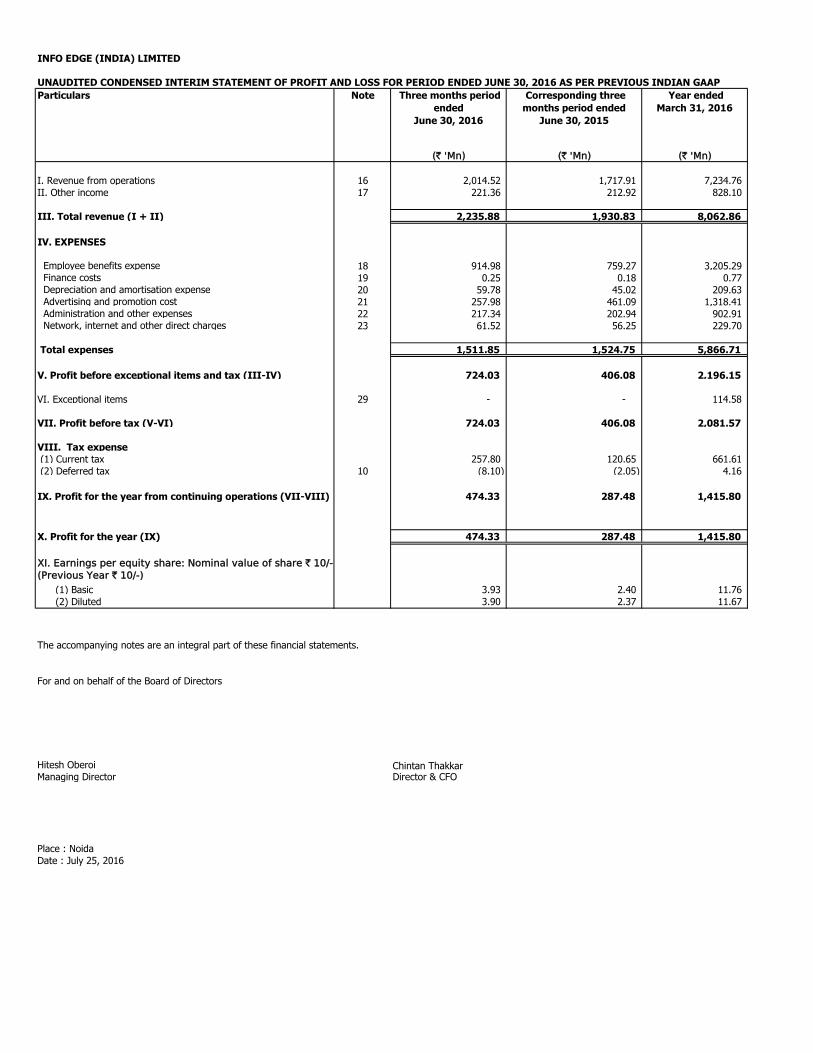
UNAUDITED CONDENSED INTERIM STATEMENT OF PROFIT AND LOSS FOR PERIOD ENDED JUNE 30, 2016 AS PER PREVIOUS INDIAN GAAP
(` 'Mn) (` 'Mn) (` 'Mn)
I. Revenue from operations 16 2,014.52 1,717.91 7,234.76
II. Other income 17 221.36 212.92 828.10
III. Total revenue (I + II) 2,235.88 1,930.83 8,062.86
IV. EXPENSES
Employee benefits expense 18 914.98 759.27 3,205.29 Finance costs 19 0.25 0.18 0.77 Depreciation and amortisation expense 20 59.78 45.02 209.63 Advertising and promotion cost 21 257.98 461.09 1,318.41 Administration and other expenses 22 217.34 202.94 902.91 Network, internet and other direct charges 23 61.52 56.25 229.70
Total expenses 1,511.85 1,524.75 5,866.71
V. Profit before exceptional items and tax (III-IV) 724.03 406.08 2,196.15
VI. Exceptional items 29 - - 114.58
VII. Profit before tax (V-VI) 724.03 406.08 2,081.57
VIII. Tax expense
(1) Current tax 257.80 120.65 661.61
(2) Deferred tax 10 (8.10) (2.05) 4.16
IX. Profit for the year from continuing operations (VII-VIII) 474.33 287.48 1,415.80
X. Profit for the year (IX) 474.33 287.48 1,415.80
XI. Earnings per equity share: Nominal value of share ` 10/-
(Previous Year ` 10/-)
(1) Basic 3.93 2.40 11.76
(2) Diluted 3.90 2.37 11.67
For and on behalf of the Board of Directors
Hitesh Oberoi Chintan ThakkarManaging Director Director & CFO
Place : Noida
Date : July 25, 2016
The accompanying notes are an integral part of these financial statements.
Year ended
March 31, 2016
Particulars Note Three months period
ended
June 30, 2016
Corresponding three
months period ended
June 30, 2015
INFO EDGE (INDIA) LIMITED
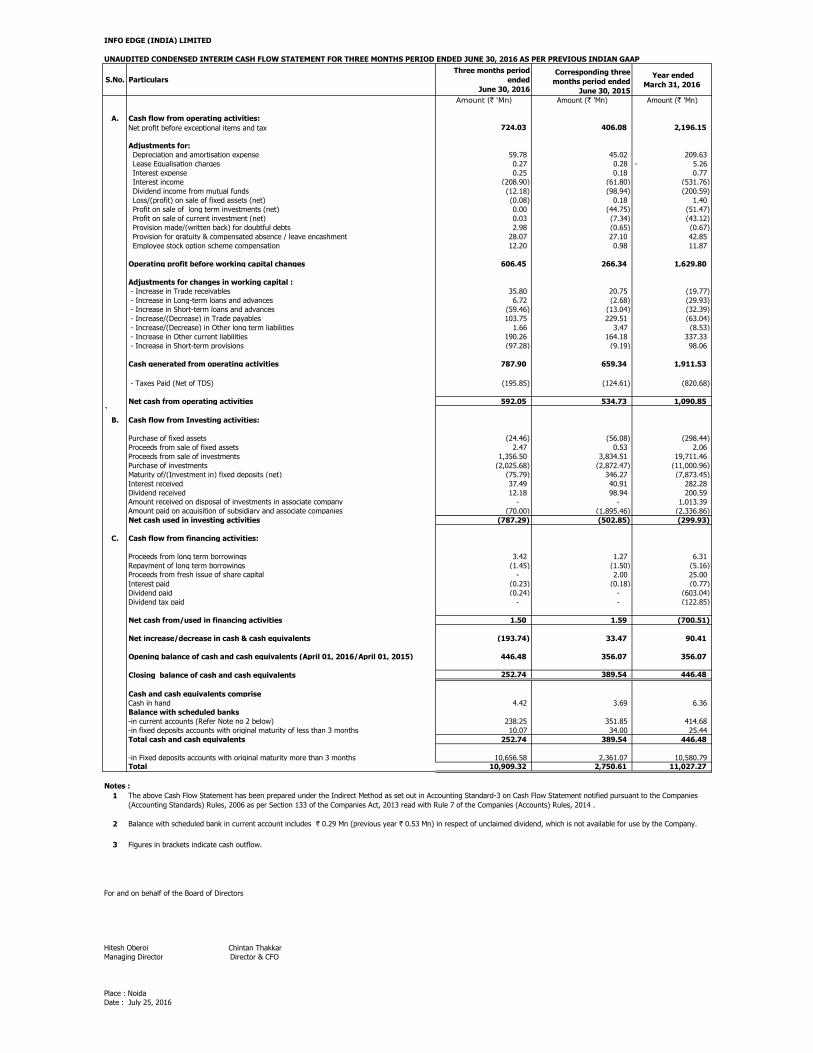
UNAUDITED CONDENSED INTERIM CASH FLOW STATEMENT FOR THREE MONTHS PERIOD ENDED JUNE 30, 2016 AS PER PREVIOUS INDIAN GAAP
S.No. Particulars
Three months period
ended
June 30, 2016
Corresponding three
months period ended
June 30, 2015
Year ended
March 31, 2016
Amount (` 'Mn) Amount (` 'Mn) Amount (` 'Mn)
A. Cash flow from operating activities:
Net profit before exceptional items and tax 724.03 406.08 2,196.15
Adjustments for:
Depreciation and amortisation expense 59.78 45.02 209.63
Lease Equalisation charges 0.27 0.28 5.26-
Interest expense 0.25 0.18 0.77
Interest income (208.90) (61.80) (531.76)
Dividend income from mutual funds (12.18) (98.94) (200.59)
Loss/(profit) on sale of fixed assets (net) (0.08) 0.18 1.40
Profit on sale of long term investments (net) 0.00 (44.75) (51.47)
Profit on sale of current investment (net) 0.03 (7.34) (43.12)
Provision made/(written back) for doubtful debts 2.98 (0.65) (0.67)
Provision for gratuity & compensated absence / leave encashment 28.07 27.10 42.85
Employee stock option scheme compensation 12.20 0.98 11.87
Operating profit before working capital changes 606.45 266.34 1,629.80
Adjustments for changes in working capital :
- Increase in Trade receivables 35.80 20.75 (19.77)
- Increase in Long-term loans and advances 6.72 (2.68) (29.93)
- Increase in Short-term loans and advances (59.46) (13.04) (32.39)
- Increase/(Decrease) in Trade payables 103.75 229.51 (63.04)
- Increase/(Decrease) in Other long term liabilities 1.66 3.47 (8.53)
- Increase in Other current liabilities 190.26 164.18 337.33
- Increase in Short-term provisions (97.28) (9.19) 98.06
Cash generated from operating activities 787.90 659.34 1,911.53
- Taxes Paid (Net of TDS) (195.85) (124.61) (820.68)
Net cash from operating activities 592.05 534.73 1,090.85
`
B. Cash flow from Investing activities:
Purchase of fixed assets (24.46) (56.08) (298.44)
Proceeds from sale of fixed assets 2.47 0.53 2.06
Proceeds from sale of investments 1,356.50 3,834.51 19,711.46
Purchase of investments (2,025.68) (2,872.47) (11,000.96)
Maturity of/(Investment in) fixed deposits (net) (75.79) 346.27 (7,873.45)
Interest received 37.49 40.91 282.28
Dividend received 12.18 98.94 200.59
Amount received on disposal of investments in associate company - - 1,013.39
Amount paid on acquisition of subsidiary and associate companies (70.00) (1,895.46) (2,336.86)
Net cash used in investing activities (787.29) (502.85) (299.93)
C. Cash flow from financing activities:
Proceeds from long term borrowings 3.42 1.27 6.31
Repayment of long term borrowings (1.45) (1.50) (5.16)
Proceeds from fresh issue of share capital - 2.00 25.00
Interest paid (0.23) (0.18) (0.77)
Dividend paid (0.24) - (603.04)
Dividend tax paid - - (122.85)
Net cash from/used in financing activities 1.50 1.59 (700.51)
Net increase/decrease in cash & cash equivalents (193.74) 33.47 90.41
Opening balance of cash and cash equivalents (April 01, 2016/April 01, 2015) 446.48 356.07 356.07
Closing balance of cash and cash equivalents 252.74 389.54 446.48
Cash and cash equivalents comprise
Cash in hand 4.42 3.69 6.36
Balance with scheduled banks
-in current accounts (Refer Note no 2 below) 238.25 351.85 414.68
-in fixed deposits accounts with original maturity of less than 3 months 10.07 34.00 25.44
Total cash and cash equivalents 252.74 389.54 446.48
-in Fixed deposits accounts with original maturity more than 3 months 10,656.58 2,361.07 10,580.79Total 10,909.32 2,750.61 11,027.27
10,656.58-
Notes :
1
2
3 Figures in brackets indicate cash outflow.
For and on behalf of the Board of Directors
Place : Noida
Date : July 25, 2016
The above Cash Flow Statement has been prepared under the Indirect Method as set out in Accounting Standard-3 on Cash Flow Statement notified pursuant to the Companies
(Accounting Standards) Rules, 2006 as per Section 133 of the Companies Act, 2013 read with Rule 7 of the Companies (Accounts) Rules, 2014 .
Balance with scheduled bank in current account includes ` 0.29 Mn (previous year ` 0.53 Mn) in respect of unclaimed dividend, which is not available for use by the Company.
Hitesh Oberoi Chintan Thakkar
Managing Director Director & CFO

INFO EDGE (INDIA) LIMITED
NOTES TO THE UNAUDITED CONDENSED INTERIM FINANCIAL STATEMENTS FOR THE PERIOD ENDED JUNE 30, 2016
2. SHARE CAPITAL
As at As at
Particulars June 30, 2016 March 31, 2016(` 'Mn) (` 'Mn)
AUTHORISED CAPITAL
150.00 Mn Equity Shares of ` 10/- each (Previous year - 150.00 Mn Equity
Shares of ` 10/- each) 1,500.00 1,500.00
ISSUED, SUBSCRIBED AND PAID-UP CAPITAL
120.92 Mn Equity Shares of ` 10/- each fully paid up 1,209.16 1,209.16
(Previous year - 120.92 Mn Equity Shares of ` 10/- each fully paid up)
1,209.16 1,209.16
a. Reconciliation of the shares outstanding at the beginning and at the end of the reporting period
As at As at As at As at
Particulars June 30, 2016 June 30, 2016 March 31, 2016 March 31, 2016
No of Shares (` 'Mn) No of Shares (` 'Mn)
Equity Shares
At the beginning of the period 120,916,159 1,209.16 120,216,159 1,202.16
Add: Issued during the period 700,000 7.00
Outstanding at the end of the period 120,916,159 1,209.16 120,916,159 1,209.16
b. Terms/Rights attached to equity shares
Particularsperiod ended
June 30, 2016
period ended
June 30, 2015
period ended
June 30, 2014
period ended
June 30, 2013
period ended
June 30, 2012
Equity Shares allotted as fully paid bonus shares by capitalisation of securities
premium - - - - 54,590,512
- - - - 54,590,512
d. Details of shareholders holding more than 5% shares in the Company
No. of Shares % Holding No. of Shares % Holding
Equity Shares of ` 10 each fully paid
- Sanjeev Bikhchandani 34,996,373 28.94 34,996,373 28.94
- Sanjeev Bikhchandani (Trust) 8,734,880 7.22 8,734,880 7.22
- Hitesh Oberoi 6,883,108 5.69 6,900,118 5.71
50,614,361 41.85 50,631,371 41.88
3. RESERVES AND SURPLUS
Opening Adjustment
Particulars
Securities Premium Account
Opening Balance 8,169.16 8,151.16
Add : Addition during the year - 18.00 Less: Utilisation for writing off expenses on issue of equity shares (Refer Note no 42) - 8,169.16 - 8,169.16
General Reserve
Opening Balance 327.54 317.99
Add: Transfer from Statement of Profit and Loss (Stock Options Outstanding Account) - 327.54 9.55 327.54
Stock Options Outstanding Account
Opening Balance 17.13 14.81
Add: Transfer during the year 12.20 11.87
Less: Transfer to Statement of Profit and Loss - 29.33 9.55 17.13
Surplus in Statement of Profit and Loss
Opening Balance 7,917.12 6,937.89
Add: Net profit after tax transferred from Statement of Profit and Loss 474.33 1,415.80
Transfer from Stock Option Outstanding Account - 9.55
Less: Appropriations
Dividend Paid - 0.40
Interim Dividend 362.55
Dividend Tax - 73.62
Transfer to General Reserve (Employee Stock Options Outstanding Account) - 8,391.45 9.55 7,917.12
16,917.48 16,430.95 -
Particulars As at
June 30, 2016
As at
March 31, 2016
As at
June 30, 2016
As at
March 31, 2016(` 'Mn) (` 'Mn)
1. Basis of Preparation of Unaudited Condensed Interim Financial Statements
A) These unaudited condensed interim financial statements have been prepared in accordance with Accounting Standard 25 on “Interim Financial Reporting” notified pursuant to the Companies (Accounting Standards)
Rules, 2006 as per Section 133 of the Companies Act, 2013 read with Rule 7 of the Companies (Accounts) Rules, 2014 and other accounting principle generally accepted in India. The Accounting policies followed in
preparation of these unaudited condensed interim financial statements are consistent with those followed in the most recent annual financial statements of the Company i.e. for the year ended March 31, 2016.
All assets and liabilities have been classified as current or non-current as per the Company’s normal operating cycle and other criteria set out in the Schedule III to the Companies Act, 2013.
B) The Company’s annual financial report includes the consolidated financial statements in addition to its standalone separate financial statements. The Company has, however, elected to prepare unaudited condensed
interim financial statements only on a standalone basis to ensure comparability with the unaudited quarterly results which are also prepared on a standalone basis for submission to the Stock Exchanges.
The Company has only one class of equity shares having a par value of ` 10 per share. Each holder of equity shares is entitled to one vote per share. The Company declares and pays dividend in Indian rupees. The
dividend proposed by the Board of Directors is subject to the approval of the shareholders in the ensuing Annual General Meeting, except in case of interim dividend. In the event of liquidation, the equity shareholders
are eligible to receive the remaining assets of the Company in proportion to their shareholding.
c. Aggregate number of bonus shares issued, shares issued for consideration other than cash and shares bought back during the period of five years immediately preceding the reporting date
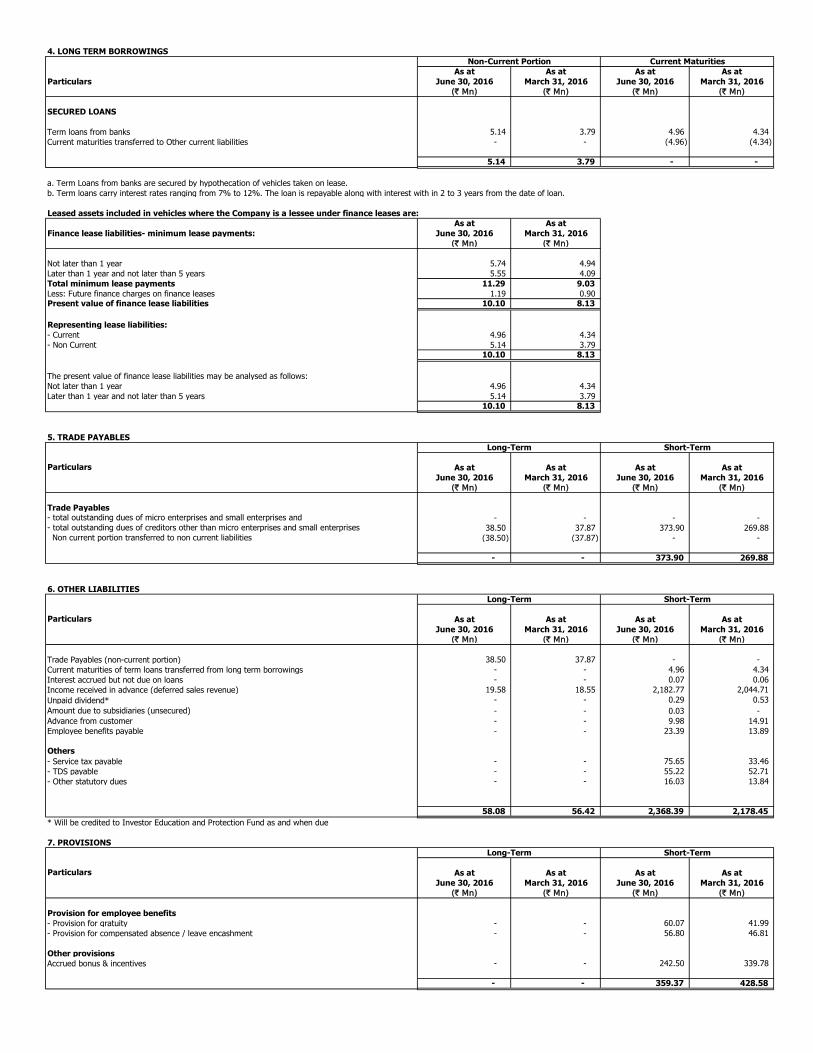
4. LONG TERM BORROWINGS
As at As at As at As at
Particulars June 30, 2016 March 31, 2016 June 30, 2016 March 31, 2016
(` Mn) (` Mn) (` Mn) (` Mn)
SECURED LOANS
Term loans from banks 5.14 3.79 4.96 4.34
Current maturities transferred to Other current liabilities - - (4.96) (4.34)
5.14 3.79 - -
a. Term Loans from banks are secured by hypothecation of vehicles taken on lease.
b. Term loans carry interest rates ranging from 7% to 12%. The loan is repayable along with interest with in 2 to 3 years from the date of loan.
Leased assets included in vehicles where the Company is a lessee under finance leases are:
As at As at
Finance lease liabilities- minimum lease payments: June 30, 2016 March 31, 2016
(` Mn) (` Mn)
Not later than 1 year 5.74 4.94
Later than 1 year and not later than 5 years 5.55 4.09
Total minimum lease payments 11.29 9.03
Less: Future finance charges on finance leases 1.19 0.90 Present value of finance lease liabilities 10.10 8.13
Representing lease liabilities:
- Current 4.96 4.34
- Non Current 5.14 3.79 10.10 8.13
The present value of finance lease liabilities may be analysed as follows:
Not later than 1 year 4.96 4.34
Later than 1 year and not later than 5 years 5.14 3.79 10.10 8.13
5. TRADE PAYABLES
As at As at As at As at
June 30, 2016 March 31, 2016 June 30, 2016 March 31, 2016
(` Mn) (` Mn) (` Mn) (` Mn)
Trade Payables- total outstanding dues of micro enterprises and small enterprises and - - - - - total outstanding dues of creditors other than micro enterprises and small enterprises 38.50 37.87 373.90 269.88 Non current portion transferred to non current liabilities (38.50) (37.87) - -
- - 373.90 269.88
6. OTHER LIABILITIES
As at As at As at As at
June 30, 2016 March 31, 2016 June 30, 2016 March 31, 2016
(` Mn) (` Mn) (` Mn) (` Mn)
Trade Payables (non-current portion) 38.50 37.87 - -
Current maturities of term loans transferred from long term borrowings - - 4.96 4.34
Interest accrued but not due on loans - - 0.07 0.06
Income received in advance (deferred sales revenue) 19.58 18.55 2,182.77 2,044.71
Unpaid dividend* - - 0.29 0.53
Amount due to subsidiaries (unsecured) - - 0.03 -
Advance from customer - - 9.98 14.91
Employee benefits payable - - 23.39 13.89
Others
- Service tax payable - - 75.65 33.46
- TDS payable - - 55.22 52.71
- Other statutory dues - - 16.03 13.84
58.08 56.42 2,368.39 2,178.45
* Will be credited to Investor Education and Protection Fund as and when due
7. PROVISIONS
As at As at As at As at
June 30, 2016 March 31, 2016 June 30, 2016 March 31, 2016
(` Mn) (` Mn) (` Mn) (` Mn)
Provision for employee benefits
- Provision for gratuity - - 60.07 41.99
- Provision for compensated absence / leave encashment - - 56.80 46.81
Other provisions
Accrued bonus & incentives - - 242.50 339.78
- - 359.37 428.58
Particulars
Long-Term Short-Term
Particulars
Long-Term Short-Term
Non-Current Portion Current Maturities
Particulars
Long-Term Short-Term
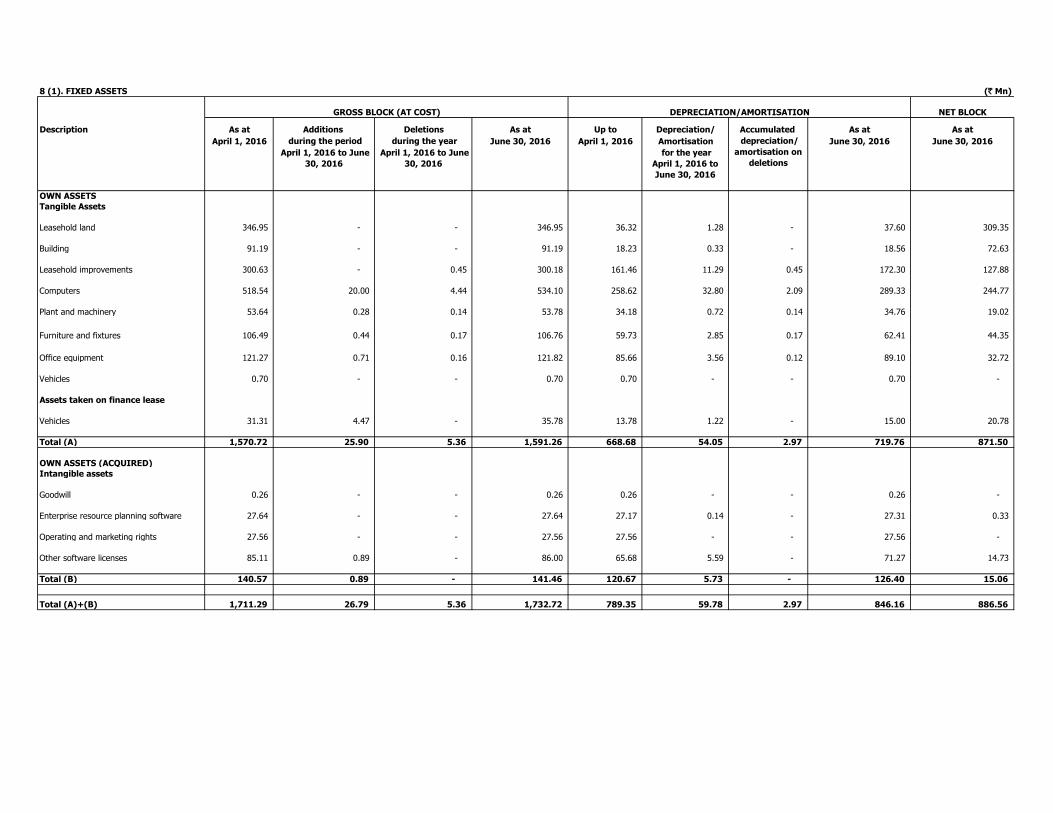
8 (1). FIXED ASSETS (` Mn)
Description As at Additions Deletions As at Up to Depreciation/ Accumulated As at As at
April 1, 2016 during the period during the year June 30, 2016 April 1, 2016 Amortisation June 30, 2016 June 30, 2016
April 1, 2016 to June
30, 2016
April 1, 2016 to June
30, 2016
for the year
April 1, 2016 to
June 30, 2016
OWN ASSETS
Tangible Assets
Leasehold land 346.95 - - 346.95 36.32 1.28 - 37.60 309.35
Building 91.19 - - 91.19 18.23 0.33 - 18.56 72.63
Leasehold improvements 300.63 - 0.45 300.18 161.46 11.29 0.45 172.30 127.88
Computers 518.54 20.00 4.44 534.10 258.62 32.80 2.09 289.33 244.77
Plant and machinery 53.64 0.28 0.14 53.78 34.18 0.72 0.14 34.76 19.02
Furniture and fixtures 106.49 0.44 0.17 106.76 59.73 2.85 0.17 62.41 44.35
Office equipment 121.27 0.71 0.16 121.82 85.66 3.56 0.12 89.10 32.72
Vehicles 0.70 - - 0.70 0.70 - - 0.70 -
Assets taken on finance lease
Vehicles 31.31 4.47 - 35.78 13.78 1.22 - 15.00 20.78
Total (A) 1,570.72 25.90 5.36 1,591.26 668.68 54.05 2.97 719.76 871.50
OWN ASSETS (ACQUIRED)
Intangible assets
Goodwill 0.26 - - 0.26 0.26 - - 0.26 -
Enterprise resource planning software 27.64 - - 27.64 27.17 0.14 - 27.31 0.33
Operating and marketing rights 27.56 - - 27.56 27.56 - - 27.56 -
Other software licenses 85.11 0.89 - 86.00 65.68 5.59 - 71.27 14.73
Total (B) 140.57 0.89 - 141.46 120.67 5.73 - 126.40 15.06
Total (A)+(B) 1,711.29 26.79 5.36 1,732.72 789.35 59.78 2.97 846.16 886.56
DEPRECIATION/AMORTISATIONGROSS BLOCK (AT COST) NET BLOCK
depreciation/
amortisation on
deletions

8 (2). FIXED ASSETS (` Mn)
Description As at Additions Deletions As at Up to Depreciation/ Accumulated As at As at
April 1, 2015 during the year during the year March 31, 2016 April 1, 2015 Amortisation March 31, 2016 March 31, 2016
April 1, 2015 to March
31, 2016
April 1, 2015 to
March 31, 2016
for the year
April 1, 2015 to
March 31, 2016
OWN ASSETS
Tangible Assets
Leasehold land 346.95 - - 346.95 31.17 5.15 - 36.32 310.63
Building 91.19 - - 91.19 16.89 1.34 - 18.23 72.96
Leasehold improvements 300.06 13.27 12.70 300.63 127.98 45.11 11.63 161.46 139.17
Computers 364.44 224.95 70.85 518.54 228.91 99.75 70.04 258.62 259.92
Plant and machinery 52.75 2.75 1.86 53.64 33.20 2.75 1.77 34.18 19.46
Furniture and fixtures 102.53 7.50 3.54 106.49 52.98 10.23 3.48 59.73 46.76
Office equipment 114.14 12.18 5.05 121.27 77.56 13.00 4.90 85.66 35.61
Vehicles 0.73 - 0.03 0.70 0.73 - 0.03 0.70 -
Assets taken on finance lease
Vehicles 26.51 8.32 3.52 31.31 12.31 3.72 2.25 13.78 17.53
Total (A) 1,399.30 268.97 97.55 1,570.72 581.73 181.05 94.10 668.68 902.04
OWN ASSETS (ACQUIRED)
Intangible assets
Goodwill 0.26 - - 0.26 0 - - 0 -
Enterprise resource planning software 27.64 - - 27.64 25.60 1.57 - 27.17 0.47
Operating and marketing rights 27.56 - - 27.56 27.56 - - 27.56 -
Other software licenses 65.28 26.07 6.24 85.11 44.91 27.01 6.24 65.68 19.43
Total (B) 120.74 26.07 6.24 140.57 98.33 28.58 6.24 120.67 19.90
Total (A)+(B) 1,520.04 295.04 103.79 1,711.29 680.06 209.63 100.34 789.35 921.94
depreciation/
amortisation on
deletions
DEPRECIATION/AMORTISATIONGROSS BLOCK (AT COST) NET BLOCK

9. NON CURRENT INVESTMENTS* - Shares
Particulars
Number of
Share
Face Value
per share
(In ` **)
(` 'Mn) (` 'Mn) Number of
Share
Face Value
per share
(In ` **)
(` 'Mn) (` 'Mn)
Other than trade investments (Unquoted) (valued at cost unless otherwise stated)
Investments in Equity instruments of Subsidiary Companies
Jeevansathi Internet Services Private Limited 9,800 10 0.10 9,800 10 0.10
-Two hundred shares (Previous year- Two hundred shares) are held by the nominees of the Company
Naukri Internet Services Limited 9,994 10 0.10 9,994 10 0.10
-Six shares (Previous year- Six shares) are held by the nominees of the Company
Allcheckdeals India Private Limited 9,847,499 10 98.47 9,847,499 10 98.47
-One share (Previous year- One share) is held by Naukri Internet Services Limited
Makesense Technologies Limited 499,994 10 82.41 499,994 10 82.41
-Six shares (Previous year Six share) are held by the nominees of the Company
-Share premium of ` 154.82/- per share (Previous year- ` 154.82 ) per share
Zomato Media Private Limited 164,451 1 868.80 164,451 1 868.80
-Share premium of ` 5282.02/- (Previous year- ` 5282.02) per share computed on average basis
Applect Learning Systems Private Limited 5,871 10 48.52 5,871 10 48.52
-Share premium of ` 8,255.31/- (Previous year- ` 8,255.31/- ) per share computed on average basis
Startup Investments (Holding) Limited 49,994 10 0.50 49,994 10 0.50
-Six shares (Previous year- Six shares) are held by the nominees of the Company
Smartweb Internet Services Limited 48,994 10 0.49 48,994.00 10 0.49
-Six shares (Previous year- Six) are held by the nominees of the Company
Startup Internet services Limited 49,994 10 0.50 49,994.00 10 0.50
-Six shares (Previous year- Six) are held by the nominees of the Company
Info Edge (India) Mauritius Limited (under liquidation) 1,112,001 USD 1 45.60 1,112,001 USD 1 45.60
Less: Provision for diminution in value of investment (45.60) (45.60)
1,099.89 1,099.89
Investments in Preference shares of Subsidiary Companies
Startup Investments (Holding) Limited 1,903,136 100 193.23 1,203,136 100 123.23
-0.0001% cumulative redeemable preference shares
Naukri Internet Services Limited 34,324,000 100 3,432.40 34,324,000 100 3,432.40
-0.0001% cumulative redeemable preference shares
Smartweb Internet Services Limited 2,350,000 100 235.61 2,350,000.00 100 235.61
-0.0001% cumulative redeemable preference shares
Startup Internet services Limited 30,000 100 3.00 30,000.00 100 3.00
-0.0001% cumulative redeemable preference shares
Zomato Media Private Limited 21,225 10 572.65 21,225 10 572.65
- 0.0001% cumulative convertible preference shares with share premium of ` 26,969.94 /-
(Previous Year-` 26,969.94 /- ) per share computed on average basis 4,436.89 4,366.89
Investments in Preference shares of Associate Companies
Kinobeo Software Private Limited 73,150 10 135.00 73,150 10 135.00
-0.1% optionally convertible cumulative redeemable preference shares with share premium of `
1,835.50/-
(Previous Year-` 2,494.61/-) per share computed on average basis
Mint Bird Technologies Private Limited 6,000,000 10 60.00 6,000,000.00 10 60.00
-optionally convertible cumulative redeemable preference shares
Rare Media Company Private Limited
-0.01% optionally convertible cumulative redeemable preference shares 743,808 100 74.38 269.38 743,808.00 100 74.38 269.38
5,806.16 5,736.16
*Long-term Investments (As per AS-13)
** Unless otherwise stated
Aggregate amount of quoted investments - - Market value of quoted investments - Aggregate amount of unquoted investments 5,851.76 5,781.76 Aggregate provision for diminution in value of investments 45.60 45.60
As at
June 30, 2016
As at
March 31, 2016

10. DEFERRED TAX ASSETS
As at As at As at
Particulars June 30, 2016 June 30, 2016 March 31, 2016
(` 'Mn) (` 'Mn) (` 'Mn)
Deferred tax asset
- Opening balance 59.56 59.56 63.72
- Adjustment for the current year 8.10 8.10 4.16-
67.66 67.66 59.56
Significant components of deferred tax assets are shown in the following table:
As at As at As atJune 30, 2016 June 30, 2016 March 31, 2016
(` 'Mn) (` 'Mn) (` 'Mn)
Deferred tax asset
Provision for compensated absence / leave encashment 7.00 9.92 9.94
Provision for lease equalisation 18.15 16.33 16.24
Provision for doubtful debts 2.43 3.40 2.42
Depreciation 33.90 27.10 22.40
Employee stock option scheme compensation (ESOP) 3.07 10.13 5.45
Others 1.22 0.78 3.11
Net deferred tax asset 65.77 67.66 59.56
11. LOANS & ADVANCES
As at As at As at As at
Particulars June 30, 2016 March 31, 2016 June 30, 2016 March 31, 2016
(Unsecured, considered good unless otherwise stated) (` Mn) (` Mn) (` Mn) (` Mn)
Capital advances
Considered good 10.77 13.81 - -
Considered doubtful 55.18 55.18 - -
Less: Provision for doubtful capital advances (55.18) (55.18) - -
Security deposits 104.65 111.37 9.16 0.99
Loans/ advance to subsidiary companies - - 100.19 38.33
Unsecured loan given - - - 10.13
Others
- Amount recoverable in cash or in kind or for value to be received 15.38 15.38 60.05 71.71
- Balance with service tax authorities - - 61.12 49.87
- Advance tax - - 4,849.69 4,653.87
Less: provision for tax - - (4,736.86) (4,479.06)
- Advance tax - fringe benefits - - 29.69 29.69
Less: provision for tax - fringe benefits - - (28.69) (28.69)
130.80 140.56 344.35 346.84
12. OTHER NON CURRENT/ CURRENT ASSETS
As at As at As at As at
Particulars June 30, 2016 March 31, 2016 June 30, 2016 March 31, 2016
(Unsecured, considered good) (` Mn) (` Mn) (` Mn) (` Mn)
Non current portion of fixed deposits transferred from cash & bank balances 9,080.65 1,505.07 - -
Interest accrued on fixed deposits 27.40 23.10 503.46 336.35
Amount receivable from subsidiary companies towards sale of shares (Refer Note 30) - - 1,411.81 1,411.81
9,108.05 1,528.17 1,915.27 1,748.16
Non-Current Current
Particulars
Long-Term Short-Term
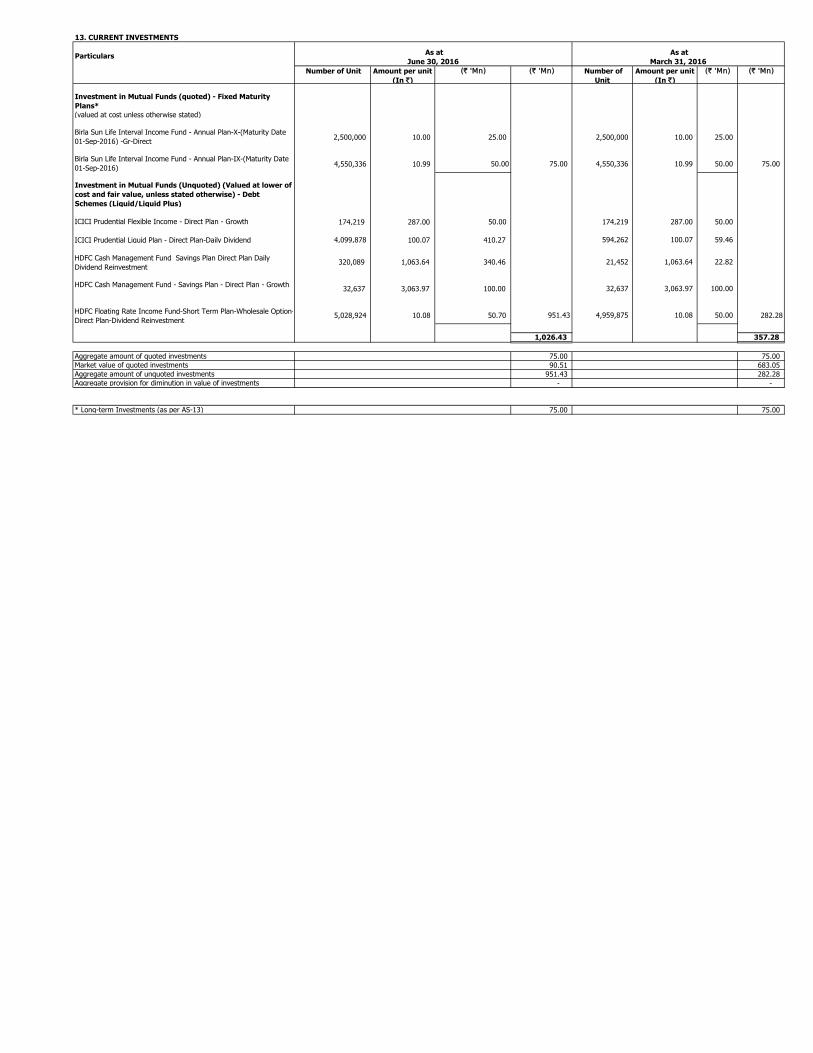
13. CURRENT INVESTMENTS
Particulars
Number of Unit Amount per unit
(In `)
(` 'Mn) (` 'Mn) Number of
Unit
Amount per unit
(In `)
(` 'Mn) (` 'Mn)
Investment in Mutual Funds (quoted) - Fixed Maturity
Plans*
(valued at cost unless otherwise stated)
Birla Sun Life Interval Income Fund - Annual Plan-X-(Maturity Date
01-Sep-2016) -Gr-Direct2,500,000 10.00 25.00 2,500,000 10.00 25.00
Birla Sun Life Interval Income Fund - Annual Plan-IX-(Maturity Date
01-Sep-2016) 4,550,336 10.99 50.00 75.00 4,550,336 10.99 50.00 75.00
Investment in Mutual Funds (Unquoted) (Valued at lower of
cost and fair value, unless stated otherwise) - Debt
Schemes (Liquid/Liquid Plus)
ICICI Prudential Flexible Income - Direct Plan - Growth 174,219 287.00 50.00 174,219 287.00 50.00
ICICI Prudential Liquid Plan - Direct Plan-Daily Dividend 4,099,878 100.07 410.27 594,262 100.07 59.46
HDFC Cash Management Fund Savings Plan Direct Plan Daily
Dividend Reinvestment 320,089 1,063.64 340.46 21,452 1,063.64 22.82
HDFC Cash Management Fund - Savings Plan - Direct Plan - Growth 32,637 3,063.97 100.00 32,637 3,063.97 100.00
HDFC Floating Rate Income Fund-Short Term Plan-Wholesale Option-
Direct Plan-Dividend Reinvestment 5,028,924 10.08 50.70 951.43 4,959,875 10.08 50.00 282.28
1,026.43 357.28
Aggregate amount of quoted investments 75.00 75.00
Market value of quoted investments 90.51 683.05
Aggregate amount of unquoted investments 951.43 282.28
Aggregate provision for diminution in value of investments - -
* Long-term Investments (as per AS-13) 75.00 75.00
As at
June 30, 2016
As at
March 31, 2016
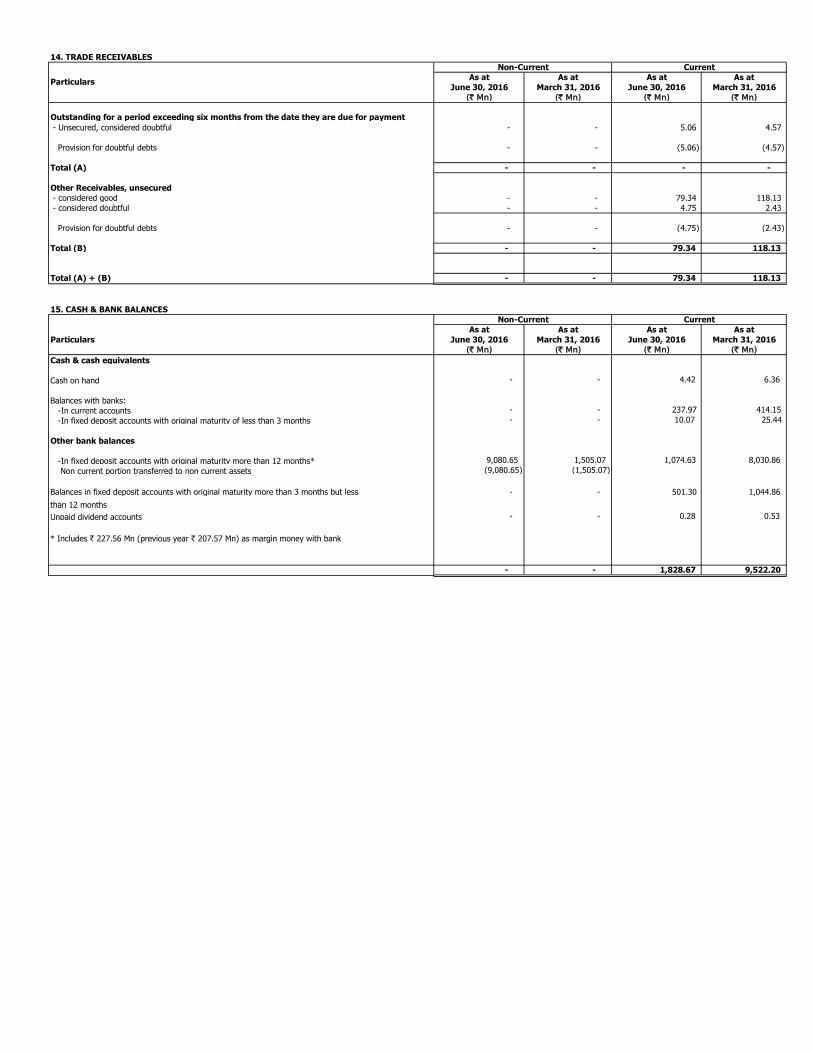
14. TRADE RECEIVABLES
As at As at As at As at
June 30, 2016 March 31, 2016 June 30, 2016 March 31, 2016
(` Mn) (` Mn) (` Mn) (` Mn)
Outstanding for a period exceeding six months from the date they are due for payment
- Unsecured, considered doubtful - - 5.06 4.57
Provision for doubtful debts - - (5.06) (4.57)
Total (A) - - - -
Other Receivables, unsecured
- considered good - - 79.34 118.13
- considered doubtful - - 4.75 2.43
Provision for doubtful debts - - (4.75) (2.43)
Total (B) - - 79.34 118.13
Total (A) + (B) - - 79.34 118.13
15. CASH & BANK BALANCES
As at As at As at As at
Particulars June 30, 2016 March 31, 2016 June 30, 2016 March 31, 2016
(` Mn) (` Mn) (` Mn) (` Mn)
Cash & cash equivalents
Cash on hand - - 4.42 6.36
Balances with banks:
-In current accounts - - 237.97 414.15
-In fixed deposit accounts with original maturity of less than 3 months - - 10.07 25.44
Other bank balances
-In fixed deposit accounts with original maturity more than 12 months* 9,080.65 1,505.07 1,074.63 8,030.86
Non current portion transferred to non current assets (9,080.65) (1,505.07)
Balances in fixed deposit accounts with original maturity more than 3 months but less - - 501.30 1,044.86
than 12 months
Unpaid dividend accounts - - 0.28 0.53
* Includes ` 227.56 Mn (previous year ` 207.57 Mn) as margin money with bank
- - 1,828.67 9,522.20
Particulars
Non-Current Current
Non-Current Current
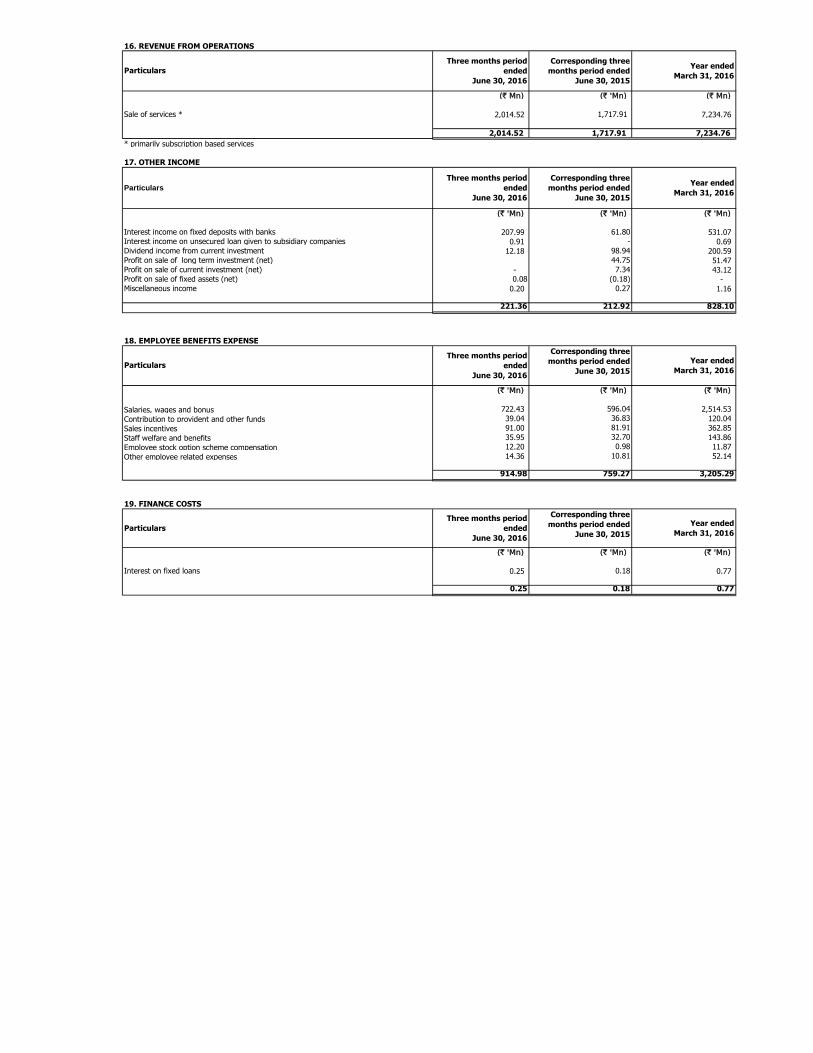
16. REVENUE FROM OPERATIONS
(` Mn) (` 'Mn) (` Mn)
Sale of services * 2,014.52 1,717.91 7,234.76
2,014.52 1,717.91 7,234.76
* primarily subscription based services
17. OTHER INCOME
(` 'Mn) (` 'Mn) (` 'Mn)
Interest income on fixed deposits with banks 207.99 61.80 531.07 Interest income on unsecured loan given to subsidiary companies 0.91 - 0.69 Dividend income from current investment 12.18 98.94 200.59 Profit on sale of long term investment (net) 44.75 51.47 Profit on sale of current investment (net) - 7.34 43.12 Profit on sale of fixed assets (net) 0.08 (0.18) - Miscellaneous income 0.20 0.27 1.16
221.36 212.92 828.10
18. EMPLOYEE BENEFITS EXPENSE
(` 'Mn) (` 'Mn) (` 'Mn)
Salaries, wages and bonus 722.43 596.04 2,514.53
Contribution to provident and other funds 39.04 36.83 120.04
Sales incentives 91.00 81.91 362.85
Staff welfare and benefits 35.95 32.70 143.86
Employee stock option scheme compensation 12.20 0.98 11.87
Other employee related expenses 14.36 10.81 52.14
914.98 759.27 3,205.29
19. FINANCE COSTS
(` 'Mn) (` 'Mn) (` 'Mn)
Interest on fixed loans 0.25 0.18 0.77
0.25 0.18 0.77
Year ended
March 31, 2016 Particulars
Three months period
ended
June 30, 2016
Corresponding three
months period ended
June 30, 2015
Particulars
Three months period
ended
June 30, 2016
Corresponding three
months period ended
June 30, 2015
Year ended
March 31, 2016
Year ended
March 31, 2016 Particulars
Three months period
ended
June 30, 2016
Corresponding three
months period ended
June 30, 2015
Particulars
Three months period
ended
June 30, 2016
Corresponding three
months period ended
June 30, 2015
Year ended
March 31, 2016

20. DEPRECIATION AND AMORTISATION
(` 'Mn) (` 'Mn) (` 'Mn)
Depreciation of tangible assets 54.05 38.00 181.05 Amortisation of intangible assets 5.73 7.02 28.58
59.78 45.02 209.63
21. ADVERTISING AND PROMOTION COST
(` 'Mn) (` 'Mn) (` 'Mn)
Advertisement expenses 254.74 380.54 1,222.79 Promotion & marketing expenses 3.24 80.55 95.62
257.98 461.09 1,318.41
22. ADMINISTRATION AND OTHER EXPENSES
(` 'Mn) (` 'Mn) (` 'Mn)
Electricity and water 21.88 20.08 71.23
Rent 59.88 58.34 240.19
Repairs and maintenance (building) 9.61 8.08 44.12
Repairs and maintenance (machinery) 11.38 9.54 40.92
Legal and professional charges 13.70 15.08 62.90
Rates & taxes - 0.14 0.14
Insurance 0.78 0.86 3.19
Communication expenses 22.16 20.04 81.32
Travel & conveyance 25.81 25.23 108.59
Bad debts /provision for doubtful debts 2.98 (0.65) (0.67)
Collection & bank related charges 8.37 7.92 32.59
Loss on sale of fixed assets (net) - 1.40
Miscellaneous expenses 40.79 38.28 180.94
Expenditure towards Corporate Social Responsibility activities (Refer Note 31) - - 36.05
217.34 202.94 902.91
23. NETWORK, INTERNET AND OTHER DIRECT CHARGES
(` 'Mn) (` 'Mn) (` 'Mn)
Internet and server charges 55.58 50.70 207.84
Others 5.94 5.55 21.86
61.52 56.25 229.70
Year ended
March 31, 2016 Particulars
Three months period
ended
June 30, 2016
Corresponding three
months period ended
June 30, 2015
Particulars
Three months period
ended
June 30, 2016
Corresponding three
months period ended
June 30, 2015 Year ended
March 31, 2016
Year ended
March 31, 2016 Particulars
Three months period
ended
June 30, 2016
Corresponding three
months period ended
June 30, 2015
Particulars
Three months period
ended
June 30, 2016
Corresponding three
months period ended
June 30, 2015
Year ended
March 31, 2016

Bank Balances :
-In Current Accounts
Balance with Banks
Domestic/
Overseas
As at
June 30, 2016
As at
March 31, 2016
(` Mn) (` Mn)
ICICI Bank Ltd Domestic 154.55 336.60
HSBC Bank Domestic 0.49 0.40
Bank of India Domestic 0.06 0.08
HDFC Bank Ltd Domestic 0.75 12.16
Punjab National Bank Domestic 0.08 0.44
Oriental Bank of Commerce Domestic 0.05 0.05
Bank of Baroda Domestic 0.25 0.25
State Bank of Hyderabad Domestic 0.05 0.25
State Bank of India Domestic 0.64 0.71
The Saudi Hollandi Bank Overseas 47.72 43.59
HSBC Bank Overseas 26.14 14.59
Emirates Bank Overseas 0.07 0.08
Bank of Baroda Overseas 7.12 4.95
Total 237.97 414.15
(Refer Balances with Banks in Current Accounts (Current) under Note No 15 on Cash and Bank Balances)
-In Fixed deposit accounts
Fixed Deposit in India
As at
June 30, 2016
As at
March 31, 2016
(` Mn) (` Mn)
Bank of India 2,719.20 2,719.20
ICICI Bank Ltd 1,459.72 1,465.88
State Bank of Hyderabad 1,434.17 1,339.28
HDFC Bank Ltd 1,541.35 1,519.66
Oriental Bank of Commerce 956.00 956.00
HSBC Bank 7.21 7.21
Bank of Baroda 1,943.70 1,943.70
Punjab National Bank 605.30 655.30
Total 10,666.65 10,606.23
The above comprises of :-
Particulars
As at
June 30, 2016
As at
March 31, 2016
(` Mn) (` Mn)
- Fixed Deposit Accounts with original maturity of less than 3 months 10.07 25.44
- Fixed Deposit Accounts with original maturity for more than 12 months 10,155.28 9,535.93
- Fixed Deposit Accounts with original maturity for more than 3 months but less than 12 months 501.30 1,044.86
Total 10,666.65 10,606.23
(Refer Note No 15 on Cash and Bank Balances & Note No 12 on Other non-current assets )
Utilisation of funds upto : June 30, 2016
` (Mn)
March 31, 2016
` (Mn)
Working capital and general corporate purposes (99acres) 135.09 952.90
Balance Unutilised funds as at the quarter/year end 6,256.36 6,391.45
24. The details of Bank Balances as referred to in Note 14 to the unaudited condensed interim financial statements are as below:-
25. During the year ended March 31, 2015 , the Company had issued 10,135,135 equity shares of ` 10/- each fully paid up at ` 740/- per share (including securities premium of ` 730/- per
share) to qualified institutional buyers on September 12, 2014 pursuant to Qualified Institutional Placement (QIP) document, dated September 10th, 2014, as per provisions of section 42 of
Companies Act, 2013 read with rule 14 of the Companies (Prospectus and Allotment of Securities) Rules 2014, and Chapter VIII of the Securities and Exchange Board of India (Issue of
Capital and Disclosure Requirements) Regulations, 2009 which have been listed in the respective Stock Exchanges on September 16, 2014.
Expenses incurred in relation to QIP amounting to ` 155.65 Mn had been adjusted from Securities Premium Account during the year ended March 31, 2015.The utilisation out of such net
amount of ` 7,344.35 Mn till June 30, 2016 is given below. The balance amount of QIP proceeds remains invested in Mutual Funds (Debt) & Term Deposits with banks.

Amount in ` (Mn)
3 months ended
30/06/2016
3 months ended
30/06/2015
Year ended
2015-16
1
1,460.94 1,247.17 5,311.96
294.55 252.81 1,106.22
259.03 217.93 816.58
2,014.52 1,717.91 7,234.76
2
746.55 639.28 2751.91
(178.93) (361.40) (980.05)
(8.62) (34.80) (174.99)
559.00 243.08 1596.87
56.33 49.92 227.43
221.36 212.92 826.71
- - (114.58)
724.03 406.08 2081.57
249.70 118.60 665.77
474.33 287.48 1415.80
3
327.56 348.72 411.43
212.30 195.67 233.11
98.47 91.94 100.44
638.33 636.33 744.98
20,653.19 19,491.83 19,832.25
21,291.52 20,128.16 20,577.23
4
2,179.84 1,867.26 1985.82
470.19 584.36 461.13
388.41 312.16 398.07
3,038.44 2,763.78 2845.02
126.44 449.91 92.10
3,164.88 3,213.69 2937.12
5
7.35 13.96 125.49
6.81 10.03 103.33
4.37 5.71 44.33
18.53 29.70 273.15
8.26 0.72 21.89
26.79 30.42 295.04
6
22.47 21.92 94.06
17.84 14.18 68.35
7.84 5.70 27.49
48.15 41.80 189.90
11.63 3.22 19.73
59.78 45.02 209.63
7
- -
- -
- -
- - -
Other Significant non cash Expenses other than DepreciationRecruitment solutions
99acres for real estate
Others
Total
Recruitment solutions
99acres for real estate
Others
Total Segment depreciation & amortisationDepreciation & amortisation unallocable
Total depreciation & amortisation
99acres for real estate
Others
Total Segment Capital ExpenditureCapital Expenditure unallocable
Total Capital Expenditure
Depreication & amortisation
Others
Total Segment LiabilitiesUnallocable liabilites
Total Liabilities
Capital ExpenditureRecruitment solutions
Total Segment AssetsUnallocable assets
Total assets
LiabilitiesRecruitment solutions
99acres for real estate
Tax Expense
Profit after tax
AssetsRecruitment solutions
99acres for real estate
Others
Others
Total Segment ResultLess: unallocable expenses
Add : unallocated Income
Exceptional Item - Income/(Loss)
Profit Before Tax
99acres for real estate
Others
Segment Revenue-Total
Results (Profit/(Loss)) after tax:Recruitment Solutions
99acres for real estate
26. The Company has received various legal notices of claims/lawsuits filed against including suits relating to infringement of Intellectual Property
Rights (IPR), Consumer suits, etc.in relation to the business activities carried on by it. In the opinion of the management, no material liability is likely to
arise on account of such claims/law suits.
27. The Company has considered business segment as the primary segment. The Company is primarily in the business of internet based service
delivery operating in four service verticals through various web portals in respective verticals namely recruitment solutions comprising primarily
naukri.com, other recruitment related portals and ancillary services related to recruitment, 99acres.com for real estate related services,
Jeevansathi.com for matrimony related services and Shiksha.com for education related services.
Considering the changing trend in scale of operations in some of the service verticals, the management has started monitoring the performance of
each of these verticals on regular basis with effect from quarter ended June 30, 2015 and therefore these have been considered as reportable
segments under Accounting Standard 17 on Segment Reporting. The reportable segments represent "Recruitment Solutions" and "99acres” and the
"Others" segment which comprises primarily Jeevansathi and Shiksha service verticals since they individually do not meet the qualifying criteria for
reportable segment as per the said Accounting Standard.
Particular
Segment Revenue:Recruitment solutions

March 31, 2016
` (Mn)(341.60)
29.42
426.76
114.58
Period ended
June 30, 2016
Year ended
March 31, 2016
` (Mn) ` (Mn)
- 36.05
- 36.05
Period ended
June 30, 2016
Year ended
March 31, 2016
` (Mn) ` (Mn)
1.00
1.50
31.05
2.50
- 36.05
For and on behalf of the Board of Directors
Hitesh Oberoi Chintan ThakkarManaging Director Director & CFO
Place: Noida
Date : July 25, 2016
Joint Women's Programme
International Foundation for Research & Education
The Blind Relief Association
32. Previous period/year figures have been regrouped/rearranged to conform to the current period classification.
Gross Amount required to be spent by the Company
Amount spent (paid) by the Company during the year
Vendor Name
Social Outreach Foundation
a) During previous year, the Company has transferred its investment [5,975 equity and 2,673 compulsorily convertible preference shares] in eTechaces
Marketing & Consulting Private Limited (EMCPL) to its subsidiary Makesense Technologies Limited (MTL) formely known as Makesense Technologies
Pvt. Ltd. for a consideration of Rs. 513.39 Mn thereby resulting in a profit of Rs. 341.60 Mn , which is shown as an exceptional item in the Statement of
Profit and Loss. The Audit Committee and the Board of Directors had approved the transaction during the year ended March 31, 2015, taking a holistic
view of the same, based on the business rationale, which when considered in its entirety, provides a sound basis to conclude that the transaction is not
prejudicial to the interest of the Company or its shareholders and demonstrates the intention of the Company to transact at arm’s length with its
subsidiary.
b) This represents an additional provision made during previous year for bonus related to April 1, 2014 to March 31, 2015 amounting to ` 29.42 Mn
pursuant to retrospective amendment to"The Payment of Bonus Act, 1965" notified on January 1, 2016.
c) During previous year, diminution in the carrying value of investment amounting to ` 426.76 Mn has been made in respect of Canvera Digital
Technologies Private Limited for decline considered as other than temporary (represented by investments in equity shares of ` 25.61 Mn and
Preference shares of ` 401.15 Mn).
30. During the previous year
a) the Company has transferred its enitre shareholding (i.e. 34,711 equity shares & 532,216 preference shares) (Previous year Nil) of Canvera Digital
Technologies Private Limited to its subsidiary Smartweb Internet Services Limited at book value amounting to Rs. 243.78 Mn
b) the Company has transferred its enitre shareholding (i.e. 275 equity shares & 6,635 pref shares) (Previous year Nil) of Happily Unmarried Marketing
Private Limited to its wholly owned subsidiary Startup Investment (Holding) Limited at book value amounting to Rs. 113.49 Mn
c) the Company has transferred 13,429 equity shares & 249,974,932 preference share (Previous year Nil) of Applect Learning Systems Private Limited
to its wholly owned subsidiary Startup Investment (Holding) Limited at book value amounting to Rs. 919.54 Mn.
d) the Company has transferred 34,651 preference shares (Previous year Nil) of Kinobeo Software Private Limited to its wholly owned subsidiary
Startup Investment (Holding) Limited at book value amounting to Rs. 135 Mn.
e) the Company has transferred 1000 preference shares (Previous year Nil) of Smartweb Internet Services Limited to its wholly owned subsidiary
Startup Investment (Holding) Limited at book value amounting to Rs. 0.01 Mn31. As per Section 135 of the Companies Act, 2013 (‘Act’), a corporate social responsibility (CSR) committee had been formed by the Company in
previous year. The main areas for CSR activities, as per the CSR policy of the Company are promoting education, training to promote sports and
contribution to appropriate funds set up by the Central Government, further the CSR Committee may consider other CSR activities subject to the
condition that such activities relate to the subjects enumerated in Schedule VII of the Act.
Details of corporate social responsibility (CSR) are as below :
Particulars
29. During the previous year exceptional items includes
Particulars
Profit on sale of investments (Refer note a below)
Less: Provision for Bonus ((Refer note b below)
Less: Diminution in value other than temporary of an investment in an associate (Refer note c below)
Total [(Income)/Expense]
28. Diluted EPS represents earning per share based on the total number of shares including the potential estimated number of shares to be issued
against stock options in force under the existing stock option plan/scheme.