kajiado county 2017 long rains food security …
TRANSCRIPT

KAJIADO COUNTY 2017 LONG RAINS FOOD SECURITY ASSESSMENT REPORT
A Joint Report by Kenya Food Security Steering Group (KFSSG)1 and
Kajiado County Steering Group (CSG)
July, 2017
1 Patrick Muiruri - Ministry of Agriculture, Livestock and Fisheries and
David Palla - Ministry of Agriculture, Livestock and Fisheries

2
TABLE OF CONTENTS
EXECUTIVE SUMMARY ................................................................................................................................... 3 1. INTRODUCTION ............................................................................................................................................ 4
1.1 County background .......................................................................................................................... 4 1.2 Objectives and approach .................................................................................................................. 4
2. DRIVERS OF FOOD AND NUTRITION SECURITY IN THE COUNTY ................................................... 4 2.1 Rainfall performance ........................................................................................................................ 4 2.2 Insecurity/Conflict ............................................................................................................................ 5 2.3 Other shocks and hazards ................................................................................................................ 5
3. IMPACTS OF DRIVERS ON FOOD AND NUTRITION SECURITY .......................................................... 5 3.1 Availability......................................................................................................................................... 5
3.1.1 Crops production .......................................................................................................................... 5 3.1.2 Livestock production.................................................................................................................... 6
3.2 Access ................................................................................................................................................. 9 3.2.1 Markets prices .............................................................................................................................. 9 3.2.2 Terms of trade (ToTs) ................................................................................................................ 10 3.2.3 Income sources ........................................................................................................................... 10 3.2.4 Water access and availability (including cost and consumption) .............................................. 11 3.2.5 Food consumption ...................................................................................................................... 11 3.2.6 Coping strategy .......................................................................................................................... 12
3.3 Utilization......................................................................................................................................... 12 3.3.1 Nutritional status ........................................................................................................................ 12 3.3.2 Morbidity prevalence ................................................................................................................. 12 3.3.3 Sanitation and hygiene ............................................................................................................... 13
3.4 Trends of key food security indicators .......................................................................................... 13 3.5 Education ......................................................................................................................................... 14
4. FOOD SECURITY PROGNOSIS .................................................................................................................. 15 4.1 Assumptions..................................................................................................................................... 15 4.2 Outlook for August to October 2017 ............................................................................................. 15 4.3 Outlook for November 2017 to January 2017 .............................................................................. 15
5. CONCLUSION AND INTERVENTIONS ..................................................................................................... 15 5.1 Conclusion ....................................................................................................................................... 15
5.1.1 Phase classification .................................................................................................................... 15 5.1.3 Sub-county ranking in Kajiado County...................................................................................... 16
5.2 Ongoing Interventions .................................................................................................................... 16 5.2.1 Food interventions...................................................................................................................... 16
5.3 Recommended non-food interventions .......................................................................................... 17 5.3.1 Food interventions...................................................................................................................... 20

3
EXECUTIVE SUMMARY
The county is classified in Stressed (IPC Phase 2) similar to the previous assessment. The
proportion of households in the county with acceptable food consumption score has declined
from 63 percent in January 2017 to 55 percent in June 2017, indicating declining household
dietary diversity and food frequency. The mean coping strategy index in June 2017 was 6.63 as
compared to 1.1 in June 2016, implying that households having increased the employment of
consumption-based strategies.
The overall nutritional status is deteriorating. The percentage of children under five years at risk
of malnutrition using the mid-upper arm circumference (MUAC) in June 2017 was at 15.2
percent as compared to 6.89 in June 2016. The prevalence of the three most common diseases
from January–May 2017 shows a decline for under five children compared to the same period in
2016. For the under-five children, the prevalence of upper respiratory tract infections (URTI)
was at 1.4 percent, diarrhoea at 1.8 percent and malaria at 17.5 percent. For the general
population, URTI increased by 3.1 percent, diarrhoea and malaria decreased by 5.2 and 8.9
percent respectively. Vitamin A supplementation for the period January-May 2017 was 101
percent for children 6-11 months and 70 percent for children 12-59 months. The coverage of the
fully immunized child in January–May 2017 was at 75 percent. Water consumption per person
per day was below the sphere standards of 15 litres per person per day.
Maize production in the agro-pastoral and mixed farming livelihood zone decreased by 90
percent of the Long-Term Average (LTA), reducing availability at the household level.
Households, millers and traders were holding 32, 61 and 24 percent of the LTA of the total
maize stocks. Milk production declined by 50 to 70 percent due to livestock migration thus
affecting household milk production and consumption in the pastoral and agro-pastoral zones.
The terms of trade (ToT) were unfavourable and below the LTA thus limiting household food
access particularly in the pastoral livelihood areas. Maize prices were high as farmers were
relying on markets for household supplies. Livestock body condition was deteriorating leading to
the price of goat being below the LTA. The current factors affecting food security include: late
rainfall onset, low amounts and early cessation of rainfall which negatively affected water and
forage situation thus triggering early livestock migration that constrained household milk
production and consumption and negatively affecting food security.

4
Figure 2: Rainfall performance in Kajiado County
Figure 3: Rainfall performance in Kajiado County
Figure 1: Proportion of population by livelihood
1. INTRODUCTION
1.1 County background
Kajiado County covers an approximate area of
21,902 square kilometres with an estimated
population of 687,312 people (KNBS 2009).
The County is administratively divided into five
sub-counties namely: Kajiado Central, Kajiado
North, Kajiado South, Kajiado East and Kajiado
West. The three main livelihood zones include
pastoral-all species, agro-pastoral and mixed
farming livelihood zones (Figure 1).
1.2 Objectives and approach
The overall objective of the assessment was to develop an unbiased, evidence-based and
transparent food security situation analysis following the long rains season of 2017 taking into
account the cumulative effect of the previous seasons; as well as to provide recommendations for
possible response options based on the situation analysis by building consensus. The specific
objective was to review existing data on the current situation analysis as provided by the various
sectors and determine the food security trends for previous seasons. The assessment
methodology employed included an initial county status briefing which was conducted on 10th
June 2017, presentation of sectoral checklists from agriculture, livestock, water, education,
health and nutrition sectors. The team then conducted transect drives across the three livelihood
zones in order to have a quick assessment of the field situation on the performance of the season
for two days. The team visited sites in Bisil, Lenkism, Isnet, Entarara, Rombo, Magadi, Mile 46,
Eyarata and Ewuaso and livestock markets of Kimana and Shompole. During the transect drives,
the teams collected sector-wide food security data using community and household interviews,
focus group discussions and key informant interviews. The collected primary and secondary data
was analyzed on the fourth day, the county food security draft report compiled for sharing during
the de-briefing in the County steering group meeting on the last day.
2. DRIVERS OF FOOD AND NUTRITION SECURITY IN THE COUNTY
2.1 Rainfall performance
The onset was 20 days late since it began in
the third dekad of March instead of the first
dekad normally. Most parts of the county
received between 50–75 percent of the
normal rainfall with parts of Kajiado West,
East and Central receiving 25–50 percent of
normal rainfall. The spatial distribution was
uneven and the temporal distribution was
poor. Cessation was early in the first dekad
of June instead of the third dekad normally.

5
2.2 Insecurity/Conflict
Human-wildlife conflict was reported among farming communities especially at water points
where elephants have destroyed water pans and taps at community borehole outlets near the
game parks.
2.3 Other shocks and hazards
The presence of the Fall Army Worm which has reduced maize production in the county.
3. IMPACTS OF DRIVERS ON FOOD AND NUTRITION SECURITY
3.1 Availability
Food availability is one of the food and nutrition security pillars. Its performance is influenced
by livestock and crop production, food stocks at household level and market supplies. The
markets remained stable with no disruptions during the long rains, though livestock prices were
depressed.
3.1.1 Crops production
The long rains season is the most reliable for crop production in the county, with maize, beans
and pigeon peas being the major crops grown. Maize production contributes 75 percent to food
in the pastoral and mixed farming livelihood zones. It also contributes 70 percent to the same in
the agro-pastoral livelihood zone. In addition, it contributes 35 percent to cash income to both
the mixed farming and agro-pastoral livelihood zones and 10 percent to the pastoral livelihood
zone.
The area under production of maize, beans and potatoes was 94, 96 and 83 percent of the LTA
respectively (Table 1). The projected production for maize, beans and potatoes was 10, 17 and 79
percent of the LTA respectively. The lower-than-average production of maize was due to poor
performance of the long rains and the infestation of the fall army-worm that affected 400 acres in
parts of Euwaso Kedong, Illdamat and Rombo. For potatoes, the drop was mainly attributed to
insufficient certified seeds and losses due to pests and diseases.
Table 1: Rain-fed crop production
Irrigated crop production The area under tomatoes and onions increased by 23 and 12 percent above the LTA attributed to
improved prevailing market prices which acted as an incentive to increase the acreage, while that
of maize was 85 percent of the LTA (Table 2). The decline in the acreage under maize was
attributed to a decrease in irrigation water and the devastating effects of the migratory pest, the
fall army-worm. Tomato and onion production increased by 13 and 14 percent above the LTA
attributed to timely and proper pest and disease control, and farmers knowledge of good
agricultural practices. Maize production decreased by 15 percent as farmers opted to go for high
value crops.
Crop Area planted
during 2017
Long rains
season (Ha)
Long Term
Average (5 year)
area planted during the
Long rains season (Ha)
2017 Long rains
season production
(90 kg bags)
Projected/Actual
Long Term Average (5
year) production
during the Long rains
season (90 kg bags)
Maize 7,827 8240 16,480 338,000
Beans 13,552 14,110 28,220 169,320
Potatoes 150 180 8,290 10,500

6
Table 2: Crop production under irrigated agriculture
Crop Area planted
during the 2017
Long rains
season
(ha)
Long Term
Average (3
years) area
planted during
Long rains
season (ha)
2017 Long rains
season production
(90 kg bags/T)
Projected/actual
Long Term Average
(3 years) production
during 2017 Long
rains season
(90 kg bags/T)
Tomatoes 1,185 958 13,035 11,496
Maize 170 200 2,550 3,000
Onion 65 58 320 280
Cereal stocks in the county
Maize is a common staple across all livelihood zones within the county. In the pastoral
livelihood zone, milk and beef as well as maize flour are the staple food items. In the mixed
farming livelihood zones, potatoes, maize, milk and other livestock products are the staple food
items. Sorghum and millet are used for blending with maize.
The maize stocks held by farmers, millers and traders were 32, 61 and 24 percent of the LTA
respectively while the total stocks held were 37 percent of the LTA (Table 3). The maize stocks
are projected to last for slightly more than a week due to poor yields achieved in the last season.
The households were largely relying on markets. Traders were receiving their stocks from
imports and a few households that were willing to sell. Most stocks held by traders were from
external sources such as Trans Nzoia and Tanzania.
Table 3: Quantities held in the county
3.1.2 Livestock production
Livestock keeping is a major economic activity for the county through the sale of cattle, sheep,
goats and their by-products such as milk, hides and skins. It contributes 70, 48 and 30 percent to
cash income for households in the pastoral, agro-pastoral and mixed farming livelihood zones
respectively. The major livestock species kept are cattle, goats and sheep. The cattle breeds
consist mainly of zebu and its crosses; sahiwal and boran. Other livestock kept include poultry,
pigs, rabbits, fish and bees. Dairy cattle crosses are also kept in the agro-pastoral and mixed
farming livelihood zones. Several factors are affecting livestock development in the county
which include: frequent dry spells, environmental degradation, heavy incidences of livestock
diseases and poor husbandry practices. Others include inadequate access to livestock services
such as veterinary services, supply of animal feeds and marketing information.
Commodity Period Households Traders Millers NCPB Total
Maize (in 90 kg bags) Current 10850 4835 1070 120 16875
LTA 33780 7872 4427 0 46079
Rice (in 50 kg bags) Current 0 6230 310 0 6540
LTA 200 8044 0 0 8244
Millet (in 90 kg bags) Current 158 93 10 0 261
LTA 450 189 35 0 674
Sorghum (in 90 kg bags) Current 83 48 15 0 146
LTA 190 106 80 0 376

7
Pasture and browse
Pasture situation was poor in both pastoral and agro-pastoral livelihood zones (Table 4) and
expected to last up to end of July as compared with September normally. The variations were
caused by below-normal short and long rains received and real estate development which was
reducing pasture production and availability in Kajiado East. In the pastoral livelihood zones of
Magadi, Mosiro, Ewuaso, Lenkism, Mbirikani and Olgulului, pasture failed to regenerate as only
traces of rainfall were received.
Browse was fair in both pastoral and agro-pastoral livelihood zones (Table 4). It was projected to
last for 1-2 months up to August as compared with a normal of 3-5 months (from October
through to December). Factors affecting access to pasture and browse include long trekking
distances, land sub-division and industrial zonation. Others include competition with wildlife
over grazing and water resources, environmental degradation due to soil erosion and invasive
weeds such as Ipomoea species and Prosopis.
Table 4: Pasture and browse condition
Livelihood zone Pasture Browse Trend
Current Normal Current Normal
Pastoral Poor Good Fair Good Worsening
Agro-pastoral Poor Good Fair Good Deteriorating
Mixed farming Fair Good - - Deteriorating
Livestock productivity
Livestock body condition
Livestock body conditions for different species ranged from fair to poor across all livelihood
zones (Table 5). Cattle were the most affected with body condition being fair and poor in the
agro-pastoral and pastoral areas respectively. The body condition of shoats was good to fair in
the agro-pastoral and pastoral livelihood zones due to availability of browse. The trend in
livestock body condition was deteriorating for all livestock species. Prevailing hot weather
conditions were drying up the available forage and reducing its quantity and quality.
Table 5: Livestock body condition
Livelihood zone Cattle Sheep Goats
Current Normal Current Normal Current Normal
Pastoral Poor Good Fair Good Fair Good
Agro pastoral Fair Good Fair Good Good Good
Mixed farming Fair Good Good Good Good Good
Milk production, consumption and prices
Pastoral zones depend on sheep, goats and cattle for milk production while during livestock
migration milk production is mainly from sheep and goats. Cattle and goats are the main source
of milk for agro-pastoral and mixed farming livelihood zones (Table 6).
Table 6: Milk availability and consumption in Kajiado County
Livelihood
zone
Milk production in
Litres/Household
Milk consumption in
Litres/Household
Price in Kshs/Litre
Current LTA Current LTA Current LTA
Pastoral 1-2 12 1 5 60 45
Agro-
pastoral
1-3 10 2 4 60 45
Mixed
farming
2-3 20 2 3 60 45

8
Tropical Livestock Units (TLUs)
The average TLUs per household was below-normal, which was attributed to reduction in herd
sizes during the last three seasons that have had below-normal rains (Table 7).
Table 7: Tropical Livestock Units in Kajiado County
Livelihood zone Poor income households Medium income households
Current Normal Current Normal
Pastoral 7 10 16 20
Agro-pastoral 6 8 10 14
Mixed farming 3 3 5 5
Birth rate
Birth rates in cattle were below-normal across the livelihood zones. The below-average short and
long rains received affected cattle breeding in both agro-pastoral and pastoral livelihood zones,
thus reducing calving rates. However, kidding and lambing rates were normal in both agro-
pastoral and pastoral areas.
Livestock migration
There was out-migration of livestock from Ewaso to Mai Mahui (Nakuru County), Kajiado
central to Maparasha towards Chulu, Kajiado East towards Mashuru, Chulu, Makueni (Konza
and Lukenya). In Kajiado South, the current migratory routes were from Lenkism, Eselenkei,
Kuku, Mbirikani to Chulu. Livestock in Rombo have migrated towards Tsavo west.
The migration has taken place earlier than normal although the routes were normal. The
livestock species and proportion that have migrated include bulls and dry cows approximated at
70 percent. The projected trend was that out-migration will continue to bordering counties and
parks with pastures and water depleting rapidly due to overstocking.
There was a lot of livestock concentration in Chyulu hills leading to over-stocking and causing
faster depletion of available grazing and water resources. There was a likelihood of livestock
moving towards Taita Taveta and other coastal counties, which is likely to result in break-out of
Foot and Mouth Disease (FMD), East Coast Fever (ECF) and Trypanosomiasis.
Livestock diseases and mortalities
There were reported cases of Foot and Mouth Disease (FMD) in Ilpolosat and Oltiasika,
Contagious Caprine Pleuro-Pneumonia in Kajiado West and South Sub-counties, Sheep and Goat
Pox in Matapato North and Dalalekutuk and Trypanosomiasis in Oltiasika. There were however
no mortalities reported as a result of diseases. In Olpirikata, there were reported cases of wild
dogs and hyenas killing shoats and donkeys.
Disease control measures undertaken since January to June 2017 include vector control of tsetse
in Magadi and Loitokitok, disease surveillance of trans-boundary animal diseases and
participatory disease surveillance. Others include vaccinations against FMD in Kajiado East and
West Sub-counties, Contagious Bovine Pleuro-Pneumonia (CBPP) in Kajiado West, East, and
Central Sub-counties, Contagious Caprine Pleuro-Pneumonia (CCPP) in Kajiado Central Sub-
county and Lumpy Skin Disease in Kajiado Central and South Sub-counties. Livestock mortality
rates were within normal ranges.

9
Water for livestock
Water sources and availability
The current sources of water are water pans, boreholes, springs, wells and piped water (Table 8).
Most of the water pans were not fully recharged and some had dried up. The only reliable source
left were few boreholes that had led to increased distances to water sources as households
walked further to access them. The limiting factors affecting access to water was human/wildlife
conflict and frequent breakdown of boreholes. In Kajiado West Sub-county especially in
Singiraine, the watering frequency was once in every two days with trekking distances of up to
30 km. In Chulu the frequency was once in three days. The variation in watering frequency was
occasioned by increased trekking distances to watering points and overstocking. The volume of
water in watering points was expected to decrease thus increasing the distances covered from
grazing areas to watering points.
Table 8: Water for livestock in Kajiado County
Livelihoo
d zone
Sources Return trekking
distances
Expected duration
to last
Watering
frequency
Current Normal Current Normal Current Normal Current Normal
Pastoral Water pans,
rivers,
boreholes,
piped water,
water
trucking
Rivers, water
pans,
boreholes
15 5 Less
than a
month
3
months
Once in
three
days
Daily
Agro-
pastoral
Boreholes,
water pans,
rivers
Rivers, water
pans ,
boreholes
5 3 A
month
4
months
Once in
two
days
Daily
Mixed
farming
Water
canals, piped
water
Water canals,
piped water
<1 <1 Unlimit
ed
Unlimit
ed
Daily Daily
3.2 Access
3.2.1 Markets prices
Market operations were normal, however livestock prices were below-normal due to oversupply
since the sale of livestock was the main source of income for purchase of household
commodities because of reduced maize stocks in households. Goat prices were below the LTA.
The major markets in the county include Kimana, Emali, Mashuru, Kitengela and Shompole in
the pastoral livelihood zone, Rombo, Kiserian, Kajiado, Bisil, Namanga in the agro-pastoral
livelihood zone and Loitokitok, Ngong, Soko Mjinga Ongata Rongai in the mixed farming
livelihood zone.
The main commodities traded in the markets were livestock and related products, crop produce
and household items sourced within the county as well as Trans-nzoia County and Tanzania.
Traded volumes were below-normal for the season. Market purchases continued to be an
important source of food items for the households.

10
Figure 4: Goat prices in Kajiado County
Figure 5: Terms of trade in Kajiado County
Maize prices
The pastoral zone recorded the highest maize
price of Kshs. 65 while the lowest price of Ksh.
60 was reported in the agro-pastoral and mixed
farming areas. The average price of maize has
increased since March due to scarcity across all
livelihood zones. Prices were currently 30 percent
above the LTA (Figure 3) and were projected to
remain high due to high demand as farmers relied
on the market across all livelihood zones and less
from on-farm production.
Goat prices
Goat prices have been steadily increasing from
March 2017 when they were below-average
and in June 2017 they reached near-average
(Figure 4). The average price of a goat was
Ksh. 2,750 in March 2017 and increased to
Ksh. 2,950 in June 2017. Prices of goats were
expected to remain nearly stable for a month as
their body condition were still fair, however,
the prices will decline as browse becomes
depleted.
3.2.2 Terms of trade (ToTs)
The terms of trade (ToTs) were 74 percent of the
LTA in June 2017 as compared to 68 percent in
June 2016 (Figure 5). The decline was attributed
to increased maize prices against stable goat
prices. The ToTs were unfavorable to livestock
producers in June 2017 since the proceeds from
the sale of a goat could purchase 45 kg of maize
compared with the LTA of 60 kg.
3.2.3 Income sources
The main sources of income include crop and
livestock production. Other sources include
casual and waged labour. Crop production is
significant in the agro-pastoral and mixed
farming areas. Maize, beans and Irish potatoes
contribute (70, 15, 6) and (75, 10, 4) percent to
food and (35, 20, 15) and (35, 45, 4) percent to income in the agro-pastoral and mixed farming
livelihood zones respectively, thus households normally rely heavily on own production for food.
The contribution of livestock production to cash income in the pastoral, agro-pastoral and mixed
Figure 3: Goat prices in Kajiado County

11
farming livelihood zones is 70, 48 and 30 percent respectively and as such pastoral households
mainly relied on the sale of livestock to purchase food commodities.
3.2.4 Water access and availability (including cost and consumption)
Major water sources
The main sources of water for domestic use in the county are rivers, dams, pans, boreholes, and
springs. Other sources are piped water and traditional wells. Rivers and pans levels were slightly
below-normal although boreholes were still operational as the aquifers were fairly constant. The
Ewaso-Ngiro river flow kept fluctuating according to the rains received around Mau area where
the river originates thus replenishing the rivers. The recharge level averaged slightly less than
normal and consequently, the pans and dams were slightly below-normal at 60 percent and are
projected to last for two months in the pastoral livelihood zone and about three months in the
mixed farming livelihood zone. There were no incidences of conflicts resulting from water
shortage reported except for human-wildlife conflict where elephants destroyed taps and water
pans.
Distances to water sources
The distances to water for domestic and livestock usage had changed in the pastoral and agro-
pastoral livelihood zone from 10-30 km (Table 9). The animals had moved to grazing areas far
from homesteads in search of water. Usage of water in the pastoral areas was from boreholes and
water pans. Recharge level for boreholes and shallow wells stood at an average of 55 percent. In
mixed farming livelihood zone, water distances were within normal.
Water consumption and cost
The average household water consumption was 2-10 litres per person per day compared to the
normal 20 litres in the pastoral livelihood zone. Consumption was 5-20 and 10-20 litres in the
agro-pastoral and mixed farming livelihood zones respectively compared with a normal of 20
litres in both livelihood zones (Table 9). The water quality deteriorated as most of these water
points were recharged from run- off.
Table 9: Water for domestic use
Livelihoo
d Zone
Distance to water for
domestic use (Km)
Cost of water (Ksh
per 20L)
Waiting time at water
source (minutes)
Average household
consumption
(litre/person/day)
Current Normal Current Normal Current Normal Current Normal
Pastoral 20-30 5-10 0-30 0-3 360 60 2-10 20
Agro-
pastoral
10-20 5-10 0-30 0-3 120 30 5-20 20
Mixed-
farming
1-2 <1 0-10 0-3 30 5 10-20 20
3.2.5 Food consumption
Approximately 55, 32 and 13 percent of the households had acceptable, borderline and poor food
consumption respectively (Figure 6). There was a reduction in the proportion of households with
acceptable food consumption from 63 percent during the last assessment and an increase in that
with borderline consumption from 19 percent.

12
Figure 6: Food Consumption Score
Figure 7: Coping Strategy Index, Kajiado County
Figure 8: Proportion of children at risk of malnutrition (MUAC)
3.2.6 Coping strategy
The coping strategy index was 7.9 and 3.4 in pastoral and agro-pastoral livelihood zones
respectively in June 2017 (Figure 7). Common consumption- related coping strategies employed
by households included relying on less preferred and expensive food and skipping of meals.
3.3 Utilization
Household food utilization is a function of morbidity prevalence of under-fives and the general
population, levels of completion of immunization and vitamin A coverage, nutritional status
among households and level of sanitation and hygiene practices among households.
3.3.1 Nutritional status
The proportion of children under five years
with a mid-upper arm circumference
(MUAC) of <135 mm increased and was
83 percent above the LTA in June 2017.
The proportion and had doubled compared
to the same period in 2016 (Figure 8). The
worsening nutritional situation was
attributed to decreased household milk
consumption among children as livestock
moved to dry-season grazing grounds
3.3.2 Morbidity prevalence
The morbidity prevalence among children
under five years of age included; upper
respiratory tract infections (URTIs),
diarrhea, and malaria (Figure 9). Health
services have been affected by the on-going health workers’ strike. No human disease outbreak
was reported during the reporting season. Crude mortality rate (CDR) was 0.36/10,000/day and
under-fives mortality rate (U5DR) was 0.48/10,000/day which was below the alert cut off point.

13
0
100
200
300
400
500
600
0
1000
2000
3000
4000
5000
6000
Jan Feb Mar Apr May Jun July Aug Sep Oct Nov Dec
No
.of
case
s (M
alar
ia)
No
. o
f C
ase
s (D
iarr
ho
ea)
Malaria 2017 Malaria 2016 Diarrhoea 2017 Diarrhoea 2016
Figure 9: Morbidity trends in Kajiado County
3.3.3 Sanitation and hygiene The average latrine coverage in the county was 61 percent as a result of increased health
promotion through community units. Water sources may be contaminated through surface run-
off washing away agro-chemicals, human waste and refuse.
3.4 Trends of key food security indicators
Table 10 below shows the trend in food security indicators.
Table 10: Food security trends in Kajiado County
Indicator Short rains assessment,
February 2017
Long rains assessment,
July 2017
Maize stocks held by
households % LTA (mixed
and agro-pastoral)
73.2 37
Livestock body condition Fair-poor Fair-poor
Water consumption (litres
per person per day)
Pastoral :
Agro-pastoral:
Mixed farming
2-10
5-20
10-30
2-10
5-20
10-20
Price of maize (per kg) 48 65
Distance to grazing (km) Migrated 10-30
Terms of trade (pastoral
zone)
84 45
Coping strategy index 21
Food consumption score
Poor:
Borderline:
Acceptable:
14
32
54
13
32
56
Figure 9: Morbidity trends in Kajiado County

14
3.5 Education
Enrolment in schools Table 11: Enrolment in Kajiado County
Enrolment Term I , 2017
No. Boys No. Girls Total
ECD 21,264 17,830 39,094
Primary 62,731 59,247 121,978
Secondary 12,805 9,546 22,351
School enrolment and transition were within normal ranges (Table 11). No schools were closed
down due to water or food shortage. However, the school attendance rates declined as some
pupils accompanied their parents during livestock migration in some areas in the pastoral
livelihood zone.

15
4. FOOD SECURITY PROGNOSIS
4.1 Assumptions
Prognosis assumptions are based on the following:
o The performance of the short rains will be normal.
o Resource-based conflicts are likely to arise along wildlife corridor and grazing areas near the
game parks.
o Market prices are likely to increase.
o Agricultural farm inputs are likely to be unavailable in required quantities.
o Animal feed supply will be normal.
4.2 Outlook for August to October 2017
The maize harvest is poor and maize stocks at household level are expected to decline further,
with households relying more on markets for food access. Pasture and browse are expected to
deteriorate due to water stress and pressure from grazing by livestock. The livestock body
condition is expected to decline in all livelihood zones. The nutrition status of children under five
is expected to decline due to lack of milk in the pastoral and agro-pastoral livelihood zones. Food
consumption patterns are expected to decline in the pastoral areas where milk availability is
expected to decline further and hence decreased household consumption. Frequency of meal
consumption is expected to decline in all livelihood zones. However, mortality rates for both
children under five and the general population are expected to remain below the alert cut off
points.
4.3 Outlook for November 2017 to January 2017
With the projected normal performance of the short rains, modest rejuvenation of pasture and
browse is expected across all livelihood zones and thus the body condition of livestock is
expected to improve. Goat prices will increase slightly until end of December as supply in the
market declines. Therefore, the terms of trade are most likely to remain favorable to the livestock
keepers.
5. CONCLUSION AND INTERVENTIONS
5.1 Conclusion
The county is classified in Stressed (IPC Phase 2). The key factors that need close monitoring in
the next six months, especially in the pastoral and agro-pastoral areas, are staple food stocks,
pasture and browse situation, livestock body condition, human and livestock diseases, livestock
and food prices. Others include under-five nutritional status, distances to water sources,
availability and access to forage and water and resource-based conflicts especially on human
wildlife conflicts.
5.1.1 Phase classification
The county is in “stressed” food security phase classification (IPC Phase 2) attributed to poor
rains leading to fair to poor pasture and browse conditions, water scarcity and out-migration of
livestock.

16
5.1.2 Sub-county ranking in Kajiado County Table 12: Ranking of sub-counties in order of food insecurity severity
Sub County Food Security
(1–5)
Justification
Kajiado West
1 Poor rains distribution, depleted pastures, High levels of malnutrition, high
poverty levels, Low purchasing power
Kajiado South 2 Low levels of diversification, deterioration of pasture and browse
Kajiado Central 3 Low levels of diversification, deterioration of pasture
Kajiado East 4 Low levels of diversification
Kajiado North
5 Better coping strategies, informal/formal employment, vast land, two
season, depend on markets
5.2 Ongoing Interventions
5.2.1 Food interventions County Intervention Location Number of
Beneficiaries
Implementers Impact in
terms of
food
security
Cost Time
frame
LIVESTOCK
Kajiado All Sub
Counties
Provision
of
extension
services
8000 pastoralists County Dept of
Livestock
Improved
livestock
productivi
ty
500,000 Continuo
us
Kajiado Central
, Eas, centralt
Constructio
n of hay
store,
livestock
market,
waterpan
17250
pastoralists
County Dept of
Livestock,
RPLRP
Improved
livestock
productivi
ty
32M ESIA,
feasibilit
y study
done.
2017/18
FY
Kajiado East,
West, Central
and South
Vaccinatio
n against
CBPP
150,000 cattle CG, DVS Improve
livestock
productivi
ty
8M Ongoing
AGRICULTURE
Immediate
County wide Promotion
of efficient
water
utilization
through
capacity
building
2,000 MOA, SACDEP Increase
yields
hence
improve
food
security
5M Through
out
County wide
Surveillanc
e and
control of
Migratory
pests and
Diseases
2,000 National Gvt Reduce
crop loses
30m August-
Decembe
r 2017
17
County Intervention Location Number of
Beneficiaries
Implementers Impact in
terms of
food
security
Cost Time
frame
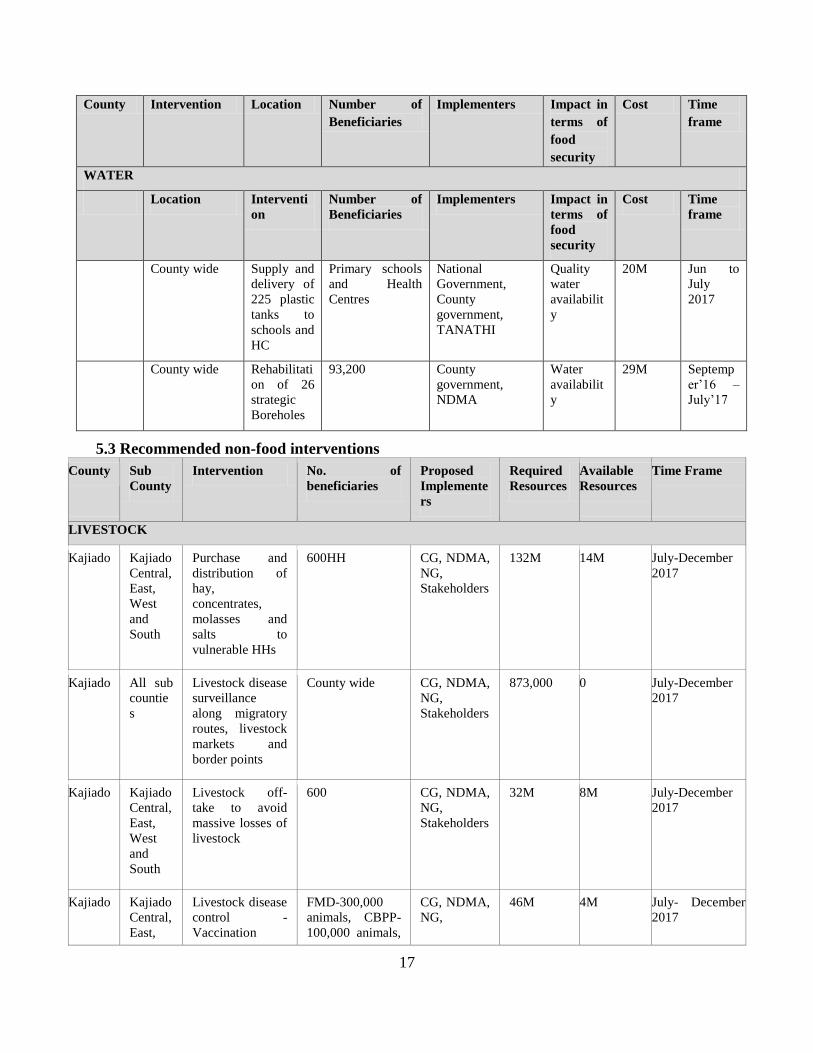
WATER
Location Interventi
on
Number of
Beneficiaries
Implementers Impact in
terms of
food
security
Cost Time
frame
County wide Supply and
delivery of
225 plastic
tanks to
schools and
HC
Primary schools
and Health
Centres
National
Government,
County
government,
TANATHI
Quality
water
availabilit
y
20M Jun to
July
2017
County wide Rehabilitati
on of 26
strategic
Boreholes
93,200 County
government,
NDMA
Water
availabilit
y
29M Septemp
er’16 –
July’17
5.3 Recommended non-food interventions
County Sub
County
Intervention No. of
beneficiaries
Proposed
Implemente
rs
Required
Resources
Available
Resources
Time Frame
LIVESTOCK
Kajiado Kajiado
Central,
East,
West
and
South
Purchase and
distribution of
hay,
concentrates,
molasses and
salts to
vulnerable HHs
600HH CG, NDMA,
NG,
Stakeholders
132M 14M July-December
2017
Kajiado All sub
countie
s
Livestock disease
surveillance
along migratory
routes, livestock
markets and
border points
County wide CG, NDMA,
NG,
Stakeholders
873,000 0 July-December
2017
Kajiado Kajiado
Central,
East,
West
and
South
Livestock off-
take to avoid
massive losses of
livestock
600 CG, NDMA,
NG,
Stakeholders
32M 8M July-December
2017
Kajiado Kajiado
Central,
East,
Livestock disease
control -
Vaccination
FMD-300,000
animals, CBPP-
100,000 animals,
CG, NDMA,
NG,
46M 4M July- December
2017

18
County Sub
County
Intervention No. of
beneficiaries
Proposed
Implemente
rs
Required
Resources
Available
Resources
Time Frame
West
and
South
(FMD,
CBPP,CCPP and
Trypanosimiasis)
CCPP-400,000
animals
Stakeholders
County
wide
Livestock disease
control –
Prophylactic
treatment of
Vector borne
diseases
All livestock CG, NDMA,
NG,
Stakeholders
4.5M 0 July- December
2017
Kajiado Kajiado
Central,
East,
West
and
South
Rangeland
reseeding
10860 HH CG, NDMA,
NG,
Stakeholders
10M 0 2 years
AGRICULTURE
All Provision of early
maturing drought
tolerant seed crops
4,000 County and
National Gvt
14.8M 0 August-
September 2017
County
wide
De silting of water
pans and dams
2,000 County Gvt 30 million 0 August to
October 2017
WATER
Locatio
n
Intervention Number of
Beneficiaries
Implemente
rs
Required
resources
Available
resources
Time frame
County
wide
Fuel subsidy - 48
Strategic
boreholes, De-
silting of 45
pans and dams,
Rehabilitation of
30 mal-
functioning
boreholes
83,000 All partners 178 M Nil July to
November 2017
County
wide
Rehabilitation of
60 hand pumps
24,000 All partners 10M Nil July to December
2017
HEALTH AND NUTRITION
County Sub
county
Intervention
Location Beneficiaries Implemen
ters
Estimated
Cost (Ksh)
Time Frame
Males Females

19
County Sub
County
Intervention No. of
beneficiaries
Proposed
Implemente
rs
Required
Resources
Available
Resources
Time Frame
All sub-
countie
s
Vitamin A
Supplementation
Health
facility
18834 17807 CDH 200,000 Twice every year
All sub-
countie
s
Zinc
Supplementation
Health
facility
12077 11604 CDH 24,000 Continuous
All sub-
countie
s
Management of
Acute
Malnutrition
(IMAM)
Health
facility/
Outreach
sites
1457 5081 CDH 40,000,000 Continuous
All sub-
countie
s
IYCN
Interventions
(EBF and Timely
Intro of
complementary
Foods)
Health
facility
17640 16850 CDH 300,000 Continuous
All sub-
countie
s
Iron Folate
Supplementation
among Pregnant
Women
Health
facility
0 29759 CDH 300,000 Continuous
All sub-
countie
s
Deworming Health
facility
20541 20370 CDH 330,320 Continuous
OTHER PUBLIC HEALTH INTERVENTIONS
All sub-
countie
s
Distribution of
Aqua Tabs
Househ
old
level
20541 20370 CDH 500,000 continuous
All sub-
countie
s
Purchase of aqua
tabs
Househ
old
level
200,000 200,000 CDH and
Partners
500,000 June to
September 2017
IMMEDIATE RECOMMENDED INTERVENTIONS
Sub
County
/Ward
Intervention Location No. of
beneficiarie
s
Proposed
Implementers
Required
Resources
Available
Resources
Time Frame
All sub-
counties
Mass
screening and
referral
Flagged
areas
1500 CDH,
PARTNERS
500,000 July 2017
All sub-
counties
Conduct
integrated
health and
nutrition
outreaches
Hard to
reach
areas
11,499 CDH,
PARNERS
3,500,000 July – Nov 2017

20
County Sub
County
Intervention No. of
beneficiaries
Proposed
Implemente
rs
Required
Resources
Available
Resources
Time Frame
All sub-
counties
Sensitization
of Community
Health
Volunteers
(CHVs) on
IMAM
Facilities 200 CDH, partners 1,200,000 August 2017
Medium and Long term Recommended Interventions
Sub
Count
y
/War
d
Interventio
n
Location No. of
beneficiaries
Proposed
Implementers
Required
Resources
Available
Resources
Time Frame
All
sub-
counti
es
Nutrition
Advocacy
Health
facilities,
schools,
work
places
68,500 CDH, partners 1,000,000 August
All
sub-
counti
es
CLTS Villages 15,312 CDH, partners Technical
support
6M
0 September
All
sub-
counti
es
Installation
of hand
washing
facilities
HH level 200,000 Community Catered for 0
All
sub-
counti
es
Train
artisans on
latrine
construction
Ward
level
250,000 WASH
PARTNERS
300,000 0 June to
December 2017
All
sub-
counti
es
Training
CHVS on
WASH
In the
units
200,000 CDH 300,000 0 June to
December 2017
5.3.1 Food interventions County Intervention Location Number of
Beneficiaries
Implementers Impact in
terms of
food
security
Cost Time
frame
Education

21
School Lunch
programme
All primary
schools
121,987 pupils GOK, NGO,
County
Government
62
Million
3 months