kelly reagan administrator division of fleet management administrator division of fleet management...
TRANSCRIPT

Kelly ReaganKelly Reagan
Administrator
Division of Fleet Management
Administrator
Division of Fleet Management
City of ColumbusCity of Columbus
The Keys to Developing a Replacement Standard
Kelly Reagan, Fleet Administrator
City of ColumbusDivision of Fleet Management
Columbus Fleet Management- We utilize all the latest technology
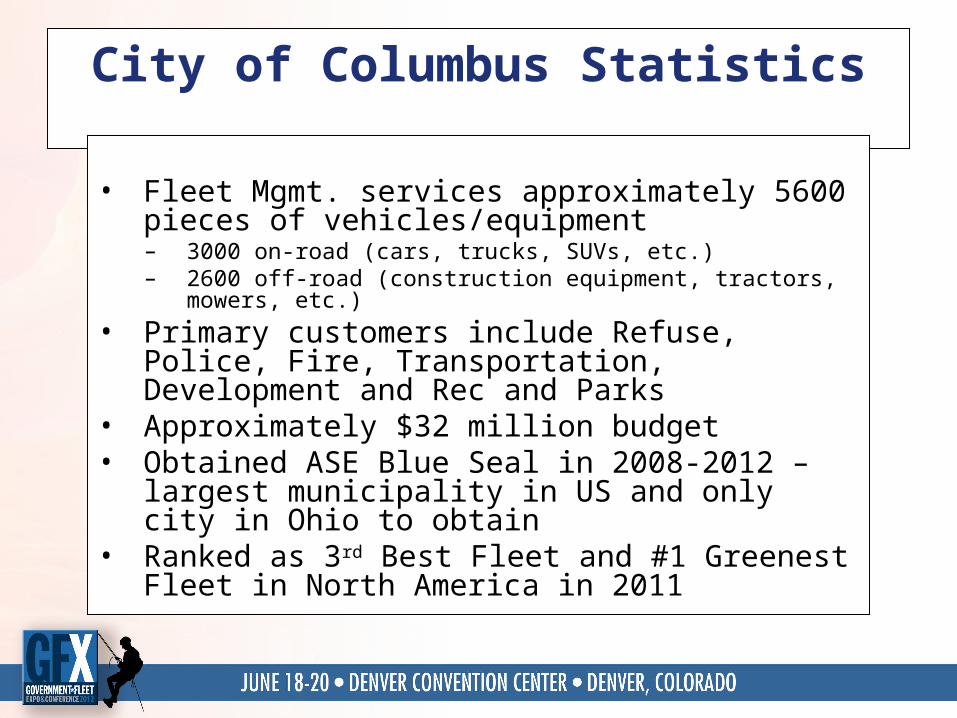
City of Columbus Statistics
• Fleet Mgmt. services approximately 5600 pieces of vehicles/equipment– 3000 on-road (cars, trucks, SUVs, etc.)– 2600 off-road (construction equipment, tractors, mowers, etc.)
• Primary customers include Refuse, Police, Fire, Transportation, Development and Rec and Parks
• Approximately $32 million budget• Obtained ASE Blue Seal in 2008-2012 – largest
municipality in US and only city in Ohio to obtain• Ranked as 3rd Best Fleet and #1 Greenest Fleet in
North America in 2011
How was Columbus Replacement Standard Developed?
• Industry standards• Consultation with City divisions and management (i.e. Finance
Department)• Internal Data• Realistic goals
Lesson: Involve management in developing replacement standard- don’t bite the hand that feeds you
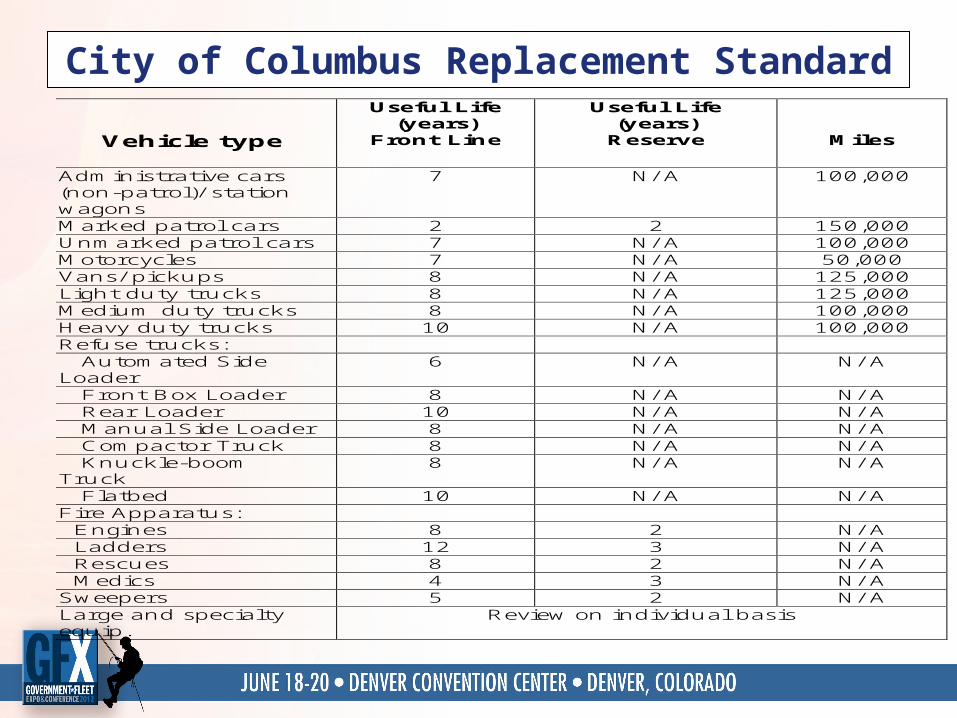
City of Columbus Replacement Standard
Vehicle type
Useful Life (years)
Front Line
Useful Life (years)
Reserve
Miles
Administrative cars (non-patrol)/ station wagons
7 N/ A 100,000
Marked patrol cars 2 2 150,000 Unmarked patrol cars 7 N/ A 100,000 Motorcycles 7 N/ A 50,000 Vans/ pickups 8 N/ A 125,000 Light duty trucks 8 N/ A 125,000 Medium duty trucks 8 N/ A 100,000 Heavy duty trucks 10 N/ A 100,000 Refuse trucks: Automated Side Loader
6 N/ A N/ A
Front Box Loader 8 N/ A N/ A Rear Loader 10 N/ A N/ A Manual Side Loader 8 N/ A N/ A Compactor Truck 8 N/ A N/ A Knuckle-boom Truck
8 N/ A N/ A
Flatbed 10 N/ A N/ A Fire Apparatus: Engines 8 2 N/ A Ladders 12 3 N/ A Rescues 8 2 N/ A Medics 4 3 N/ A Sweepers 5 2 N/ A Large and specialty equip.
Review on individual basis
What Goes First
• Three criteria used to determine order of replacement:– Age- over 10 years or useful life– Maintenance history
• Do maintenance costs exceed acquisition cost?– 100,000+ miles
• Underutilized report generated every 2 years– Discussion with divisions– Justification reporting– Typically leads to 50-100 units being decommissioned or
reassigned
• GPS data will be used in the future to drive replacement needs
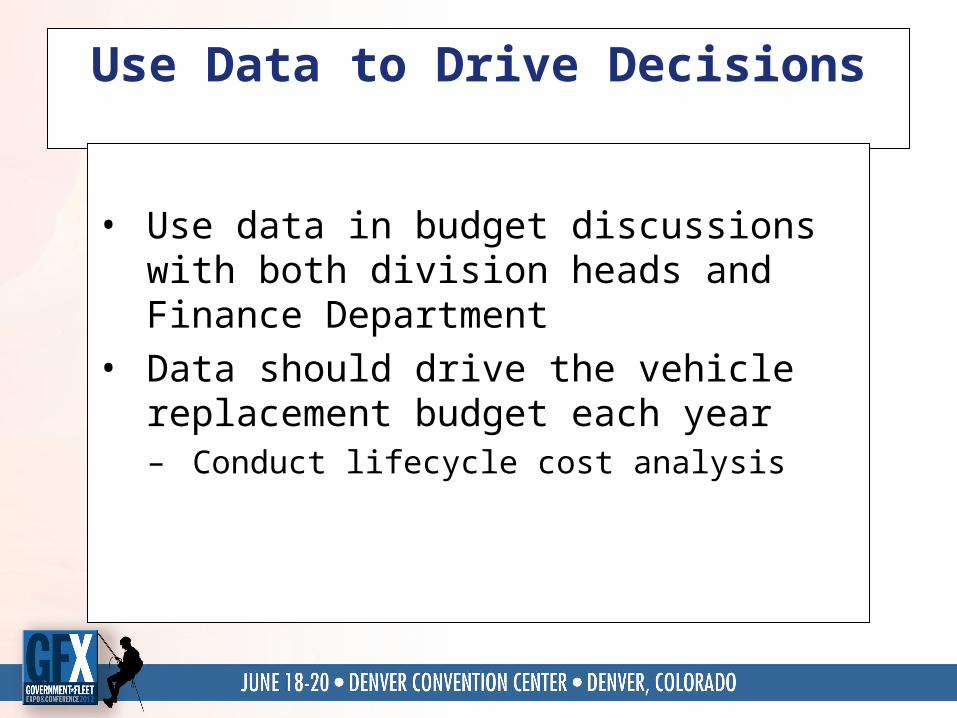
Use Data to Drive Decisions
• Use data in budget discussions with both division heads and Finance Department
• Data should drive the vehicle replacement budget each year– Conduct lifecycle cost analysis
Lesson: Use resources to take control
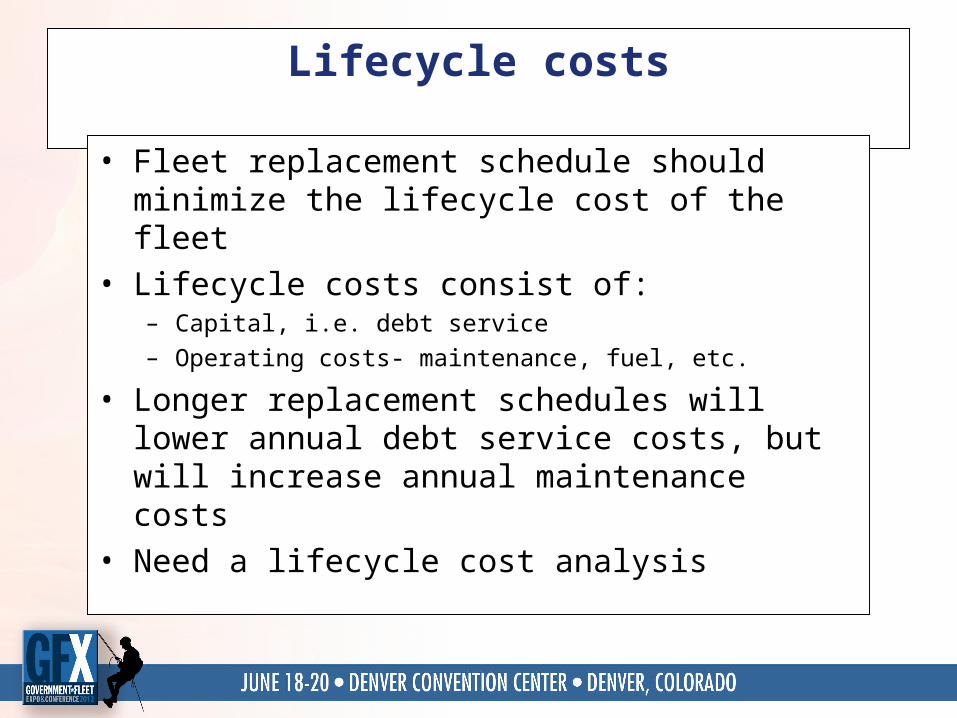
Lifecycle costs
• Fleet replacement schedule should minimize the lifecycle cost of the fleet
• Lifecycle costs consist of:– Capital, i.e. debt service
– Operating costs- maintenance, fuel, etc.
• Longer replacement schedules will lower annual debt service costs, but will increase annual maintenance costs
• Need a lifecycle cost analysis

Lifecycle Cost Analysis
• Lifecycle cost analysis identifies the minimum of total costs by analyzing:– the relationship between vehicle age/usage
– capital costs
– operating costs
• Minimum lifecycle cost is found at the lowest point on the total cost curve
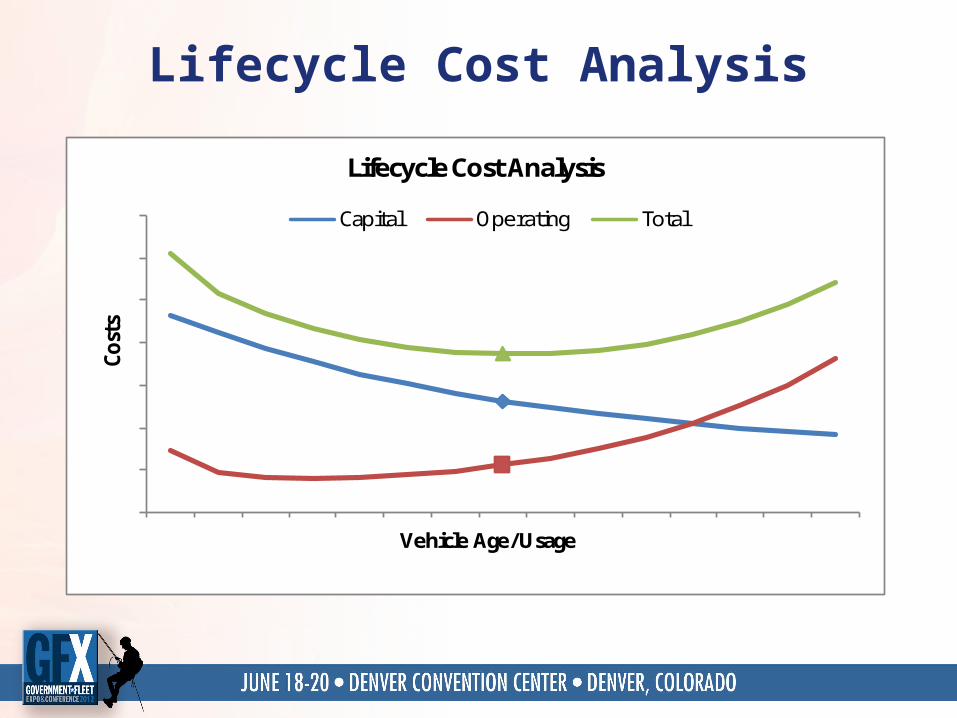
Lifecycle Cost AnalysisCo
sts
Vehicle Age/Usage
Lifecycle Cost Analysis
Capital Operating Total
Lifecycle Cost Analysis: Fire Engines
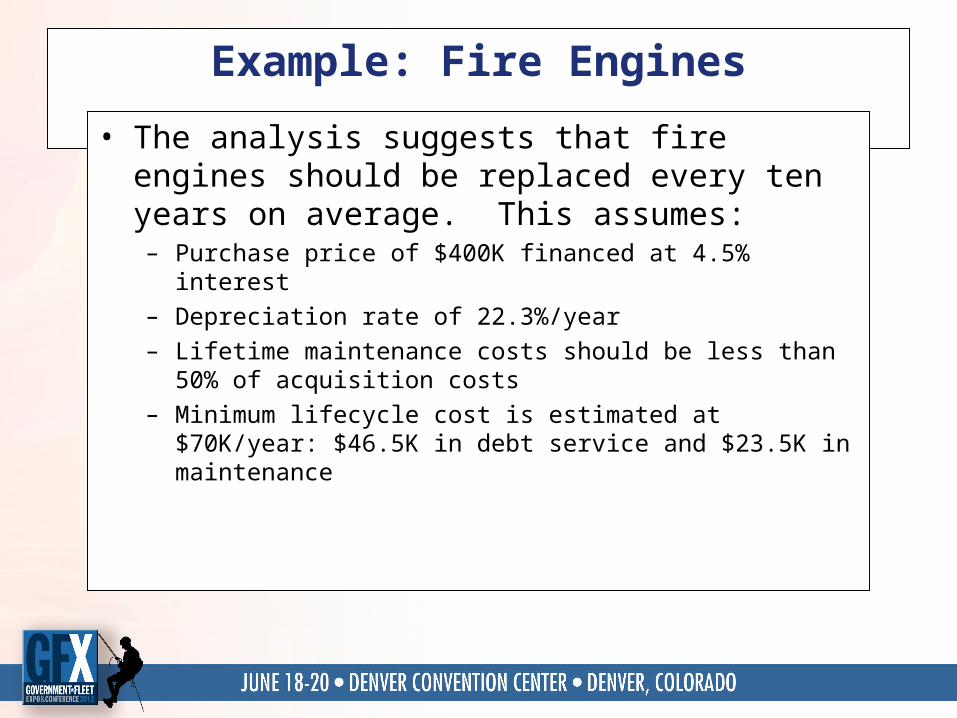
Example: Fire Engines
• The analysis suggests that fire engines should be replaced every ten years on average. This assumes:– Purchase price of $400K financed at 4.5% interest
– Depreciation rate of 22.3%/year
– Lifetime maintenance costs should be less than 50% of acquisition costs
– Minimum lifecycle cost is estimated at $70K/year: $46.5K in debt service and $23.5K in maintenance

Columbus progress through the years
Total Fire vehicles at or below replacement age
79%
57%
0%
10%
20%
30%
40%
50%
60%
70%
80%
90%
2008 2011
Total vehicles at or below recommended replacement age
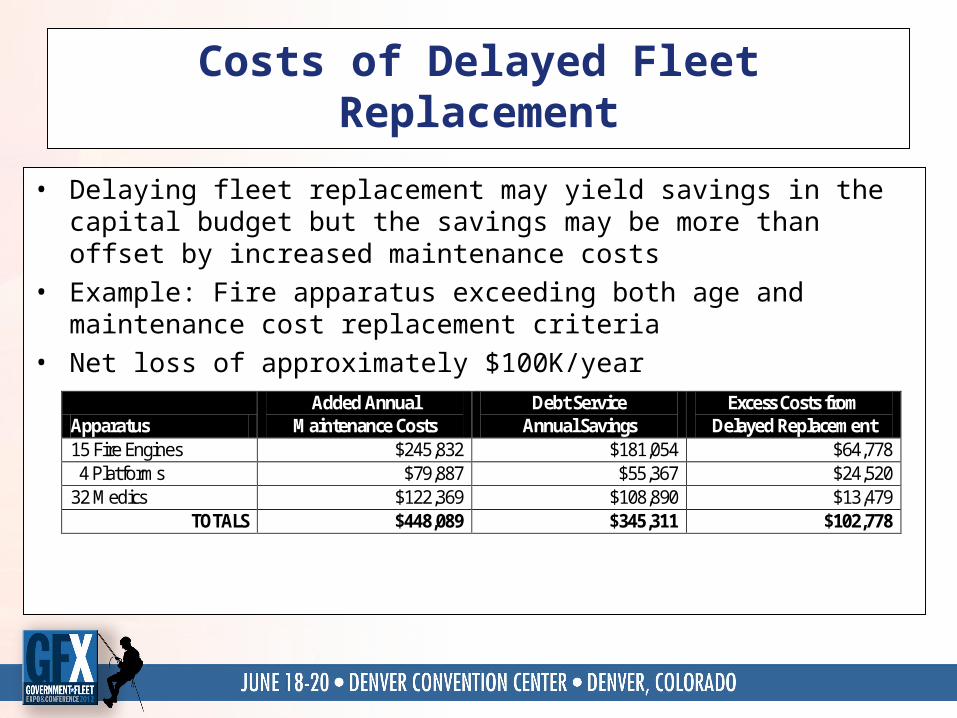
Costs of Delayed Fleet Replacement
• Delaying fleet replacement may yield savings in the capital budget but the savings may be more than offset by increased maintenance costs
• Example: Fire apparatus exceeding both age and maintenance cost replacement criteria
• Net loss of approximately $100K/year
Apparatus Added Annual
Maintenance Costs Debt Service
Annual Savings Excess Costs from
Delayed Replacement 15 Fire Engines $245,832 $181,054 $64,778 4 Platforms $79,887 $55,367 $24,520 32 Medics $122,369 $108,890 $13,479
TOTALS $448,089 $345,311 $102,778

The Cost of Lengthened Replacement Cycles
• According to Fleet Management’s 2012 annual survey regarding vehicle operating costs, the consequence of lengthened replacement cycles is an increase in unexpected and sometimes costly repairs
• Last year, the cost of unscheduled vehicle repairs rose 10.2%• Nearly double the rate of increase reported for the 2012 survey
Repair Costs
Veh
icle
Ag
e

Lesson: Short term rewards are not worth the long term costs
Summary
• Include both customers and management in development of replacement standard– Involve Finance Department
• Use data to drive decisions– Use your resources to take control of your replacement standard
• Conduct a lifecycle analysis and determine costs• Do not delay fleet replacement- be able to
demonstrate costs of delay– Short term savings are not worth long term costs