kempen european property seminar 30 may 2012 in amsterdam · 5/30/2012 · kempen european...
TRANSCRIPT

Kempen European Property Seminar
30 May 2012 in Amsterdam

Profile
Top 3 listed Dutch mixed real estate fund
Dutch REIT / Listed on Amsterdam Euronext (Midkap AMx)
Portfolio: €2.29bn
TRI: €203m
Outstanding shares: 63,381,376
Mixed fund
2 home markets (NL, B)
Exit strategy for Switzerland
High yield fund (8,9% GIY)
Focus on retail and offices (50/50 on average)
NL: retail and offices
B: offices and warehouses
Focus on small and medium sized companies
Financial highlights
Quarterly dividend, 30-50% Stock
LTV target 50%, Fixed interest > 80%
80% free float, main shareholder 20%
Dutch Office
portfolio:
39%

Financial ratios Consolidated
x €1,000 Q1 2012 Q4 2011 Q1 2011
Investments 2,294,260 2,321,813 1,357,829
Shareholders’ equity 895,404 909,620 600,105
Shareholders’ equity NSI 763,647 781,218 600,105
Debts to credit institutions
(excluding derivatives)
1,315,693 1,329,166 737,412
Q1 2012 Q4 2011 Q1 2011
Loan to value (%) 57.3 57.2 54.4
Average interest rate (%) 4.3 4.2 4.3
Average maturity loans (years) 2.3 2.1 2.1
Fixed interest loans (%) 91.6 91.3 91.3
Interest coverage ratio 2.5 2.4 2.7
NAV 12.86 12.96 13.86
EPRA NAV 13.83 14.02 14.27

Steady Result & Loan To Value
1.36 1.36 1.36 1.34 1.40 1.34 1.26 1.19
0.26
45,327 46,635 48,510 47,810 50,037 51,627 52,398
56,030
16,181
2004 2005 2006 2007 2008 2009 2010 2011 Q1 2012
Dividend Direct result
Direct result and Dividend
52,2 50 49,7
46,9
57,2 54,9 54,8
57,2 57,3
40
45
50
55
60
2004 2005 2006 2007 2008 2009 2010 2011 Q1 2012
LTV

Business Highlights
Merger with VastNed
Offices/Industrials
• €1.0 bn portfolio
• €68m (35%) book profit on
acquisition
• Strong focus on Randstad
• Integration completed
Record of renewals and new leases
in 2011
10,000 m² letting for the Red
Elephant The Hague
Introduction in the Euronext
Amsterdam Midcap Index (AMx)
0
20
40
60
80
100
120
Amste
rdam
regio
n
Rotterd
am re
gion
Utrech
t region
The Hague re
gion
Eindhoven re
gion
Breda
Tilburg
m² Rationale Progress Capitalizing upon NSI’s
strengths:
• NSI’s tenant focus
• Skills & funds to innovate and
invest
• In house letting teams,
development & property
management
Occupancy top priority:
• Proactive approach expiration
calendar VNOI accelerated
• VNOI data integrated into
CRM system
• Letting ‘De Rode Olifant’
shows approach is paying off
• 15% lower refurbishment
costs Rode Olifant
Increased opportunities of
scale
• Reducing operational costs
• Reducing overhead
• Leveraging operational
synergies
• Increased opportunities tenant
retention
Synergies gradually kicking
in:
• Cost synergies to amount to
approx. € 2.0 FY ‘12
• Full benefits from operational
synergies expected to
materialize as of Q4 2012
• First successes
Increased access to financial
markets
• Increased visibility for both
equity and debt capital markets
• NSI is included in MidCap
• €25 million equity issue
• 60% stock dividend 2011 final
dividend
• Syndicated loan extended
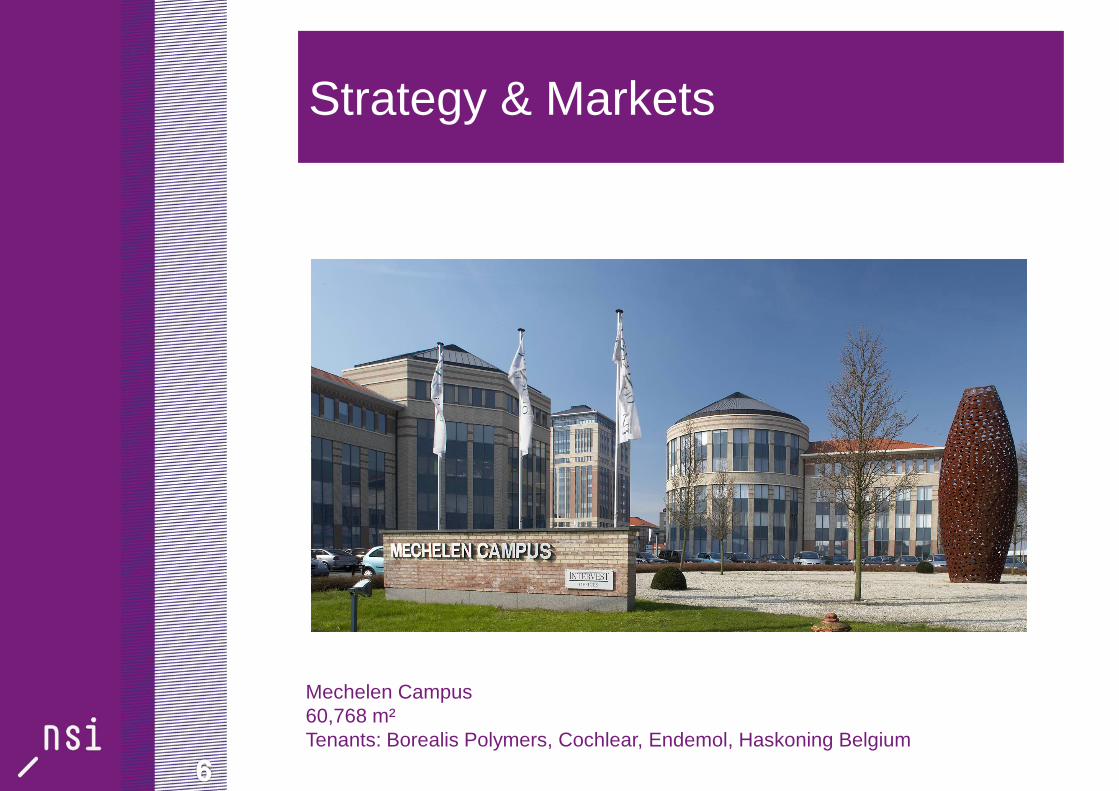
Strategy & Markets
Mechelen Campus
60,768 m²
Tenants: Borealis Polymers, Cochlear, Endemol, Haskoning Belgium

Portfolio & Market Focus
Switzerland The Netherlands
* 232 properties; €1.6 billion
* Retail and Offices
* Retail: day to day shopping
10,000 m²
Yield: 7.4% (GIY)
*Offices
Focus on Randstad
Multi tenant
Approx. 5,000 m²
Yield: 9.7% (GIY)
* 4 properties: €119m
* GIY: 6.7%
* Exit strategy in progress
Belgium
* 40 properties; €590m
* Offices and Warehouses (GIY 8.9%)
* Offices: multi tenant
* Warehouse on logistic
axes (North/South and East /West

Direct Investment Result Consolidated
Q1 2012
x €1,000
per avg
share
x €1
∆ in €
2012 vs.
2011
Q1 2011
x €1,000
per avg
share
x €1
Gross rental income 41.499 0.69 15,628 25.871 0.60
Service costs not recharged - 1.482 - 0.03 - 1,075 - 407 - 0.01
Operating costs - 4.938 - 0.08 - 1,389 - 3.549 - 0.08
Net rental income 35.079 0.58 13,164 21.915 0.51
Financing income 28 - 15 13 -
Financing expenses - 14.007 - 0.23 - 5,923 - 8.084 - 0.19
Administrative costs - 1.816 - 0.03 - 817 - 999 - 0.02
Direct investment result before
tax
19.284 0.32 6,439 12.845 0.30
Corporate income tax - 80 - - 61 - 19 -
Direct investment result after
tax
19.204 0.32 6,378 12.826 0.30
Direct result attritutable to
minority interests
- 3.023 - 0.05 - 3,023 - -
Direct investment result 16.181 0.27 3,355 12.826 0.30
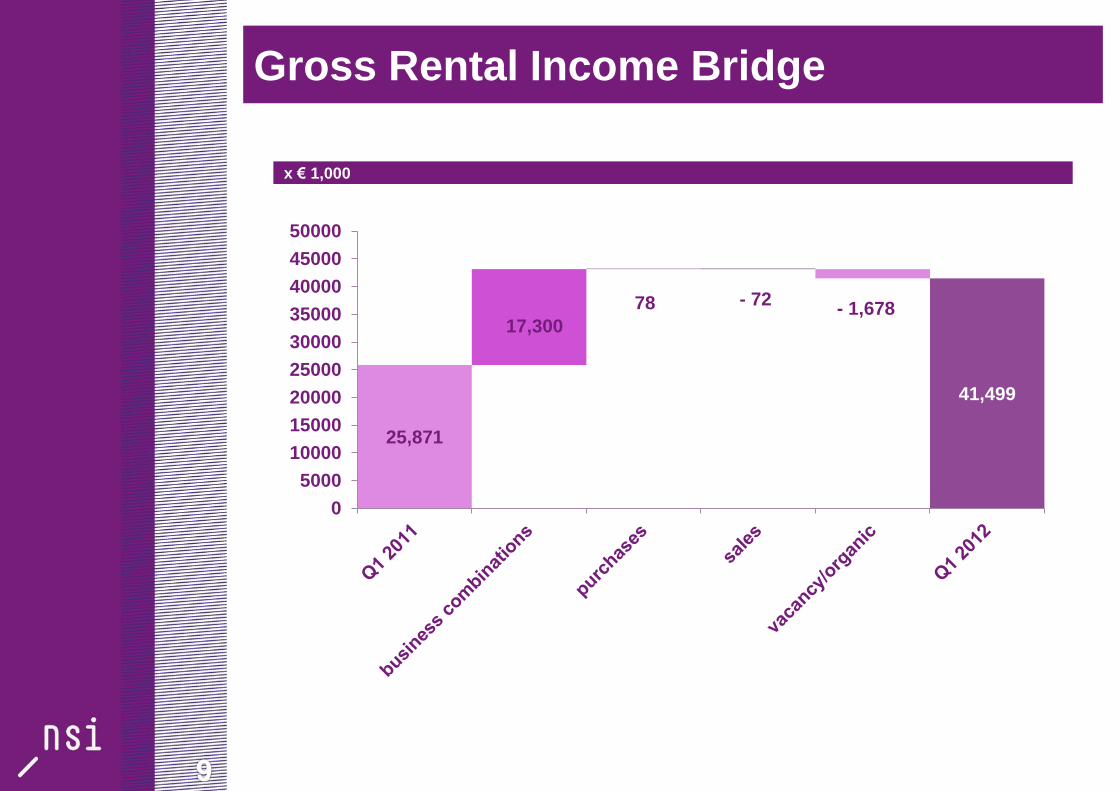
Gross Rental Income Bridge
25,871
17,300
78 - 72 - 1,678
41,499
0
5000
10000
15000
20000
25000
30000
35000
40000
45000
50000
x € 1,000

Portfolio Rent Development
Average effective contractual rent/m² (NL)
110,00
140,00
170,00
200,00
2002 2003 2004 2005 2006 2007 2008 2009 2010 2011 Q12012
Offices
Retail
Offices quarterly

Vacancy In Portfolio (%)
3,0 3,1 2,9 3,4
3,5
4,7
4,6 4,9 4,3 4,8 4,7 5,1
4,9
11,9
12,8 13,1 13,0
13,7
14,7 14,1
16,0
13,7
14,8
16,1
21,1
24,0
6,6 6,5 6,0
10,5 10,1
10,3
14,8 14,5
13,0
15,3
13,6
10,6
12,0
7,9 8,7 8,7 9,1 9,5
10,4 10,2 11,2
9,9 10,5
11,0
15,9
17,8
0,0
5,0
10,0
15,0
20,0
25,0
30,0
Q12009
Q22009
Q32009
Q42009
Q12010
Q22010
Q32010
Q42010
Q12011
Q22011
Q32011
Q42011
Q12012
Retail
Offices
Industrials
Total
• Healthy occupancy Retail at friction levels
• In Offices focus is on actively managing expiration calendar
• Redevelopment of properties to new concepts impact vacancy until completion

Property values
• Full quarterly revaluation, 25%
external
• Since peak 2007 approx. 25% re-
valuation in offices
• Valuation offices and industrial
Belgium increased
• Valuation per m2 below replacement
costs per m2 indicates general low
level of valuations
• Increased deal activity in the market;
investors returning to the market

0
2.000
4.000
6.000
8.000
10.000
12.000
14.000
16.000
2012 2013 2014 2015 2016 2017e.v.
retail
offices
industrials
14%
32%
16%
18% 17%
12%
14%
23%
4%
36%
4%
22%
Expiration of Leases
31 March 2012 (NL)
rental income x €1,000
4%
21%
15%
13%
21% 14%

Lease Strategy – Client Focus
Multi tenant over single tenant:
– Spread the risk
– Accelerate occupancy rate improvement
– Aiming at smaller and medium sized business
Improving of lettability by increasing quality and sustainability
Client focus:
- Retail specialist and local managers
- CRM and vacancy management (offices)
- In-house technical management
Flexible leasing schemes at certain dedicated locations

Huur
Service Kosten
Parkeren
Traditioneel vastgoed
Huur
Service kosten
Operator inkomsten
meetingrooms
parkeren
memberships
Horeca / IT partner
inkomsten
HNKR concept
HNKR Business model
diensten

HNK
Amsterdam

HNK
Rotterdam
Vasteland Scheepvaartkwartier
Kop van Zuid

3.0 Antwoord
HNK
Rotterdam


HNKR Clubroom

Fixed Float Total Hedge
d
% Fixed Maturity Interest
%
# banks
NL 128.1 765.2 893.2 746.6 97.9% 1.7 4.4% 10
CHF 80.9 - 80.9 - 100.0% 1.4 3.3% 1
BE 74.3 211.3 285.7 120,0 68.0% 3.2 3.9% 5
Total 283.3 976.5 1,259.8 866.6 91.3% 2.1 4.2% 14
Loan book & Hedging per country
Hedge portfolio of swaps: No overhedged positions, no margin calls
Debt maturity in the Netherlands to be further extended
• NSI is financed by well
capitalized financial
partners
• NSI is committed to active
relationship management
with its core financiers
• Novelty of insurance
company in syndicate

Loan Duration
x € 1,000
Refinancing 2012 2/3rds covered
BE: €130 mln refinanced in 2012, first expiry (€ 10 mln) end of 2013
€225mln NSI syndicated loan extended to 2015; €50m syndicated to insurance company
VNOI syndicate (amounts are exposure):
• RCF A (€ 30.4 mln) and Term A (€ 121 mio) to expire 30/6/2013
• RCF B (€ 9.2 mln) to expire 20/11/2013
• Term B (€ 99 mln) and Ancillary Fac. € 25 mln) to expire 30/6/2014

Outlook 2012
Managing the balance sheet
• Disposal program smaller assets mainly offices NL
• Swiss properties
Fully using synergies
• Improving former VNOI portfolio (client focus occupancy)
• 2.0 – 2.5m cost synergies
Branding NSI’s office portfolio
• Alliances with operators
(Re)development of properties
• Shopping centre Keizerslanden, Deventer
• Extension of several smaller shopping centres
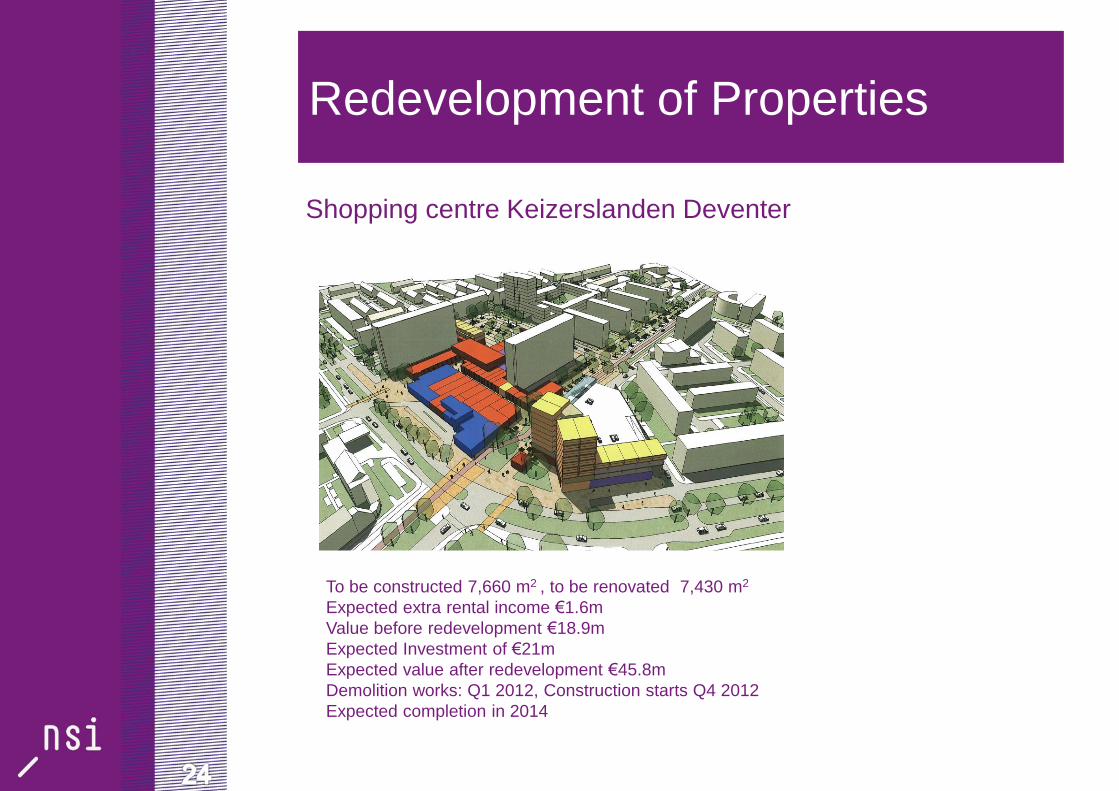
Redevelopment of Properties
Shopping centre Keizerslanden Deventer
To be constructed 7,660 m2 , to be renovated 7,430 m2
Expected extra rental income €1.6m
Value before redevelopment €18.9m
Expected Investment of €21m
Expected value after redevelopment €45.8m
Demolition works: Q1 2012, Construction starts Q4 2012
Expected completion in 2014

25
Impression

Financials
Archimedesweg Leiden
2,500 m²
Tenants: Proxy, Xendo

Balance Sheet Consolidated
x €1,000 31-03-2012 31-12-2011 31-03-2011
Total non-current assets 2,186,735 2,334,212 1,372,734
Total current assets 143,908 18,356 17,764
Total assets 2,330,643 2,352,598 1,390,498
Total shareholders equity 895,404 909,620 600,105
Interest bearing loans 999,822 1,122,648 592,758
Financial derivatives 67,192 62,297 19,239
Deferred tax liabilities 1,886 1,678 973
Redemption requirement long-term liabilities 226,439 137,189 115,313
Financial derivatives - 96 460
Debts to credit institutions 94,529 73,727 42,696
Other accounts payable and deferred income 45,371 256,325 177,423
Total shareholders’ equity and liabilities 2,330,643 2,352,568 1,390,498
* including minority share

Indirect Investment Result Consolidated
x €1,000 Q1 2012 Q4 2011 Q1 2011
Revaluation of investments - 26,581 - 18,879 - 5,097
Elimination of rental incentives - 293 - -
Result from other investments - 170 - 254
Net result on sales of investments - 127 -
Movements in market value of financial
derivatives
- 4,799 - 5,926 11,564
Exchange-rate differences - 523 - 14 275
Allocated management costs - 581 - 573 - 340
Merger costs - - 6,557 - 217
Result from bargain purchase - 68,161 -
Indirect investment result before tax - 32,777 36,509 5,931
Corporate income tax - 193 - 114 - 80
Indirect investment result after tax - 32,970 36,395 5,851
Indirect result attributable to minority
interests
- 332 2,034 -
Indirect investment result - 33,302 38,429 5,851

Portfolio Bridge
2,321,813
1,899 - 4,005
- 23,839
- 4,293
1,551
1,134
2,294,260
2.000.000
2.250.000
2.500.000
x € 1,000

Direct Investment Result Consolidated
x €1,000 Q1 2012 Q4 2011 Q1 2011
Gross rental income 41,499 42,575 25,871
Service costs not recharged - 1,482 - 1,469 - 407
Operating costs - 4,938 - 4,902 - 3,549
Net rental income 35,079 36,204 21,915
Financing income - 28 46 13
Financing costs - 14,007 - 14,822 - 8,084
Administrative costs - 1,816 - 1,819 - 999
Direct investment result before tax 19,284 19,609 12,845
Corporate income tax - 80 - 113 - 19
Direct investment result after tax 19,204 19,496 12,826
Direct result attributable to minority
interests
- 3,023 - 2.608 -
Direct investment result 16,181 16,88 12,826