kepner-tregoe methodology
DESCRIPTION
Kepner-Tregoe Methodology. Skorkovský Department of business economy. F eveloped by Charles H. Kepner and Benjamin B. Tregoe in the 1960s. Apollo 13 – Houston, Houston, do you read me ? We have a big problem….!. - PowerPoint PPT PresentationTRANSCRIPT
1
Kepner-Tregoe Methodology
SkorkovskýDepartment of business economy
Feveloped by Charles H. Kepner and Benjamin B. Tregoe in the 1960s.
2
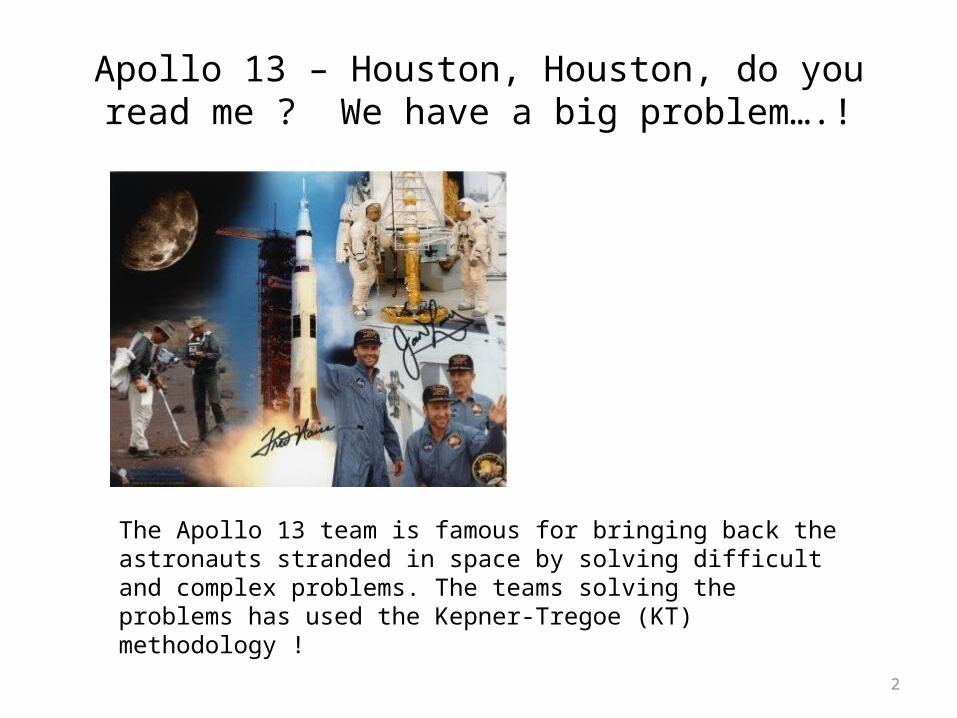
Apollo 13 – Houston, Houston, do you read me ? We have a big problem….!
The Apollo 13 team is famous for bringing back the astronauts stranded in space by solving difficult and complex problems. The teams solving the problems has used the Kepner-Tregoe (KT) methodology !
3
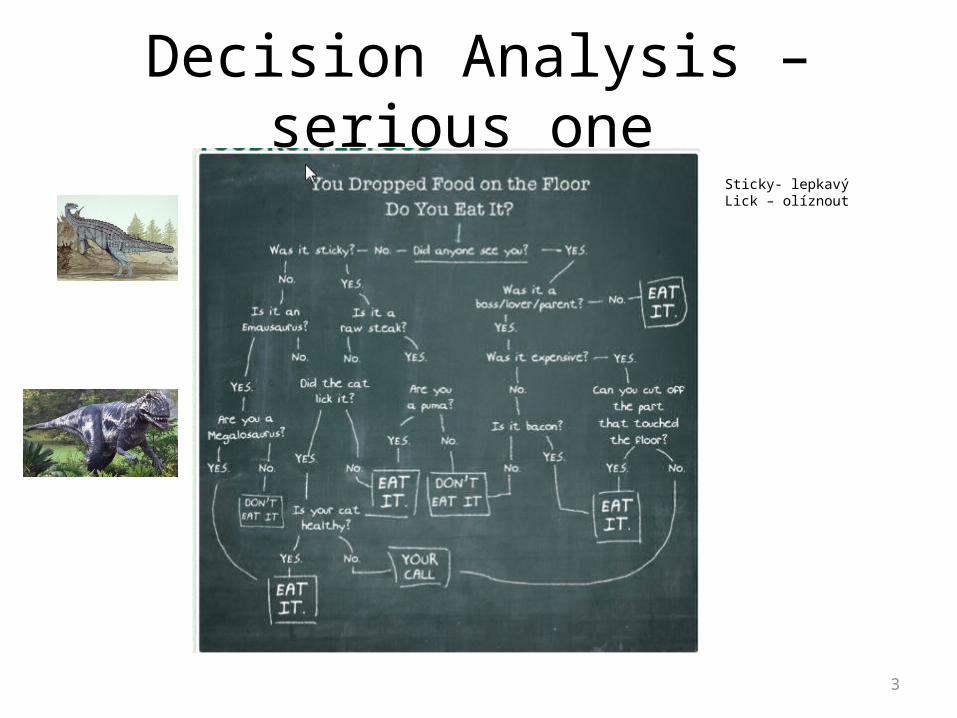
Decision Analysis –serious one Sticky- lepkavýLick – olíznout
4
What is it K-T methodology ?Kepner Tregoe is used for decision making .
It is a structured methodology for gathering information and prioritizing and evaluating it.
It is very detailed and complex method applicable in many areas, whichis much broader than just idea selection.
It is called also a root cause analysis and decision-making method.
It is a step-by-step approach for systematically solving problems, making decisions, and analyzing potential risks.
5
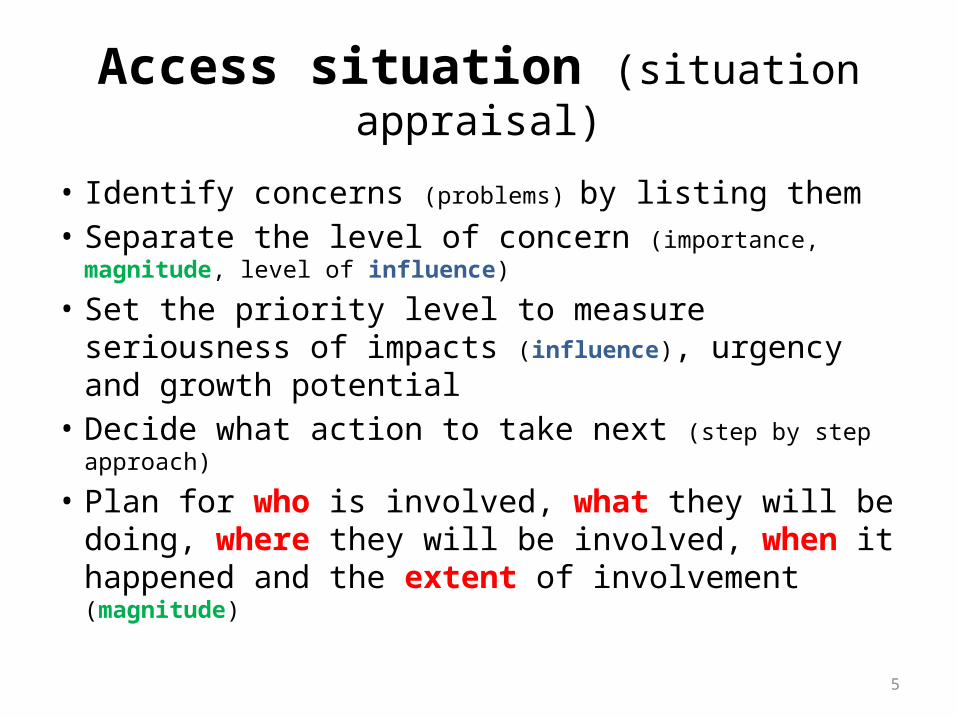
Access situation (situation appraisal)
• Identify concerns (problems) by listing them • Separate the level of concern (importance, magnitude,
level of influence)
• Set the priority level to measure seriousness of impacts (influence), urgency and growth potential
• Decide what action to take next (step by step approach)
• Plan for who is involved, what they will be doing, where they will be involved, when it happened and the extent of involvement (magnitude)
6
WHO WHAT WHEN WHERE EXTENT
7
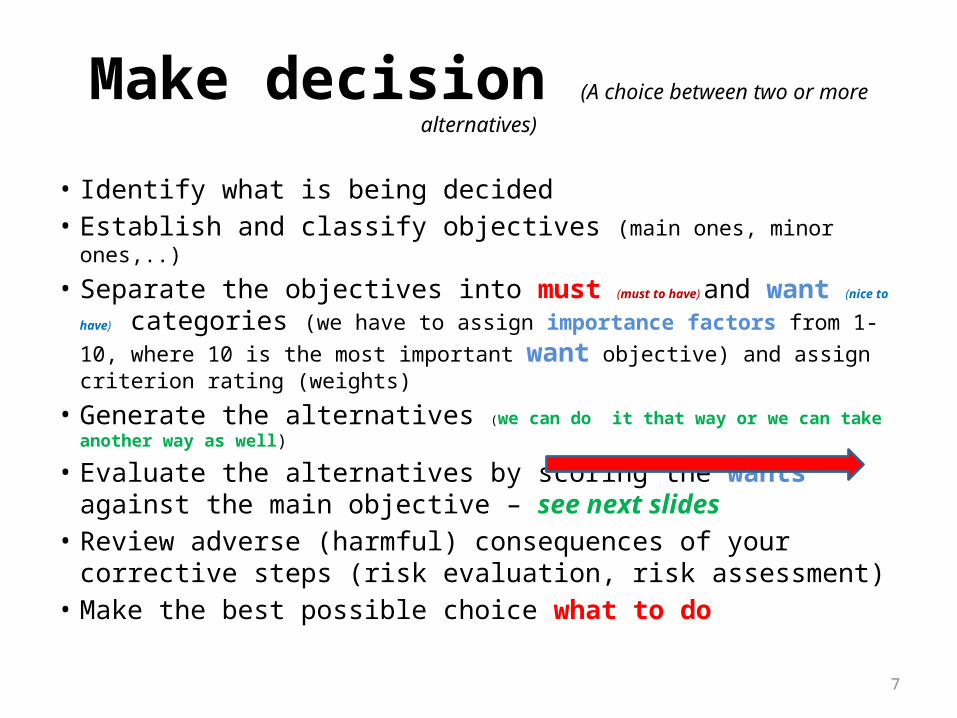
Make decision (A choice between two or more alternatives)
• Identify what is being decided • Establish and classify objectives (main ones, minor ones,..)
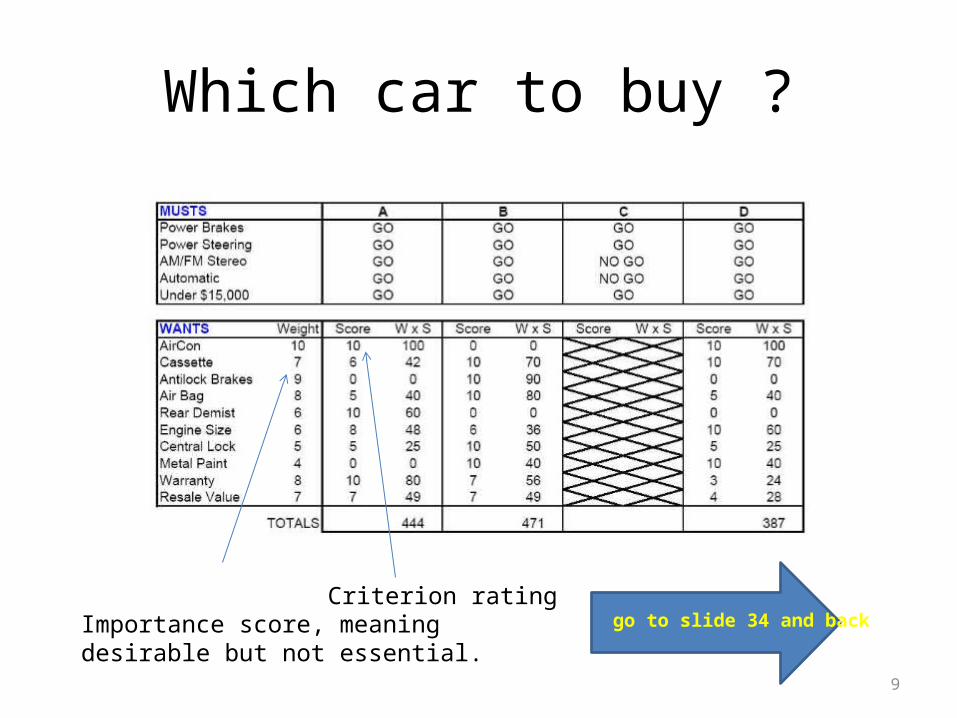
• Separate the objectives into must (must to have) and want (nice to have) categories (we have to assign importance factors from 1-10, where 10 is the most important want objective) and assign criterion rating (weights)
• Generate the alternatives (we can do it that way or we can take another way as well)
• Evaluate the alternatives by scoring the wants against the main objective – see next slides
• Review adverse (harmful) consequences of your corrective steps (risk evaluation, risk assessment)
• Make the best possible choice what to do
8
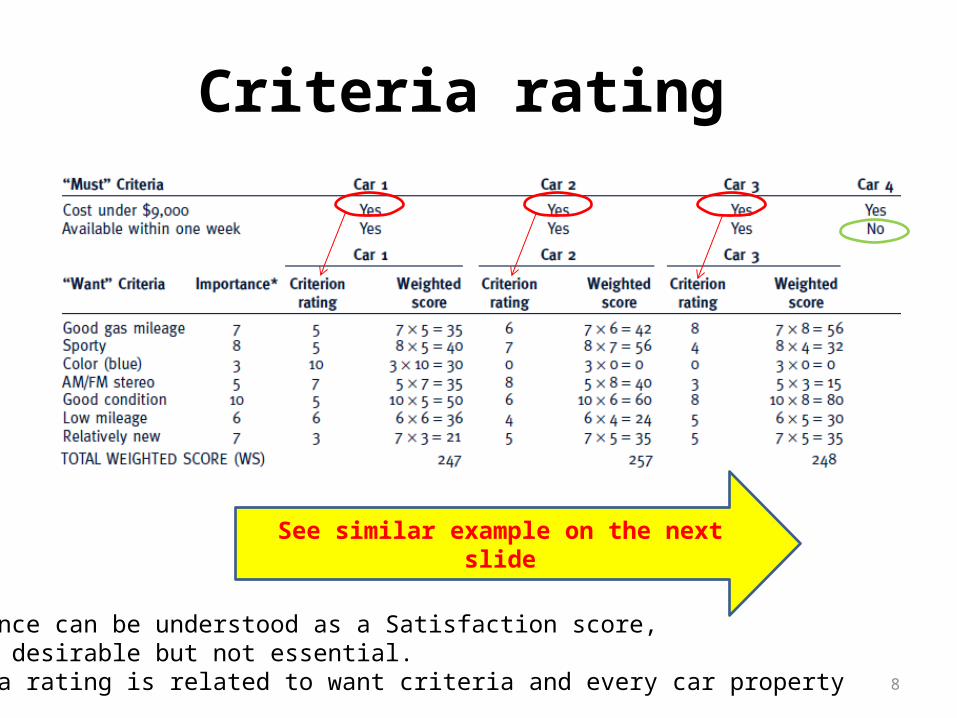
Criteria rating
See similar example on the next slide
Importance can be understood as a Satisfaction score, meaning desirable but not essential. Criteria rating is related to want criteria and every car property
9
Which car to buy ?
Criterion rating go to slide 34 and backImportance score, meaning
desirable but not essential.
10
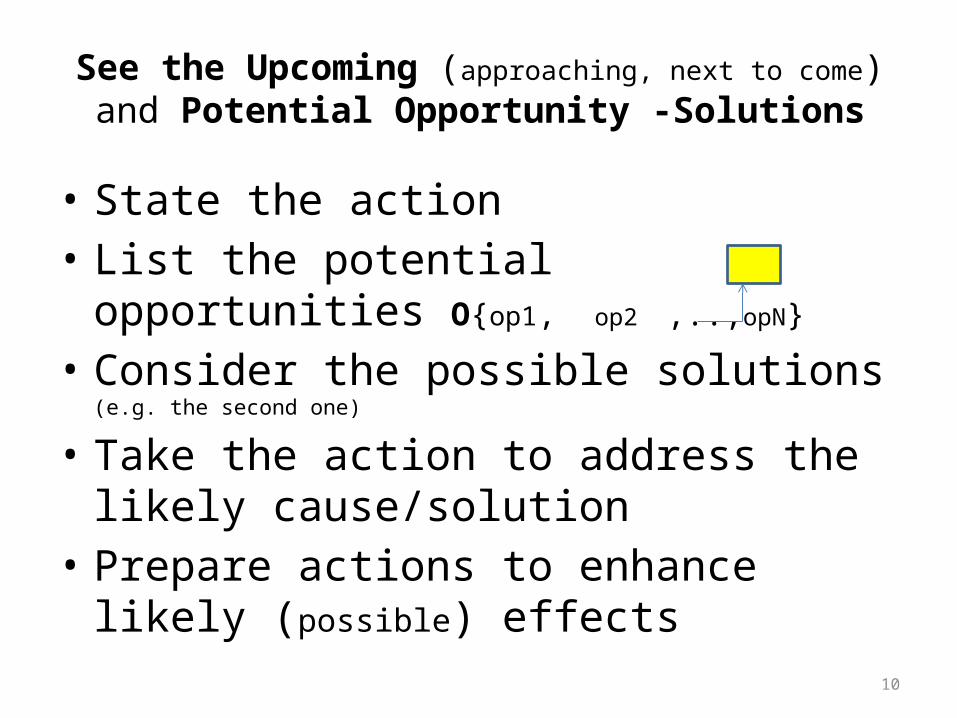
See the Upcoming (approaching, next to come) and Potential Opportunity -Solutions
• State the action• List the potential opportunities O{op1, op2 ,..,opN}
• Consider the possible solutions (e.g. the second one)
• Take the action to address the likely cause/solution
• Prepare actions to enhance likely (possible) effects
11
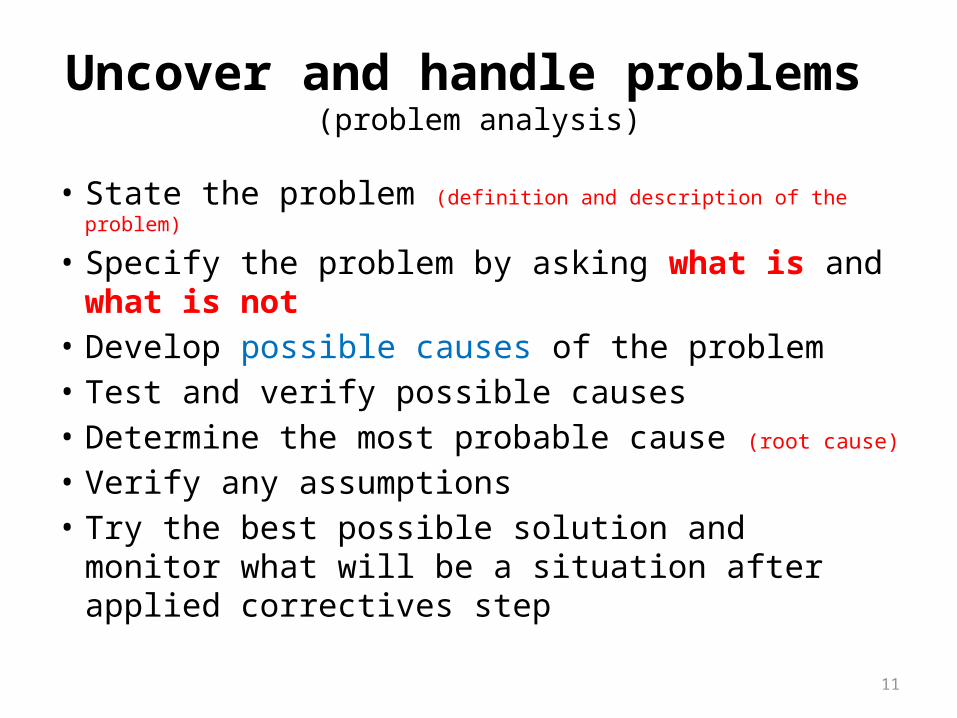
Uncover and handle problems (problem analysis)
• State the problem (definition and description of the problem)
• Specify the problem by asking what is and what is not
• Develop possible causes of the problem• Test and verify possible causes • Determine the most probable cause (root cause)
• Verify any assumptions • Try the best possible solution and monitor what
will be a situation after applied correctives step
12
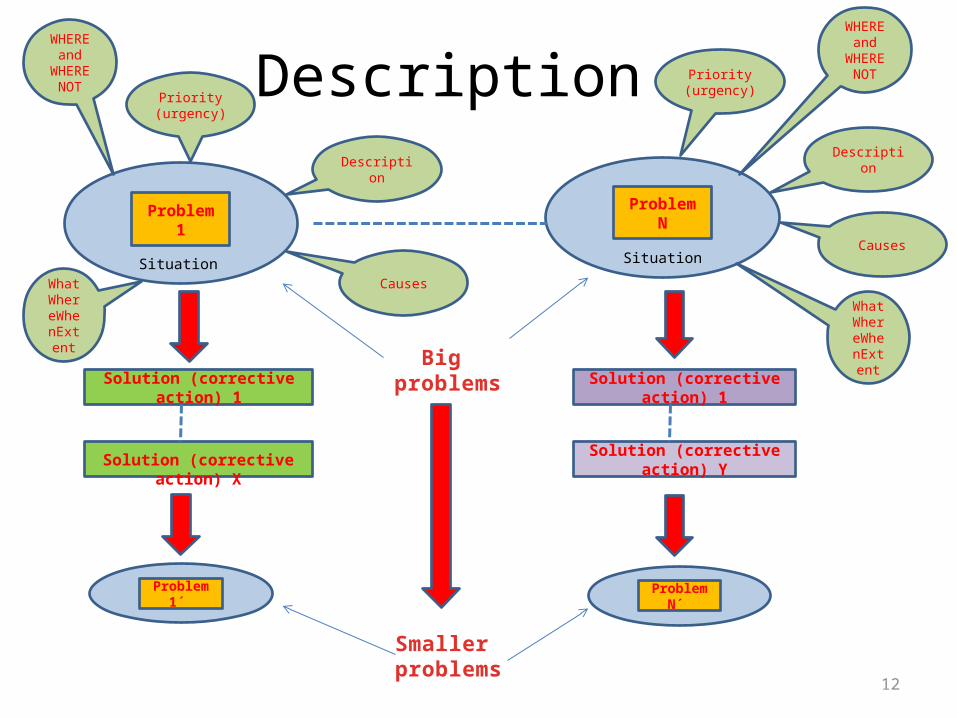
Description
Problem 1 Problem N
Description
Causes
Priority(urgency)
Description
Causes
Priority(urgency)
Solution (corrective action) 1
Solution (corrective action) X
Solution (corrective action) 1
Solution (corrective action) Y
Problem 1´ Problem N´
Situation Situation
Big problems
Smaller problems
WhatWhereWhenExtent
WhatWhereWhenExtent
WHEREand
WHERE NOT
WHEREand
WHERE NOT
13
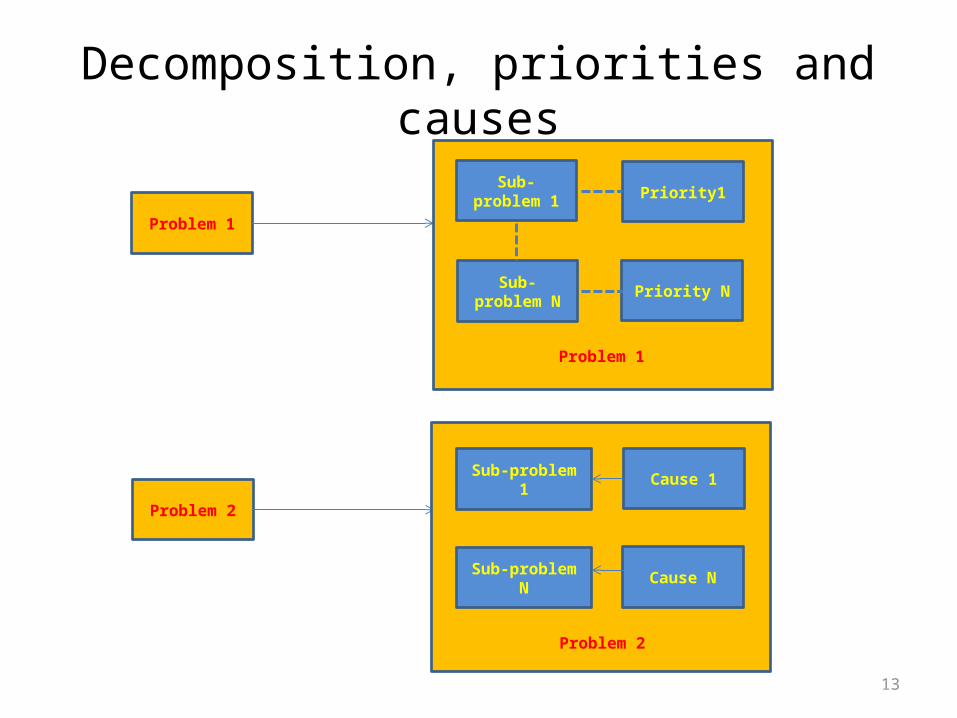
Decomposition, priorities and causes
Problem 1
Sub-problem 1
Sub-problem N
Priority1
Priority N
Problem 1
Problem 2
Sub-problem 1
Sub-problem N
Cause 1
Cause N
Problem 2
14
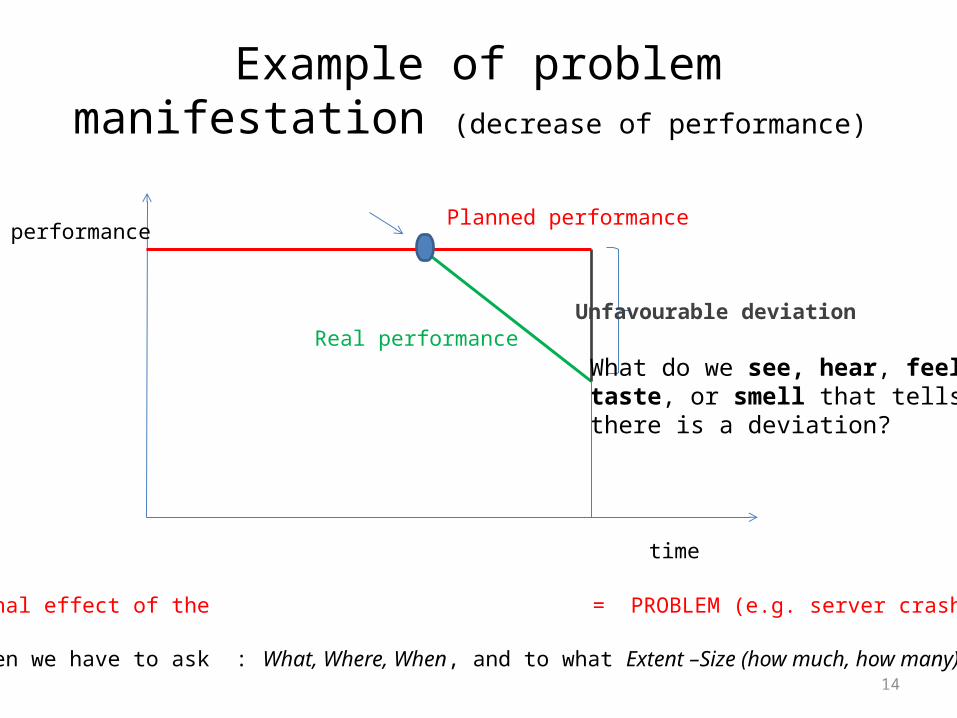
Example of problem manifestation (decrease of performance)
performance
time
Planned performance
Real performanceUnfavourable deviation
What do we see, hear, feel, taste, or smell that tells us there is a deviation?
Change
Final effect of the = PROBLEM (e.g. server crashed)
Then we have to ask : What, Where, When, and to what Extent –Size (how much, how many)?
Change
15
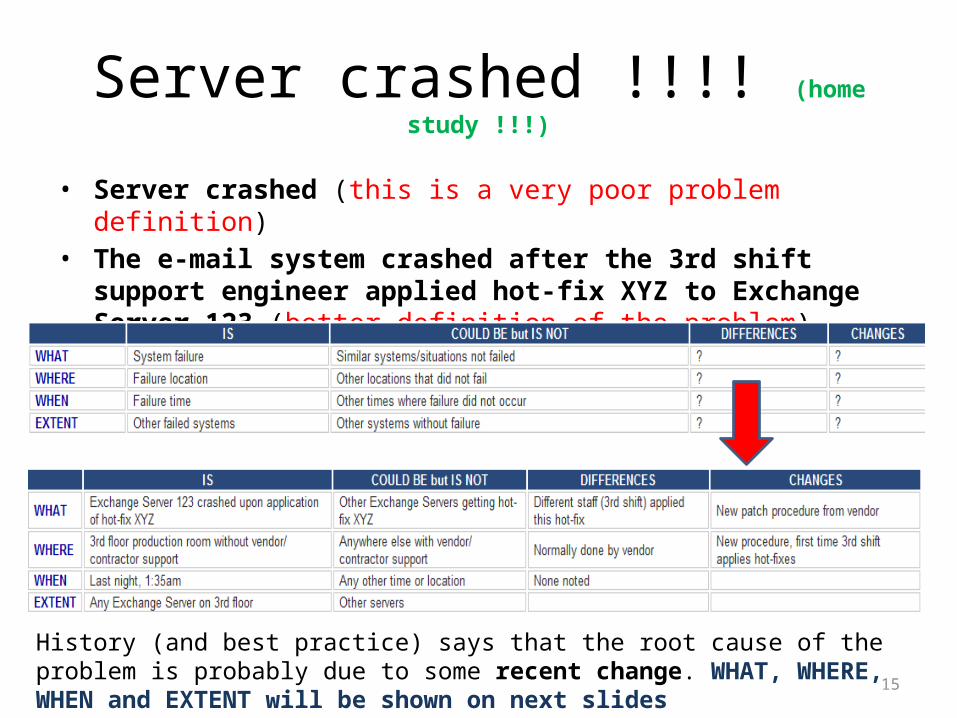
Server crashed !!!! (home study !!!)
• Server crashed (this is a very poor problem definition) • The e-mail system crashed after the 3rd shift support engineer applied
hot-fix XYZ to Exchange Server 123 (better definition of the problem)
History (and best practice) says that the root cause of the problem is probably due to some recent change. WHAT, WHERE, WHEN and EXTENT will be shown on next slides
16
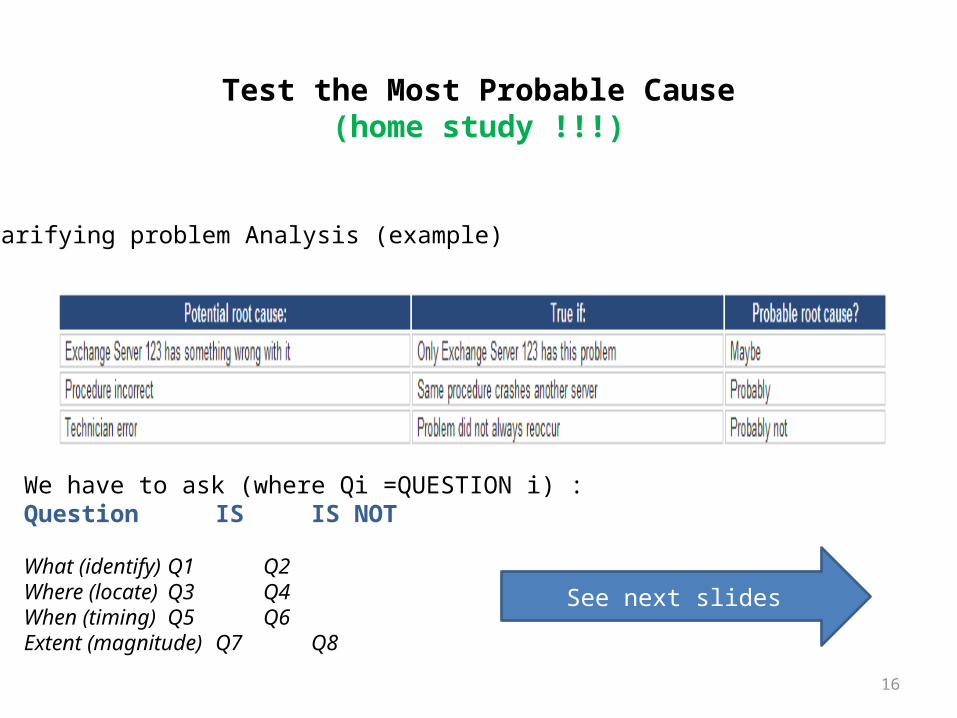
Test the Most Probable Cause(home study !!!)
Clarifying problem Analysis (example)
We have to ask (where Qi =QUESTION i) :Question IS IS NOT
What (identify) Q1 Q2Where (locate) Q3 Q4When (timing) Q5 Q6Extent (magnitude) Q7 Q8
See next slides
17
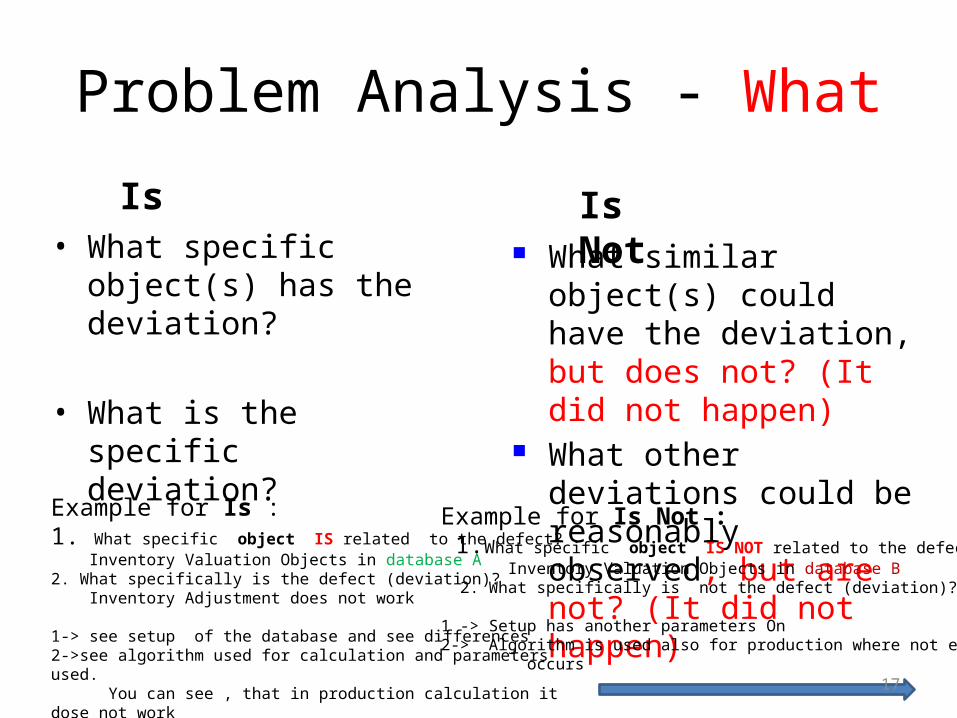
Problem Analysis - What
• What specific object(s) has the deviation?
• What is the specific deviation?
Is Is Not What similar object(s) could
have the deviation, but does not? (It did not happen)
What other deviations could be reasonably observed, but are not? (It did not happen)
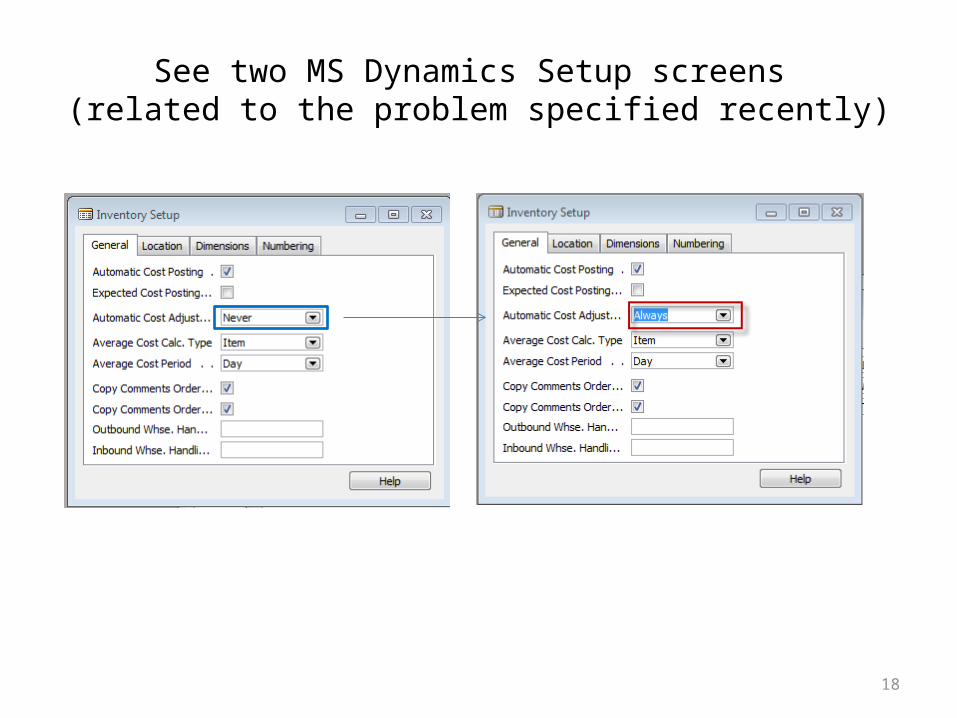
Example for Is : 1. What specific object IS related to the defect? Inventory Valuation Objects in database A2. What specifically is the defect (deviation)? Inventory Adjustment does not work
1-> see setup of the database and see differences 2->see algorithm used for calculation and parameters used. You can see , that in production calculation it dose not work
Example for Is Not : 1.What specific object IS NOT related to the defect? Inventory Valuation Objects in database B 2. What specifically is not the defect (deviation)? 1 -> Setup has another parameters On2-> Algorithm is used also for production where not error occurs
18
See two MS Dynamics Setup screens (related to the problem specified recently)
19
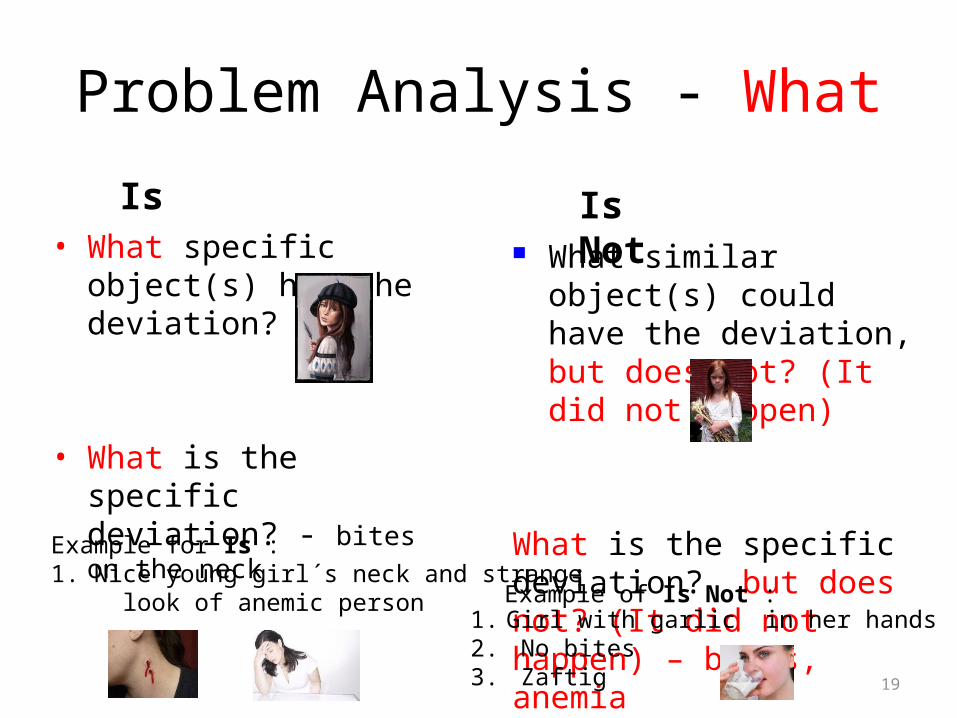
Problem Analysis - What
• What specific object(s) has the deviation?
• What is the specific deviation? - bites on the neck
Is Is Not What similar object(s) could
have the deviation, but does not? (It did not happen)
What is the specific deviation? but does not? (It did not happen) – bites, anemia Example for Is :
1. Nice young girl´s neck and strange look of anemic person
1. Girl with garlic in her hands 2. No bites3. Zaftig
Example of Is Not :
20
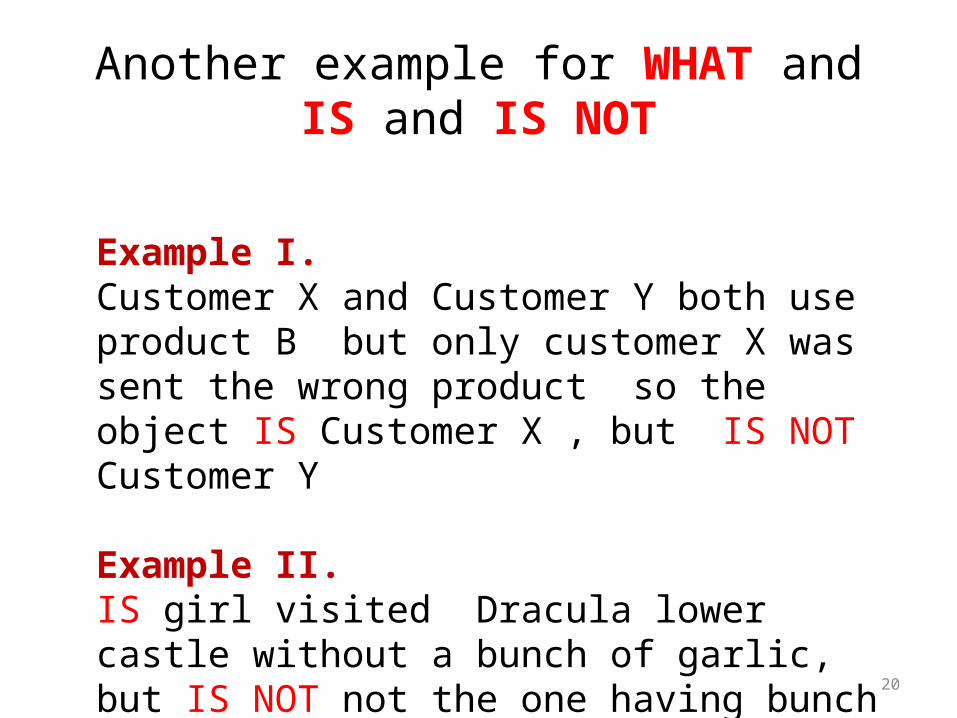
Another example for WHAT and IS and IS NOT
Example I.Customer X and Customer Y both use product B but only customer X was sent the wrong product so the object IS Customer X , but IS NOT Customer Y
Example II.IS girl visited Dracula lower castle without a bunch of garlic, but IS NOT not the one having bunch of garlic and visiting Špiberk castle in Brno
21
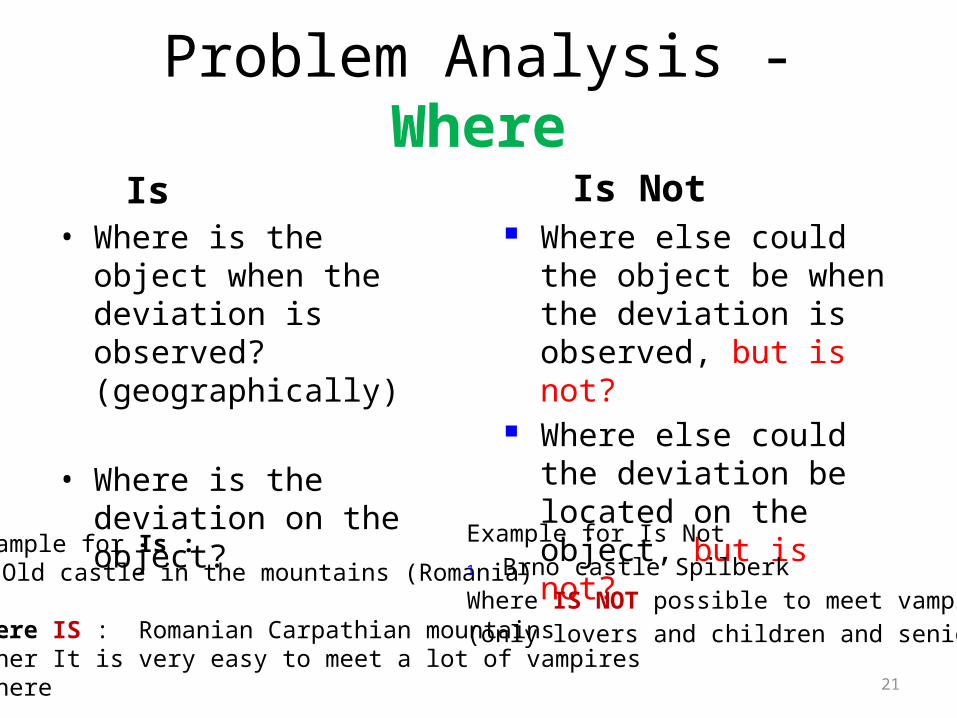
Problem Analysis - Where
• Where is the object when the deviation is observed? (geographically)
• Where is the deviation on the object?
Where else could the object be when the deviation is observed, but is not?
Where else could the deviation be located on the object, but is not?
Is Is Not
Example for Is :1. Old castle in the mountains (Romania) Where IS : Romanian Carpathian mountains wher It is very easy to meet a lot of vampires there
Example for Is Not1. Brno castle SpilberkWhere IS NOT possible to meet vampires(only lovers and children and seniors)
22
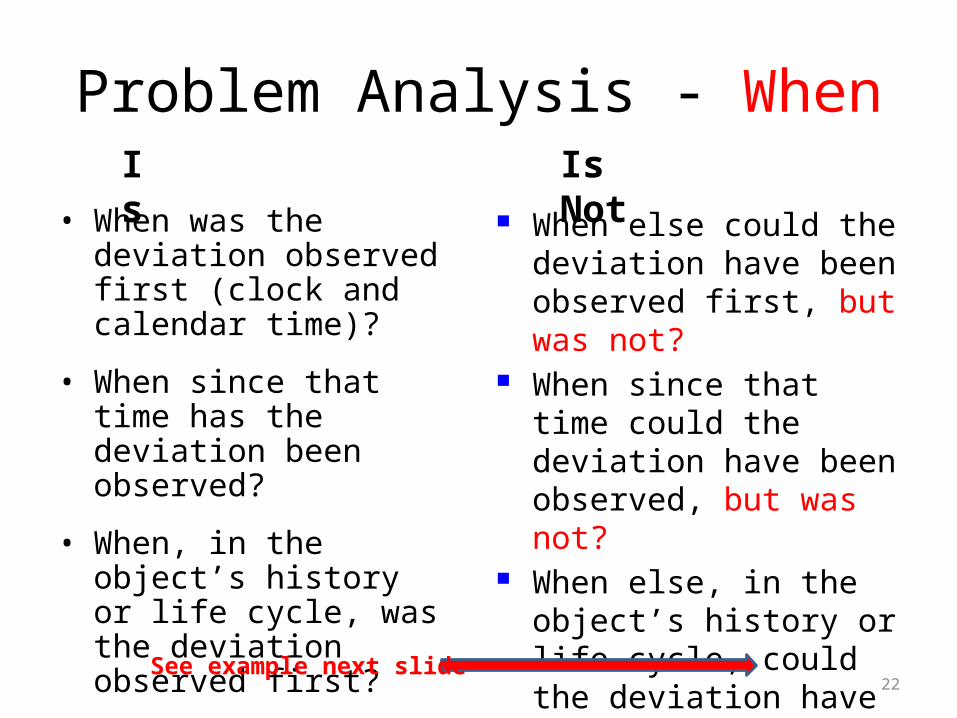
Problem Analysis - WhenIs Is Not
• When was the deviation observed first (clock and calendar time)?
• When since that time has the deviation been observed?
• When, in the object’s history or life cycle, was the deviation observed first?
When else could the deviation have been observed first, but was not?
When since that time could the deviation have been observed, but was not?
When else, in the object’s history or life cycle, could the deviation have been observed first, but was not?
See example next slide
23
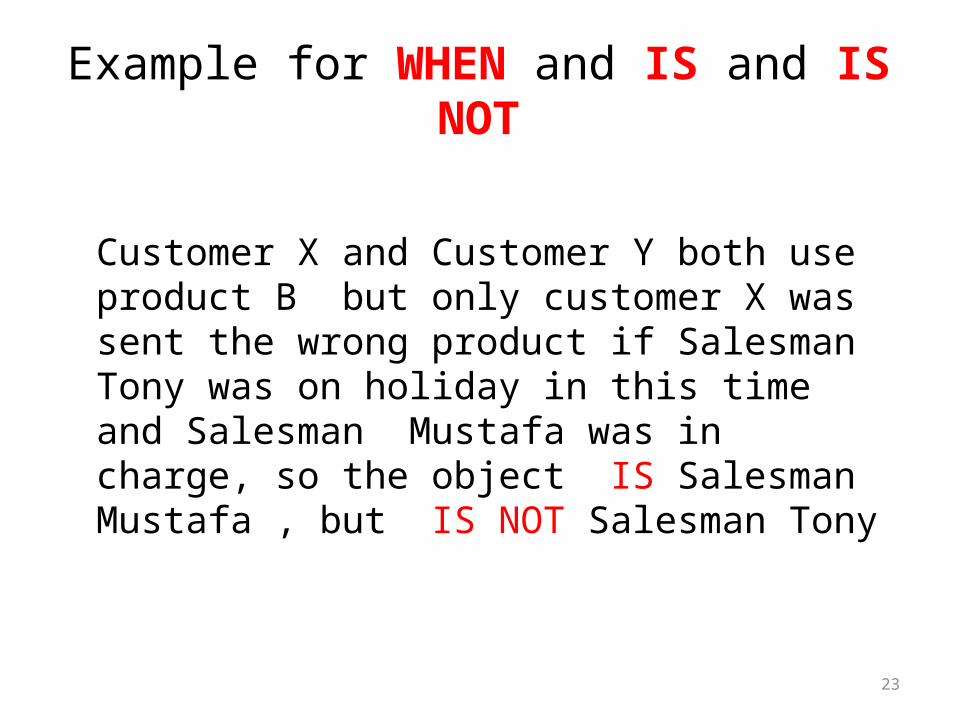
Example for WHEN and IS and IS NOT
Customer X and Customer Y both use product B but only customer X was sent the wrong product if Salesman Tony was on holiday in this time and Salesman Mustafa was in charge, so the object IS Salesman Mustafa , but IS NOT Salesman Tony
24
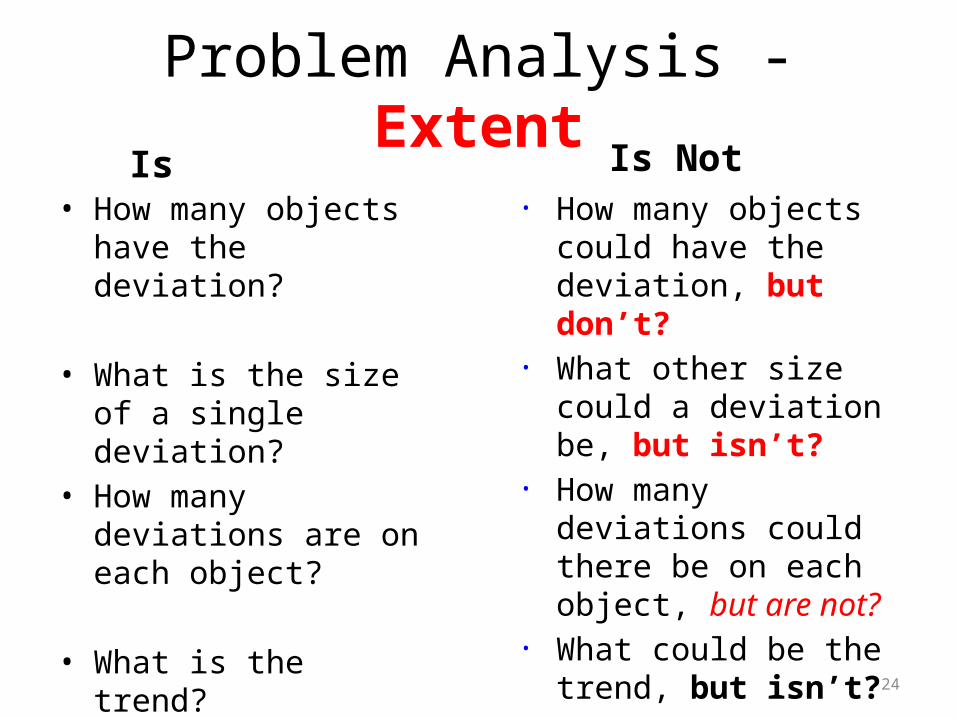
Problem Analysis - Extent
• How many objects have the deviation?
• What is the size of a single deviation?
• How many deviations are on each object?
• What is the trend?– Occurrences?– Size?
• How many objects could have the deviation, but don’t?
• What other size could a deviation be, but isn’t?
• How many deviations could there be on each object, but are not?
• What could be the trend, but isn’t?
• Occurrences?• Size?
Is Is Not
25
Problem AnalysisEvaluate Possible Causes
• • Determine the most probable cause
• Which possible cause best explains the IS and IS NOT information?
• Which possible cause has the fewest, simplest, and most reasonable assumptions?
26
Problem AnalysisConfirm True Cause
• What can be done to verify any assumptions made?
• How can this cause be observed at work?• How can we demonstrate the cause-and-effect
relationship (e.g. Current Reality Tree or Ishikawa
Fishbone Diagram)?• When corrective action is taken, how will
results be checked?
27
Let’s Look At Some Problems!
28
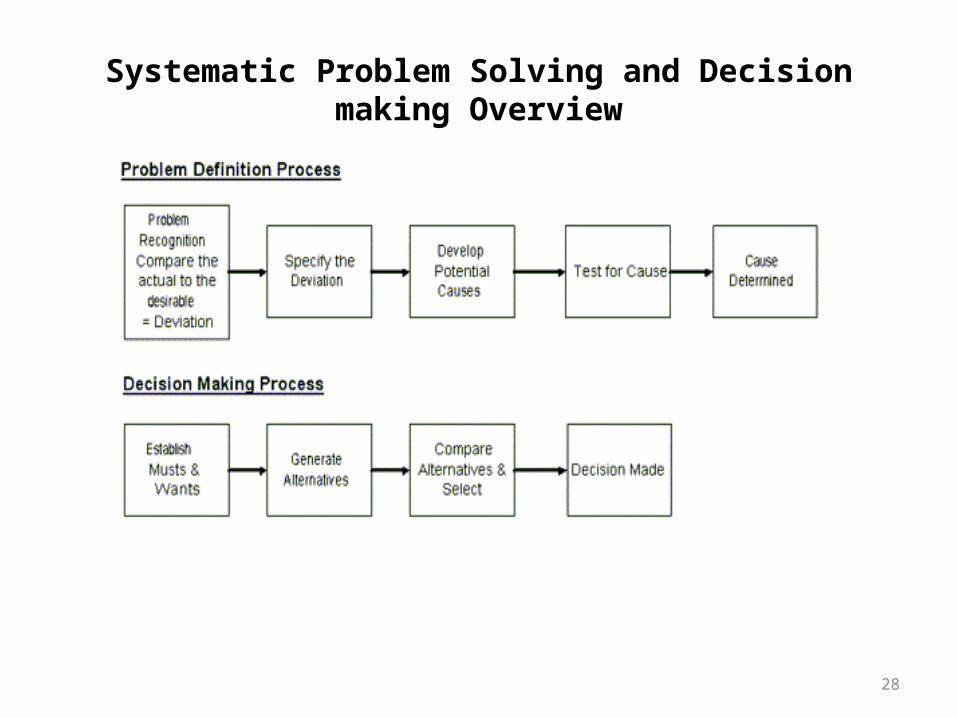
Systematic Problem Solving and Decision making Overview
29
Planning the Next Steps
• Problem Analysis• Do we have a deviation?• Is the cause unknown?• Is it important to know the cause to take effective
action?
• If the answer is YES to ALL three, than you have a big problem, Huston !!!
30
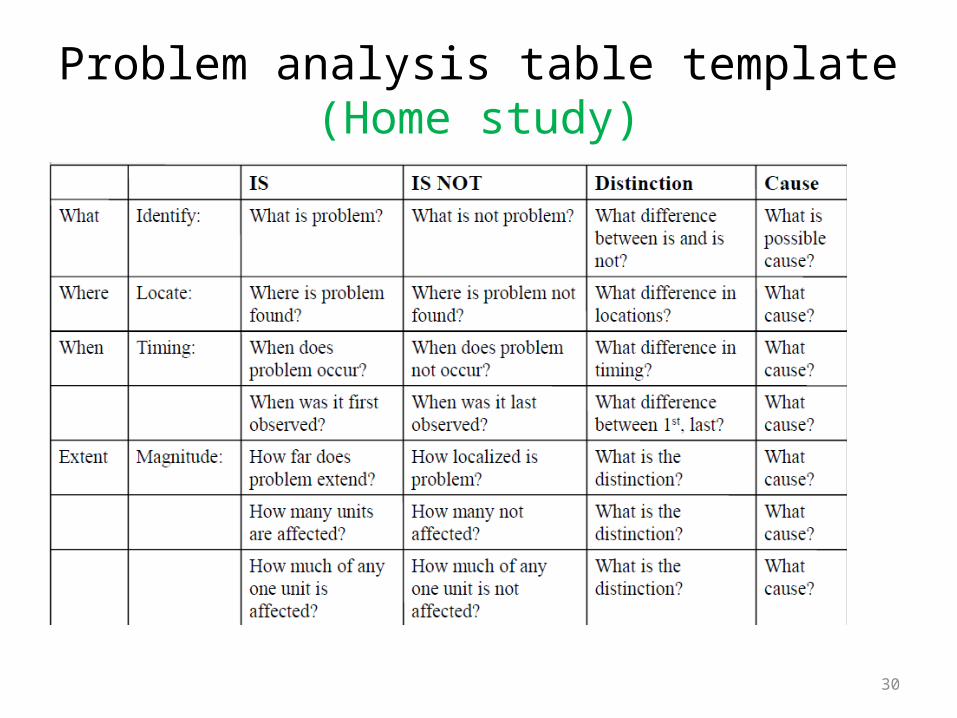
Problem analysis table template(Home study)
31
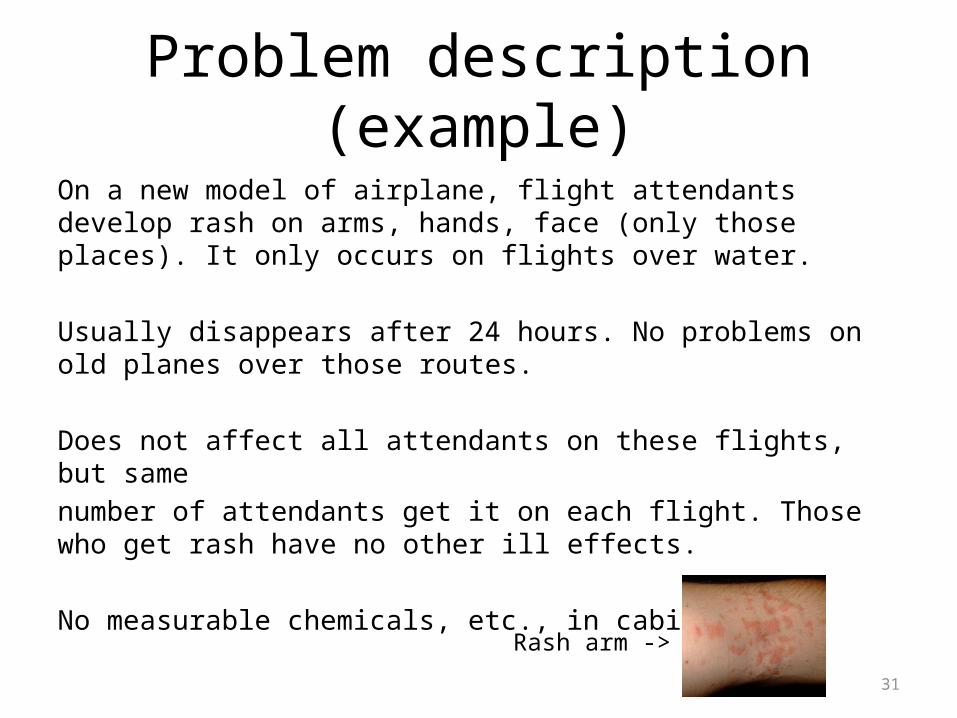
Problem description (example)
On a new model of airplane, flight attendants develop rash on arms, hands, face (only those places). It only occurs on flights over water.
Usually disappears after 24 hours. No problems on old planes over those routes.
Does not affect all attendants on these flights, but samenumber of attendants get it on each flight. Those who get rash have no other ill effects.
No measurable chemicals, etc., in cabin air.Rash arm ->
32
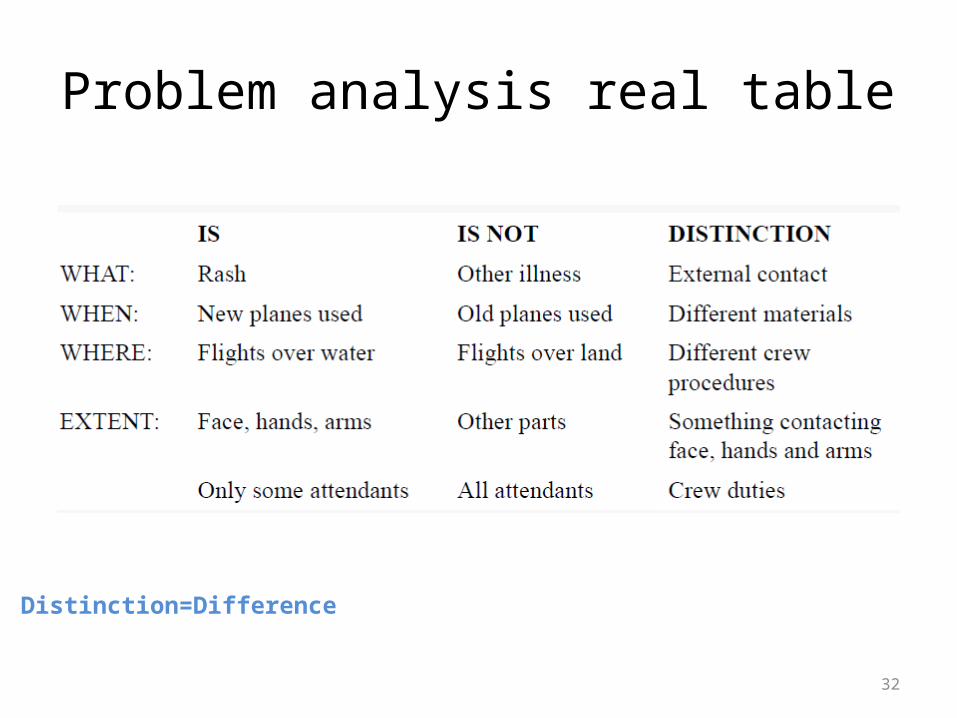
Problem analysis real table
Distinction=Difference
33
Results ????
34
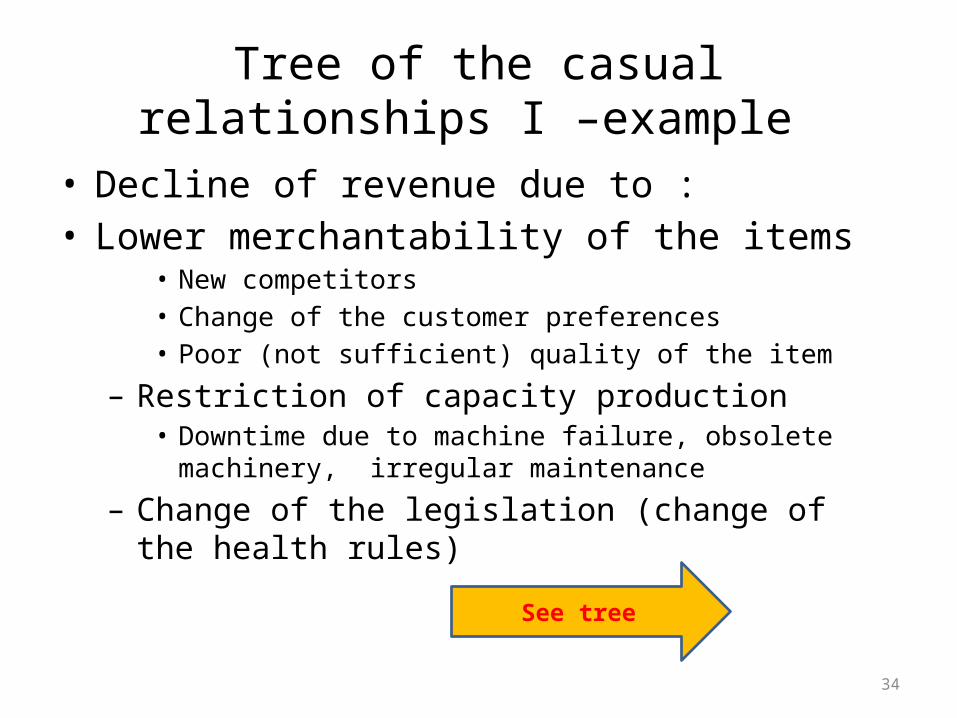
Tree of the casual relationships I –example
• Decline of revenue due to :• Lower merchantability of the items
• New competitors • Change of the customer preferences• Poor (not sufficient) quality of the item
– Restriction of capacity production • Downtime due to machine failure, obsolete machinery,
irregular maintenance
– Change of the legislation (change of the health rules)
See tree
35
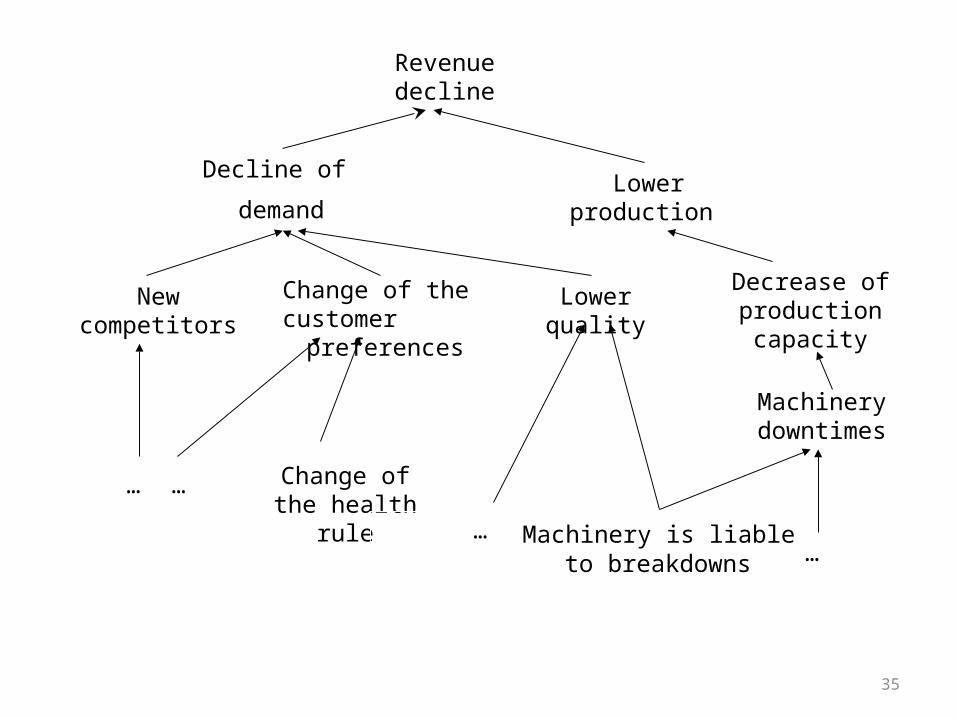
Revenue decline
Decline of
demandLower
production
Decrease of production capacity
Lower qualityChange of the customer preferences
New competitors
Change of the health rule
Machinery is liable to breakdowns
Machinery downtimes
… …
……
36
Let’s Look At Some Problems again!
37
Decision making process
• Problem definition• Requirements identification• Goal establishment• Evaluation criteria development • Select decision –making tool• Apply tool (K &T, Pros-Cons,…)• Check
38
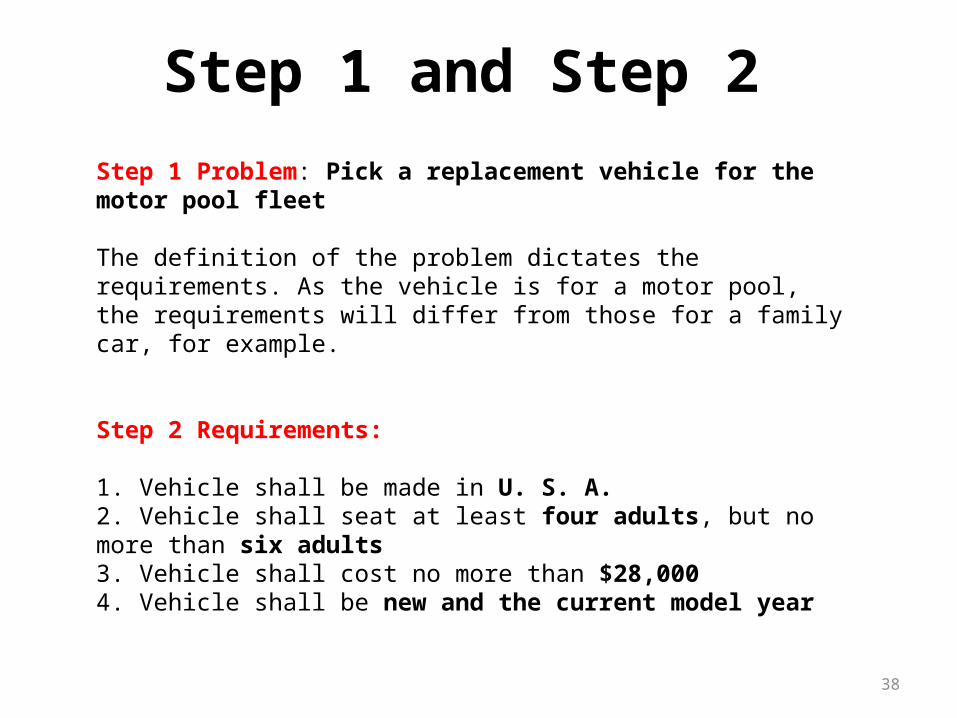
Step 1 Problem: Pick a replacement vehicle for the motor pool fleet
The definition of the problem dictates the requirements. As the vehicle is for a motor pool, the requirements will differ from those for a family car, for example.
Step 2 Requirements:
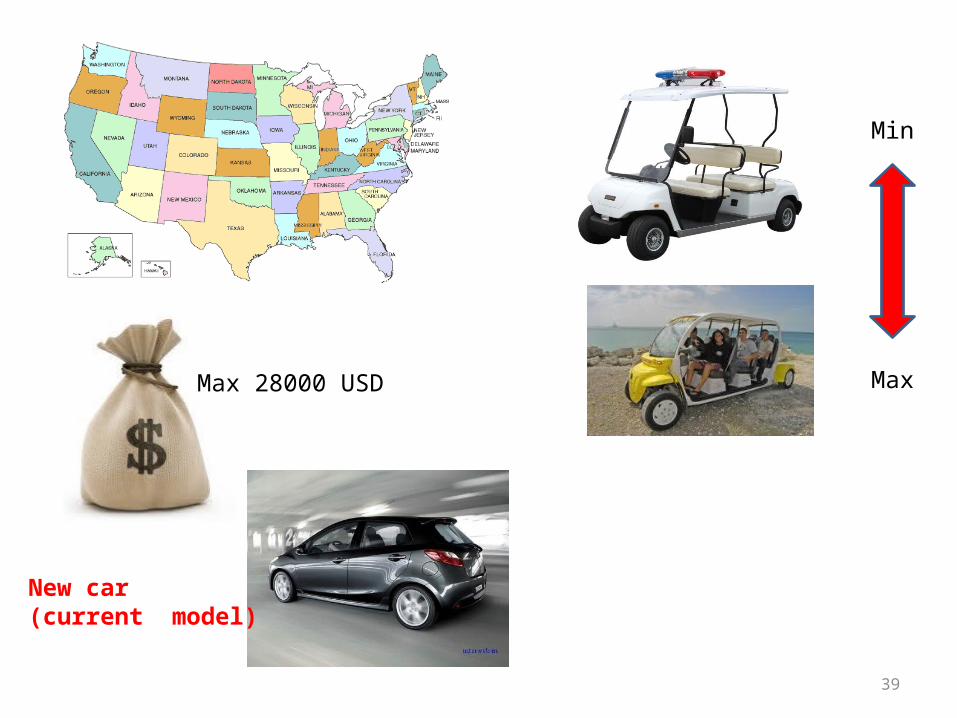
1. Vehicle shall be made in U. S. A.2. Vehicle shall seat at least four adults, but no more than six adults3. Vehicle shall cost no more than $28,0004. Vehicle shall be new and the current model year
Step 1 and Step 2
39
Min
MaxMax 28000 USD
New car(current model)
40
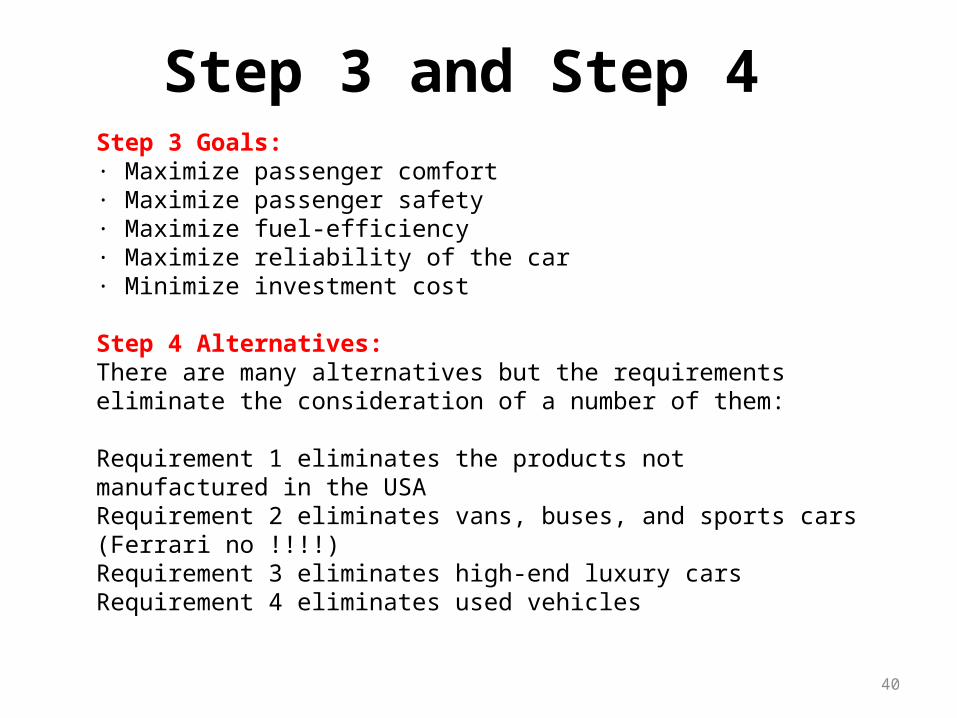
Step 3 and Step 4 Step 3 Goals:· Maximize passenger comfort· Maximize passenger safety· Maximize fuel-efficiency· Maximize reliability of the car· Minimize investment cost
Step 4 Alternatives:There are many alternatives but the requirements eliminate the consideration of a number of them:
Requirement 1 eliminates the products not manufactured in the USARequirement 2 eliminates vans, buses, and sports cars (Ferrari no !!!!)Requirement 3 eliminates high-end luxury carsRequirement 4 eliminates used vehicles
41
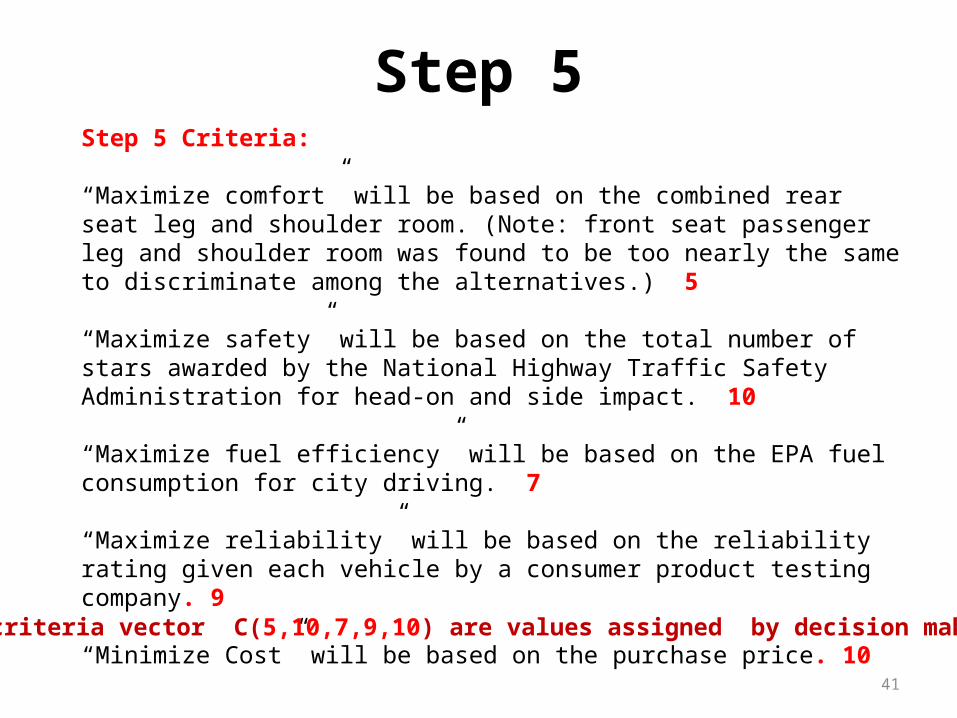
Step 5 Criteria:
“Maximize comfort” will be based on the combined rear seat leg and shoulder room. (Note: front seat passenger leg and shoulder room was found to be too nearly the same to discriminate among the alternatives.) 5
“Maximize safety” will be based on the total number of stars awarded by the National Highway Traffic Safety Administration for head-on and side impact. 10
“Maximize fuel efficiency” will be based on the EPA fuel consumption for city driving. 7
“Maximize reliability” will be based on the reliability rating given each vehicle by a consumer product testing company. 9
“Minimize Cost” will be based on the purchase price. 10
Step 5
Weighted criteria vector C(5,10,7,9,10) are values assigned by decision makers !!!!
42
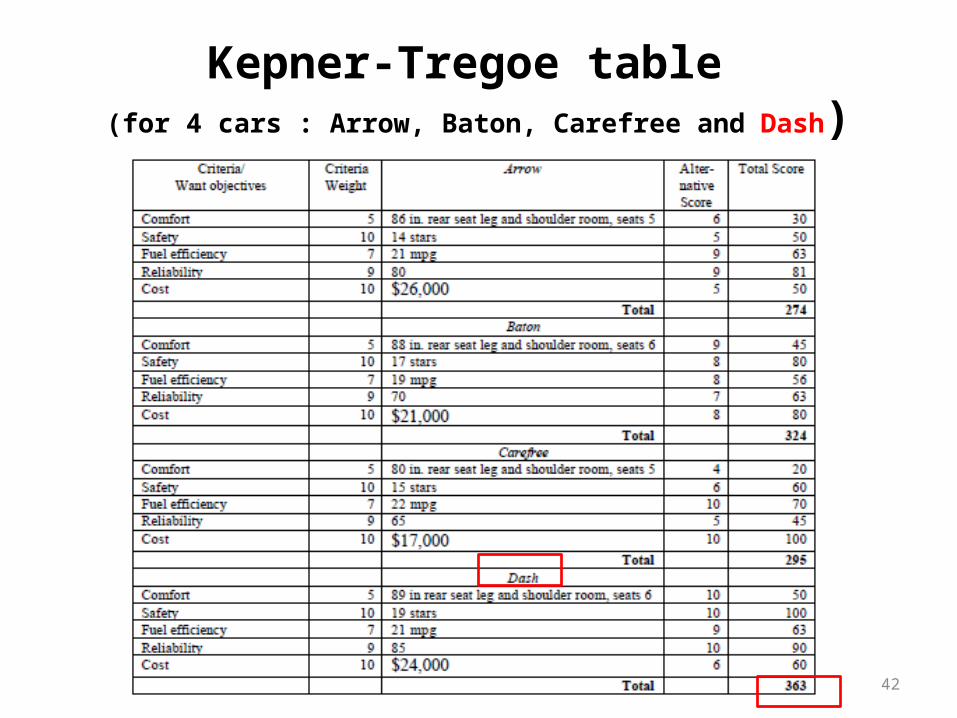
Kepner-Tregoe table (for 4 cars : Arrow, Baton, Carefree and Dash)
43
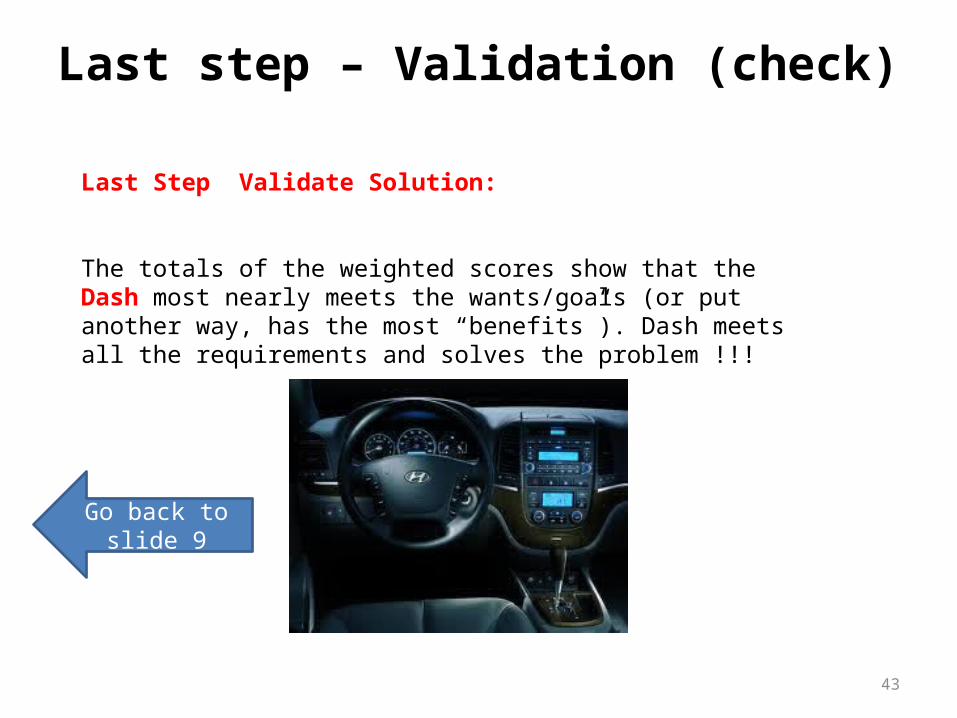
Last Step Validate Solution:
The totals of the weighted scores show that the Dash most nearly meets the wants/goals (or put another way, has the most “benefits”). Dash meets all the requirements and solves the problem !!!
Last step – Validation (check)
Go back to slide 9
44
Thanks for Your attention