key points in insar process to measure surface deformation...
TRANSCRIPT
Key Points in InSAR Process to Measure Surface Deformation in Cangzhou
Lixia Gong (1) Jingfa Zhang (1) Qingshi Guo (2) 1Institute of Crustal Dynamics, China Earthquake Administration, Beijing 100085, P.R. China
2 Hepei Remote Sensing Center, Shi Jiazhuang 050021, P.R. China
Abstract-InSAR technology is applied to measuring surface deformation caused by groundwater extraction in this Paper. ERS1/2 and JERS-1 SAR data are both considered. Firstly, characters of Cangzhou city and the subsidence are studied first. According to the characters, appropriate processing methods are designed for this experiment. 2-pass instead of 3-pass differential method is chosen. JERS1 SAR images are used instead of ERS ones because their better tolerance of vegetation and large deformation. A set of late processes are also designed to improve the interferograms and to extract proper subsidence from the unwrapped phase. Filtering can deal with the noise caused by low coherence to some extent. The outcome unwrapped phase maps are geocoded and translated into deformation values. And then Discontinuities in unwrapped phase due to very low coherence are masked. Finally a density slice is applied to get pseudo-color subsidence maps for better visualization. Several SAR pairs are processed and subsidences of different period are obtained. Deformation pattern in Cangzhou is analyzed from the subsidence maps and the further extracted profiles. Extension and quantity of InSAR measurements are compared with the actual subsidence values. InSAR technology proves to be an efficient way to measure land subsidence, and is expected to be applied in surface deformation induced by groundwater, gas, oil pumping and etc.
I. INTRODUCTION
Cangzhou City of Heipei Province has gained significant urban development in the past 2 decades. Underground water serves the agricultural, industry and resident. Severe pumping activity leads to several meters of land subsidence with an increasing trend [1], and to more than 20 ground fissures till 2003 [2]. Surface deformation results in great damage to urban infrastructure. Therefore it is significant to detect pumping associated subsidence for the consideration of sustainable development of this city.
Traditional ground stability detecting techniques include leveling, extensometers and etc. Recently, GPS system is widely used for the ability to determine all 3-D deformation. The main advantage of these techniques is their high accuracy. However, they are rather expensive and can only achieve discrete observations on several monitored points.
In contrast, D-InSAR (Differential SAR Interferometry) technique can provide continuous deformation field with low cost. In the past 2 decades this method has been utilized to detect almost all kinds of surface movements. In this paper
InSAR method is used to measure the groundwater pumping induced subsidence in Cangzhou City. 2 items will be demonstrated: 1) subsidence measurements from JERS pairs, and 2) late process to separate subsidence phase from various noises.
II. DATA PROCESS
Before deciding which data to be used, we take into consideration the characters of Cangzhou City and its subsidence. First, the study area is almost plane and varies from 5m to 13m in the elevation. So SRTM is supposed to meet the accuracy requirement.
Second, there are vast farmlands which complicate the InSAR process. L-band is less sensitive to vegetation than C-band because of the larger wavelength. So the L-band JERS SAR dataset are favored for this experiment. Another advantage of large wavelength is that it is more tolerant than ERS with baseline, atmosphere and weather difference, while C-band is more precise in detecting small deformation. Another way to improve the low coherence caused by vegetation is to strengthen the filter.
Third, the subsidence here is very severe, which makes it possible to detect the deformation by JERS in a short time interval, such as 2 or 3 months.
Now that SRTM is available and applicable, 2-pass D-InSAR instead of 3-pass is chosen to avoid possible extra errors brought by the topographic SAR pair [3].
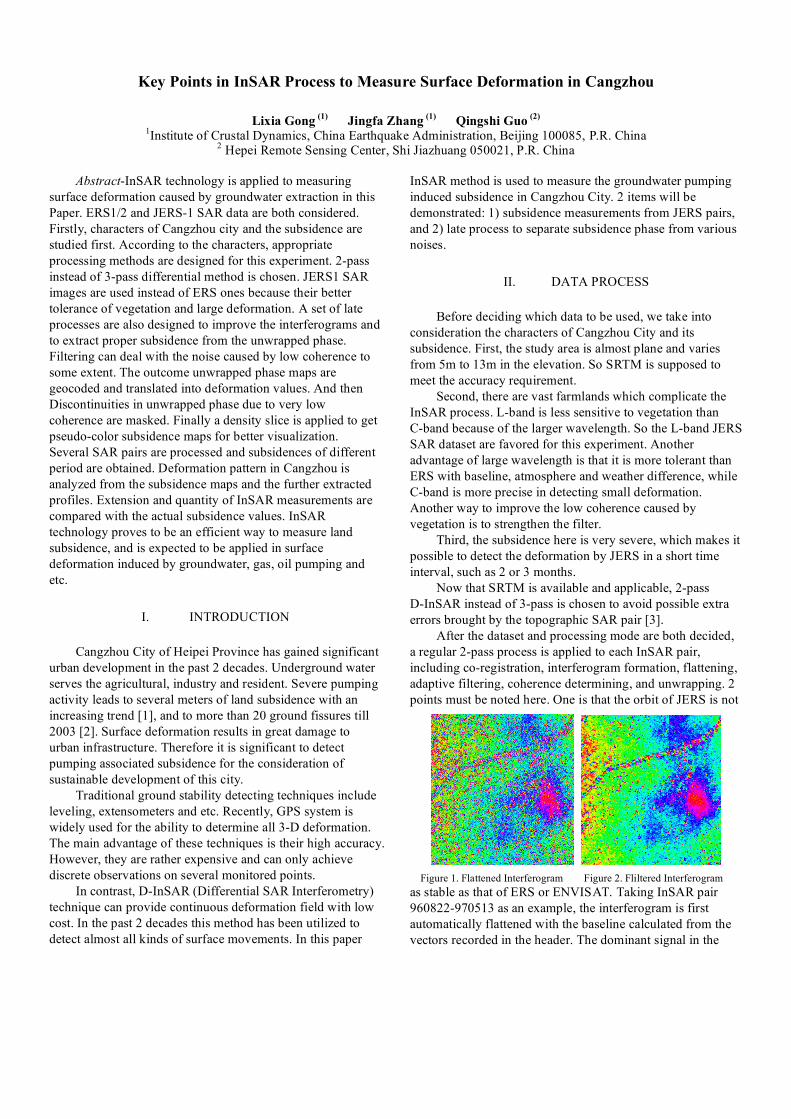
After the dataset and processing mode are both decided, a regular 2-pass process is applied to each InSAR pair, including co-registration, interferogram formation, flattening, adaptive filtering, coherence determining, and unwrapping. 2 points must be noted here. One is that the orbit of JERS is not
Figure 1. Flattened Interferogram Figure 2. Fliltered Interferogram
as stable as that of ERS or ENVISAT. Taking InSAR pair 960822-970513 as an example, the interferogram is first automatically flattened with the baseline calculated from the vectors recorded in the header. The dominant signal in the
flattened image is still fringes due to earth ellipsoid. Interactive flattening must be applied to remove residue phase due to flat earth. The other point is the serious noises caused by the vegetation, atmosphere and temporal baseline, as Fig.1 shows. Increasing the strength of filter will improve the interferogram to some extent. Fig. 2 is the filtered image.
III. LATE PROCESS
Little useful information about subsidence can be directly obtained from the unwrapped phase. For the purpose of visualization, a series of late process steps are applied, as fig.3 shows.
Figure 3. Late process steps
First, the unwrapped phase is converted into deformation value according to the equation
JERS operates at the Wavelength of 23.5cm. It is to say,
a !2 phase difference corresponds to a deformation of 11.75cm on the line of sight (LOS). Assuming the subsidence is vertical, the relation between LOS deformation!" , vertical subsidence and look angle can be written as:
A fringe then represents 15cm of subsidence when look angle of JERS is 37°.
The subsidence image is then geocoded using ground control points because the coordinates calculated from the orbit ephemeris are not accurate enough. It is difficult to geocode the subsidence image directly. But we know that it has same coordinates with the intensity image. So tiepoints can be marked between the intensity image and 1:100000 maps, and applied to the subsidence image.
The region of interest (ROI) is only a subset of the whole image. A closed vector is applied to each image to cut out a same region. Discontinuous areas are masked as unreliable results, which will be excluded from the operation of following steps.
Now there is still an overall offset that should be subtracted over the whole subsidence image. Assuming that a small circle far away from Cangzhou City did not subside
during this period, the average of this circle is calculated and taken as the overall offset.
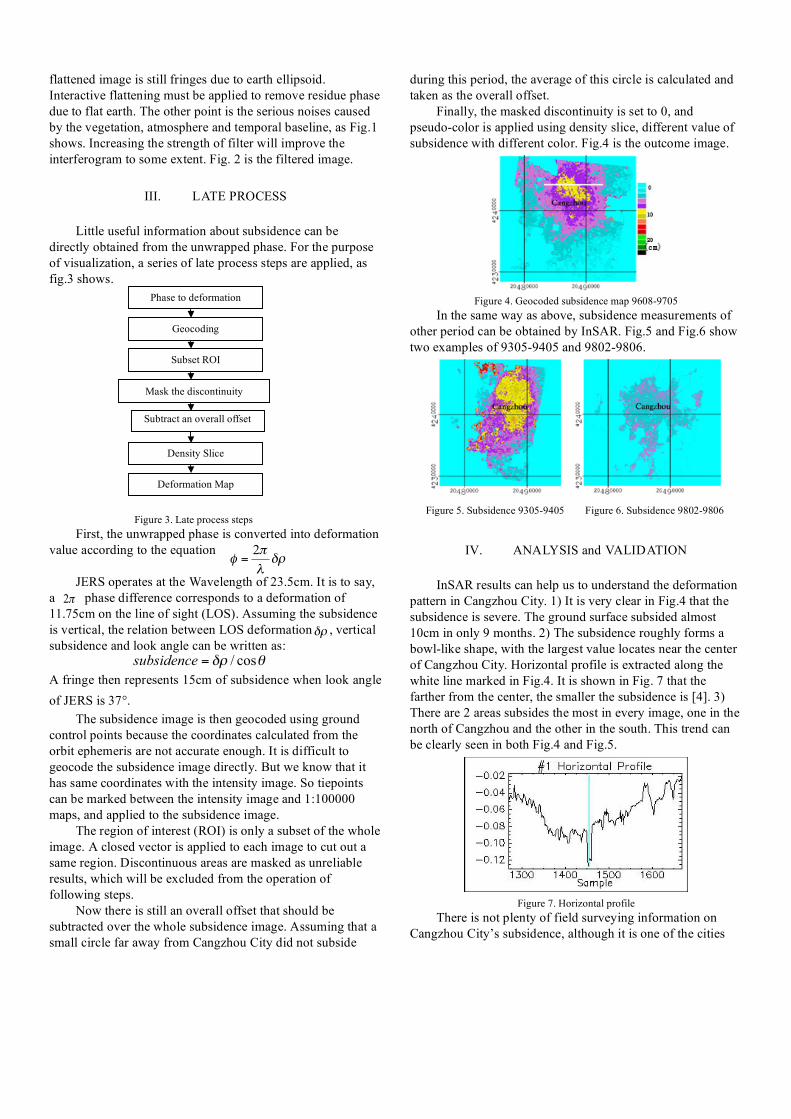
Finally, the masked discontinuity is set to 0, and pseudo-color is applied using density slice, different value of subsidence with different color. Fig.4 is the outcome image.
Figure 4. Geocoded subsidence map 9608-9705
In the same way as above, subsidence measurements of other period can be obtained by InSAR. Fig.5 and Fig.6 show two examples of 9305-9405 and 9802-9806.
Figure 5. Subsidence 9305-9405 Figure 6. Subsidence 9802-9806
IV. ANALYSIS and VALIDATION
InSAR results can help us to understand the deformation pattern in Cangzhou City. 1) It is very clear in Fig.4 that the subsidence is severe. The ground surface subsided almost 10cm in only 9 months. 2) The subsidence roughly forms a bowl-like shape, with the largest value locates near the center of Cangzhou City. Horizontal profile is extracted along the white line marked in Fig.4. It is shown in Fig. 7 that the farther from the center, the smaller the subsidence is [4]. 3) There are 2 areas subsides the most in every image, one in the north of Cangzhou and the other in the south. This trend can be clearly seen in both Fig.4 and Fig.5.
Figure 7. Horizontal profile
There is not plenty of field surveying information on Cangzhou City’s subsidence, although it is one of the cities
Phase to deformation
Subset ROI
Subtract an overall offset
Deformation Map
Density Slice
Geocoding
Mask the discontinuity
!"#
$%
2=
!"# cos/=subsidence

that suffer the most groundwater pumping subsidence. All the materials the authors collected show that two leveling campaigns are carried out during 1993 and 1998. The elevation difference varies from -0.485m to -0.139m. Consequently, the average subsidence rate is 97mm per year. And the ground subsided the most in 1997, at the rate of 118.6mm/a [5], roughly according with InSAR result of 9608-9705. Fig.8 shows simple subsidence profiles of Cangzhou City from 1975 to 2001[5], but there is few details available in this map.
Figure 8. Cangzhou-Huanghua subsidence profiles (1975-2001) [5]
The authors also went to Cangzhou and verified that there are actually two subsiding centers. Big plants that have a great need of industrial water gather in the north city. The south city includes some plants and residents, leading to a less serious subsidence than the north does. Fig.9 shows the subsidence pattern of Cangzhou City in 2001. The purple lines represent subsidence isolines [5].
Figure 9. Cangzhou subsidence isolines (2001) [5]
V. CONCLUSION and FUTURE WORK
Cangzhou suffers serious subsidence in the 1990’s. Given InSAR results reliable, they can act as a complement when there are not enough GPS and leveling measurements.
JERS operates at a larger wavelength than ERS does. Sometimes it deals with the problem that ERS and ENVISAT are not capable with, such as, spatial baseline up to 1000m, vegetation, and temporal baseline up to 3 years [6]. But JERS is not as sensitive to ground deformation as ERS does. Besides, JERS operated only from 1992 to 1998, so deformation information of recent years is not available by JERS InSAR.
InSAR proves to be a cost-effective way to detect land
subsidence and is expected to be widely utilized to monitor ground deformation in other regions.
The low coherence caused by vegetation and temporal baseline still effects the interferogram unwrapping. More effective methods should be used to solve this problem. Referring to PS (Permanent Scatters) InSAR method [7], some experiments have been carried out. Fig.10 shows the preliminary result that demonstrates the distribution of PSs. The general subsidence pattern is almost same as conventional InSAR results. But it still contains too many unstable factors. Further jobs should be done in the near future to analyze these factors.
Figure 10. PS points distribution
ACKNOWLEDGMENT
The JERS data are mainly processed with InSAR module of EarthView 3. Thanks to the colleagues of Perking University for providing us software to use. Thanks a lot to Atlantis for the test version of their software. The authors are also very grateful to Dr. Zhenhong Li of University College of London for his great help on data process. Thanks to the engineers of Hepei Remote Sensing Center.
REFERENCES
[1] Ministry of Land and Resource of the People’s Republic of China, “Report on underground water situation in main cities and regions in China (1998)”, http://www.cigem.gov.cn/dxs/1998tb.htm.
[2] “Report on underground water and environment of China”, http://www.igsnrr.ac.cn/content.jsp?tablename=kydt&id=382.
[3] Sean Buckley, “Radar Interferometry Measurement of Land Subsidence”, Doctor Dissertation of The University of Texas at Austin, 2000,8.
[4] Lixia Gong, Jingfa Zhang, Qingshi Guo, “Measure Groundwater Pumping Induced Subsidence with D-InSAR”, IGARSS'05, Seoul, Korea, 25-29 July. 2005.
[5] Linghai Zeng, Zengshou Liu, Chengbing Zhang, “Pediction and Prevention on Cangzhou City’s Ground Subsidence”, Journal of Engineering Geology, Vol.13 SUPPL, 2005
[6] Lixia Gong, Jingfa Zhang, Zhanqiang Chang, et al, “Measuring Mining Induced Subsidence with InSAR”, IGARSS'05, Seoul, Korea, 25-29 July. 2005.
[7] C. Colesanti, A. Ferretti, C. Prati, F. Rocca, “Monitoring Landslides and Tectonic Motion with the Permanent Scatterers Technique”, Eng. Geology, Vol. 68/1-2, 2003.