kinetic studies of serine protease inhibitors in 'active...
TRANSCRIPT

_____________________________________________________
__
Kinetic studies of serine protease inhibitors in
'active barrier' model systems
_____________________________________________________
__
Bachelor thesis by Cecilia Ålander
Supervisor: Gunnar Johansson
Subject specialist: Michael Widersten
Examiner: Helena Grennberg
Department of chemistry - BMC
Biochemistry

2
Abstract
The aim of this project was to design model systems based on gelatine gel for the
simulation of serine protease activity of the digestive enzymes trypsin and, briefly,
chymotrypsin. Two different inhibitors, antipain and leupeptin, of the enzymes were
incorporated into the models to see what kind of effect they would have on the applied
enzymes. The yielded results were ambiguous for the inhibitory effect of leupeptin. The
results for the antipain-affected enzyme experiments were positive showing a consistent
inhibition of trypsin. It can be concluded that these models require more testing before they
will be able to be directly applicable to reality.

3
TABLE OF CONTENTS
1. INTRODUCTION……………………………………………………….…...….........4
1.1. Aim........................................................................................................................ ....4
1.2. Enzyme kinetics......................................................................................................4
1.2.1. Serine proteases...............................................................................................5
1.3. The kinetics of enzyme inhibitors…………………………………………........6
1.2.1. Serine protease inhibitors...............................................................................7
1.4. Measuring kinetics…………………………………………………….……….....8
1.5. Gelatine as a model system..................................................................................8
2. MATERIALS AND METHODS……………………………………………...........9
2.1. Kinetic experiments in Petri dishes…………………………………….......….9
2.2. Kinetic experiments in 96 well Plates ……………………………………......10
2.2.1. Trypsin activity………………………………………………..….….................11
3. RESULTS ……………………………………………...............................................12
3.1 Kinetic experiments on Petri dishes. …………………………………............12
3.2. Kinetic experiments on 96 well plates.............................................................14
4. DISCUSSION…………………………………………….........................................19
4.1 Kinetic experiments on Petri dishes…………………………………..............19
4.2. Kinetic experiments on 96 well plates.............................................................20
5. REFERENCES…………………………………………………………….................22
5.1 Literature………………………….........................................................................22
5.2 Pictures………………………….............................................................................22

4
1. Introduction
1.1. Aim
Proteases are enzymes with the ability to degrade or modify polypeptide structures and
many are part of the human metabolism. The aim of this study is to create and test gelatine
gel-based models used for the simulation of so called 'active barriers'. The models are
tested by investigating how the activity of certain proteases is affected by inhibitors
suspended in gelatine gel. The target enzymes of the experiments are chymotrypsin and,
mainly, trypsin and the inhibitors are antipain and leupeptin. The study can be divided into
two parts where the first involves enzyme activity measurements on a simple one-layered
model, in which both the enzyme substrate and a relevant inhibitor is present. The second
part describes experiments performed on a two-layered gel-based model system where
substrate and inhibitor are separated into one layer each.
1.2. Enzyme kinetics
The study of chemical reactions catalyzed by enzymes, by measuring their rate, is often
generally referred to as enzyme kinetics. Kinetic analysis of reactions catalyzed by
enzymes is a powerful tool used for determining the mechanism and the catalytically active
parts of an enzyme. The rate of a reaction is the speed at which reactants are converted into
products. The reactant of interest in enzyme kinetics is, of course, the substrate of the
enzyme. Equation (1), first described by Adrian John Brown, is often used to explain the
chemical reaction between the enzyme E and its substrate S (Brown, 1902).
(1)
The formation of the complex ES is a reversible process with a first-order rate constant for
ES formation, k1 and for dissociation, k-1. Though the reaction looks simple in its design
most enzymatically catalyzed reactions involve a series of chemical transformations of the
substrate before it reaches its product form. These series of reactions usually include one
rate determining step and can thus collectively be described by a single first-order rate
constant kcat. When conducting kinetic experiments, certain conditions are usually met in
order to simplify the mathematical models behind reaction mechanisms. This study uses
the steady-state approximation of enzyme kinetics, which is a model widely used when
studying enzyme kinetics. When an enzymatic reaction is in its steady-state, the rate of
formation of the ES complex is equal to its rate of formation of product P and free enzyme.
This state is achieved after rapid formation of the ES complex is balanced out by the
formation of products. The initial reaction velocity v0, or simply v, of product formation
(found very early in the course of the reaction) is experimentally shown to act linearly as a
function of time. In this initial phase of the chemical reaction described by Equation (1)

5
only the ES complex is the only accumulating intermediate. The total enzyme
concentration can thus be assumed to be as shown in Equation (2),
(2)
where [E]f is the concentration of free enzyme. The ES complex will accumulate until its
formation is balanced out by the formation of product, since enzyme concentration [E] is
very limited. The concentration of substrate [S] is in great excess compared to the
catalytical enzyme concentration and is approximated to be constant during rate
measurements (Copeland, 2000).
The widely used Michaelis-Menten equation in Equation (3) is largely derived from the
steady-state approximation and is the central equation for kinetic studies of single-substrate
enzyme reactions.
(3)
The constant v is the initial rate of the reaction and Vmax is the maximum reaction velocity
that can be achieved from saturation of the substrate concentration (see Figure 1). Km is
often called the Michaelis constant in literature and is the substrate concentration, at which
the initial rate velocity is half of Vmax. The Michaelis constant is often used as a measure
for a substrates affinity for the enzyme, where a low Km signifies a high affinity since Vmax
is quickly achieved in that system.
Figure 1. A schematic picture of a diagram showing a typical 'saturation curve' with Km and Vmax marked
out.
1.2.1 Serine proteases
This group of enzymes specialize in degrading proteins by hydrolyzing the peptide bonds
in the polypeptide chains. Many enzymes of this group are part of our metabolism where
they degrade the large protein complexes into smaller peptides. Chymotrypsin and trypsin,
which are studied in this project are serine proteases synthesized in the pancreas of humans
and other mammals and are part of food digestion. Serine proteases are usually simple

6
enzymes with a single active site per molecule, for example chymotrypsin and have this
name because their active site commonly includes a reactive serine residue. This single
serine residue have proven to be crucial for the catalytic function of many proteases. By
introducing an irreversible inhibitor to the enzymes that bound to the oxygen atom on
serine, the activity of the enzymes was ruined (Neitzel, 2010).
Chymotrypsin is a serine protease that hydrolyzes the C-terminal peptide bond of
hydrophobic amino acid residues like phenylalanine, tyrosine, leucine and tryptophan. It
has also had reported a secondary hydrolysis of other amino acids residues like serine,
methionine, alanine, isoleucine, threonine, histidine, glycine and valine (Burell, 1993).
Trypsin is a protease with a histidine and a serine residue in its active site that, similarly to
chymotrypsin, cleaves peptide bonds on the C-terminal side of amino acid residues. It is
more selective in its cleavage sites than chymotrypsin, only hydrolysing the peptide bonds
of lysine and arginine residues (Walsh, 1970).
1.3. The kinetics of enzyme inhibitors
Inhibition of an enzyme can occur in several different ways. To begin with, the inhibitors
examined in this experiment are reversible inhibitors meaning that they are able to
dissociate from the enzyme. It is important to not forget that some inhibitors bind
irreversibly to an enzyme, however they will not be discussed in this study. Besides
reversible or irreversible binding, the inhibitor can interact with an enzyme in three main
forms: competitive inhibition, non-competitive inhibition and uncompetitive inhibition.
This experiment focuses on competitive inhibitors which are inhibitors that only bind to
the free enzyme and not to the ES complex (see Figure 2). With this kind of inhibition as
long as not all free enzyme molecules are bound to the inhibitor the same maximum
velocity of product formation Vmax. There will however be a competition between substrate
and inhibitor for free enzyme molecules, which will increase the concentration of substrate
needed to reach maximum and half maximum velocity. Km will, in other words increase in
the presence of a competitive inhibitor (Copeland, 2000).
Figure 2. A simple picture showing the interactions of competitive inhibitors and enzymes (orange).

7
The affinity an inhibitor has for an enzyme is important when studying inhibitors. Some
inhibitors bind very tightly to the enzyme depleting the concentration of free inhibitor and
thus also making kinetic measurements stray from those normally produced by normal
steady-state kinetics. Tight-binding inhibitors can be easily identified, by looking at the
IC50 value of the inhibitor i.e. the inhibitor concentration needed to decrease the reaction
rate of an enzyme by half. It is a value related to Km and if its size is similar (within a
factor 10) to the total enzyme concentration in the system, then it may indicate that the
active inhibitor is tight-binding. For competitive tight-binding inhibitors the IC50 value
depends on Ki value of the inhibitor, the substrate concentration and its Km value, and
enzyme concentration as Equation 4 describes.
(4)
Where Ki is the dissociation equilibrium constant of the enzyme-inhibitor complex [EI] as
seen in Equation 5 (Copeland, 2000).
(5)
1.3.1 Serine protease inhibitors
These inhibitors, as many inhibitors in general, are usually similar in their structures to that
of the natural substrate of their target enzymes. Since the target enzymes are proteases the
inhibitors commonly are built up of peptide-like structures with modifications that give
them their inhibitory properties. Two serine protease inhibitors are investigated in this
project; antipain and leupeptin.
Antipain and leupeptin are reversible, but tight-binding, competitive inhibitors of microbial
origin. Leupeptin has a wide selectivity, being able to inhibit a broad range of serine and
cystein proteases including trypsin. Both inhibitors are peptide-like molecules (see Figure
3). When inhibiting trypsin the backbone of leupeptin forms four hydrogen bonds with the
enzyme and a fifth with a water molecule, as well as a weak covalent bond between the
aldehyde carbonyl group and the oxygen of the serine residue in the active site (a
hemiacetal) effectively blocking it (Kurinov and Harrison, 1996).
Antipain is, like leupeptin a reversible tight-binding protease inhibitor structurally similar
to a peptide. It is a competitive inhibitor whose mechanism resembles that of leupeptin.
Neither antipain or leupeptin are strong inhibitors of chymotrypsin, having reported IC50
values of higher than 250 μg/ml and 500 μg/ml respectively (Suda, 1972).

8
Figure 3. Structures of antipain (left) and leupeptin (right).
1.4. Measuring kinetics
As hinted, the rates that are measured are the initial rates of a chemical reaction measured
from the moment reactants are brought together. The desired measurement is the formation
of product and by extension the degradation of substrate when it comes to proteases. It is
common to use artificial substrates when measuring protease activity. The substrates are
often designed to include a chromogenic part that, once cleaved off the rest of the
molecule, emits a wavelength measurable by a spectrophotometer. A spectrophotometer
measures the absorbance of a compound by letting a beam of light of defined wavelengths
pass through the sample and measuring the light that is not absorbed. The absorption
measured by the instrument would give a quantification of the amount of substrate that has
been degraded using the relation between absorbance and concentration given by Lambert-
Beers law seen in Equation 6 (Atkins and De Paula, 2010).
(6)
The letter A stands for absorbance (measured in absorbance units), l is the path length of
the light beam passing through the sample and c is the concentration of the product. The
Greek letter ε is the molar attenuation coefficient which is a value describing a chemicals
ability to absorb light at a certain wavelength, and thus, varies with what wavelength is
used to measure the absorbance.
1.5. Gelatine as a model system
When designing models for simulative experiments for proteases, it is important to find a
suitable substitute material to work with. Gelatine is an animal-based biopolymer formed
by enzymatic, alkaline or acidic partial hydrolysis of collagen. It is a protein material rich
in glycine, alanine and proline but also contain a variety of other amino acids such as
lysine, histidine and more unique amino acids such as 4-hydroxyproline. Gelatine is the
result of collagen being cleaved into pieces of varying size and is an odourless powder that
is soluble in many polar solvents, including water. It can withstand mild heating up to

9
approximately 50 degrees Celsius and is easy to procure as a material. These aspects and
its diverse amino acid composition makes collagen and its derived product, gelatine useful
materials for making model systems for proteases (Dranca and Vyazovkin, 2009; Nelson
and Cox, 2013).
2. Materials and methods
The gel used in all experiments contains 0.02 g/ml gelatine powder of the brand Törsleff's
'favorit gelatin pulver - extra guld' mixed with deionised water. The powder was dissolved
by heating the mixture mildly to approximately 50 degrees Celsius. The resulting liquid gel
was allowed to cool down to room temperature before mixed with any reagents. After
approximately 1.5 hours at 4 ºC the gelatine gel solidifies.
2.1 Kinetic experiments in Petri dishes
The following experiments were performed in Petri dishes. Solutions of protease inhibitors
antipain and leupeptin containing 2.0 mM and 5.4 mM as well as trypsin and
chymotrypsin solutions of the concentration 25 μM were prepared. All the reagent
solutions were made from solid compounds dissolved in deionised water, except the
chymotrypsin solutions which, for stability, also contained 1 mM HCl and 2 mM CaCl2.
Gel solutions were prepared to contain antipain or leupeptin of the concentrations
0, 5, 10, 15 and 20 µM. Each Petri dish was filled with one of these solutions. Petri dishes
with the diameter 9.1 cm containing 6 ml gel solutions with one of the inhibitor
concentrations 5, 10, 15 and 20 µM were prepared in duplicates, as well as two plates with
no inhibitor, to a total number of 18 plates. An additional 4 Petri dishes of diameter 5.5 cm
with a volume of 2 ml per plate were prepared; two plates contained gel solutions of 20
µM leupeptin and 20 µM antipain respectively, and two Petri dishes had no inhibitor. The
plates were stored at 4 ºC for approximately 1.5 hours until the gel had solidified.
Drops of 50 µl containing trypsin of the concentrations 1, 5, 10, 15, 20 and 25 µM were
pipetted onto 9 plates of size 9.1 cm and 25 µl drops were added onto the 5.5 cm plates
(see Figure 4). Chymotrypsin drops of volume 25 µl with concentrations 1, 5, 10, 15, 20
and 25 µM were pipetted onto the last 9 9,1 cm Petri plates.

10
Figure 4. A schematic picture of the two types of Petri dishes used in these tests of enzyme activity. The gel
layer thickness was 0.92 mm in the larger plates and 0.84 mm in the smaller plates.
The smaller plates were left in room temperature (~21 °C) for 3 hours and the bigger ones
for 24 hours in a refrigerator immediately after enzyme application. The holes in the
gelatine created by the enzyme were dyed red with food colouring to accentuate their size.
The drop diameters were measured after 1 hour, 5 hours and 24 hours, and after 1 hour, 2
hours and 3 hours respectively for the two series of Petri dish experiments.
2.2 Kinetic experiments in 96-well plates
On 96 sample well Microtiter plates (see Figure 5), the wells were filled with gelatine gel
in layers, containing an enzyme substrate or an inhibitor (See Figure 6). The enzyme
examined in this part was trypsin. Each experimental well was initially filled with 200 μl
gel solution containing n-benzoyl-DL-arginine-p-nitroanilide (BAPA), trypsin substrate.
The gel layer was allowed to set before adding another layer of gelatine solution containing
leupeptin or antipain of one of the concentrations 0, 1, 5, 10, 15, 20 or 25 µM.
Figure 5. A Microtiter plate with 96 sample wells. The rows are marked A to H and the columns 1 to 12.

11
Figure 6. A model portraying the general composition of a sample well. Note that the inhibitor layer only
consists of gelatine gel in the experiments with no inhibitor present.
2.2.1 Trypsin activity
Various triplicates of wells filled with 200 µl BAPA gel of a certain concentration were
prepared. The concentrations of BAPA ranged from 0, 0.2, 0.5, 0.8, 1, 2, 3, 4, 5, 8, 10 to 15
mM, for a total set of 36 sample wells. Once the substrate layers had set, 100 µl inhibitor
layers were applied to the wells where a third was prepared to contain 1 µM antipain, one
third to contain 1 µM leupeptin, and the last 12 sample wells were filled with 100 µl plain
gel solution. An additional two sets of identical sample wells were prepared for a total
number of 108 sample wells distributed over two plates. Enzymatic activity on the plates
was investigated by pipetting 5 µM trypsin drops of size 10 µl onto the congealed sample
wells of the plates with a ten-tipped multichannel pipette and, immediately after enzyme
application, measuring absorbance of the wells on the plate over time in a SpectraMax Plus
384 Microplate Reader at 410 nm for 3 hours.
Two series of sample wells in triplicate, where substrate layer concentrations (and volume)
were constant at 2.5 mM and 200 µl were prepared. In the 100 µl layers on top of the
substrate layers inhibitor concentration varied from 0, 1, 2, 3, 4 to 5 µM, and 0, 5, 10, 15,
20 to 25 µM in the two series for a total of 18 wells per series. Leupeptin and antipain were
tested as inhibitors in the two series of sample wells and 10 µl drops of 5 µM trypsin were
dripped onto the wells. Absorbance of the wells was measured over time for 3 hours.
The rate of substrate degradation, caused by the enzyme, was followed
spectrophotometrically by using chromogenic substrates. The substrates used in the
experiment contain the chromophore p-nitroaniline, which has a measurable absorption
maximum at 410 nm and is released once the substrate is degraded by the active enzyme.
Trypsin cleaves off p-nitroaniline from its substrate via the reaction mechanism seen in
Figure 7 below.

12
Figure 7. The degradation of BAPA by the enzyme trypsin. The peptide bond linking p-nitroaniline to the
rest of BAPA is cleaved, releasing the compound.
3. Results
3.1 Kinetic experiments on Petri dishes At both temperatures drop size grew unbiased over the time spans. A comparison between
results from the two temperatures can be seen in Figure 8 below.
Figure 8. Photographs portraying results of two experiments done in refrigerator temperature (the two plates
from the left) for 24 hours and one at room temperature (rightmost) for 3 hours. The first plate from the left
contains 20 μM antipain and the other two does not contain any inhibitor. Distinct differences in size,
reflecting the amount of enzyme (in this case, trypsin) present in the drop, can be seen in all experiments.
Comparing the sizes of the drops at the end of the experiment, the drop sizes showed to be
strongly proportional to the enzyme concentration in each drop. Any irregularities in drop
size, for example the abnormally large drop found between two smaller drops in the middle
photograph in Figure 8, were easy to identify. From their diameter, the area of the drops
was calculated and plotted against enzyme concentration to form diagrams displaying
curves that revealed a linear relationship between drop size and enzyme concentration. An
excerpt of two such a diagrams showing how the drop size varied with enzyme
concentration in room temperature and refrigerator temperature tests is presented in
Figures 9 and 10.

13
Figure 9. Linear curves showing drop size as a function of trypsin concentration from tests in room
temperature on plates containing no inhibitor, antipain or leupeptin.
Figure 10. Linear curves showing drop size as a function of trypsin in plates with different concentrations of
antipain. tested on lower temperature.
To visualize the effect of the inhibitors on trypsin and chymotrypsin, the values of the
slopes from graphs like those in Figures 9 and 10 from the experiments carried out in a
refrigerator were plotted as a function of inhibitor concentration. The resulting plots can be
seen in Figures 11 and 12
0
0,5
1
1,5
2
2,5
3
0 5 10 15 20 25 30
Are
a (c
m2
)
[trypsin] (μM)
No inhibitor 1
No inhibitor 2
Antipain 20 μM
Leupeptin 20 μM
0
0,5
1
1,5
2
2,5
3
3,5
4
4,5
5
0 5 10 15 20 25 30
Are
a (c
m2
)
[Trypsin] μM
No inhibitor
5µM antipain
10µM antipain
15µM antipain
20µM antipain
14
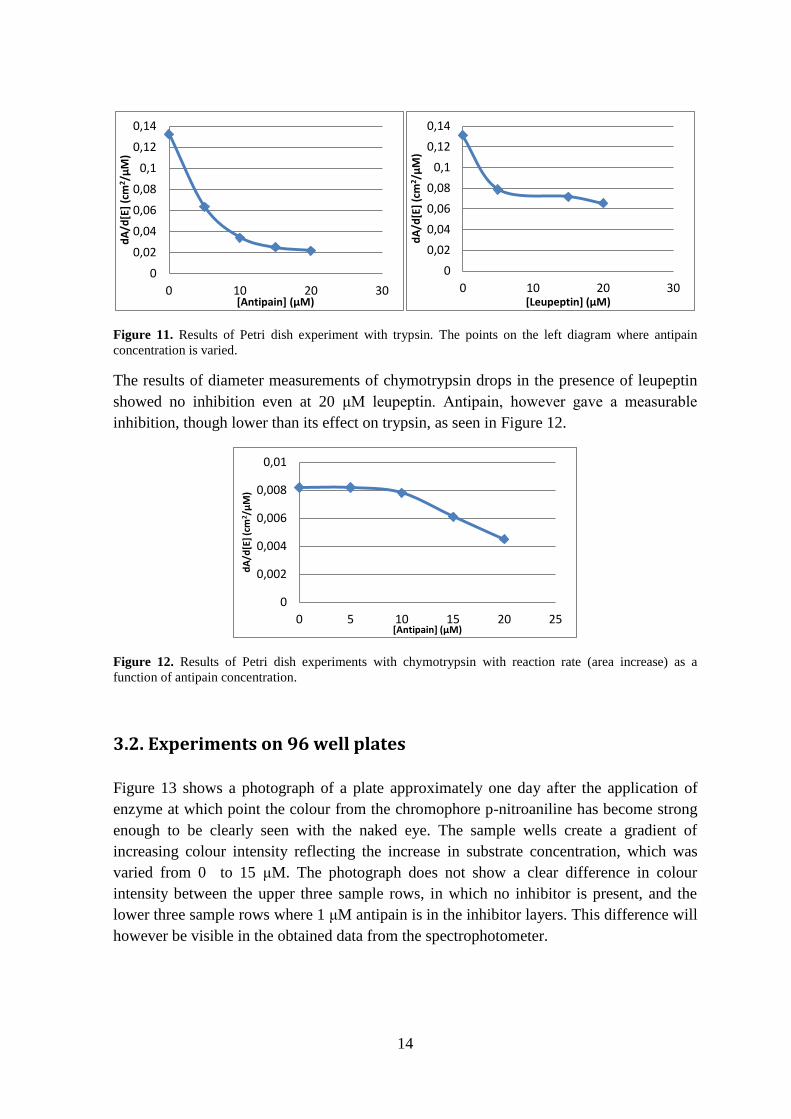
Figure 11. Results of Petri dish experiment with trypsin. The points on the left diagram where antipain
concentration is varied.
The results of diameter measurements of chymotrypsin drops in the presence of leupeptin
showed no inhibition even at 20 μM leupeptin. Antipain, however gave a measurable
inhibition, though lower than its effect on trypsin, as seen in Figure 12.
Figure 12. Results of Petri dish experiments with chymotrypsin with reaction rate (area increase) as a
function of antipain concentration.
3.2. Experiments on 96 well plates
Figure 13 shows a photograph of a plate approximately one day after the application of
enzyme at which point the colour from the chromophore p-nitroaniline has become strong
enough to be clearly seen with the naked eye. The sample wells create a gradient of
increasing colour intensity reflecting the increase in substrate concentration, which was
varied from 0 to 15 μM. The photograph does not show a clear difference in colour
intensity between the upper three sample rows, in which no inhibitor is present, and the
lower three sample rows where 1 μM antipain is in the inhibitor layers. This difference will
however be visible in the obtained data from the spectrophotometer.
0
0,02
0,04
0,06
0,08
0,1
0,12
0,14
0 10 20 30
dA
/d[E
] (c
m2 /μ
M)
[Antipain] (μM)
0
0,02
0,04
0,06
0,08
0,1
0,12
0,14
0 10 20 30
dA
/d[E
] (c
m2 /μ
M)
[Leupeptin] (μM)
0
0,002
0,004
0,006
0,008
0,01
0 5 10 15 20 25
dA
/d[E
] (c
m2 /μ
M)
[Antipain] (μM)

15
Figure 13. A plate testing trypsin activity where substrate concentration was varied without any inhibitor
present (row A to C) and with 1 μM antipain present (row E to G).
Each sample well gave rise to a curve with an unique slope value. Most wells exhibited
interferences in the beginning of the measurements after application of enzyme like those
shown in the data of the left diagram of Figure 14.
Figure 14. Two diagrams of the same data series (triplicate samples containing 2 μM substrate and no
inhibitor) where the irregularities can be seen in the left diagram and the same diagram without outliers can
be seen on the right.
Saturation curves were fitted from the slope values and substrate concentrations, using the
software SimFit for trypsin experiments without inhibitor, with 1 μM antipain and with
1 μM leupeptin (see Figure 15).
0
0,2
0,4
0,6
0,8
1
1,2
1,4
0 50 100 150 200
Ab
sorb
ance
Time (min)
0
0,1
0,2
0,3
0,4
0,5
0,6
0,7
0,8
0 50 100 150 200
Ab
sorb
ance
Time (min)

16
Figure 15: Saturation curves of trypsin acitvity without the presence of an inhibitor (black circles), with 1
μM antipain (blue diamonds) and with 1 μM leupeptin (red inversed triangles).
The rate constants Vmax and Km (or their 'apparent' values for inhibitors) were calculated
and presented in Table 1 along with their standard deviation. The Vmax values are similar
except for the leupeptin saturation curve whose value deviates. The relative standard
deviation (RSD), which is a measure of how large the standard deviation is, relative to the
measure value, of the leupeptin curve is notable and shows that the apparent Km value
varies within quite a large interval, approximately ±26% implying that the measured value
may be dubious.
Table 1. A table of Vmax and Km values of the saturation curves in Figure 15. Standard error and
relative standard deviation (RSD) is also presented.
Value (μM/min) Std. Error (μM/min) RSD (%)
No
Inhibitor Vmax 1.21 0.08 6.8
Antipain Vmax, app 1.38 0.15 10.8
Leupeptin Vmax, app 0.74 0.11 14.7

17
Value (mM) Std. Error (mM) RSD (%)
No
Inhibitor Km 5.2 0.7 13.9
Antipain Km, app 10.5 1.9 18.5
Leupeptin Km, app 13.9 3.6 25.8
The initial rate values from trypsin experiments where inhibitor concentration was varied
were plotted against inhibitor concentration in SimFit to yield the curves shown in Figures
16 and 17.
Figure 16. An inhibition curve with reaction rate in A.u/min as a function of leupeptin concentration in μM.
(μM)

18
Figure 17. An inhibition curve with reaction rate in A.u/min as a function of antipain concentration in μM.
The plots in Figures 16 and 17 produced IC50 values for the two inhibitors. These values
are shown in Table 2.
Table 2. Measured IC50 values and their standard deviation.
Value (mM) Std. Error (mM) RSD (%)
Antipain IC50 2.5 0.3 10.6
Leupeptin IC50 2.7 0.2 8.8
Using Equation (4) the Ki values of the inhibitors on trypsin can be calculated. The values
used for the calculation and the resulting values can be seen in Table 3.
Table 3. The values used to calculate the Ki values and the result.
Concentration
Ki (μM)
[E] 5.0 μM
[S] 2.5 mM
Km 5.2 mM
IC50antipain 2.5 μM
1.7
IC50leupeptin 2.7 μM
1.8
(μM)

19
4. Discussion
4.1. Kinetic experiments on Petri dishes
As mentioned before the Petri dish experiments done in room temperature, showed a more
rapid increase in drop size than those performed at the lower temperature, meaning that the
activity of the enzyme was significantly lowered by the cold temperature. Both trypsin and
chymotrypsin are enzymes endogenous to humans with a normal working temperature of
around 37 degrees Celsius, consequently it is not unreasonable to assume that their activity
will be affected by a drastic change in temperature. It can however be noted that chemical
reactions are slower at lower temperatures in general.
The slopes of the curves hint to how much inhibitor is present in the gelatine gel. The
lower the slope value, the higher the concentration of inhibitor in the gel. This can be seen
in Figure 10 where the value of the slopes of the curves rapidly decreases with inhibitor
concentration. This fast decrease in slope value, and by extension, enzyme activity
demonstrates the strong inhibitory effect of antipain on trypsin. In Figure 9 the difference
in inhibitory effect between leupeptin and antipain is visible. Leupeptin appear to be a
weaker inhibitor of trypsin than antipain which is shown as having a steeper slope in
Figure 9 than that of antipain.
A distinct difference in effect of antipain and leupeptin can be seen in Figure 10 where
antipain quickly reduces the activity of trypsin whereas leupeptin did not seem reach the
same level of inhibition. The reaction rate of trypsin seem to be reduced significantly at
inhibitor levels as low as 1 to 5 μM. The optimum concentration at which the most
inhibition is achieved appears to be around 5 μM for both leupeptin and antipain.
To summarize the results of the tests of trypsin Table 4 presents the values of the reaction
rates and the ratio between the uninhibited case and the inhibited cases. The tests in room
temperature are ambiguous. It can be expected that the activity of the enzyme is higher in
room temperature than at a lower temperature, as shown by their quick growth in Figure 8.
The reaction rate values for 20 μM antipain are similar at both temperatures, with the rate
at room temperature being only slightly higher as can be expected. The reaction rate of
trypsin in room temperature on the plate containing leupeptin seems to be lower than that
of the corresponding plate at the lower temperature. The slope value of trypsin on a plain
gelatine plate is also significantly lower making the ratio values larger than anticipated.
The cause of this anomaly is not known. A mistake in mixing the enzyme solutions is
possible. The slight difference in gel layer thickness should not affect the results to this
extent. This mystery would require a reproduction of the experiments done in room
temperature and corresponding tests at the lower temperature to be solved.

20
Table 4. A list of results from the experiments with trypsin. Ratio reflecting the degree of inhibition
compared to the uninhibited case shows the values in percent (%).
[Antipain] (μM)
[Leupeptin] (μM)
Refrigerator
temp.
Reaction rate
(cm2/μM)
Ratio
(%)
Reaction rate
(cm2/μM)
Ratio (%)
0 0.132 100 0 0.131 100
5 0.063 48 5 0.079 60
10 0.034 26 15 0.072 55
15 0.025 19 20 0.066 50
20 0.022 16
Room temp. 0 0.068 100 0 0.068 100
20 0.028 42 20 0.044 65
Chymotrypsin is only very weakly inhibited by leupeptin; a concentration of 20 μM was
not enough to induce any measureable inhibition. Antipain as an inhibitor did, however
have an effect as seen in Figure 12 where, though not as strongly as its effect on trypsin,
chymotrypsin is inhibited at levels of 10 μM and above. Though trypsin and chymotrypsin
are similar in their structures, they are not identical. Their active sites have affinity for
different parts of a polypeptide chain and cleave it at the C-terminals of different types of
amino acids.
From a pedagogical point of view these experiments turned out to be an easy way visualize
the activity of an enzyme in, or not within, the presence of an enzyme inhibitor without the
use of any complicated equipment or materials.
4.3. Kinetic experiments on 96 well plates
Despite possible effects of diffusion an irregularities when preparing the gel layers in the
results produced by the gel models in the wells were surprisingly successful.
The precise origin of disturbances like those shown in the left diagram in Figure 14 is hard
to discern as they were not consistent in their shape. They may be the result of refractive
light from the enzyme drops, since they are hemisphere shaped before they diffuse into the
wells, or irregularities in the gel layers. The initial parts of the curves were not entirely
linear, probably due to diffusion. With time the curves evened out as seen in the right
diagram in Figure 14.
The three saturation curves in Figure 15 show how the reaction rates differ under the effect
of an inhibitor. In the diagram of saturation curves for trypsin the difference in Km values
is very apparent. Their difference can be confirmed by looking at the calculated Km and

21
Vmax values in Table 4. As anticipated, the Km value of the uninhibited saturation curve is
the lowest and i.e. reached Vmax at the lowest substrate concentration of the three curves.
The Vmax values of the antipain affected and the uninhibited saturation curves are very
similar though the Km value of the antipain curve is much higher than that of the other. In
the introduction it was mentioned that a competitive inhibitor is signified by its higher Km
value buy same Vmax when compared to a saturation curve without inhibitor. We can
thereby now confirm that antipain is a competitive inhibitor of trypsin. The saturation
curve of leupeptin does, however not appear as expected. Its Km is even higher than that of
the antipain saturation curve pointing to the conclusion that leupeptin should be a stronger
inhibitor of trypsin than antipain. Its Vmax value deviates slightly from those of the other
two saturation curves, remember that leupeptin, too, is a competitive inhibitor meaning that
its Vmax should be around the same.
The inhibition curves in Figures 16 and 17 for leupeptin and antipain are very similar in
shape hinting that their inhibitory effect of trypsin is very similar. The Vmax and Km values
of leupeptin that was measured from the saturation curve in Figure 15 that suggested that
leupeptin is a much stronger inhibitor than antipain, contradict these results. The
experiments on the Petri dishes, however also showed that leupeptin didn't inhibit trypsin
to the same degree at all (though, it should be remembered that these experiments were
done in refrigerator temperature, which might have affected the results). The IC50 values in
Table 2, though similar do not solve these contradictions as they are based data of the
curves in Figures 16 and 17. These ambiguous results describing the inhibitory effect of
leupeptin proves how easily small differences between kinetic measurements or the
unknown behaviour of one parameter e.g. temperature can give rise to very different
results. Regardless, at least the data describing the activity of antipain seem to be
consistent
This series of simulation experiments have proved that testing a new model, however
simple its design may be takes a lot of time and effort, requiring many repeated
measurements. These experiments were only the foundation but with time a model system
can be improved, perhaps even discarded and replaced, before reaching the model perfect
for the system. It can be concluded that these models require much more testing before
they can be applied to reality.

22
5. References
5.1. Literature
Atkins P., De Paula J. Atkins physical chemistry. 9th ed. Oxford University press. Oxford.
2010. p. 491
Brown A. J. Enzyme action. J. Chem. Soc. 1902. 81: 373–386.
Burrell M. M. Enzymes of molecular biology vol. 16. Humana Press. Totowa, NJ: 1993. p.
277-281
Copeland R.A. Enzymes. A practical introduction to structure, mechanism, and data
analysis. Second Ed. Wiley-VCH, New York. 2000
Dranca I., Vyazovkin S. Thermal stability of gelatin gels: Effect of preparation conditions
on the activation energy barrier to melting. 2009. Polymer 50 : 4859–4867
Kurinov I.V., Harrison R.W. Two crystal structures of the leupeptin-trypsin complex.
Protein Science. 1996. 5: 752-758.
Neitzel, J. J. Enzyme catalysis: the serine proteases. 2010. Nature Education 3: 21
Nelson D.L., Cox M.M. Lehninger principles of biochemistry. 6th ed. W.H Freeman and
Company. United States of America. 2013. p. 127-130
Suda H. Antipain, a new protease inhibitor isolated from Actinomycetes. 1972. The journal
of antibiotics. 25 : 263-266
Walsh, K. A. Trypsinogens and trypsins of various species. 1970. Meth. Enzymol. 19:
41-63
5.2. Pictures
Figure 1. Ålander C. 2015. A 'general' saturation curve
Figure 2. Ålander C. 2015. A cartoon of competitive inhibition
Figure 3. Ålander C. 2015. Antipain and leupeptin. Drawn using ChemSketch.
Figure 4. Ålander C. 2015. A schematic picture of Petri dish experiments
Figure 5. Ålander C. 2015. A schematic picture of a gel model
Figure 6. Ålander C. 2015 The Microtiter plate - a photograph
Figure 7. Degradation of BAPA. Drawn using ChemSketch.
Figure 8. Ålander C. 2015. Photographs of Petri dish results
Figure 13. Ålander C. 2015 A photograph sample well model results