kinetics of adsorption and redox processes on iron
TRANSCRIPT
EQL Report NO.;j;j
KINETICS OF ADSORPTION AND REDOX
PROCESSES ON IRON AND MANGANESE OXIDES:
REACTIONS OF AS (III) AND SE(IV) AT
GOETHITE AND BIRNESSITE SURFACES
by
Michael James Scott
EQL REPORT NO. 33
May 1991
ENVIRONMENTAL ENGINEERING LIBRARY (138-78)
136 w. M. KECI<' LAt30RATORY Calitorr.ia tnstitute of Technology
Pasad'>na. California 91125 U.S A
Environmental Quality Laboratory CALIFORNIA INSTITUTE OF TECHNOLOGY
Pasadena, California 91125
KINETICS OF ADSORPTION AND REDOX PROCESSES ON IRON AND
MANGANESE OXIDES: REACTIONS OF AS(III) AND SE(IV) AT
GOETHITE AND BIRNESSITE SURFACES
by
Michael James Scott
Principal Investigators:
James J. Morgan Norman H. Brooks
EQL Report No. 33
May 1991
Supported by:
United States Department of the Interior Geological Survey, through the
University of California Water Resources Center
Andrew W. Mellon Foundation
William and Flora Hewlett Foundation
Environmental Quality Laboratory California Institute of Technology
Pasadena, California 91125
ENViRONIV1ENTAl ENGINEERING UBHARY (138-78)
136 W. M. KeCl< LABORATORV California Institute of Technology Pasadena, California 91125 U.S)!,
ii
Disclaimer
"The research on which this report is based was financed in part by the United States Department of the Interior, Geological Survey, through the State Water Resources Research Institute, Project No. 14-08-0001-G 1550, and by the University of California Water Resources Center, Project UCAL-WRC-W-22605-89(02). Contents of this publication do not necessarily reflect the views and policies of the U.S. Department of the Interior, nor does mention of trade names or commercial products constitute their endorsement or recommendation for use by the U.S. Government."
IC 1991 Michael James Scott All rights reserved
111
ACKNOWLEDGMENTS
I wish to thank my advisor Professor James Morgan for his latitude in his
guidance and support. Without it, this typical Scott project would have never
matured into a typical Morgan thesis. I would also like to thank Professors Michael
Hoffmann, Norman Brooks, Clair Patterson, and George Rossman for their scientific
encouragement and for serving on my examination committees. Also, I would like
to acknowledge Dr. Alan Stone of Johns Hopkins University for providing the
computer code framework which made the kinetic modeling possible.
I would like to gratefully acknowledge the financial support of the initial
portion of my research by the Andrew W. Mellon Foundation. Also, the research on
which this report is based was financed in part by the United States Department of
the Interior, Geological Survey, through the State Water Resources Research
Institute, Project No. 14-08-0001-G1550, and by the University of California Water
Resources Center, Project UCAL-WRC-W-22605-89(03). Contents of this
publication do not necessarily reflect the views and poiicies of the U.S. Department
of Interior, nor does mention of trade names or commercial products constitute their
endorsement or recommendation for used by the U.S. Government.
I would like to thank the friendly and generous staff of Keck Laboratories-
Elaine Granger, Joan Matthews, Sandy Brooks, and Fran Matzen--and the
Environmental Engineering librarians--Rayma Harrison and Gunilla Hastrup--for
always making time for me and, especially, for Caitlin. I would like to express my
IV
appreciation for all their assistance and friendship in the classroom, laboratory, ball
fields, and, in general, my life from 1985 to 1990 to Yigal Erel, Kevin Power, Nick
Bauer, Julie Kern, David Wheeler, Bruce Daube, Jr., Jeff Collett, Bill Munger, Bob
Arnold, Theresa Fall, Tom DiChristina, the Waterbugs, David James, Claudius
Kormann, Kit Yin Ng, Liyuan Liang, Mark Schlautman, Sandy Elliot, Howell Yee,
Natasha Kotronarou, Stan Grant, Jeremy Semrau, Annmarie Eldering, and Russell
Mau.
Finally, I would like to acknowledge the encouragement and support given to
me by family and friends, without which I could have never reached this point in my
life. And most of all, I would like to simply say to Wendy, "Thanks for your love--it
makes everything worthwhile."
This report was submitted to the California Institute of Technology in May 1991 as
a thesis in partial fulfillment of the requirements for the degree of Doctor of
Philosophy in Environmental Engineering Science.
v
ABSTRACT
Selenium and arsenic are naturally-occurring, non-metallic elements with
complex chemical and biological behavior in aquatic environments. In this study,
rates and mechanisms of adsorption, desorption, and electron transfer reactions
involving selenium and arsenic oxyanions and two naturally occurring metal oxides,
goethite (a-FeOOH) and birnessite (c5-Mn~), have been investigated. Adsorption
of Se(IV), As (III) , and As(V) on goethite and of Se(IV) and As(III) on birnessite
occurs within a time scale of minutes. Equilibrium is achieved within a few hours.
Adsorption behavior can be described accurately with a surface complexation model.
Goethite does not oxidize Se(IV) or As(III) in solution at pH 4 and above.
However, redox products (Mn(II), Se(VJ), As(V» are observed when Se(IV) or
As(III) is added to aqueous suspensions of birnessite. In the arsenite-birnessite
system, the rate of As(V) appearance in solution is equal to the rate of As(III)
disappearance from solution while the appearance of Mn(II) in solution is slightly
slower. In the selenite-birnessite system, uptake of Se(IV) occurs in minutes. Extent
of adsorption decreases with increasing pH. The appearance of measurable Se(VI)
occurs slowly (time scale of days to weeks) and is a function of adsorbed selenite.
This indicates that the rate of selenite oxidation by birnessite is limited by the rate
of electron transfer. Rate data from both arsenic and selenium redox systems are
successfully described by a reversible four-step kinetic model that accounts for
adsorption of the reduced species, electron-transfer, release of the oxidized species,
and release of reduced Mn(H).
VI
The data suggest that iron oxides provide an adsorptive sink for mobile Se and
As oxyanions, while manganese oxides playa major role in accelerating the oxidation
of Se(IV) and As (Ill). Results on the rates of key chemical processes affecting
selenium and arsenic should be useful in understanding complex geochemical cycles
and in finding solutions to problems in pollutant transport and accumulation in
water-sediment systems.
Vll
TABLE OF CONTENTS
ACKNOWLEDGMENTS III
ABSTRACf ................................................. v
TABLE OF CONTENTS. . . . . . . . . . . . . . . . . . . . . . . . . . . . . . . . . . . . . .. Vll
LIST OF TABLES ......................................... " Xlll
LIST OF FIGURES . . . . . . . . . . . . . . . . . . . . . . . . . . . . . . . . . . . . . . . . . .. xv
1. INTRODUCTION AND MOTIVATION ......................... 1
1.1 Introduction ......................................... 1
1.2 Arsenic and Selenium in the Environment .................. , 2
1.2.1 Geologic Sources of Arsenic and Selenium . . . . . . . . . . .. 2
1.2.2 Accumulation in Aquatic Systems . . . . . . . . . . . . . . . . . .. 2
1.2.3 Environmental Chemistry . . . . . . . . . . . . . . . . . . . . . . . .. 4
1.3 Motivation of this Study ................................ 6
1.4 Scope and Objectives .................................. 7
2. GEOCHEMISTRY OF ARSENIC AND SELENIUM SySTEMS ...... 11
2.1 Introduction ........................................ 11
2.2 Aqueous Chemistry of Arsenic .......................... 12
2.2.1 General Chemistry . . . . . . . . . . . . . . . . . . . . . . . . . . . .. 12
2.2.2 Arsenate .................................... 12
2.2.3 Arsenite . . . . . . . . . . . . . . . . . . . . . . . . . . . . . . . . . . . .. 16
YI11
2.2.4 Elemental Arsenic and Arsenide . . . . . . . . . . . . . . . . . .. 16
2.2.5 Organic Arsenic .............................. 16
2.3 Aqueous Chemistry of Selenium ......................... 17
2.3.1 General Chemistry. . . . . . . . . . . . . . . . . . . . . . . . . . . .. 17
2.3.2 Selenate . . . . . . . . . . . . . . . . . . . . . . . . . . . . . . . . . . . .. 20
2.3.3 Selenite ..................................... 20
2.3.4 Elemental Selenium and Selenide ................. , 22
2.3.5 Organic Selenium ............................. , 22
2.4 Arsenic Anion Adsorption on Metal Oxide Surfaces . . . . . . . . . .. 22
2.4.1 Previous Studies .............................. , 22
2.4.2 pH Dependency . . . . . . . . . . . . . . . . . . . . . . . . . . . . . .. 23
2.4.3 Effect of Redox Status ............... . . . . . . . . . .. 24
2.5 Selenium Anion Adsorption on Metal Oxide Surfaces ......... 26
2.5.1 Previous Studies . . . . . . . . . . . . . . . . . . . . . . . . . . . . . .. 26
2.5.2 Selenite Adsorption ............................ 26
2.5.3 Selenate Adsorption . . . . . . . . . . . . . . . . . . . . . . . . . . .. 27
2.6 Surface Chemical Modeling . . . . . . . . . . . . . . . . . . . . . . . . . . . .. 27
2.7 Heterogeneous Oxidation and Reduction. . . . . . . . . . . . . . . . . .. 32
2.8 Reductive Dissolution of Metal Oxides .................... 34
2.9 Summary .......................................... 39
3. PREPARATION AND CHARACfERIZATION OF METAL
OXIDES. . . . . . . . . . . . . . . . . . . . . . . . . . . . . . . . . . . . . . . . . . . . .. 41
IX
3.1 General Remarks ................................... 41
3.2 Particle Preparation .................................. 41
3.3 Mineral Identification ................................. 42
3.3.1 Methods..................................... 42
3.3.2 Goethite .................................... 43
3.3.3 Birnessite .................................. " 43
3.4 Surface Properties. . . . . . . . . . . . . . . . . . . . . . . . . . . . . . . . . . .. 45
3.4.1 Specific Surface Area . . . . . . . . . . . . . . . . . . . . . . . . . .. 45
3.4.2 Surface Exchange Capacity. . . . . . . . . . . . . . . . . . . . . .. 49
3.4.3 Surface Complexation Model ..................... 51
3.4.4 Acid-Base Titration ............................ 54
3.4.4.1 Method .............................. 54
3.4.4.2 Goethite .. . . . . . . . . . . . . . . . . . . . . . . . . . . .. 54
3.4.4.3 Birnessite ............................. 56
3.4.5 Determination of Birnessite pf\pc ................ " 58
3.4.6 Oxide Surface Speciation ........................ 60
3.4.7 Summary of Surface Characterization .............. 60
4. ANION ADSORPTION KINETICS AND EQUILIBRIA WITH
GOETHITE AND BIRNESSITE. . . . . . . . . . . . . . . . . . . . . . . . . . .. 67
4.1 Introduction ........................................ 67
4.2 Experimental Methods ................................ 68
4.2.1 Adsorption Kinetic Experiments .................. , 68
x
4.2.2 Adsorption Equilibrium Experiments ............... 70
4.2.3 Chemical Analysis ............................. 71
4.2.3.1 As(III): Differential Pulse Polarography ...... 71
4.2.3.2 As(V): Molybdate Blue Spectrophotometry . . .. 72
4.2.3.3 Mn(II): DCP Emission Spectrometry ........ 73
4.2.3.4 Se(IV) and Se(VI): Ion Chromatography ..... 73
4.3 Kinetics of Adsorption ................................ 73
4.3.1 Initial Rate of Adsorption ....................... 73
4.3.2 Effect of pH on Mn(II) Adsorption on Birnessite ...... 77
4.3.3 Sensitivity of the Kinetic Model ................... 78
4.4 Arsenite Adsorption on Goethite. . . . . . . . . . . . . . . . . . . . . . . .. 90
4.4.1 Effect of pH and Temperature on Kinetics. . . . . . . . . .. 90
4.4.2 Equilibrium .................................. 94
4.5 Summary ......................................... 100
5. REACTIONS AT OXIDE SURFACES: OXIDATION OF AS(III) AND
SE(IV) WITH BIRNESSITE . . . . . . . . . . . . . . . . . . . . . . . . . . . . . 103
5.1 Introduction ...................................... 103
5.2 Experimental Methods .............................. 103
5.3 Dynamics of As(III) and Birnessite ...................... 106
5.3.1 Behavior of As(III), As(V), and Mn(II) in Solution. . .. 106
5.3.2 Kinetic Mechanisms and Expressions .............. 111
5.3.3 Effect of Initial As(III) Concentration. . . . . . . . . . . . .. 120
Xl
5.3.4 Effect of pH . . . . . . . . . . . . . . . . . . . . . . . . . . . . . . . .. 124
5.3.5 Effect of Temperature ......................... 128
5.3.6 Effect of Dissolved Oxygen ..................... , 134
5.3.7 Effect of Bivalent Cations ctf+ and Mrr+ .......... 135
5.3.8 Summary of the Dynamics of As(III)and Birnessite ... , 140
5.4 Dynamics of Se(IV) and Birnessite ...................... 142
5.4.1 Behavior of Se(IV), Se(VJ), and Mn(II) ............ 142
5.4.2 Kinetic Mechanisms and Expressions .............. 147
5.4.3 Effect of Initial Concentrations of Se(IV) and o-Mn02 • 155
5.4.4 Effect of pH . . . . . . . . . . . . . . . . . . . . . . . . . . . . . . . .. 157
5.4.5 Effect of Temperature ......................... 163
5.4.6 Summary of the Dynamics of Se(1V) and Birnessite ... 168
6. IMPLICATIONS FOR GEOCHEMICAL SYSTEMS .............. 171
6.1 Introduction ........................................ 171
6.2 Practical Use of Kinetic Data ........................... 171
6.3 Rates of Redox Transformations in Aquatic Systems ......... 174
6.3.1 As(III) Oxidation. . . . . . . . . . . . . . . . . . . . . . . . . . . .. 174
6.3.2 Inorganic Redox Reactions with Manganese
Dioxides .. . . . . . . . . . . . . . . . . . . . . . . . . . . . . . . . .. 177
6.4 Role of Metal Oxides in the Geochemical Distribution of Arsenic
and Selenium .................................... 178
6.5 Redox Potentials of Metal Oxide Surfaces ................ 179
xii
6.6 Thoughts for Future Research ......................... , 182
REFERENCES ............................................ , 185
APPENDIX A: EXPERIMENTAL DATA........................ 195
APPENDIX B: KINETIC MODEL COMPUTER CODES ............ 213
APPENDIX C: MODELING PROCEDURES AND SENSITIVITY ..... 219
C.1 Modeling Procedure ..... 0 0 . 0 0 0 0 0 0 0 00. 0 0 0 0 0 0 0 0 0 0 0 0 0 0 . 0 219
C.2 Modeling Rules of Thumb 0 0 . 0 0 0 0 0 0 0 0 0 0 . 0 ..... 0 . 0 0 .... , 220
C.3 Sensitivity of the Adsorption-Redox Kinetic Model .......... 223
Co3.1 Sensitivity Analysis of Experiment MnAsl 0 .... 0 . 0 .. 223
C.302 Sensitivity Analysis of Experiment MnSel 232
Xlll
LIST OF TABLES
Table
1.1: As and Se Concentrations in Various Materials and Aqueous Systems .. , 3
2.1: Energetic Data for Inorganic Arsenic Reactions .................. 13
2.2: Energetic Data for Inorganic Selenium Reactions ................. 18
2.3: Surface Complexation Constants . . . . . . . . . . . . . . . . . . . . . . . . . . . . .. 31
3.1: Comparison of X-Ray Diffraction Peaks ........................ 45
3.2: Literature Values of Goethite and Birnessite Surface Properties ...... 50
3.3: Surface Properties of Metal Oxides. . . . . . . . . . . . . . . . . . . . . . . . . . .. 65
4.1: DPP Instrument Settings for As(III) Analysis .................... 72
4.2: Reaction Conditions of Adsorption Kinetics Experiments ........... 75
4.3: Adsorption-Desorption Rate Constants ....................... " 78
4.4: pH and Temperature Dependence of As(III) Adsorption-Desorption on Goethite .............................................. 91
4.5: Thermodynamic Functions for the Adsorption of As(lIl) on Goethite Derived from the Equilibrium Constants at pH 4 and 6 ........... 96
4.6: Comparison of Surface Complexation Constants for Several Species on Goethite ............................................. 101
5.1: Reaction Conditions of Arsenite-Birnessite Experiments ........... 107
5.2: Rate Constants and Characteristic Times for the Reaction between As(III) and Mn(IV) at pH 4,0.1 M NaCI04 , and 25°C .......... 117
5.3: Reported Values of the Average Mn Oxidation State and of x in MnOx for Synthetic Manganese Oxides ........................... , 125
5.4: Influence of pH on As(III)-Mn(IV) Reaction Rate Constants 128
XlV
5.5: Influence of Temperature on As(III)-Mn(IV) Reaction Rate Constants and Equilibrium Constants ............................... , 131
5.6: Reaction Conditions of Selenite-Birnessite Experiments ........... 143
5.7: Rate Constants and Characteristic Times for the Reaction between Se(IV) and Mn(IV) at pH 4, 1 mM NaCI04 , and 25°C ......... .. 152
5.8: Variation of Reaction Rate Constants and Equilibrium Constants with Initial Concentrations of Reactants. ......................... 158
5.9: Influence of pH on the Se(IV)-Mn(IV) Reaction Rate Constants and Equilibrium Constants. . . . . . . . . . . . . . . . . . . . . . . . . . . . . . . . . . .. 162
5.10: Thermodynamic Driving Forces for the Se(IV)-Mn(IV) Redox Reaction at Various pH Values ................................... 163
5.11: Influence of Temperature on the Se(IV)-Mn(IV) Reaction Rate Constants and Equilibrium Constants . . . . . . . . . . . . . . . . . . . . . . .. 167
6.1: Comparison of As(III) Oxidation Half-Lives .................... 176
6.2: Inorganic Redox Reactions with Manganese Dioxides ............. 178
6.3: Calculated Overall Equilibrium Constants and Redox Potentials for the As(III)-Mn(IV) Reaction and Redox Potentials for the > Mn(IV)-Mn(II) Redox Couple ................................... 181
C.1: Average and Maximum Differences between Experimental and Modeled Arsenite-Birnessite Reaction Results ........................ 224
C.2: Average and Maximum Differences between Experimental and Modeled Selenite-Birnessite Reaction Results . . . . . . . . . . . . . . . . . . . . . . . .. 225
xv
LIST OF FIGURES
Figure Page
2.1: pE-pH diagram for the system As-~O for conditions 25°C and Asr = 10 J.l.M. ............................................... 14
2.2: a) As(V) and b) As(III) speciation as a function of pH. . . . . . . . . . . . .. 15
2.3: pE-pH diagram for the system Se-~O for conditions 25°C and Ser = 10 J.l.M. ............................................... 19
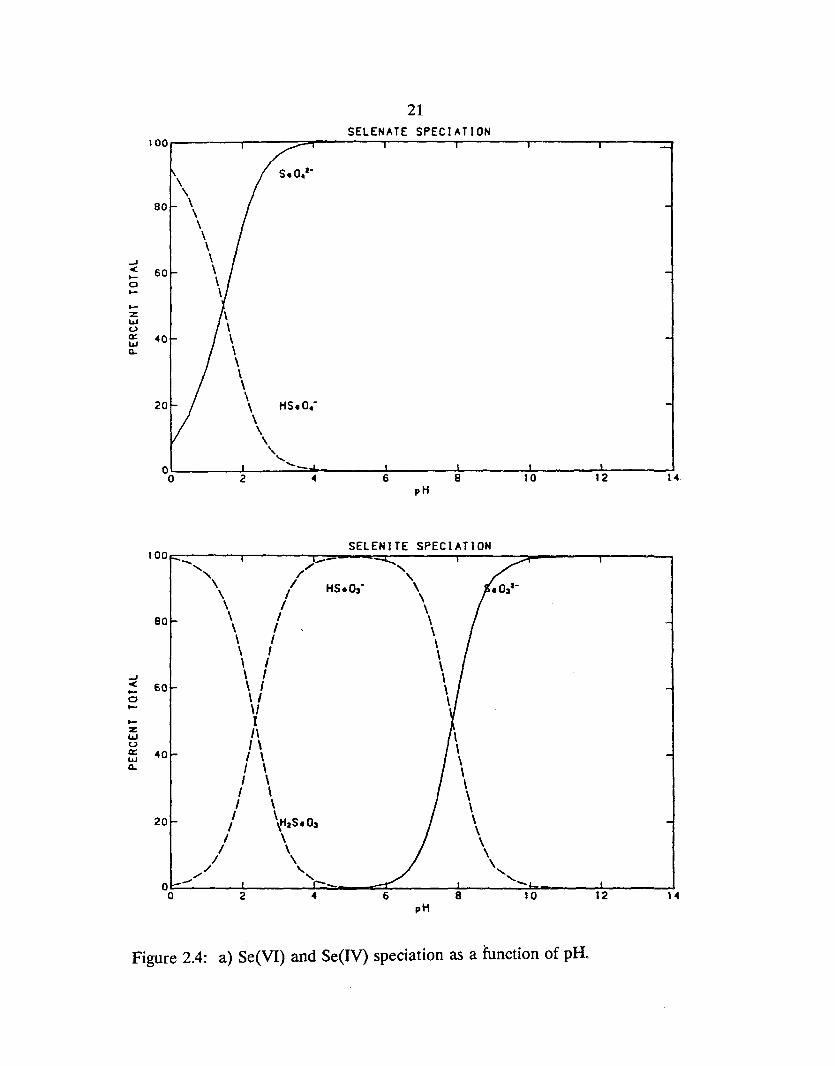
2.4: a) Se(VI) and b) Se(IV) speciation as a function of pH. ............ 21
2.5: pE-pH diagram for the system As-~O at 25°C and Asr = 10 J.l.M and the pE-pH relationships for the relative Mn and Fe species for conditions Mfir = Fer = 1 mM. ............................ 35
2.6: pE-pH diagram for the system Se-~O at 25°C and Ser = 10 J.l.M and the pE-pH relationships for the relative Mn and Fe species for conditions Mfir = Fer = 1 mM. ............................ 36
3.1: X-ray diffractogram of iron oxide particle preparation. The peaks correspond to those of goethite (a-FeOOR). ................... 44
3.2: Scanning electron micrograph of goethite particles. .............. .. 46
3.3: a) X-ray diffractogram of manganese oxide particles and b) matching reference diffractogram of synthetic birnessite. ............... . .. 47
3.4: Scanning electron micrograph of birnessite particles. . . . . . . . . . . . . . .. 48
3.5: Alkalimetric titration of 1.2 giL suspension of goethite particles at 25°C and 0.1 M ionic strength. .................................. 55
3.6: Acidimetric titration of 0.8 giL suspension of birnessite particles at 25 °C and 0.1 M ionic strength. . . . . . . . . . . . . . . . . . . . . . . . . . . . . . . .. 57
3.7: A plot of the second apparent surface acidity constant as a function of surface charge (jo' Extrapolation to zero surface charge gives the intrinsic acidity constant. .................................. 59
3.8: The transmittance of birnessite suspensions as a function of time at several pR values and an ionic strength of 0.01 M. . . . . . . . . . . . . . .. 61
XVI
3.9: The rate of coagulation and subsidence of a birnessite suspension as a function of pH at an ionic strength of 0.01 and 0.1 M. The maximum rate corresponds to the pf\pc of the oxide. . . . . . . . . . . . . . . . . . . . .. 62
3.10: Surface speciation of goethite from pH 2-11 at an ionic strength of 0.1 M. Calculations made by SURFEQL with diffuse layer model. ..... 63
3.11: Surface speciation of birnessite from pH 2-11 at an ionic strength of 0.1 M. Calculations made by SURFEQL with diffuse layer model. ..... 64
4.1: Observed rates of disappearance from solution of As(III), As(V), Se(IV), and Mn(II) in aqueous suspension of goethite and birnessite at pH 4 and 25 DC. ............................................. 76
4.2: Experimental and kinetic model (lines) results of pH effect on Mn(II) adsorption on birnessite. .................................. 79
4.3: Sensitivity of kinetic model on As(V) adsorption on goethite: a) Effect of varying ~ with constant~. .............................. 81
4.3: Sensitivity of kinetic model on As(V) adsorption on goethite: b) Effect of varying ~ with constant~. .............................. 82
4.3: Sensitivity of kinetic model on As(V) adsorption on goethite: c) Effect of varying ~ and ~ with constant equilibrium constant K1 . . • . • • • • •• 84
4.3: Sensitivity of kinetic model on As(V) adsorption on goethite: d) Effect of varying concentration of reactive surface groups (~ = 8 M-lsec- 1, ~ = 0.004 sec-I). .......................................... 85
4.4: a) Comparison of the two site model with the one site model for the reaction between As(V) and goethite. Rate constants are given in the text. . . . . . . . . . . . . . . . . . . . . . . . . . . . . . . . . . . . . . . . . . . . . . . . . .. 88
4.4: b) Two site kinetic model: dependence of the rate of adsorption of As(V) on type A and type B sites and the overall rate of As(V) adsorption on goethite. ................................... 89
4.5: Kinetic model results of the pH dependence on As(III) adsorption on goethite at 25 DC. Initial conditions are 50 J.LM As(III) and 500 J.LM > FeOHr and the rate constants are listed in Table 4.4. ........... 92
XVll
4.6: Kinetic model results of the temperature dependence on As(III) adsorption on goethite at pH 4. Initial conditions are 50 J,LM As(III) and 500 J,LM > FeOHr and the rate constants are listed in Table 4.4. . 93
4.7: van't Hoff plot of the experimentally-derived equilibrium constants and best-fit lines for As(III) adsorption-desorption at pH 4 and pH 6. The slope of each line is equal to -~I-\/R. ........................ 95
4.8: Equilibrium adsorption isotherms of As(III) on goethite at pH 4 and 5.5. .................................................. 97
4.9: Experimental and SURFEQL diffuse layer model (lines) results of the pH effect of As(III) adsorption equilibrium on goethite. . . . . . . . . . .. 99
5.1: Experimental behavior of aqueous As(I1I), As(V), and Mn(II) following As(III) addition to a birnessite suspension. Table 5.1 lists the reaction conditions (MnAs 1). .................................... 108
5.2: The product ratio [Mrr+ (aq)]/[As(V)(aq)] increases as the reaction progresses and approaches 1, the value predicted from the reaction stoIchIometry. ......................................... 110
5.3: A) Schematic representation of the cross section of the surface layer of a Mn(IV) oxide and B) the resulting surface structure following arsenite adsorption, C) electron transfer, D) arsenate release and E) Mrr+ release. ......................................... 113
5.4: Comparison of predicted kinetic behavior (lines) with experimental data for aqueous As(III), As(V), and Mn(II) following As(I1I) addition to a birnessite particle suspension (experiment MnAsl). .... . . . . . . .. 116
5.5: The model predicted species profiles of the As(III)-Mn(IV) reaction at pH 4 and 25°C. Initial conditions and rate constants are listed in Table 5.2. ............................................ 118
5.6: Experimental and modeled (lines) behavior of aqueous As(III), As(V), and Mn(II) in a As(III)-Mn(IV) reaction. Initial concentration of As(III) is A) 199.7 J,LM and B) 398.4 J,LM. Other reaction conditions are listed in Table 5.1. . . . . . . . . . . . . . . . . . . . . . . . . . . . . . . . . . .. 121
5.7: The product ratio Mn(II)/ As(V) is dependent upon the average Mn oxidation state of the oxide. The observed ratios for MnAs2 and MnAs3 indicate lower oxidation states than expected for birnessite.. 123
xviii
5.8: The influence of the pH of the particle suspension on the aqueous profiles of As(III), As(V), and Mn(II). Reaction conditions are listed in Table 5.1. .......................................... 126
5.9: The effect of temperature on the disappearance of A<;(III)(aq) and the release of As(V)(aq) and Mn(I1)(aq) in a birnessite suspension at pH 4 and 0.1 M NaCI04 ••••••••••••••••••••••••••••••••••• " 129
5.10: van't Hoff plot of the equilibrium constants and linear regression lines for As(III) adsorption-desorption (K1 ) and Mn(lI) release-adsorption (~). The slope of each line is -dI\/R. . . . . . . . . . . . . . . . . . . . . .. 133
5.11: The presence of dissolved oxygen in a birnessite suspension at pH 4 and 25°C has no effect on the rate of As(V) release to solution. ... 136
5.12: The addition of bivalent cations decrease the rate of As(V) release with Mrf+ (aq) having a greater effect than ci'+ (aq). Initial [As(III)] = 100 J.LM. . . . . . . . • • . . . • . . . • • • • • • • • • • • . . . • . . . • . . • . • . . . . . • • •. 138
5.13: The addition of Mrf+ to a birnessite suspension prior to reaction with As(III) results in the release of greater amounts of Mrf+ (aq) during the reaction. .......................................... 139
5.14: Experimental behavior of aqueous and adsorbed Se species following Se(IV) addition to a birnessite suspension. Table 5.6 lists the reaction conditions (MnSe1). . . . . . . . . . . . . . . . . . . . . . . . . . . . . . . . . . . . .. 145
5.15 A) Schematic of the cross section of the surface layer of a Mn(IV) oxide and B) the resulting surface structure following selenite adsorption, C) electron transfer, D) selenate release, and E) Mrf+ release. .............................................. 148
5.16: Comparison of predicted kinetic behavior (lines) with experimental data for aqueous and adsorbed Se species following SeelY) addition to a birnessite particle suspension (experiment MnSel). . . . . . . . . . . . . .. 151
5.17: The model predicted species profiles of the Se(IV)-Mn(IV) reaction under the reaction conditions of experiment MnSel. Rate constants are listed in Table 5.7. . . . . . . . . . . . . . . . . . . . . . . . . . . . . . . . . . .. 153
5.18: Profiles of aqueous Se(IV) and Se(VI) in a birnessite suspension under varying initial concentrations of Se(IV) and 6-Mn~. ............ 156
xix
5.19: Effect of pH on the experimental and modeled (lines) profiles of Se(IV)(aq) in a 0.2 giL birnessite suspension at 25°C. Initial concentration of Se(IV) is 101 J..LM. ••••••••••••••••••••••••• 159
5.20: Effect of pH on the experimental and modeled (lines) profiles of Se(VI)(aq) in a 0.2 giL birnessite suspension at 25°C. Initial concentration of Se(IV) is 101 J..LM. ••••••••••••••••••••••••• 160
5.21: Effect of temperature on the profile of Se(IV)(aq) in a 0.2 giL birnessite suspension at pH 4. Initial concentration of Se(IV) is 101 J..LM • ••••••••••••••••••••••••••••••••••••••••••••••• " 164
5.22: Effect of temperature on the profile of Se(VJ)(aq) in a 0.2 giL birnessite suspension at pH 4. Initial concentration of Se(IV) is 101 J..LM. ••••••••••••••••••••••••••••••••••••••••••••••.•• 165
C.1: Comparison of experimental data and predicted model curve of As(llI) from experiment MnAsl. ......................... . . . . . . .. 221
C.2: Effect of kl on the average and maximum differences between experimental and predicted MnAs 1 results. ................... 226
C.3: Effect of k-l on the average and maximum differences between experimental and predicted MnAsl results. · .................. 227
C.4: Effect of varying the values of kl and k.l while maintaining a constant value for Kl on the average and maximum differences between experimental and predicted MnAsl results. · .................. 228
C.5: Effect of ~ on the average and maximum differences between experimental and predicted MnAs 1 results. • ••••••••••••••••• co 230
C.6: Effect of k-2 on the average and maximum differences between experimental and predicted MnAsl results. · .................. 231
C.7: Effect of varying the values of ~ and k_2 while maintaining a constant value for ~ on the average and maximum differences between experimental and predicted MnAsl results. • ............... e ••• 232
C.8: Effect of varying the values of ks and k3 while maintaining a constant value for Ks on the average and maximum differences between experimental and predicted MnAs 1 results. • •••••• eO ........... 233
xx
e.9: Effect of varying the values of k.t and k4 while maintaining a constant value for ~ on the average and maximum differences between experimental and predicted MnAsl results. ................... 234
C.lO: Effect of varying the value of I<z (~ = 1.3 xlo-6sec-1, varying k_:J on the average and maximum differences between experimental and predicted MnSel results. . . . . . . . . . . . . . . . . . . . . . . . . . . . . . . . . . . . . . . . .. 236
e.ll: Effect of varying the values of ~ and k_2 while maintaining a constant value for I<z on the average and maximum differences between experimental and predicted MnSel results. . . . . . . . . . . . . . . . . . . .. 237
e.12: Effect of varying the values of ks and k_s while maintaining a constant value for I<s on the average and maximum differences between experimental and predicted MnSel results. . . . . . . . . . . . . . . . . . . .. 238
e.13: Effect of varying the value of ~ (k4 = 3.3 M-lgec-l, varying k.t) on the average and maximum differences between experimental and predicted MnSe 1 results. . . . . . . . . . . . . . . . . . . . . . . . . . . . . . . . . . . . . . . . .. 239
e.14: Effect of varying the values of ~ and k_4 while maintaining a constant value for ~ on the average and maximum differences between experimental and predicted MnSel results. . . . . . . . . . . . . . . . . . . .. 240
1
Chapter 1
INTRODUCTION AND MOTIVATION
1.1 Introduction
Arsenic and selenium are naturally occurring non-metallic elements with
complex biological and chemical properties. Selenium is an essential trace nutrient
for most organisms and both elements are generally considered toxic at elevated
levels. A common feature is that both elements exist in multiple oxidation states in
aquatic systems. Aqueous arsenic species exist in the oxidation states As(III) and
As(V), while aqueous selenium species are found in the oxidation states Se(lV) and
Se(VI). Adsorption onto metal oxides and oxidation of reduced forms are two major
reactions that control the fates of arsenic and selenium.
The focus of this dissertation is to demonstrate experimentally that redox
active metal oxide surfaces play an active role in determining the environmental
behavior of arsenic and selenium. The rates and mechanisms of adsorption and
oxidation-reduction were studied to determine the dependence on pH, temperature,
dissolved and major particulate minerals, and oxidation-reduction status. The
experimental results prove useful in defining time scales for the adsorption of both
oxidation states of each element and the oxidation of reduced arsenic and selenium
in aquatic environments. The time scales of conversion of harmful elements are of
fundamental importance in the prediction of exposure levels for human populations
through ground and surface waters and for ecosystem biota through sediments and
overlying waters.
2
1.2 Arsenic and Selenium in the Environment
1.2.1 Geologic Sources of Arsenic and Selenium
The original source of arsenic and selenium in the environment is the molten
magma beneath the earth's crust. The elements reach the surface primarily by
vulcanism as metallic arsenides and selenides associated with igneous mineral
deposits (Rosenfeld and Beath, 1964). Table 1.1 gives selected arsenic and selenium
concentrations in various materials and aqueous systems.
Arsenic is ubiquitous in the environment as a result of weathering of igneous
rocks and geothermal activity. Sedimentary rocks generally contain higher arsenic
concentrations than igneous and metamorphic rocks. High arsenic concentrations
(50-48,000 ~g/l) in groundwater in the western United States have been associated
with gold, pyrite, and uranium ore mining areas, geothermal areas and basin-fill
deposits (Welch et al., 1988).
In most cases selenium is highly dispersed and in low concentrations in
geologic deposits. The exceptions are rocks of igneous and volcanic origin and
sedimentary rocks, where geological and biological forces have increased selenium
concentration. Sediments of the Cretaceous period are particularly rich in selenium.
High levels of selenium in shales, carbonaceous material in sandstones and phosphate
rocks may be largely the result of bioconcentration (Bainbridge et al., 1988).
1.2.2 Accumulation in Aquatic Systems
Widespread accumulation of arsenic and selenium has occurred most recently
due to the use of arsenical pesticides, mining and processing of sulfide and uranium
3
Table 1.1: As and Se concentrations in various materials and aqueous systems
I Material I As (mg/kg)l I Se(mg/kgt I Earth's crust 1.5-2.0 0.05
Granite 1.5 0.01-0.05
Limestone 1.7 0.03-0.10
Sandstone 2.0 < 0.05
Shales 14.5 0.6
Phosphate Rocks 22.6 1-300
Soils <0.1-97 ---Seleniferous --- 1-80
Coal 13 0.1-4.3
Aqueous Systems As (~g/lf Se (~g/lt
Rivers 0.2-264 0.46-10.65
Mississippi --- 0.14
Amazon --- 0.21
Colorado --- <10 (pH 6.1-6.9) 10-400 (pH 7.8-8.2)
Lake Michigan 0.5-2.4 0.8-10
Seawater 0.15-6.0 0.09
Kesterson Area 2 (max 82) 11 (max 42,000) Groundwatef
EPA Water Quality Standards
Drinking Water 50 10
Irrigation Water 100 20
Hazardous Waste 5000 1000 1) NRC, 1977; (2) McNeal & Bahstnen, 1989; (3) Welch et aI., 1989;
(4) Presser and Barnes, 1984; (1 ~g/l As = 13.4 nM; 1 ~g/l Se = 12.7 nM)
4
ores, burning of fossil fuels, and irrigation and drainage of newly developed arid and
semi-acid agricultural lands. Contamination of Kesterson National Wildlife Reservoir
(NWR) in the San Joaquin Valley, California is perhaps the best known example of
a selenium accumulation problem in an ecosystem. Other areas identified as having
irrigation-induced contamination problems (selenium and other inorganic salts)
include the Salton Sea and Tulare Lake in California; Stillwater NWR, Nevada;
Middle Green River, Utah; and Kendrick Water Reclamation Project, Wyoming
(NRC, 1989). Well-known examples of arsenic contamination are the ecosystems of
Puget Sound, Washington (Crecelius et al., 1975), the Menominee River, Wisconsin
(Anderson et al., 1978), Whitewood Creek, South Dakota (Fuller and Davis, 1989),
and the creeks around the Blackbird Mining District, Idaho (Mok and Wai, 1989).
The serious problems at Kesterson NWR resulted from a combination of
natural geological factors and human influences. The soils of the western portion of
the San Joaquin Valley, derived from Cretaceous marine sediments, have naturally
high selenium content. Because this is an area with low rainfall, the soils do not
release substantial amounts of selenium into the environment until they are irrigated.
Irrigation releases soluble forms of selenium into the soil water which then enters
surface waters and shallow groundwaters through cropland drainage systems,
irrigation tailwaters, and deep percolation into groundwater.
1.2.3 Environmental Chemistty
The complex chemistries of arsenic and selenium in the environment are a
result of their multiple oxidation states and active surface adsorption properties.
5
Arsenic and selenium are both stable as inorganic oxyanions (e.g., arsenite, arsenate,
selenite, selenate) in oxidized states and as anthropogenic or microbially-produced
organic compounds in reduced states. Arsenic as arsenate is similar to phosphate in
its acid-base properties and affinity for mineral surfaces, but arsenic differs from
phosphorus because of its multiple inorganic oxidation states. Selenium is analogous
to sulfur in chemical properties, but there are notable differences. Even though
selenic acid is a strong acid and selenate has the same adsorption characteristics as
sulfate, selenate is a stronger oxidant than sulfate, though not necessarily a kinetically
fast oxidant. Also, Se(IV) is much less volatile and can exist at greater redox
potentials than S(IV). Selenide (Se( -II» exists in reducing environments as a foul
smelling, poisonous gas, hydrogen selenide (~Se) and as metal selenides. Although
it is a weak acid, aqueous ~Se is a much stronger acid and is more poisonous than
hydrogen sulfide (~S). Metal selenides tend to be found in metal sulfide ores (e.g.,
Fe, Cu, Pb), and tend to be very insoluble (Elrashidi et al., 1987). A qualitative
guide in studies of the environmental behavior of arsenic and selenium is the
application of analogous environmental chemistries of phosphorus and sulfur.
In most natural systems, arsenic and selenium are primarily found in oxidized
forms as inorganic oxyanions. The oxyanions exhibit various degrees of affinity for
metal oxide surfaces in heterogeneous systems. The limited studies of such systems
suggest that selenite, arsenite, and arsenate are all strongly bonded to metal oxide
surfaces whereas selenate is only weakly adsorbed. The extent of adsorption of all
6
of the oxyanions is greatly affected by solution variables (Le., pH, temperature,
competing anions).
1.3 Motivation of this Study
Thermodynamic calculations dictate that, at equilibrium, arsenate and selenate
are the stable forms of arsenic and selenium in oxic systems, while in anoxic systems,
arsenite and selenite are the stable forms. For example, in oxic seawater (pH 8.3,
pE 12.5), the arsenate/arsenite concentration ratio should be approximately 1<y5.
However, several studies have reported arsenate/arsenite concentration ratios of only
15 to 250 in oxic seawater (Andreae, 1979; Peterson and Carpenter, 1983). Similar
observations have been reported about the selenate/selenite concentration ratio.
These results suggest that the reduction-oxidation process between oxidation states
is not at equilibrium, and thus, is kinetically inhibited. Recent investigations have
reported that most natural aquatic redox systems are far from equilibrium and that
energetically-favored redox reactions are slow processes (Lindberg and Runnells,
1984). Lack of chemical eqUilibrium in most redox systems makes a kinetic
description necessary. Information concerning the rate of As amd Se redox reactions
in solution or on surfaces is lacking and specific rate constants are generally
unknown. The rates of reactions need to be established in order to properly assess
the importance of redox reactions on the distribution of arsenic and selenium in
aquatic systems.
Although dissolved oxygen is a primary oxidant in natural systems, studies
have shown that as a result of slow oxidation kinetics some reduced species of redox-
7
active elements are stable in oxic homogeneous solutIOns. However, the rate of
reaction between dissolved oxygen and reduced species increases dramatically in
heterogeneous systems (Wehrli, 1990; Eary and Schramke, 1990). A growing number
of fundamental kinetic studies of redox systems exist that suggest oxide minerals play
an important role, either as catalysts or as direct reactants. The systems that have
been examined consist of reduced species of first-row transition metals (V, Cr, Mn,
Fe, Co, and Cu) with hydrous oxides of iron, manganese, aluminum and titanium
(Wehrli, 1987; Eary and Rai, 1987; Sung and Morgan, 1980, 1981; Crowther et aI.,
1983; Davies and Morgan, 1989).
1.4 Scope and Objectives
The geochemical behavior of arsenic and selenium in aquatic systems is poorly
understood. The purpose of this research is to study the dynamics of arsenic and
selenium interactions in water-sediment systems. There are several key questions
that this dissertation attempts to address:
(i) What chemical reactions control the geochemical distribution of the two
oxidation states of both arsenic and selenium in aquatic systems and how does the
distribution vary as the chemical and physical conditions of the system vary?
(ii) In what types of environmental systems is the transport of arsenic and
selenium favored?
(iii) What is the role of metal oxides in aquatic systems that contain arsenic
and selenium?
(iv) Assuming that, as a result of their energetics and naturally occurring
8
concentrations, the probable oxidants of As(III) and Se(IV) in groundwater systems
are dissolved oxygen, manganese oxides, and iron oxides (the latter for As(III) only),
what are the rates of reaction among the oxidants and reduced species? Which
oxidants are kinetically fast and provide the dominant pathway for oxidation of
As(III) and Se(IV)?
(v) How is the rate of reaction affected by changes in pH, temperature, ionic
strength, and concentration of reactants?
(vi) What are the essential steps in the mechanism of oxidation by metal
oxides, and which of these steps is rate-determining?, and
(vii) If As(III) and Se(IV) can be oxidized by metal oxides, are the rates and
mechanisms comparable for both elements, and how do the mechanisms for these
nonmetallic elements compare with the heterogeneous oxidation rates and
mechanisms of transitional metals such as iron, chromium, manganese, and
vanadium?
The environmental chemistries of arsenic and selenium are reviewed in
Chapter 2, with an emphasis on the thermodynamic properties and adsorption
behavior of the elements in aqueous systems. Chapter 3 is concerned with the
preparation of iron and manganese oxides and characterization of the surface
properties of each mineral. The rates and mechanisms of adsorption and desorption
of arsenic and selenium oxyanions on iron and manganese oxides are presented and
discussed in Chapter 4. Chapter 5 examines the processes involved in the oxidation
of As(III) and Se(IV) by manganese oxides. Factors influencing rates of
9
transformation, including pH, temperature, dissolved oxygen, and the concentration
of competitive bivalent cations are examined. Chapter 6 concludes with a discussion
of the implications of the experimental results for geochemical systems. Topics
discussed are the rates of redox transformations in aquatic systems, the role of metal
oxides in the environmental distribution of arsenic and selenium, and the
determination of redox potentials of metal oxide surfaces.

10
11
Chapter 2
GEOCHEMISTRY OF ARSENIC AND SELENIUM SYSTEMS
2.1 Introduction
The solution of environmental problems associated with arsenic and selenium
in aquatic systems requires an understanding of the complex chemistry of these
elements. The principles and processes controlling the geochemical distribution of
arsenic and selenium are reviewed to address the key questions proposed by this
work. The questions to be answered are: (i) what chemical reactions control the
geochemical distribution of the two oxidation states of both arsenic and selenium in
aquatic systems, (ii) how does the distribution vary as the chemical and physical
conditions of the system vary, and (iii) what is the role of metal oxides in aquatic
systems that contain arsenic and selenium. In order to answer these questions, a
summary of previous investigations has been undertaken. The topics to be discussed
in this chapter include the aqueous properties of the various oxidation states based
on thermodynamic relationships, adsorption of arsenic and selenium oxyanions on
mineral surfaces, surface complexation modeling, and homogeneous and
heterogeneous redox transformations between oxidation states. Also, the reductive
dissolution of redox-active metal oxides is reviewed to provide a mechanistic
framework that describes reactions between the reduced species and a metal oxide
surface.
2.2 Aqueous Chemistry of Arsenic
2.2.1 General Chemistry
12
Arsenic belongs to group VB (N, P, As, Sb, Bi) of the periodic table, is a non
metallic element with the elemental electronic structure [ArJ3cf°4~4J1, and is known
to be toxic to plants and animals. There are four oxidation states in which arsenic
forms inorganic compounds: V, III, 0, -III. The acid-base equilibria and redox half
reactions between the oxidation states of inorganic arsenic are summarized in Table
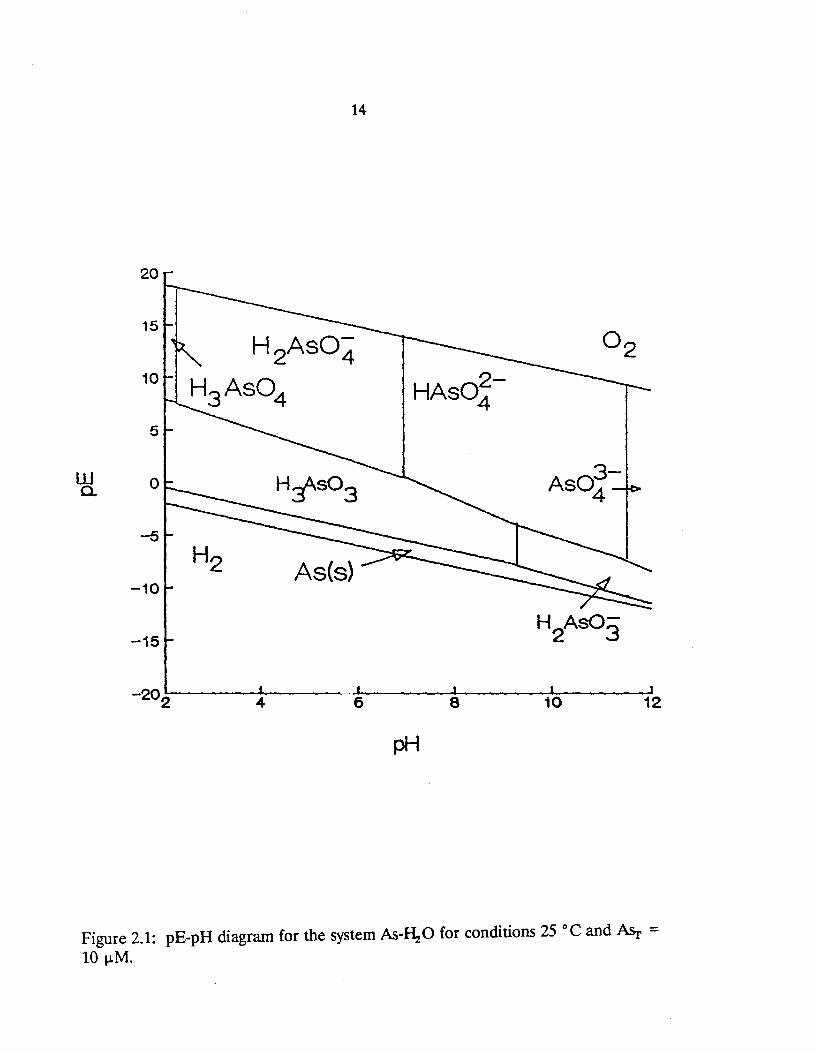
2.1. Figure 2.1 is a pE-pH diagram for inorganic arsenic.
There are several literature reviews of the natural aquatic chemistry of
arsenic. Ferguson and Gavis (1972) provide a general review of the inorganic arsenic
cycle in natural waters. Cherry et al. (1979) review the thermodynamics of inorganic
arsenic as a basis for the use of arsenic as an indicator of the redox status in
groundwater. The National Research Council (1977) thoroughly examines the
chemistry, distribution, and biological effects of the element on plants, animals, and
man. Cullen and Reimer (1989) review the interactions of arsenic compounds with
individual organisms ranging from Methanobacteria to man and also discuss the flux
of arsenic compounds between the atmosphere, aquatic systems, soils, sediments, and
fossil fuels.
2.2.2 Arsenate
Arsenic in the V oxidation state forms the triprotic acid of the oxyanion
arsenate, As043
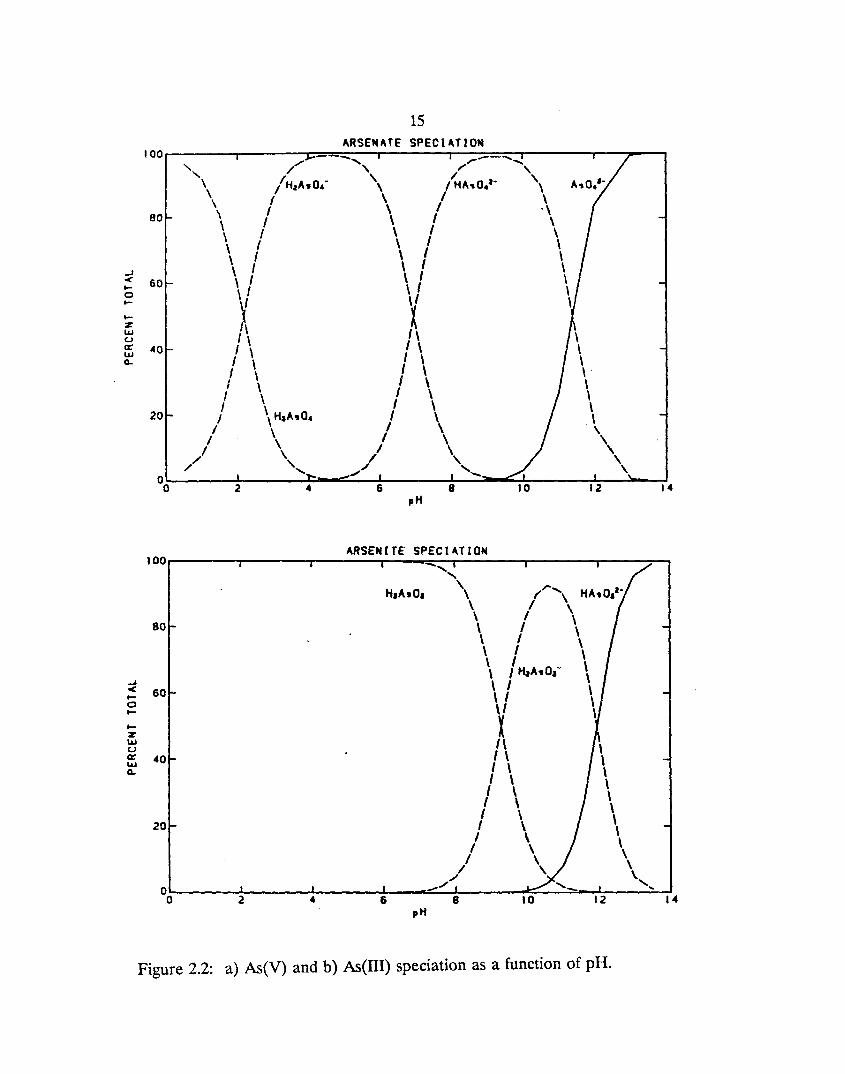
-, which has similar acid-base chemistry to phosphate. Figure 2.2a
shows the relative importance of each arsenate species as a function of pH. For
13
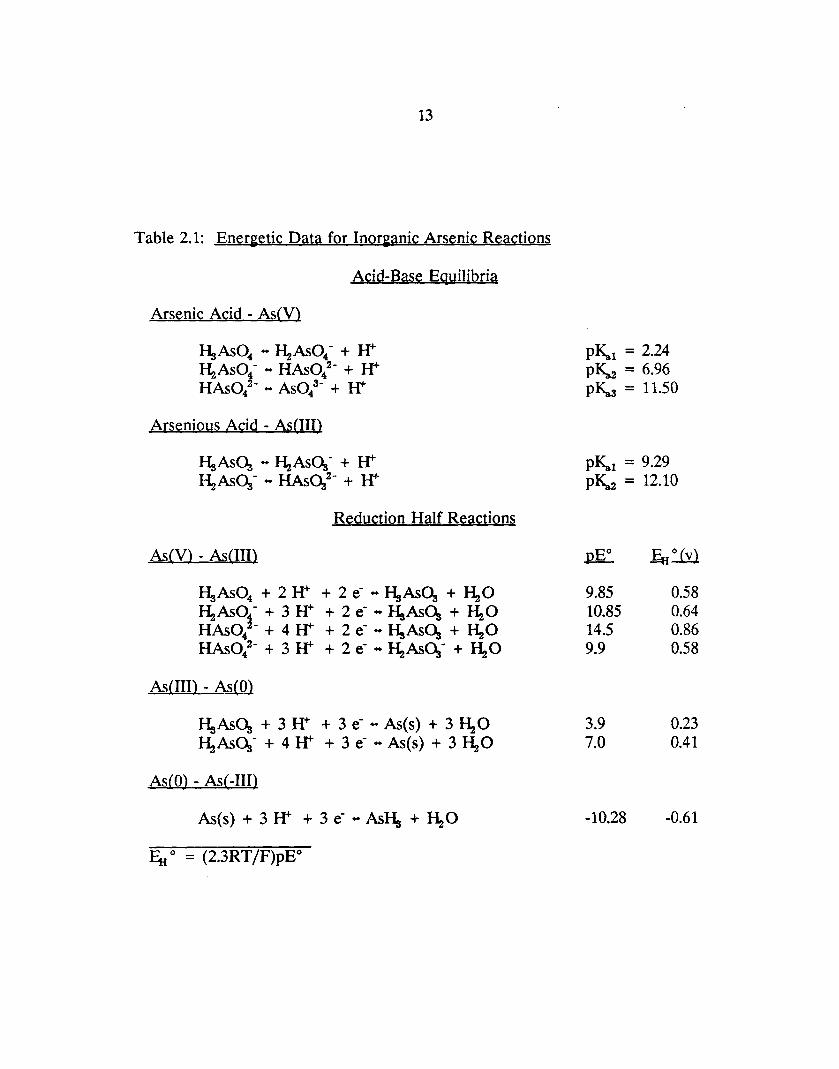
Table 2.1: Energetic Data for Inorganic Arsenic Reactions
Acid-Base Equilibria
Arsenic Acid - As(V)
J-IsAs04 .. ~As04- + H+ I-\As04- .. HAs04
2- + H+ HAsOl- .. As04
3- + H+
Arsenious Acid - As(III)
J-IsAsC\ .. ~AsC\- + H+ ~AsC\- .. HAsC\2- + W
Reduction Half Reactions
As(V) - As(III)
HsAs04 + 2 H+ + 2 e- .. J-IsAsC\ + ~O ~As04- + 3 W + 2 e- .. HsAsC\ + ~O HAs04
2- + 4 W + 2 e- .. HsAsC\ + ~O HAsOl- + 3 H+ + 2 e- .. ~AsC\- + ~O
As(III) - As(O)
HsAsC\ + 3 H+ + 3 e- .. As(s) + 3 ~O ~AsC\- + 4 H+ + 3 e- .. As(s) + 3 ~O
As(O) - As(-III)
As(s) + 3 H+ + 3 e- .. AsRs + ~O
&i ° = (2.3RT /F)pEO
PKal = 2.24 PKa2 = 6.96 p~ = 11.50
PKal = 9.29 p~ = 12.10
pEa
9.85 10.85 14.5 9.9
3.9 7.0
-10.28
~~
0.58 0.64 0.86 0.58
0.23 0.41
-0.61
14
20
H 2As04 O2
H3 As04 HASO~-5
w 0 a.
-5
H2 -10
-15 H
2As0
3
-20 2 4 6 8 10 12
pH
Figure 2.1: pE-pH diagram for the system As-I\O for conditions 25°C and Asr =
10 \-lM.
15
laar-____ -,r-____ ~~~A,R~S-E,"-AT~E~S~P~EC~I~A~T~I=O"~~,-------,---~ __ _ .. /' ---', ---...... '" / , "., ...... I " / ' \ I H~A.O.- \ I HA"O.'· "
\ ( \ I , \ ( \ I ., \ I \ I , , I \ , \ " I \ I \ , I \ " \
80
...J \ I \ , \ , I \ I ' \ I \ 1 \
: 60 o .... .... Z IJJ U
~ ~ \ I \ I \ \
~ 40 I \ I \ \ I \ I \ \ I \ I \ \' I \ I \ \ I \ I \ I \ I \ \ I \ H~A"O. I \ \ I, I \ \ I \ I \ \
I \ 1\\ // , / \ \
~)------:2~-----'~4F-~~~~/~6~----~~'~-~~~------~--'~--~ 12 14
Q.
20
pH
loar-______ r-____ -,r-__ A~R~S~E~Nrl~TE~S~P~E~C;l~~T~l~a~N--~~------~--__ __ -, ,
...J
\ \ /' ...... '\ HA.O.'· \ I \ , I \ \ I \ \' \ \ I \ \ I HzA.O.l' \
80
: 60 \ I \ \ I \ o ....
.... Z IJJ U
\I \ ~ 1\ \
~ 40 1 \ \ 1 \ \ Q.
I \ \ I \ \ I \ \ I \ \ I \ \ I \ \
I \ , I \ \
// \ \ ... ~)------:~----~~----~~--~-~/~------~~~~~--~'~'~ '4
20
pH
Figure 2.2: a) As(V) and b) As(III) speciation as a function of pH.
16
natural waters with a pH less than neutral, HaAsO" - is the predominant species, while
in slightly alkaline natural waters HAsO,,2- is the major species. Iron forms the only
stable complex with arsenate; ferric arsenate (PK.o = 20.24) is stable in solution at
pH less than 2.3 and pE above + 12.5 (&! above +0.74 volts) (Ferguson and Gavis,
1972).
2.2.3 Arsenite
Arsenic in the III oxidation state forms the triprotic acid of the oxyanion
arsenite, As0a3-. The acid-base equilibria (Table 2.1) indicate that arsenious acid
HsAsOa, is a weak acid. Figure 2.2b illustrates that HsAsOa is the predominant
arsenite species in most natural water. HaAsOs- is the major species only in natural
systems of pH greater than 9.3.
2.2.4 Elemental Arsenic and Arsenide
Elemental arsenic is very insoluble and is found in certain types of mineral
deposits. Arsenic in the -III oxidation state is present as gaseous arsine, AsHs, and
is only stable at extremely low pE values. Under conditions where sulfide is present
and stable, arsenic complexes with sulfur. AsS(s) (realgar) and ~~(s) (orpiment)
are found as stable solids. The aqueous species HAs~ is the major species at low
pH in the presence of sulfide and As~-(aq) predominates at pH above 5.5.
2.2.5 Organic Arsenic
Arsenic also forms a variety of organic compounds, primarily through
biological methylation. The chemistry of these compounds is reviewed by Lemmo
et al. (1983). The most commonly found organic arsenic species are methylarsonic
17
acid (CHsAsC\~), dimethylarsinic acid «CHs>aAsOOH), and trimethylarsine oxide
«CHs1AsO). These compounds are derived from arsenic acid by replacing one or
more of the hydroxyl groups with a methyl group.
2.3 Aqueous Chemistry of Selenium
2.3.1 General Chemistry
Selenium belongs to group VIB (0, S, Se, Te, Po) of the periodic table and
is a non-metallic element with the elemental structure [Ar]3cf°4~4p4. Selenium has
strong chemical similarities to sulfur, with oxidation states VI, IV, 0, and -II being
important in natural systems under different redox conditions. The acid-base
equilibria and the redox relationships of selenium are summarized in Table 2.2.
Figure 2.3 is a pE-pH diagram for inorganic selenium.
The environmental distribution and chemistry of selenium have received
extensive review since the discovery of the selenium contamination at the Kesterson
National Wildlife Refuge. Previously, the only reviews were those of Rosenfeld and
Beath (1964), which provided a general review of the geological distribution of
selenium, and the National Research Council (1976), which reviewed the chemistry,
distribution, and biological effects of the element as it pertained to plants, animals
and man. Recently, there has been a plethora of selenium geochemical reviews;
among the most complete reviews are those of the National Research Council (1989),
which uses the Kesterson selenium accumulation for discussion of irrigation-induced
water quality problems in general, and the Soil Science Society of America (Jacobs,
1989), which discusses selenium in the agriculturical environment.
18
Table 2.2: Energetic Data for Inorganic Selenium Reactions
Acid-Base Equilibria
Selenic Acid - Se(VI)
~Se04 .. HSe04- + W HSe04 - .. SeOl- + H+
Selenious Acid - Se(IV)
~Se~ .. HSe~- + H+ HSe~- .. Se~2- + W
Reduction Half Reactions
Se(VI) - Se(lV)
Se042- + 4 H+ + 2 e- .. I\SeC\ + 1\0
SeO/- + 3 H+ + 2 e- .. HSeC\- + ~O Se04
2- + 2 H+ + 2 e- .. SeC\2- + 1\0
Se(IV) - Se(O)
~SeC\ + 4 W + 4 e- .. Se(s) + 3 lIz0 HSeC\- + 5 H+ + 4 e-" Se(s) + 3 1\0 SeC\2- + 6 H+ + 4 e-" Se(s) + 3 ~O
SeeO) - See-II)
Se(s) + 2 H+ + 2 e- .. ~Se
&! 0 = (2.3RT /F)pEO
PKal = 2.4 PKa2 = 7.9
pEO ~~
19.44 1.15 18.24 1.08 14.54 0.86
12.50 13.10 15.08
-6.70
0.74 0.77 0.89
-0.40
19
20
-15
-2o2)-----~4~----~6~------~8------~10~----~12
pH
Figure 2.3: pE-pH diagram for the system Se-I\O for conditions 25°C and Ser = 10 jJ.M.
20
2.3.2 Selenate
Selenium in the VI oxidation state forms the diprotic acid of the oxyanion
selenate, SeOl-, and like sulfate, selenate is the predominant Se(VI) species in
natural systems. Figure 2.4a indicates that selenic acid is a strong acid, much like
sulfuric acid. Selenate exhibits similar solubilities to those of sulfate with the same
metals (Rosenfeld and Beath, 1964) and under natural levels forms no solid with any
metal.
2.3.3 Selenite
Selenium in the IV oxidation state forms the diprotic acid of the oxyanion
selenite, Seo:t. Selenious acid is a weak acid and, as indicated in Figure 2.4b,
biselenite is the major dissolved selenite species between pH 3 and 7.5. Most
selenite salts are less soluble than the corresponding selenates (NRC, 1976). Selenite
forms several salts of low solubility with ferric iron. Chukhlantsev and Tomashevsky
(1957) report that ferric selenite, Fe,(SeOs>S has a solubility product of 2 x 10-31 at
20 C. Williams and Byers (1936) report the formation of a basic ferric selenite,
Fe,(OH)4SeQ, (PK.o = 61.7) in dilute aqueous solutions of ferric chloride and
sodium selenite. However, Geering et al. (1968) and Howard (1977) conclude that
neither salt is responsible for controlling the selenite concentration in natural waters.
The concentration of selenite and ferric iron are far below the amounts expected
from the equilibrium dissociation, at any pH, of either F~(SeOs>S or F~(OH)4SeOs.
Both investigators conclude that the control of selenite by iron is the adsorption onto
ferric hydroxides.
21 SELENATE SPECIATION
100
\ \
80 \ \ \ \ \
~ \ -< 60 \ >-0 \ >- \ >-:z: \ w u \ a:: 040 \ w C1.. \
\ \ \
20 \ , HS.O.-
\ \ \
" "-a '-
0 8 10 12 104 pH
SELENITE SPECIATION 100 -.. --"- ,/ , , / " \ I HS.O~- \
\ I \ \ I \ I
, 80 \
\ I \ \ I \ I \
\ I \
~ \ I \ < 60 \ I \ ... \ 0 \I - \I
\ ... f :z: 1\ w \ u 1\ a::: 040 I \ \ w \ C1.. I \
I \ \
I \ \
I \ \
I \ \
20 I \HaS.O~ \
I \ \
/ \ \ / \ \
/ '- \ ,/ , "--- "-a -..
a 14 pH
Figure 2.4: a) Se(VI) and SeelY) speciation as a function of pH.
22
2.3.4 Elemental Selenium and Selenide
Elemental selenium is extremely insoluble and inert, and is a major sink for
selenium in the aquatic environment. Selenide(Se( -II» exists in reducing
environments as hydrogen selenide (1\ Se), a foul-smelling poisonous gas, and as
metal selenides. When dissolved in water, hydrogen selenide is a weak acid and
easily oxidized to elemental Se. Metal selenides are typically found in metal sulfide
ores (e.g., Fe, Cu, Pb). and tend to be very insoluble.
2.3.5 Organic Selenium
The organic chemistry of selenium is analogous to that of sulfur. Organic
forms of selenium include seleno amino acids and their derivatives, methyl selenides,
methyl selenic esters, methyl selenones, and methyl selenonium ions. The pathways
for the bio-transformation of inorganic Se to the various organic forms and the
interconversion between these different molecular species of selenium are not well
understood (Cooke and Bruland, 1987).
2.4 Arsenic Anion Adsorption on Metal Oxide Surfaces
2.4.1 Previous Studies
One of the main mechanisms affecting the distribution of arsenic in natural
systems is adsorption from the solution phase to sediments. Faust et al. (1987a,b,c)
studied the distribution of arsenic in the bottom sediments and waters of a
contaminated New Jersey watershed. The distribution coefficient, defined as the
ratio of total arsenic in the sediments to the total arsenic of the water column,
ranged from 53 to 22700, indicating that most of the arsenic in the system is bound
23
to the sediments. They observed that organic sediments had substantially higher total
arsenic than sandy sediments but there was a low correlation between arsenic and
TOC (r = 0.42). However, a high correlation was found between arsenic and iron
(r = 0.94) and manganese (r = 0.84) in all sediments.
Previous investigations have studied the adsorption of arsenate and arsenite
on aluminum oxides and hydroxides (Hingston et aI., 1971; Ferguson and Anderson,
1974; Anderson et al., 1976; Malotky and Anderson, 1976; Anderson and Malotky,
1979), iron oxides and hydroxides (Hingston. 1970; Hingston et al., 1971; Ferguson
and Anderson, 1974; Yoshida et al., 1976, 1978; Pierce and Moore, 1980, 1982;
Leckie et aI., 1980; Harrison and Berkheiser, 1982; Lumsdon et al., 1984), kaolinite
and montmorillonite (Frost and Griffin, 1977), activated alumina, bauxite, and carbon
(Gupta and Chen, 1978; Ghosh and Yuan, 1987), sand columns (Gulens et al., 1979),
river sediments (Holm et aI., 1979) and manganese oxides and hydroxides (Oscarson
et aI., 1983a,b; Thanabalasingam and Pickering, 1986).
2.4.2 pH Dependen~
Oxyanions of arsenic are strongly adsorbed to most mineral surfaces but the
degree of adsorption is highly dependent on pH. Arsenate adsorption on goethite,
gibbsite, amorphous aluminum hydroxide, and activated carbon exhibited a maximum
in the pH range 3 to 5 followed by a gradual decline with increasing pH (Hingston,
1970; Hingston et aI., 1971; Anderson et aI., 1976; Gupta and Chen, 1978). Arsenite
adsorption on mineral surfaces exhibits a different pH dependence. Frost and Griffin
(1977) found As(I1I) adsorption on clays to increase with increasing pH. On
24
activated alumina and bauxite, Gupta and Chen (1978) observed slight variations in
arsenite adsorption over the pH range of 4 to 9 but adsorption decreased markedly
above pH 9. Ghosh and Yuan (1987) noticed a maximum adsorption peak on
alumina between pH 7 and 8 for varying As(III) concentrations. Pierce and Moore
(1980) also observed a peak of arsenite adsorption on amorphous iron hydroxide at
pH 7 for low initial concentrations of arsenite (0.667-13.3 JlM), but for higher initial
arsenite concentrations (33-667 ~M), the amount of arsenite taken up increased with
decreasing pH. The adsorption of arsenite on various manganese dioxides at pH 7
was studied by Oscarson et al. (1983b) and affinity for the anion by the oxides was:
cryptomelane > birnessite > > pyrolusite.
2.4.3 Effect of Redox Status
In addition to being dependent on pH and the type of mineral surface,
adsorption of arsenic species is also greatly influenced by the redox status of the
system. Faust et al. (1987a,b) found in laboratory experiments using organic and
sandy lake sediments under aerobic conditions that the order of species occurrence
in the sediment phase was: As(V) > As(III) > methylarsonic acid (MAA) >
dimethylarsinic acid (DMAA). In the aqueous phase, the order was As(V) > As(III)
with no MAA or DMAA present. Under anaerobic conditions, the order of species
occurrence in the sediment phase and in the aqueous phase was: As(III) > As(V)
> MAA, DMAA. Under aerobic conditions, the total arsenic distribution
coefficients for organic sediments were a magnitude greater than under anaerobic
conditions. The observations from the field and laboratory suggest that arsenic is
25
largely bound by iron and manganese oxides that are present in aerobic, but not
anaerobic, sediments.
The importance of the redox environment on arsenic mobility has also been
investigated by Gulens et al. (1979). As(III) and As(V) were eluted through sand
columns with waters of different redox characteristics. The elution behavior of
As(III) was significantly different from that of As(V). In an oxidizing environment
(pH 5.4, EH = 580 m V), As(lII) was detected in the column eluent 5-6 times sooner
than As(V), and the amount of As(III) eluted (about 60% of loading) was about 8
times larger than that of As(V). In a neutral environment (pH 6.9, EH = 140 m V),
the relative amounts of both species eluted were unchanged. As(V) moved through
the column more rapidly than in an oxidizing environment but it was still retarded
with respect to As(III). In a reducing environment (pH 8.3, EH = 75 m V), the
mobility of As(V) was accelerated to that of As(III) and both species were also
eluted almost quantitatively (about 100% for As(III) and 80% for As(V». From
these observations alone, it was not possible to elucidate whether pH or the redox
environment controls the mobility. Strong retention of As(V) in the oxidizing
environment can be attributed to its adsorption to iron oxide coatings on the sand
particles. However, the increase in mobility of As(V) in more reducing environments
may be due to the increase in pH of the eluting water or to the reduction in the
column of Fe(III) to Fe(II) and, perhaps, As(V) to As(III).
26
2.5 Selenium Anion Adsorption on Metal Oxide Surfaces
2.5.1 Previous Studies
Adsorption of selenium has not been as extensively studied as that of arsenic.
The adsorption of selenite has been studied on goethite (Hingston et al., 1968, 1972;
Goldberg, 1985; Balistrieri and Chao, 1987; Hayes et al., 1987), amorphous iron
oxyhydroxide (Leckie et al., 1980), gibbsite (Hingston et al., 1972), hydrous alumina
(Rajan, 1979), and alluvial soils (Neal et aI., 1987). Selenate adsorption has only
been studied on an amorphous iron oxyhydroxide (Davis and Leckie, 1980; Leckie
et aI., 1980) and goethite (Balistrieri and Chao, 1987; Hayes et al., 1987). There are
no literature reports of selenite or selenate adsorption on manganese oxides.
2.5.2 Selenite Adsorption
The adsorption behavior of selenite is similar to that of arsenate. Hingston
et al. (1968) found the maximum adsorption of selenite on goethite at low pH and
as pH increased, adsorption decreased. Similar results were found for all of the
mineral surfaces that have been studied. Balistrieri and Chao (1987) examined the
influence of additional anions on selenite adsorption. It was found that the
competition depends on the relative affinity of the anions for the surface and the
relative concentrations of the anions. For a given anion concentration ratio, the
competition sequence with selenite is phosphate > silicate ~ citrate > molybdate >
bicarbonate/carbonate > oxalate. A phosphate to selenite concentration ratio
greater than 10 is necessary before selenite adsorption is affected; however, for the
other anions, the concentration ratio must be greater than 100 to affect the selenite
27
adsorption. Some anions, fluoride and sulfate, do not affect the adsorption at all,
even at concentration ratios of 1(1. Neal et aI. (1987) looked at the uptake of Se(IV)
on alluvial soils from the San Joaquin Valley (CA). A pH dependence similar to that
of hydrous metal oxides was found and adsorption of selenite could be correlated
with the amounts of solubilized Al, Fe, and Mn in the soils.
2.5.3 Selenate Adsorption
Adsorption of selenate on iron oxides is considerably different from that of
selenite. In the range of most natural waters (pH 6-8) there is little or no adsorption
of selenate, whereas selenite is completely adsorbed. As the pH decreases, selenate
begins to adsorb, and, although there are no results that indicate this, selenate
probably is only completely adsorbed at pH < 4. The percentage of selenate and
sulfate adsorbed on an amorphous iron oxide as a function of pH is essentially the
same (Davis and Leckie, 1980). Also, sulfate effectively competes with selenate
adsorption. Systems of selenate with no sulfate partition in the same manner as
equivalent mixed systems of selenate and sulfate.
2.6 Surface Chemical Modelin~
Adsorption of the various anions of Se(IV), Se(VJ), As(III), and As(V) is
interpretable in terms of mechanisms of either inner-sphere or outer-sphere
coordination to metal-ion centers in oxide structures. Specific adsorption of anions
occurs as the result of inner-sphere complexation. Specific adsorption of anions
involves ligand exchange reactions in which singly coordinated surface hydroxyl ions
are replaced by the anions that bind directly to the central metal ions on the surface.
28
Adsorption of anions lowers the pH of the isoelectric point (P~ep) of the adsorbent.
Pierce and Moore (1980) demonstrate that the P~ep of amorphous iron oxides (am
Fe(OH}g) is lowered by arsenite adsorption. Lowering of the P~ep has also been
shown for arsenate on alumina (Ghosh and Yuan, 1987) and amorphous aluminum
hydroxide (Anderson et aI., 1976), and for selenite on goethite and gibbsite (Hingston
et aI., 1972). Rajan (1979) demonstrated that the adsorption of selenite was a ligand
exchange reaction. As more selenite was adsorbed by hydrous alumina, more
hydroxyl ions were released, and at maximum adsorption, a 1:1 stoichiometry existed.
Hayes et al. (1987) report that the adsorption of selenite on goethite is
unaffected by changes in ionic strength while the adsorption of selenate on goethite
is greatly reduced by increasing ionic strength. Respective ionic strength effects
suggest that selenite is a strongly bonded ion that forms an inner-sphere coordination
complex with the oxide surface hydroxyl sites and that selenate is a weakly bonded
ion that forms an outer-sphere, ion-pair complex that retains the primary hydration
sphere upon adsorption. Hayes et al. also performed in-situ extended x-ray
absorption fine structure (EXAFS) measurements of adsorbed selenate and selenite
ions at the goethite-water interface. The method provided direct structural
information that confirmed selenite forms an inner-sphere complex whereas selenate
adsorbs as an ion-pair, outer-sphere complex.
Infrared spectroscopy has been used to show the bonding habit of arsenate
and selenate on freshly prepared hydrous iron oxides (Harrison and Berkheiser,
1982) and arsenate on goethite (Lumsdon et aI., 1984). Harrison and Berkheiser
29
(1982) report that both arsenate and selenate coordinate directly with surface iron
atoms and form bidentate bridging complexes by replacement of protonated and
unprotonated hydroxyls. Lumsdon et al. (1984) confirmed that arsenate forms a
bidentate bridging complex with surface iron atoms and replaces two singly
coordinated surface hydroxyl groups by ligand exchange.
The ligand exchange reactions of anions at reactive sites on metal oxide
surfaces can be described by surface complexation reactions (Stumm and Morgan,
1981; Dzombak and Morel, 1987). The acid-base behavior of the surface functional
group, >SOH, can be expressed by
>SOH2+... >SOH + H + (2-1)
>SOH ... >SO- + H+ (2-2)
and the surface complexation reactions are defined as follows
>SOH + A %- + 2H + ... >SHA. (%-2)- + H20 Kt... (2-4)
2>SOH + A %- + 2H+ ... >Sr4 (%-2)- + 2H20 P~... (2-5)
where >SA(z-l)~ >SHA(Z-2)~ >~A('-2)-are possible anion surface species.
Several surface chemical models have been used to describe adsorption of
solutes. The models differ in the treatment of electrostatic interactions. The
similarities and differences of the models are examined by Westall and Hohl (1980).
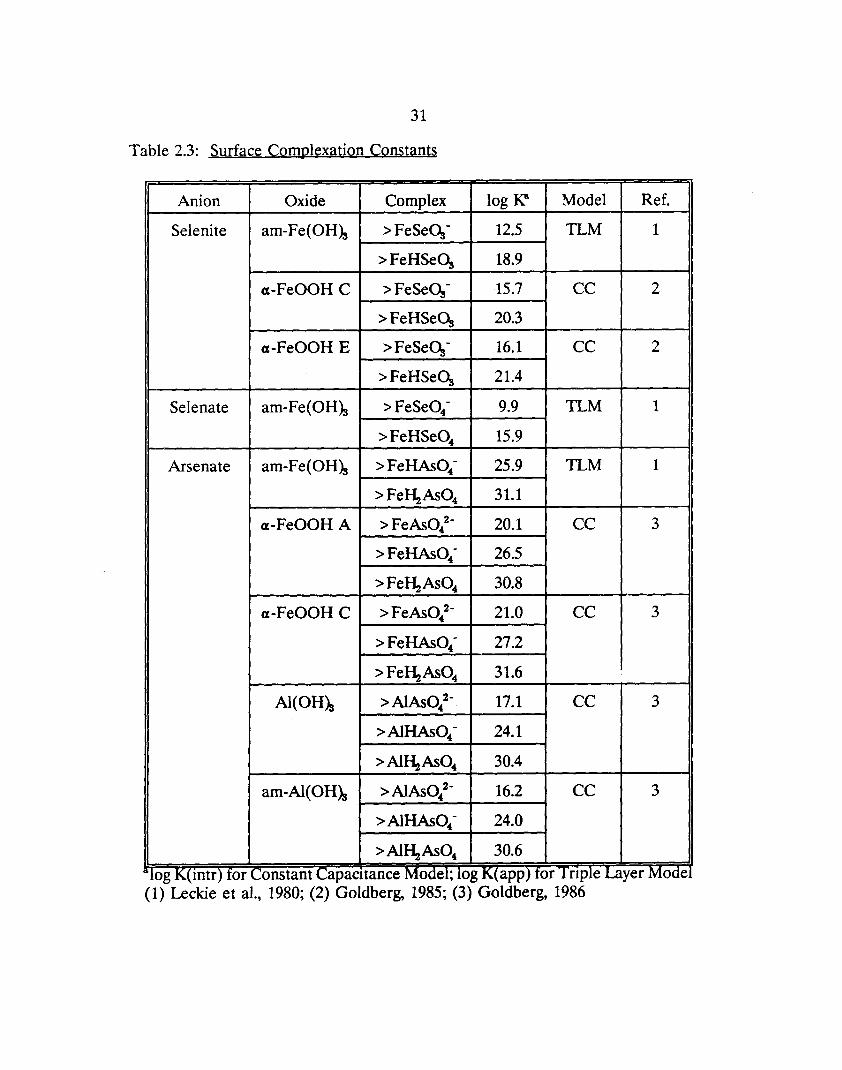
Table 2.3 is a summary of the limited modeling results for the adsorption of the
30
various anions of arsenic and selenium. The adsorption of As(III) has not been
modeled. The adsorption of As(V), Se(IV), and Se(VI) on am-Fe(OHh was
modeled using the triple layer model (Leckie et al., 1980). Mfinity of the anion for
the surface is indicated by the value of the equilibrium complexation constant.
As(V) has the greatest affinity for the amorphous iron surface whereas selenate
forms the weakest complex. Goldberg (1985) determined selenite-goethite surface
complexation constants using the constant capacitance (CC) model from the
adsorption data of Hingston (1970). Arsenate surface complexation constants have
been determined by Goldberg (1986) using the CC model. The data are from
previous adsorption work on goethite and gibbsite (Hingston, 1970), and amorphous
aluminum hydroxide (Malotky and Anderson, 1976). The values of the arsenate
constants are similar to those of phosphate.
As a test of the applicability of surface complexation models to predict anion
adsorption in natural systems, Belzile and Tessier (1990) calculated apparent
adsorption constants of As(V) onto natural Fe oxyhydroxides from the concentrations
of total As and Fe determined in leachates of surficial lake sediments and the in situ
measurement of dissolved total As in their respective overlying waters. A simplified
version of the surface complexation model was used, in which the electrostatic
corrections were ignored. The binding intensity values derived from field
measurements agreed well with those obtained from laboratory experiments
performed with amorphous Fe oxyhydroxides (Pierce and Moore, 1982), but did not
31
Table 2.3: Surface Complexation Constants
Anion Oxide Complex log 1(8 Model Ref.
Selenite am-Fe(OHk > FeSeOs- 12.5 TLM 1
> FeHSeOs 18.9
«-FeOOH C > FeSeOs- 15.7 CC 2
> FeHSeOs 20.3
«-FeOOH E > FeSeOs- 16.1 CC 2
> FeHSeOs 21.4
Selenate am-Fe(OHk > FeSe04- 9.9 TLM 1
> FeHSe04 15.9
Arsenate am-Fe(OHk > FeHAs04- 25.9 TLM 1
> Fel\As04 31.1
«-FeOOH A > Fe AsO.2- 20.1 CC 3
> FeHAs04- 26.5
> Fel\As04 30.8
«-FeOOH C > FeAs°42
- 21.0 CC 3
> FeHAs04- 27.2
> FeI\As°4 31.6
Al(OHk > AlAs 0 2-4 17.1 CC 3
> Al HAs 0 4- 24.1
> AlI\As°4 30.4
am-Al(OHk >AlAs0 2-4 16.2 CC 3
> Al HAs 0 4- 24.0
> AlI\As°4 30.6
'log K(mtr) for Constant CapaCItance Model; log K(app) for TrIple Layer Mode (1) Leckie et al., 1980; (2) Goldberg, 1985; (3) Goldberg, 1986
32
agree with those obtained from laboratory experiments performed with goethite
(Hingston, 1970; Hingston et al., 1971).
2.7 Heterogeneous Oxidation and Reduction
In homogeneous oxic solutions, the oxidations of arsenite and selenite proceed
very slowly. Eary and Schramke (1990) reported a half-time of one year for arsenite
oxidation by oxygen. Tallman and Shaikh (1980) observed no oxidation of As(III)
in distilled demineralized water after 37 days. Experiments and observations with
pure systems in the laboratory indicated that the rates of transformation of selenite
to selenate and vice versa are relatively sluggish (Rosenfeld and Beath, 1964).
There is considerable evidence in recent experimental studies of redox
reactions that mineral surfaces can play a key role in bringing about rapid
transformations. The surface can either catalyze the redox reaction or be a direct
oxidant or reductant. Examples of an oxide acting as a catalyst in the oxidation by
~ include Fe(lI) and Mn(II) in the presence of y-FeOOH (Sung and Morgan, 1980,
1981); Mn(II) in the presence of various oxides (Davies and Morgan, 1989); V(IV)
in the presence of AlzOs and Ti(\ (Wehrli, 1987). Systems in which the oxide
surface is a direct oxidant include hydroquinone with Mn(III), Mn(IV), and Fe(III)
oxides (Stone, 1983; LaKind, 1988), Co(U) with Mn~ (Crowther et al., 1983), Cr(IlI)
with Mn~ (Eary and Rai, 1987), and aniline and other primary aromatic amines
with Mn~ (Laha and Luthy, 1990).
Arsenic(III) oxidation has been observed to occur in freshwater lake sediments
through predominantly abiotic processes (Oscarson et aI., 1980). Further studies
33
found that Mn(IV) oxides are effective oxidants, while there was no oxidation of
As(III) after 48 hours in suspensions of illite, montmorillonite, kaolinite, vermiculite,
ferruginous smectite, microcline, orthoclase, or calcite (Oscarson et aI., 1981a).
Three manganese dioxides (birnessite (~-Mn~), cryptomelane (a-Mn~), and
pyrolusite (p-Mn~»were examined for their ability to deplete As(III) in solution.
The depletion (oxidation of As(III) to As(V) and adsorption of As(III» at pH 7 by
all three Mn dioxides followed first-order kinetics. The depletion rate constants of
birnessite and cryptomelane at 298 K are 7.42 x 10⁻⁵ S-1 and 5.25 x 10⁻⁵ s-l,
respectively, while the rate constant of pyrolusite is more than two orders of
magnitude lower (1.22 x 10⁻⁷ S-l). Thanabalasingam and Pickering (1986) studied
similar systems at pH 6.5 and noticed a relatively rapid (two hours) initial reaction
which was followed by a slower process. Pseudo-first order depletion rate constants
of the order 3.06 x 10⁻⁵ S-1, 1.56 X 10⁻⁵ s-l, and 9.44 x 10-6 S·1 are reported for systems
containing MnOOH, cryptomelane, or pyrolusite, respectively. The rate constants are
experimentally determined by following the disappearance of As(III) from solution.
The systems reached equilibrium with respect to total As sorption while the depletion
of As(UI) was still progressing. The authors conclude that after adsorption of total
As has reached equilibrium, in order for the concentration of As to remain constant,
there must be a one-to-one relationship between the amount of As(III) depleted and
the amount of As(V) appearing in solution. The results suggest a mechanism for the
depletion:
34
As(III) (aq) + Mn oxide surface -> Adsorbed As(III)
Adsorbed As(IIl) -> Adsorbed As(V)
Adsorbed As(V) -> As(V) (aq)
(i)
(ii)
(iii)
These results on heterogeneous As(III)-As(V) kinetics need to be extended to
account for pH, temperature, ionic strength, concentration of As(I1I), surface site
concentration, and the influence of Oa concentration.
There are no reports in the literature of As(III) oxidation by Fe (III) oxides,
although under the proper conditions, the reaction is thermodynamically feasible.
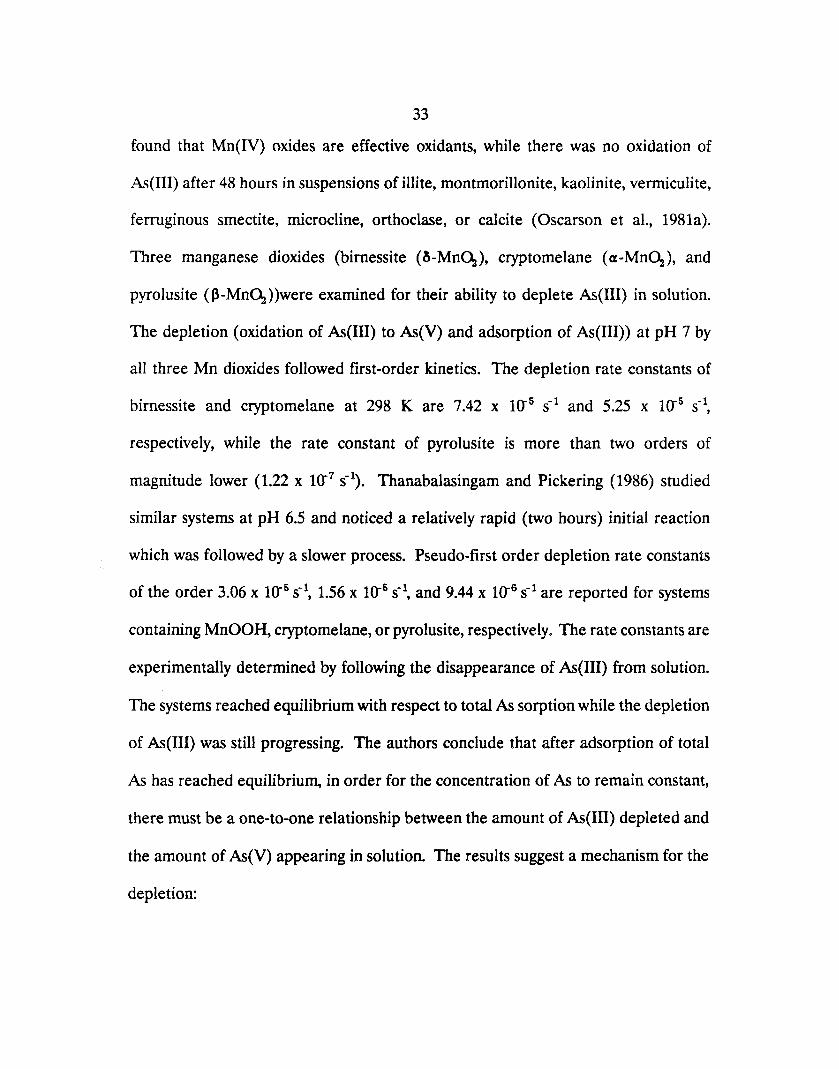
Figure 2.5 is a pE-pH diagram for arsenic in natural waters with the redox equilibria
of MnOOH(s)/Mrr+ and FeOOH(s)/F~+ shown for comparison. Figure 2.5 shows
that manganese oxides are capable of As(UI) oxidation over a wide pH range while
iron oxides are capable of As(UI) oxidation only under acid conditions. Oscarson et
al. (1981b) report that the oxidation of As(UI) in a suspension of Fe (III) oxides at
pH 7 after 72 hours does not occur. Thermodynamically, at pH 7, the reaction would
not be expected to occur.
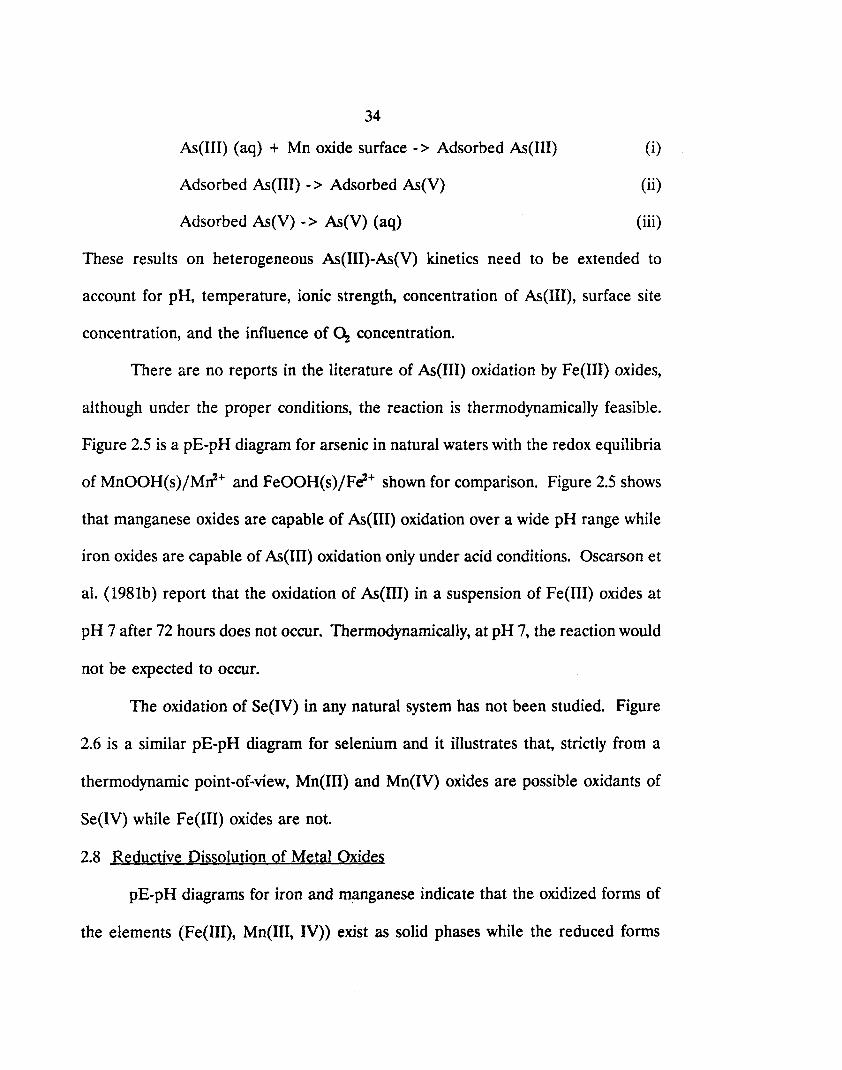
The oxidation of Se(IV) in any natural system has not been studied. Figure
2.6 is a similar pE-pH diagram for selenium and it illustrates that, strictly from a
thermodynamic point-of-view, Mn(I1I) and Mn(IV) oxides are possible oxidants of
Se(IV) while Fe(IU) oxides are not.
2.8 Reductive Dissolution of Metal Oxides
pE-pH diagrams for iron and m~nganese indicate that the oxidized forms of
the elements (Fe (III), Mn(I1I, IV» exist as solid phases while the reduced forms
35
20
15
10
HAsO~
-15
-202~------~4~------~6~------~8~------1~0~----~12
pH
Figure 2.5: pE-pH diagram for the system As-~O at 25°C and Asr = 10 J,LM and the pE-pH relationships for the relative Mn and Fe species for conditions MIlr = Fer = 1 mM.
36
20 o-Mn02
15
10
Figure 2.6: pE-pH diagram for the system Se-~O at 25 0 C and Ser = 10 ~M and the pE-pH relationships for the relative Mn and Fe species for conditions MIlr =
Fer = 1 mM.
37
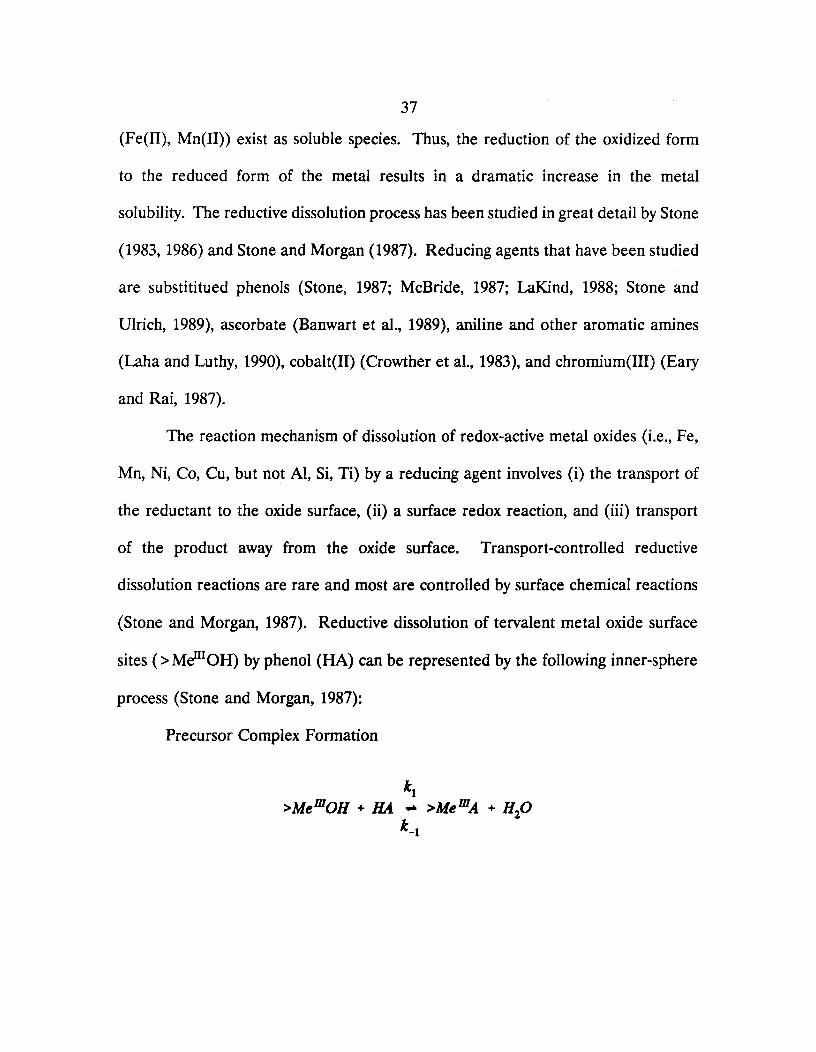
(Fe(II), Mn(II» exist as soluble species. Thus, the reduction of the oxidized form
to the reduced form of the metal results in a dramatic increase in the metal
solubility. The reductive dissolution process has been studied in great detail by Stone
(1983, 1986) and Stone and Morgan (1987). Reducing agents that have been studied
are substititued phenols (Stone, 1987; McBride, 1987; LaKind, 1988; Stone and
Ulrich, 1989), ascorbate (Banwart et al., 1989), aniline and other aromatic amines
(Laha and Luthy, 1990), cobalt(II) (Crowther et al., 1983), and chromium (III) (Eary
and Rai, 1987).
The reaction mechanism of dissolution of redox-active metal oxides (i.e., Fe,
Mn, Ni, Co, Cu, but not AI, Si, Ti) by a reducing agent involves (i) the transport of
the reductant to the oxide surface, (ii) a surface redox reaction, and (iii) transport
of the product away from the oxide surface. Transport-controlled reductive
dissolution reactions are rare and most are controlled by surface chemical reactions
(Stone and Morgan, 1987). Reductive dissolution of tervalent metal oxide surface
sites (> MeIlIOH) by phenol (HA) can be represented by the following inner-sphere
process (Stone and Morgan, 1987):
Precursor Complex Formation
11 >MemOH + HA .. >MemA. + H
20
1_1
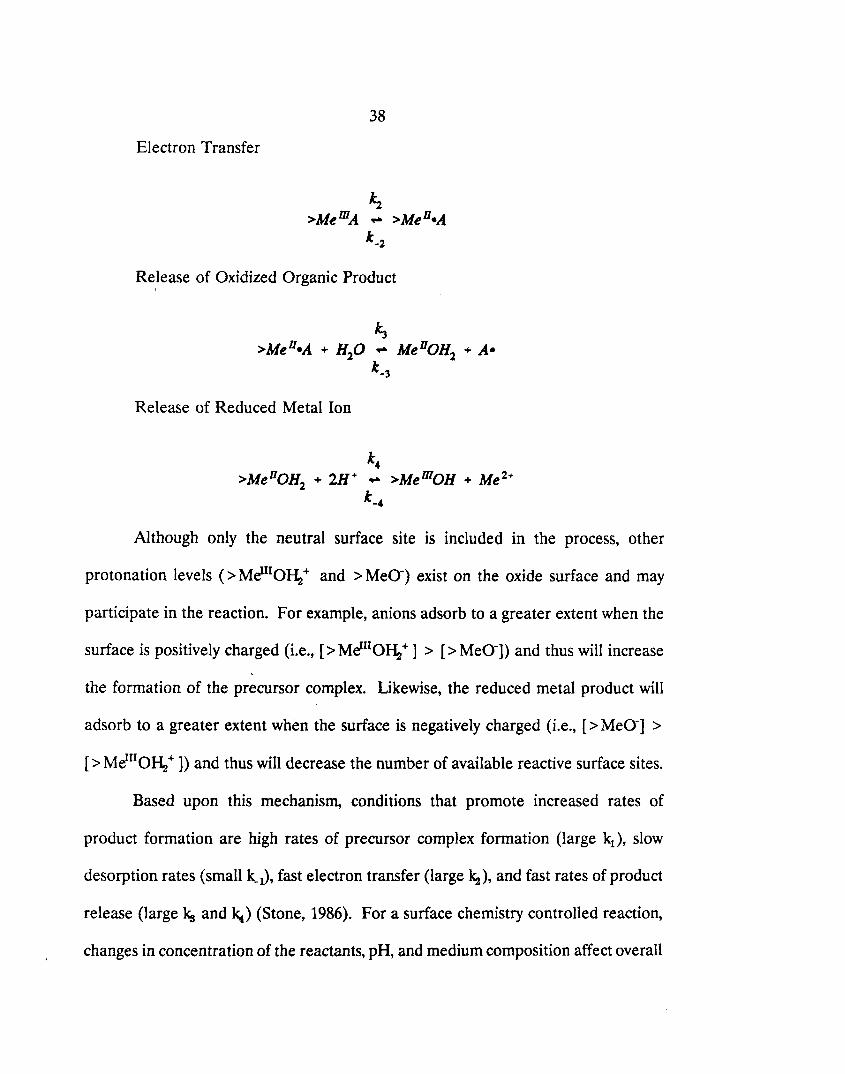
38
Electron Transfer
Is >MemA .. >MeH·A
k_2
Release of Oxidized Organic Product ,
~ >MeH·A + H20 .. Me HOH2 + A·
k_3
Release of Reduced Metal Ion
k4 >Me"OH2 + 2H+ .. >MemOH + Me 2+
k-4
Although only the neutral surface site is included in the process, other
protonation levels (> MeIlIOI\ + and > MeO-) exist on the oxide surface and may
participate in the reaction. For example, anions adsorb to a greater extent when the
surface is positively charged (Le., [> MeIIIOI\ +] > [> MeO-n and thus will increase
the formation of the precursor complex. Likewise, the reduced metal product will
adsorb to a greater extent when the surface is negatively charged (Le., [> MeO-] >
[> MttIIOI-lz + J) and thus will decrease the number of available reactive surface sites.
Based upon this mechanism, conditions that promote increased rates of
product formation are high rates of precursor complex formation (large k1 ), slow
desorption rates (small k_J, fast electron transfer (large ~), and fast rates of product
release (large ks and kt) (Stone, 1986). For a surface chemistry controlled reaction,
changes in concentration of the reactants, pH, and medium composition affect overall
39
rates of dissolution, by modifying the rate or extent of precursor complex formation,
the rate of electron transfer, the rate of release of products from the oxide surface,
or the rate of product re-adsorption. The degree of adsorption of the reductant
depends upon the protonation level of the reductant and the metal oxide surface
sites. Also, the presence of other cations and anions that might compete with the
reductant for reactive surface sites would alter the overall rate of dissolution.
2.9 Summary
The geochemical distributions of arsenic and selenium depend upon the acid
base conditions, redox status, and mineral content of the natural system. In oxic
systems, arsenic should exist as As(V), which adsorbs to mineral surfaces in the acidic
to neutral pH domain. As a result of slow redox kinetics As(III) has been found to
persist in some oxic environments. As(III) also binds strongly to mineral surfaces in
the pH of most natural systems. As the redox status of the system becomes anoxic,
arsenic is first mobilized as manganese and iron oxides are reduced, and then it is
reduced to elemental arsenic itself.
Selenium exists in oxic systems as selenate, which weakly adsorbs to mineral
surfaces and thus, is highly mobile in aquatic systems. Under reducing conditions,
selenium exists as selenite, which is immobilized by adsorption to mineral surfaces.
In strongly reducing environments, selenium is reduced to the insoluble elemental
form.
Kinetically-inhibited redox transformations allow both oxidation states to
simultaneously exist. Homogeneous oxidation of As(III) and Se(IV) by dissolved
40
oxygen is extremely slow, if it occurs at all. One study has shown that manganese
dioxides provide a more rapid pathway for As(III) oxidation. Studies have shown
that other reduced species are also oxidized more rapidly in metal oxide systems.
Based on the affinity for oxide surfaces that As(III) and Se(IV) both display, it is
believed that redox-active metal oxides should provide a pathway for the redox
transformations of these oxidation states.
41
Chapter 3
PREPARATION AND CHARACfERIZATION OF METAL OXIDES
3.1 General Remarks
Deionized distilled water (~I\O) from a MILLI-Q water purification system
(Millipore Corp., Bedford, MA) was used to prepare all solutions. All reagents were
analytical grade and used without further treatment. All solutions were filtered
through a 0.2 ~m Nucleopore filter to remove possible particle contaminants. All
glassware was cleaned with 4 M HNOs or 4 M HCI and rinsed several times with
The pH of solution was monitored in all experiments using a Radiometer glass
combination electrode (Model GK2401C) and a Radiometer Model PHM84 research
pH meter. The electrode was calibrated by NBS buffers.
3.2 Particle Preparation
Goethite particles were synthesized using a method similar to that of Atkinson
et al. (1967). 500 ml of 1.0 N KOH was added to 50 g of Fe(NOs>S'9l\0 (MCB
Reagents) in 500 ml of ~I\O in a teflon beaker. The mixture was aged for 24
hours at 60 0 C. Goethite crystallizes from aqueous ferric iron via the following
reaction:
F~+ + 3 OH- ... «-FeOOH(s) + l\0 (3-1)
Birnessite particles were synthesized using a method adapted from McKenzie
(1971). 16.5 ml of concentrated HCI was added dropwise to a boiling solution
42
(500 ml) of 0.4 M KMn04 • After boiling for a further fifteen minutes, the brown
precipitate was filtered and washed. Birnessite precipitates from the acid reduction
of permanganate:
(3-2)
The oxide suspensions were cleaned by the following method. The
suspensions were: (1) centrifuged at 5000 rpm for 30 minutes, (2) drained of
supernatant, (3) resuspended with Da~O, and (4) sonicated for 30 minutes. This
procedure was repeated until the conductivity of the resuspended particles was that
of D2~O (1-2 Jlmhos). The oxide particles were stored as aqueous slurries (5-10
gil), and then sonicated prior to use to ensure a uniform suspension.
3.3 Mineral Identification
3.3.1 Methods
To identify the solid phase, x-ray diffractograms were taken for each particle
preparation. A Cu Ka source was used. Each suspension was filtered with a 0.2 Jlm
Nucleopore filter, dried, and ground in a mortar and pestle.
Scanning electron microscopy was used to identify the morphology of the
crystals. The samples were prepared by filtering a thousand-fold dilution of the solid
stock suspension through a 0.2 Jlm NUcleopore filter. A portion of the filter was
mounted and covered with a thin layer of gold.
Particle size distributions of the suspension were obtained from measurements
usmg a Coulter Counter Model TA-II-L equipped with a population counting
accessory PCA-I1. A few drops of a sonicated particle stock suspension were added
43
to a 2% NaCI filtered solution and number and volume measurements were taken
using a 50 ~m aperture.
3.3.2 Goethite
The iron oxide particles were identified as goethite (a-FeOOH) by x-ray
diffraction. Figure 3.1 is an x-ray diffractrogram of the iron oxide particles. The
peaks in the diffractogram are listed in Table 3.1. The peaks for the preparation
correspond closely with those expected for goethite. Lepidocrocite (y-FeOOH) is
another iron oxide hydroxide form which may be an impurity. However, no peaks
in the diffractogram correspond to those of lepidocrocite.
Scanning electron microscopy was used to identify the morphology of the iron
oxide particles. Figure 3.2 is a scanning electron micrograph of the preparation and
shows that the goethite particles are acicular. The particles are 1-2 microns long by
0.2-0.4 microns wide.
3.3.3 Birnessite
The manganese oxide particles were identified as birnessite (6-Mn~) by x-ray
diffraction. Figure 3.3 shows an x-ray diffractogram of the manganese oxide particles
and, for comparison, a reference diffractogram for synthetic birnessite (ASTM Card
23-1046). The major peaks of the preparation correspond with the major peaks of
the standard. Figure 3.4 is a scanning electron micrograph of the birnessite particles
and shows that the particles are mostly aggregrated clusters of submicron-sized
spheres.
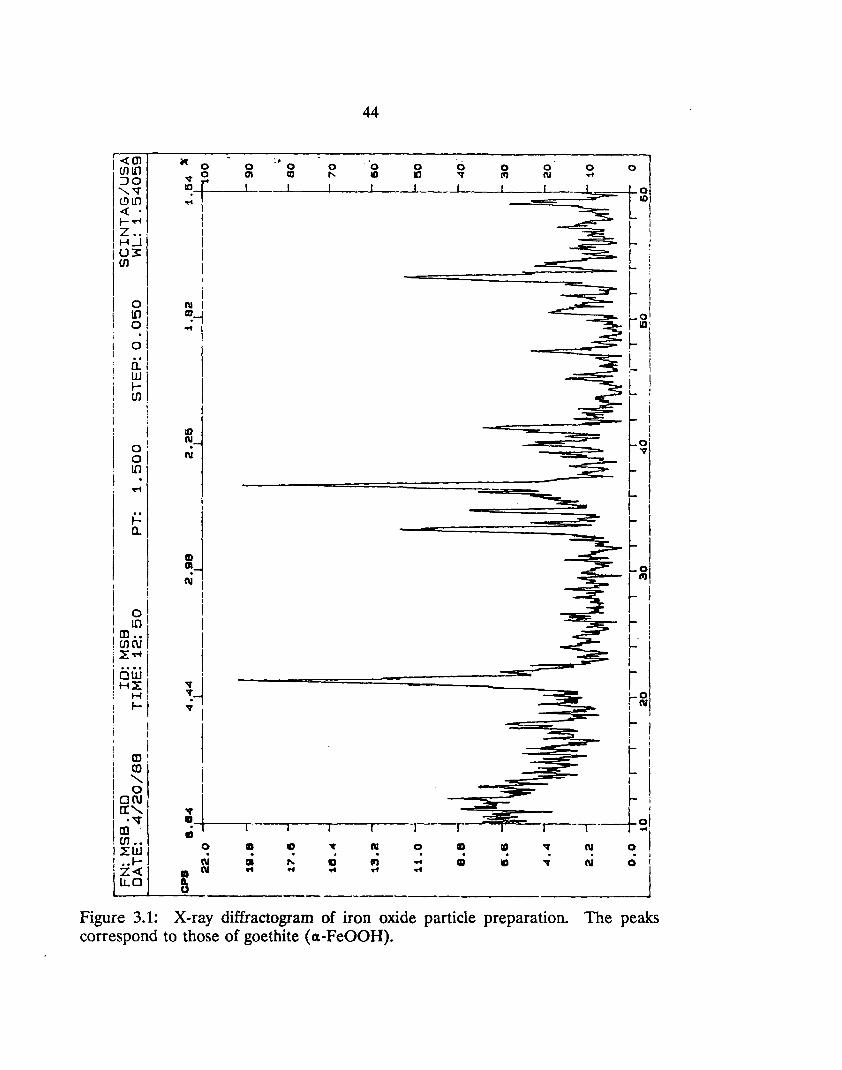
J<a1 cnl!1 ::)0
......... ~ t!J1!1 <. f-T'i z .. H~
I~F< I 0 1 I :g I
~I .. I 0.1
~! ,
o· 01 1!1
I , I I
I gl I [D •• 1 . cnru : ::E~ .
law! : H::E I . H· , I- i
I I
I
I ~I~ log I CI"-. I
I ffi~ I ILlUl I .. 1-
I~~I
44
MOO :. 0 0 0 0 0 0 0 0 0
:~_--LUI_---L" __ J-IO __ --lIlL---___ ~'---_--LPl __ ~.-I ~
! ~ ! r i
N I I I ~~ ! 0 .., I rID;
I ---=~r I r" I
I I I
t I iIi
~J L' (\I ~ .==..- I II) I
I ~ I I ~ I
! I I ~ i r ~i ~ r2
I -~~ ~~
t i I I I
:.1 . ~ i
+---r---.-----.---r-----l--r---or-=--r-----r--+ ~i 110 II II ~ (\I 0 CD IQ 'f (\I 01 . . . .
(\I at ,... II '" ,.. CD II) II (II ~ wi ..c rl ,..
'f (II
II. U
Figure 3.1: X-ray diffractogram of iron oxide particle preparation. The peaks correspond to those of goethite (cx-FeOOH).

45
Table 3.1: Com12arison of X-Ra~ DiffrS!~tiQn P~S!ks
Iron Oxide
d(a) Intensity
4.990 33
4.197 90
3.383 25
2.680 58
2.582 50
2.449 85
2.255 36
2.186 33
1.920 50
1.720 50
1.561 50
3.4 Surface Properties
3.4.1 Specific Surface AreS!
GQ~lhit~
d(a) Intensity
4.98 12
4.183 100
3.383 10
2.693 35
2.583 12
2.450 50
2.253 14
2.190 18
1.920 5
1.719 20
1.561 8
Le12idocro~it~
d(a) Intensity
6.26 100
3.29 90
2.47 80
1.937 70
The specific surface areas of the oxide particles were determined by a
gravimetric method based on the retention of ethylene glycol monoethyl ether
(EGME) (Eltantawy and Arnold, 1973). EOME is believed to form a full
unimolecular layer surface coverage of all easily accessible surfaces. An approximate
0.5 g sample of each particle preparation, which had been dried at 110 0 C, was
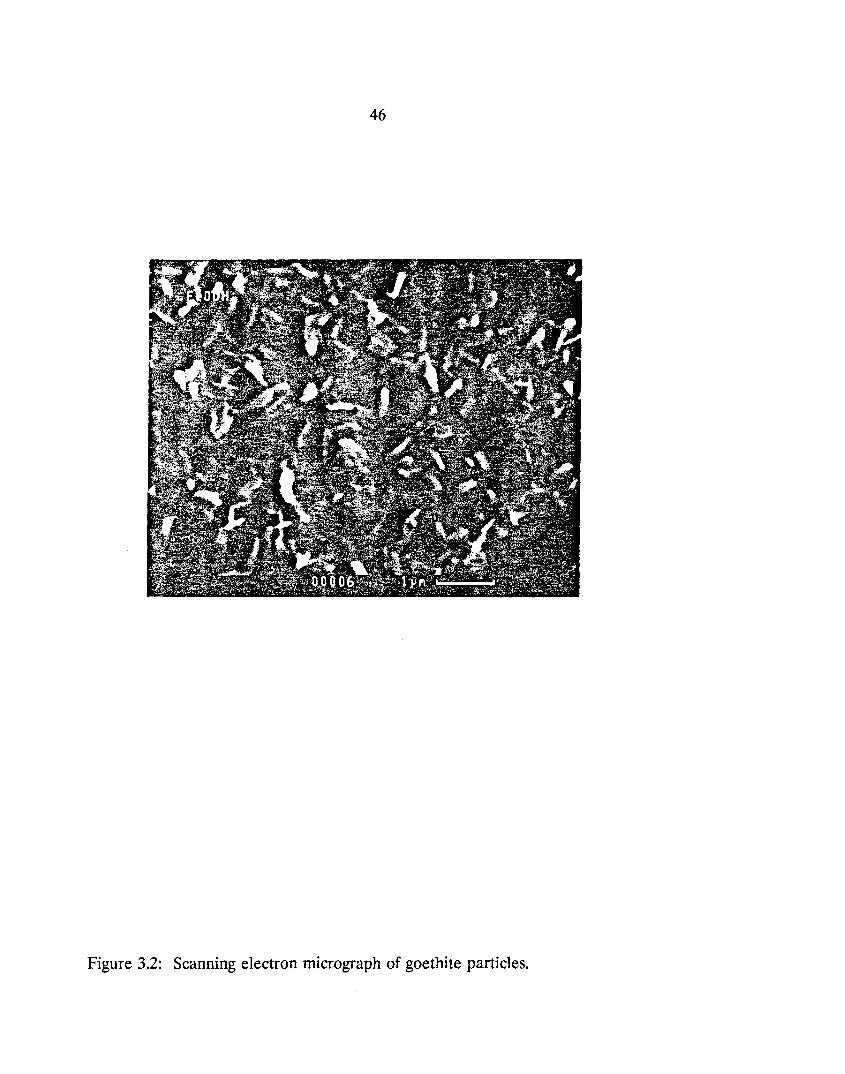
46
Figure 3.2: Scanning electron micrograph of goethite particles.
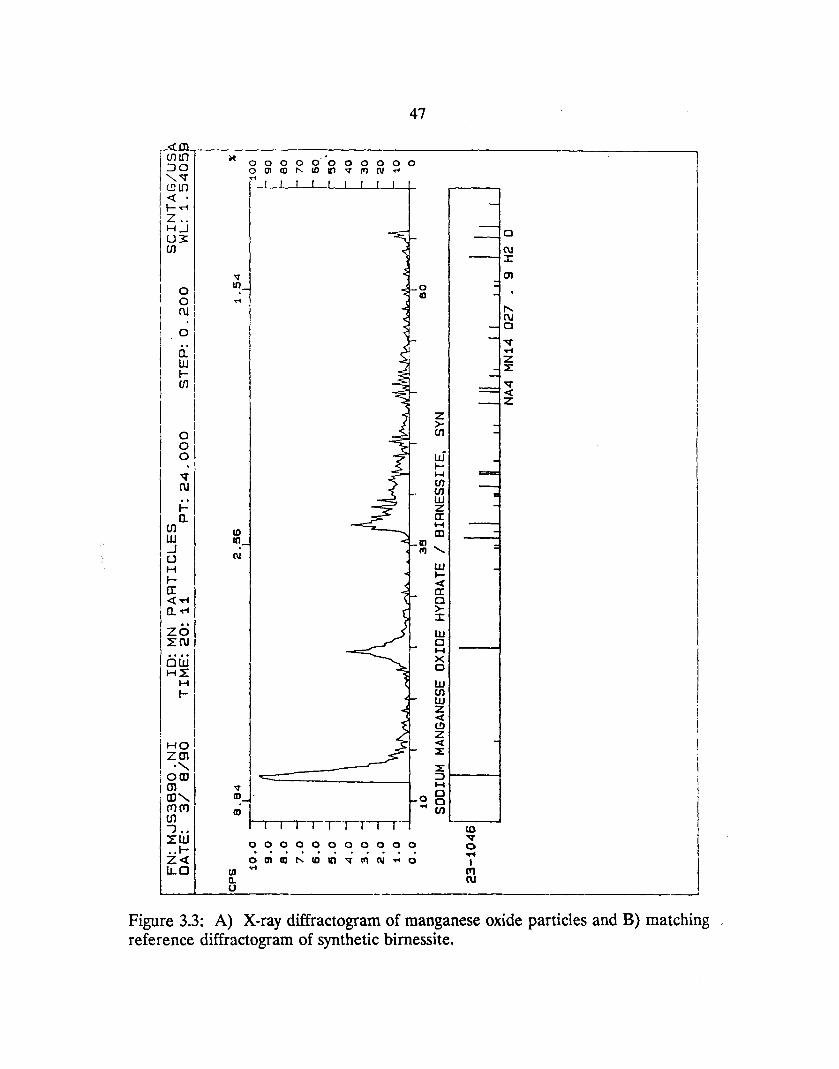
en w ..J
.. to.
I;:!
I~~I o.~
zol ~ru I
tiUi I H~I
t-
"
Hoi zm .,
lOID 1m , ID'
(f}(Y) en J .. ~w .. t-z« !LO
'<I' to
....
to to
C\I
tn n. 0
0
0 ... 0 0 0 0
en CD "- to
0 0 0 0 0
10 "f III C\I ....
47
0 II
z >Ul
uj IH Ul Ul UJ z a: H m
11 CIl' UJ l-e:( a: o >-:::t:
UJ o H X o UJ Ul UJ z « (!)
z « z
51---~
0
0
H
0 0 .... 0
Ul
10 -.;;r o ~
I ('11 ru
a C\I :r en
r-.. C\I a -.;;r .-1 Z ~
-.;;r e:( Z
Figure 3.3: A) X-ray diffractogram of manganese oxide particles and B) matching reference diffractogram of synthetic birnessite.
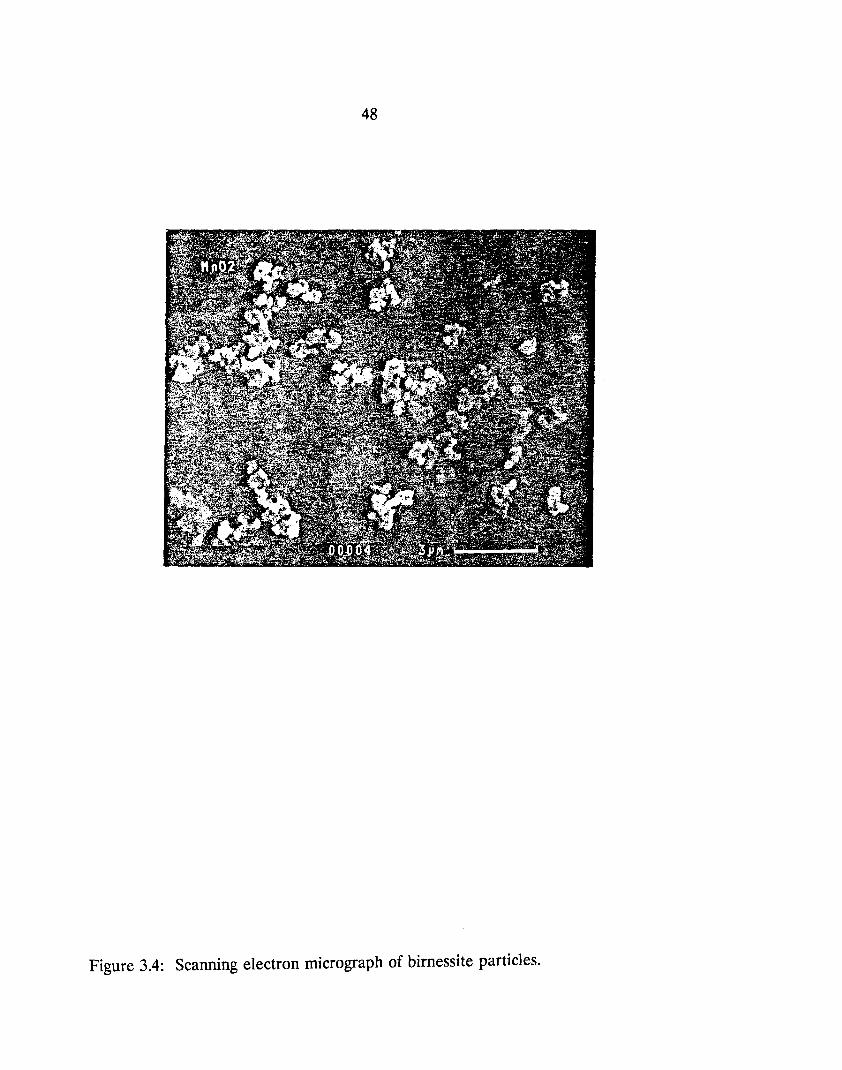
48
Figure 3.4: Scanning electron micrograph of birnessite particles.
49
wetted with 4 ml EGME in weighing bottles and the slurry allowed to stand in a dry
atmosphere for 1 hour. The slurry was then placed in a dessicator which contained
100 g of dry CaC~ and a free surface of liquid EGME (approximately 40 ml). The
dessicator was evacuated with a vacuum pump at room temperature until the slurry
appeared to be dry and the volume of the free surface of liquid EGME had
decreased by half. The sample was allowed to stand sealed for another hour before
dry air was admitted. The EGME-treated particles were weighed, returned to the
dessicator, and re-equilibrated for further periods of 2 hours using the same
evacuation procedure. The amount of EGME retained did not change after the first
evacuation. The theoretical value for complete unimolecular layer surface coverage
for EGME is 3.71 x 10⁻⁴ g/err. Specific surface area is calculated by taking the
amount of EGME retained (gig particles) and dividing by the theoretical value.
The specific surface area of goethite was determined to be 42 err I g while the
specific surface area of birnessite was determined to be 72 err Ig. Table 3.2 compares
these values with reported specific surface areas of other goethite and birnessite
preparations.
3.4.2 Surface Exchan~e Capacity
Total exchange capacity of the oxide surface was determined by a back
titration method (Sigg and Stumm, 1980). A particle suspension of known
concentration was equilibrated at pH 7 for goethite and pH 2.7 for birnessite. Each
suspension was then adjusted to pH 11 with 0.1 M NaOH and allowed to equilibrate.
The particles were removed by filtration and the filtrate titrated back to the initial
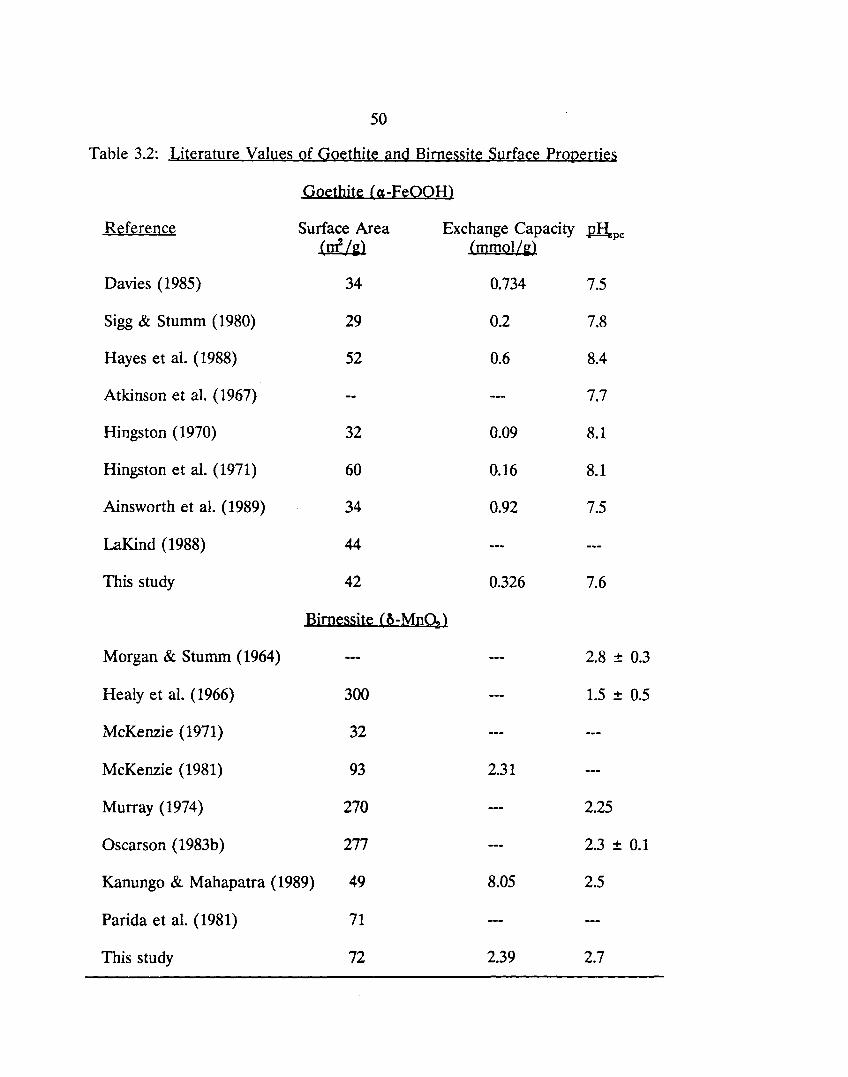
50
Table 3.2: Literature Values of Goethite and Birnessite Surface Properties
Reference
Davies (1985)
Sigg & Stumm (1980)
Hayes et al. (1988)
Atkinson et al. (1967)
Hingston (1970)
Hingston et al. (1971)
Ainsworth et al. (1989)
LaKind (1988)
This study
Morgan & Stumm (1964)
Healy et al. (1966)
McKenzie (1971)
McKenzie (1981)
Murray (1974)
Oscarson (1983b)
Goethite (a-FeOOH)
Surface Area (rre /~)
Exchange Capacity .PRpc (mmoll~)
34 0.734 7.5
29 0.2 7.8
52 0.6 8.4
7.7
32 0.09 8.1
60 0.16 8.1
34 0.92 7.5
44
42 0.326 7.6
Birnessite (~-Mn~)
2.8 ± 0.3
300 1.5 ± 0.5
32
93 2.31
270 2.25
277 2.3 ± 0.1
Kanungo & Mahapatra (1989) 49 8.05 2.5
Parida et al. (1981) 71
This study 72 2.39 2.7
51
pH with 0.1 M HCI04 • The difference between the amount of base needed to raise
the pH and the amount of acid needed to back titrate the filtrate is equivalent to the
number of exchangeable surface sites. The surface exchange capacity of goethite was
determined to be 3.26 x 10⁻⁴ mol/g while birnessite was found to have a surface
exchange capacity of 2.39 x 10⁻³ mol/g. The birnessite value is the first to be
reported for a synthetic birnessite. Comparison of other reported exchange capacities
of goethite are listed in Table 3.2.
3.4.3 Surface Complexation Model
The surface chemistry of metal oxides has been discussed in detail in the
literature (Schindler and Stumm, 1987; Westall, 1986, 1987; Dzombak and Morel,
1990). The metal oxide surface can be described with a coordination chemistry
model which is modified to take into account electrostatic interactions. The surface
groups of a metal oxide are amphoteric and can be described by surface acid-base
reactions
>S01\+ = >SOH + H+, K'al
> SOH = > SO- + W,
(3-3)
(3-4)
where > SO~ +, > SOH, and > SO- represent the positively charged, neutral, and
negatively charged surface species. The equilibrium constants are defined as
= [>SOH][H+1 exp( -F'P)
[>SOH;1 RT (3-5)
52
$ [>SO-UH+] (-f"1P) Kal = exp--[>SOH] RT
(3-6)
where 1f is the surface potential (volts), R is the molar gas constant (8.314 J/molK),
and T is the absolute temperature (K).
The surface charge and potential are a consequence of the charge species,
> SO~ + and > SO-, and the surface charge density can be evaluated by applying a
proton material balance relationship to titration data:
00 =: ([>SOH2+] - [>SO-]) AFS =: (CA - CB + [OH-] - [H+]) (3-7) C
where Sc is the solid concentration (giL), A is the specific surface area(nr Ig), F is
the Faraday constant and CA and ~ are the resulting concentrations of acid and
base added to the system. Equation (3-7) relates the surface charge density to
solution pH. The pH value at which the surface proton adsorption density equals
that of hydroxide ions (Le., where proton-derived surface charge is zero) is defined
as pI\pc.
There are several electrostatic models that have been developed. The diffuse
layer model assumes a layer of fIxed charge on the surface and a diffuse layer of
opposite charges in solution. A Gouy-Chapman distribution of ions is assumed for
the solution side of the interface. The relationship between surface charge, °0 , and
potential, 1fo' is fixed by Gouy-Chapman electrical double layer theory. The surface
charge density (in Cjrrr) is related to the potential at the surface (in volts) by
53
I
CJ o = (8RTEEoC X 103)2 sinh(ZFV j2R1) (3-8)
where R is the molar gas constant (8.314 J/mol"K), T is the absolute temperature
(K), E is the dielectric constant of water, ~ is the permittivity of free space (8.854
x H[2 C/Vm), and c is the molar electrolyte concentration, and Z is the electrolyte
valence.
Computer codes have been developed to solve equilibrium surface speciation
calculations (e.g., SURFEQL (Faughnan, 1981». The codes require intrinsic surface
equilibrium constants and an electrostatic model to describe the surface-solid
interface. The choice of the electrostatic model gives rise to a number of additional
fitting parameters. Electrostatic models that have been implemented in surface
chemical equilibrium computer codes are the diffuse layer model, the Stern layer
model, the constant capacitance model and the triple layer model. The models differ
by the treatment of the electrostatic energy associated with the charged surface.
Westall and Hohl (1980) compared different surface models and concluded that the
models are equivalent in their ability to fit the same titration or adsorption results,
although they have different numbers of fitting parameters, such as the equilibrium
constants. The diffuse layer model is chosen for this work because it is the simplest
physical presentation of the interface, and thus, has the least number of fitting
parameters.
3.4.4 Acid-Base Titration
3.4.4.1 Method
54
The surface acidity constants for goethite and birnessite surfaces were
obtained by acid-base titrations. The titrations were performed in a 250 ml
magnetically-stirred double-walled beaker connected to constant temperature (25 0 C)
water bath. N2 gas was used to continually purge and keep the system free of CC\.
The gas was passed through a column of Ascarite II to remove any contaminant CC\
and rehydrated through a column of ~I\O before being introduced into the
reaction vessel. Titrations were performed on aqueous suspensions consisting of 0.1
M NaCIO" and a known solid concentration. Solid concentration was determined
gravimetrically by filtering 1 ml of the reaction suspension just prior to and following
the titration through a 0.2 Jlm Nucleopore filter. For both particle preparations, the
aqueous systems were adjusted to pH 4 with 1.0 M HCIO" to facilitate the removal
of aqueous CC\. The goethite suspension was titrated to pH 10 by adding 10-100 Jll
of 0.1 M NaOH at intervals of 5 to 15 minutes. Mter 30 minutes at pH 4, the pH
of the birnessite suspension was quickly raised to 10 with 0.1 M NaOH and
equilibrated for 40 minutes. It was then titrated to pH 2 with addition of 0.1-1.0 ml
of 0.1 M HCIO" at intervals of 10 to 20 minutes.
3.4.4.2 Goethite
The acid-base titration data for a goethite particle suspension are plotted in
Figure 3.5. Surface acidity constants were obtained by fitting the titration data with
FITEQL, an iterative non-linear least squares optimization computer program
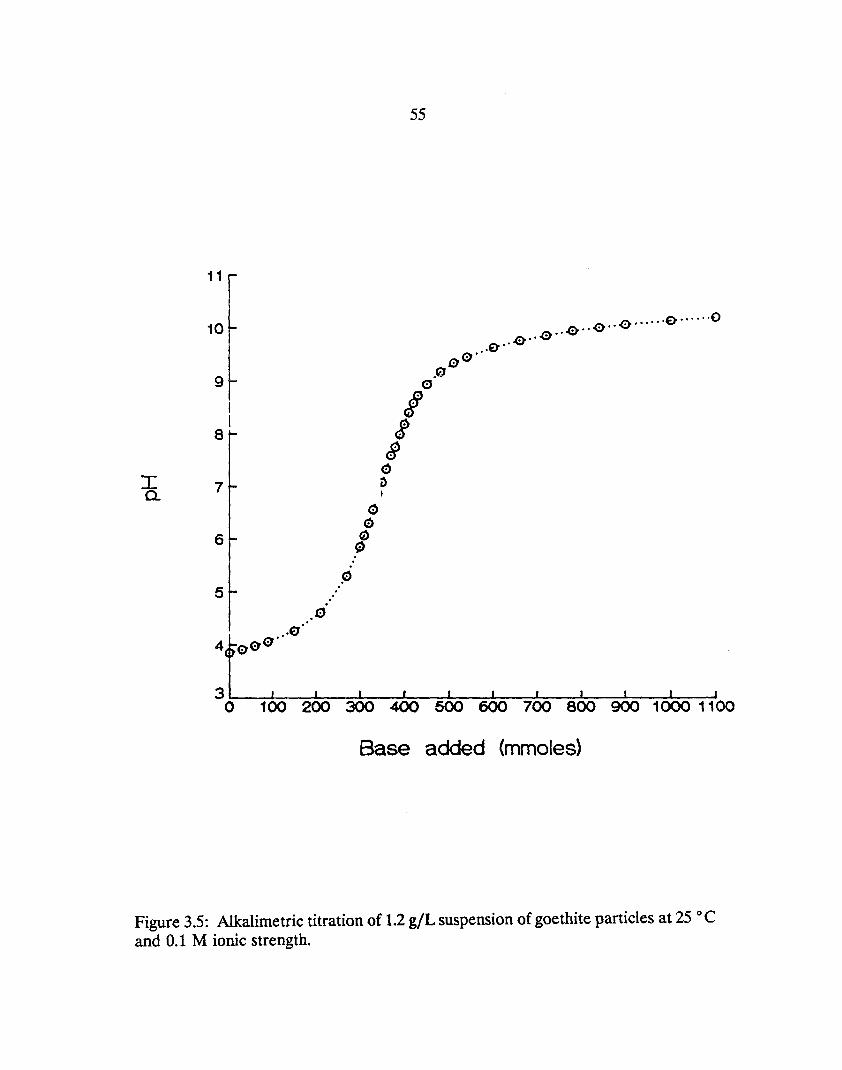
I Q.
10
9
I I
8
7
6
o 100 200
55
e
I ~ a
~ ~ •
c:>' . e .f;}
~ •• jfj .0··~
"'" e······e······o .. e··~··
I I I I I I I I I
300 400 500 600 700 800 900 1000 1100
Base added (mmoles)
Figure 3.5: Alkalimetric titration of 1.2 giL suspension of goethite particles at 25 0 C and 0.1 M ionic strength.
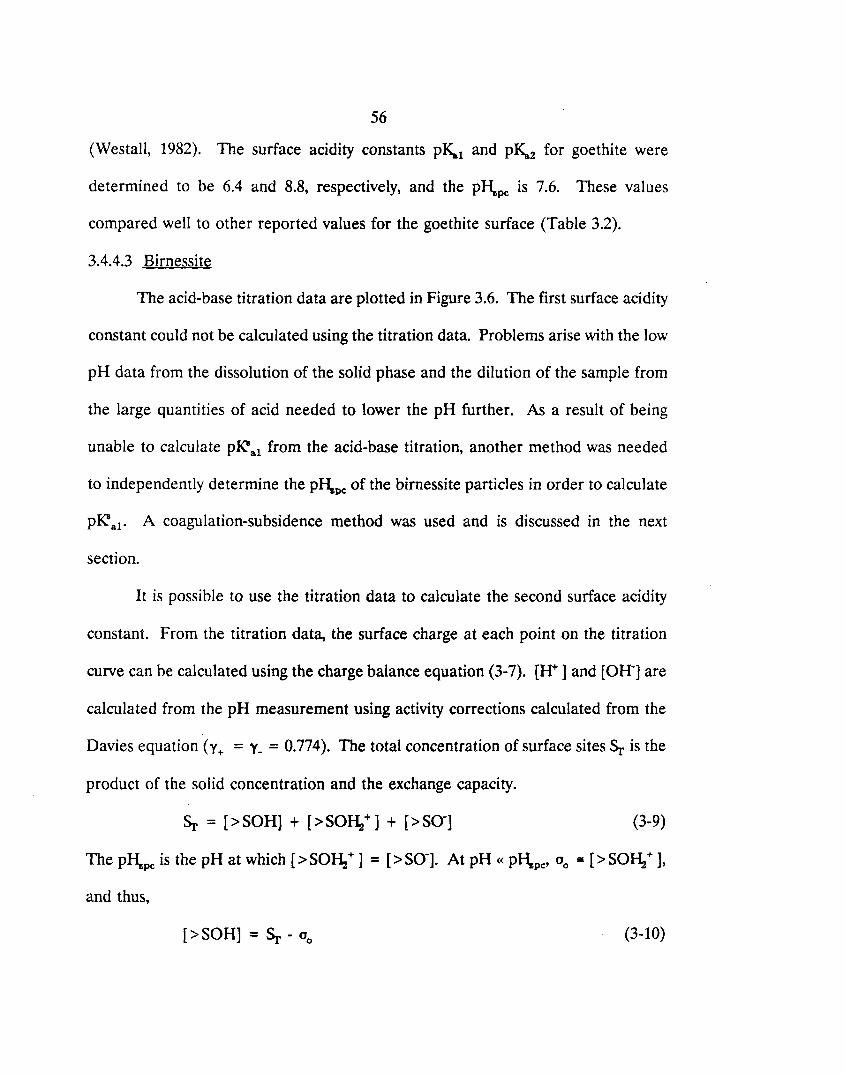
56
(Westall, 1982). The surface acidity constants PKal and PKa2 for goethite were
determined to be 6.4 and 8.8, respectively, and the PI-\pc is 7.6. These values
compared well to other reported values for the goethite surface (Table 3.2).
3.4.4.3 Birnessite
The acid-base titration data are plotted in Figure 3.6. The first surface acidity
constant could not be calculated using the titration data. Problems arise with the low
pH data from the dissolution of the solid phase and the dilution of the sample from
the large quantities of acid needed to lower the pH further. As a result of being
unable to calculate pJ(Wal from the acid-base titration, another method was needed
to independently determine the pI-\pc of the birnessite particles in order to calculate
pJ(Wal' A coagulation-subsidence method was used and is discussed in the next
section.
It is possible to use the titration data to calculate the second surface acidity
constant. From the titration data, the surface charge at each point on the titration
curve can be calculated using the charge balance equation (3-7). [H+] and [OH-] are
calculated from the pH measurement using activity corrections calculated from the
Davies equation (y+ = y_ = 0.774). The total concentration of surface sites Sr is the
product of the solid concentration and the exchange capacity.
(3-9)
The pI\pc is the pH at which [> SOI\ +] = [> SO-]. At pH « pI\pc' 00 • [> SOH./ ],
and thus,
[>SOH] = Sr - 00 (3-10)
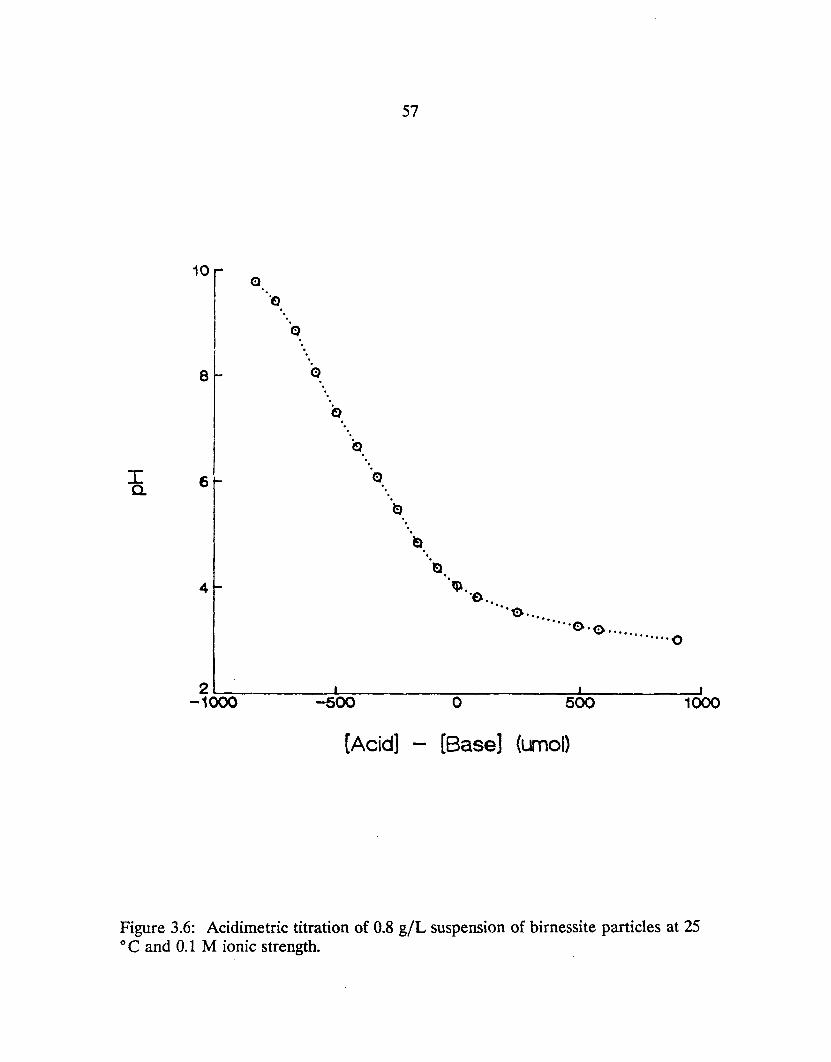
I a.
8 '.
4
57
a. 'ql.
'0 .. ···G ....
..... 0-. ·G· .... ·······0
2 -1000~~-------5~OO=-------~O~------~5~OO~------~1000
[Acid] [Base] (umol)
Figure 3.6: Acidimetric titration of 0.8 gIL suspension of birnessite particles at 25 o C and 0.1 M ionic strength.
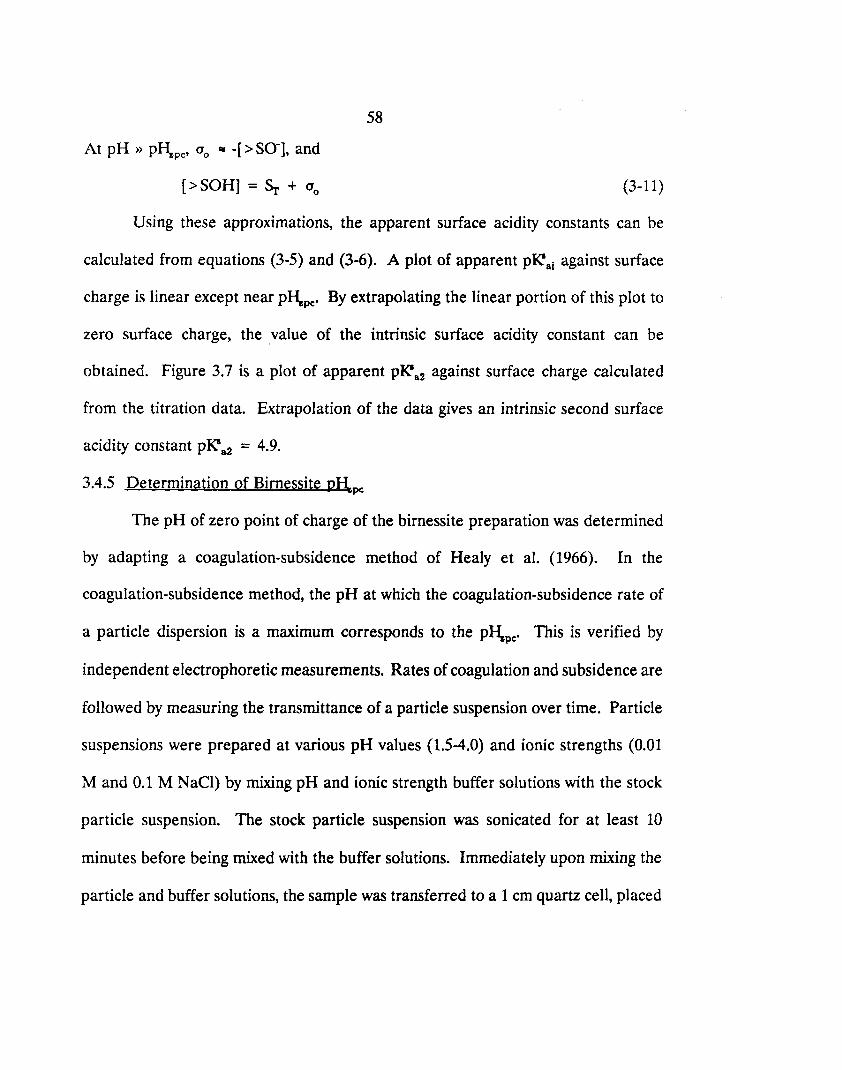
At pH » pI-\pc' 00 &II -[ > SO-], and
[>SOH] = Sr + 00
58
(3-11)
Using these approximations, the apparent surface acidity constants can be
calculated from equations (3-5) and (3-6). A plot of apparent pJ(B ai against surface
charge is linear except near pl\pc' By extrapolating the linear portion of this plot to
zero surface charge, the value of the intrinsic surface acidity constant can be
obtained. Figure 3.7 is a plot of apparent pJ(B a2 against surface charge calculated
from the titration data. Extrapolation of the data gives an intrinsic second surface
acidity constant pJ(B a2 = 4.9.
3.4.5 Determination of Birnessite vRpc
The pH of zero point of charge of the birnessite preparation was determined
by adapting a coagulation-subsidence method of Healy et al. (1966). In the
coagulation-subsidence method, the pH at which the coagulation-subsidence rate of
a particle dispersion is a maximum corresponds to the pl\pc' This is verified by
independent electrophoretic measurements. Rates of coagulation and subsidence are
followed by measuring the transmittance of a particle suspension over time. Particle
suspensions were prepared at various pH values (1.5-4.0) and ionic strengths (0.01
M and 0.1 M NaCI) by mixing pH and ionic strength buffer solutions with the stock
particle suspension. The stock particle suspension was sonicated for at least 10
minutes before being mixed with the buffer solutions. Immediately upon mixing the
particle and buffer solutions, the sample was transferred to a 1 cm quartz cell, placed
59
10r. 0
0
N I . 0 (j)
~
I C- ' .. (?
+J
ar c 0 .. Q) ~ m (>" C- '. C- '0 .. « '.
'G.. '.
6" '0 .. .. ~ .. 00
'.
pK~ Ontr) 4.9
4 I I I -800 -600 -400 -200 °
Slrface Charge (ufv1)
Figure 3.7: A plot of the second apparent surface acidity constant as a function of surface charge °
0, Extrapolation to zero surface charge gives the intrinsic acidity
constant.
60
in the spectrophotometer (Hewlett Packard 8451A Diode Array Spectrophotometer)
and transmittance was measured at l = 600 nm over a time period of 120 minutes ..
The transmittance of birnessite suspensions at several pH values as a function
of time is plotted in Figure 3.8. At all pH values, the transmittance is initially
constant. The slopes of the curves appear to increase after approximately 1200
seconds. The rates of coagulation-subsidence were determined by linear regression
of the data from 1440 to 3600 seconds. Figure 3.9 is a plot of the rate of
coagulation-subsidence against pH at two different ionic strengths. The maximum
rate corresponding to the pI-\pc occurs at pH 2.7 for both ionic strengths.
This value compares well with other reported values for the PI-\pc of birnessite
(Table 3.2). With this independent determination of the pI-\pc' a value for pI<." a1 can
be calculated, and this value is 0.5.
3.4.6 Oxide Surface Speciation
The surface acidity constants can be used with SURFEQL to determine the
surface speciation at a given pH. Figures 3.10 and 3.11 show the distribution of
protonated, neutral, and deprotonated surface sites of goethite and birnessite,
respectively, over the pH range 2-11. The neutral sites dominate the distribution
over the pH range of most natural waters.
3.4.7 Summary of Surface Characterization
The surface properties determined for goethite and birnessite are summarized
in Table 3.3. The goethite surface properties compare well with those of previous
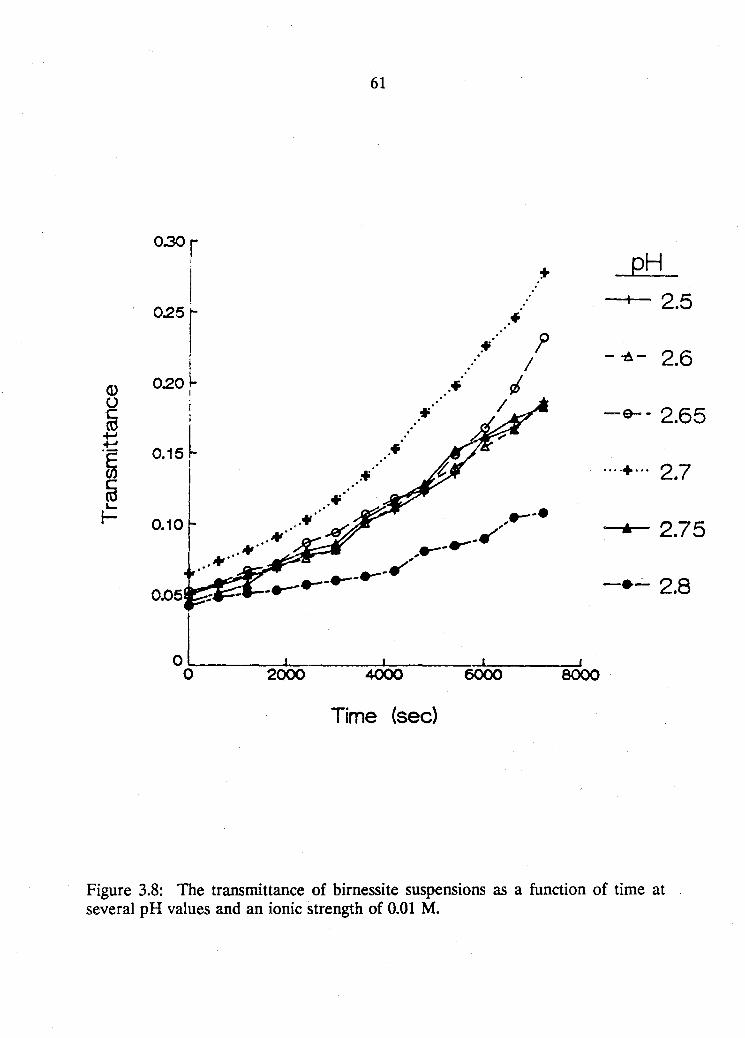
61
030r
I 0.25 r
Q) 0.20 L I
.. :f. ?
.. / .of ,j
0 r C I ro 0.15l
+oJ +oJ
.~ I
~
.*' / ..
.of
.of
~
I- 0.10
0.05
o~[ __ ~I~ ___ I~ ___ J~~I o 2000 4000 6000 8000
Time (sec)
pH --+-- 2.5
- -6- 2.6
-e-- 2.65
····+···27 .
• 2.75
- • .-:- 2.8
Figure 3.8: The transmittance of birnessite suspensions as a function of time at several pH values and an ionic strength of 0.01 M.
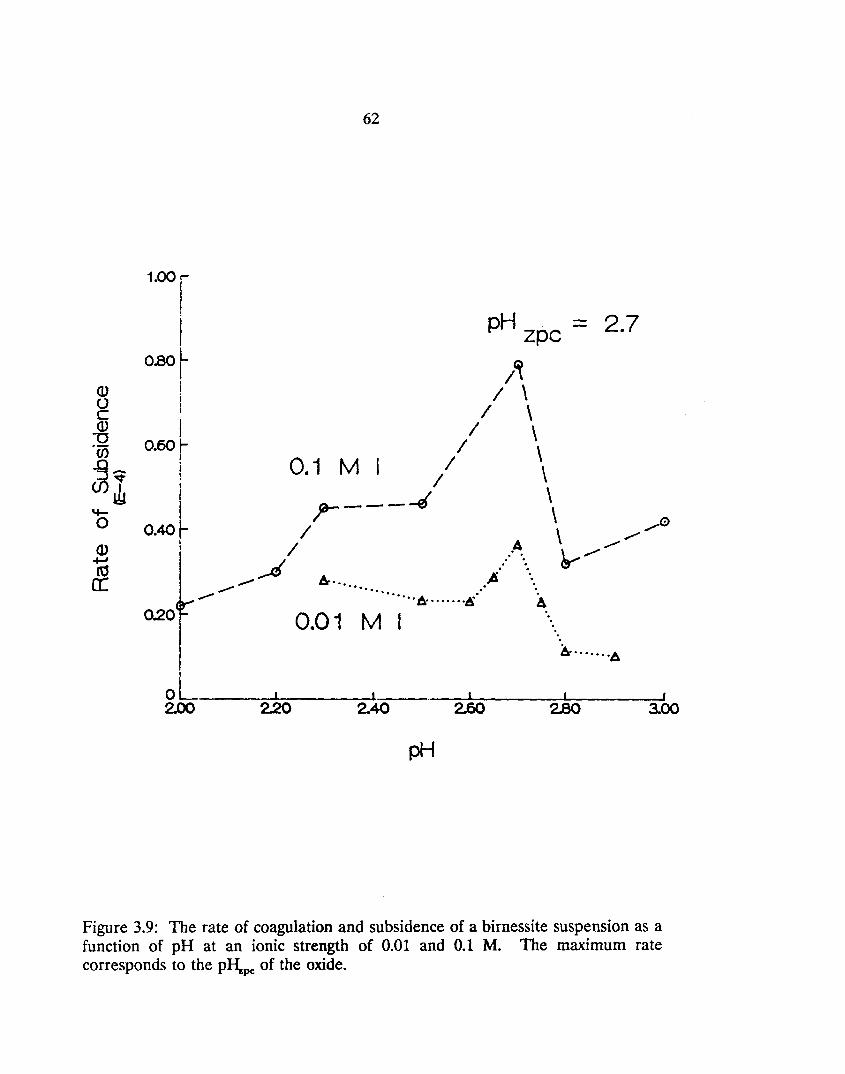
()) () c ()) lJ 'w .0
~Z '+-0
()) +-' ~ a:
1.001 1
I o.ao L
! f
I i t
I 0.60 r-
I I I
OAO~ I
0.20
62
PH . ZpC
/~ I \
I \ I \
I \ 0.1 M I II \
",-_--.4 \
2.7
II .A \ ..// --" . '. ~../ ___ ___ 6,.... ...... ..A
--- '" "'6,' .... '''is.'
0.01 M I '.
&·······A
,0
O~------_-LI--------LI_------~I ________ ~I ______ ~I 2.00 2.20 2.40 2.60 2.SO 3.00
pH
Figure 3.9: The rate of coagulation and subsidence of a birnessite suspension as a function of pH at an ionic strength of 0.01 and 0.1 M. The maximum rate corresponds to the pI-\pc of the oxide.
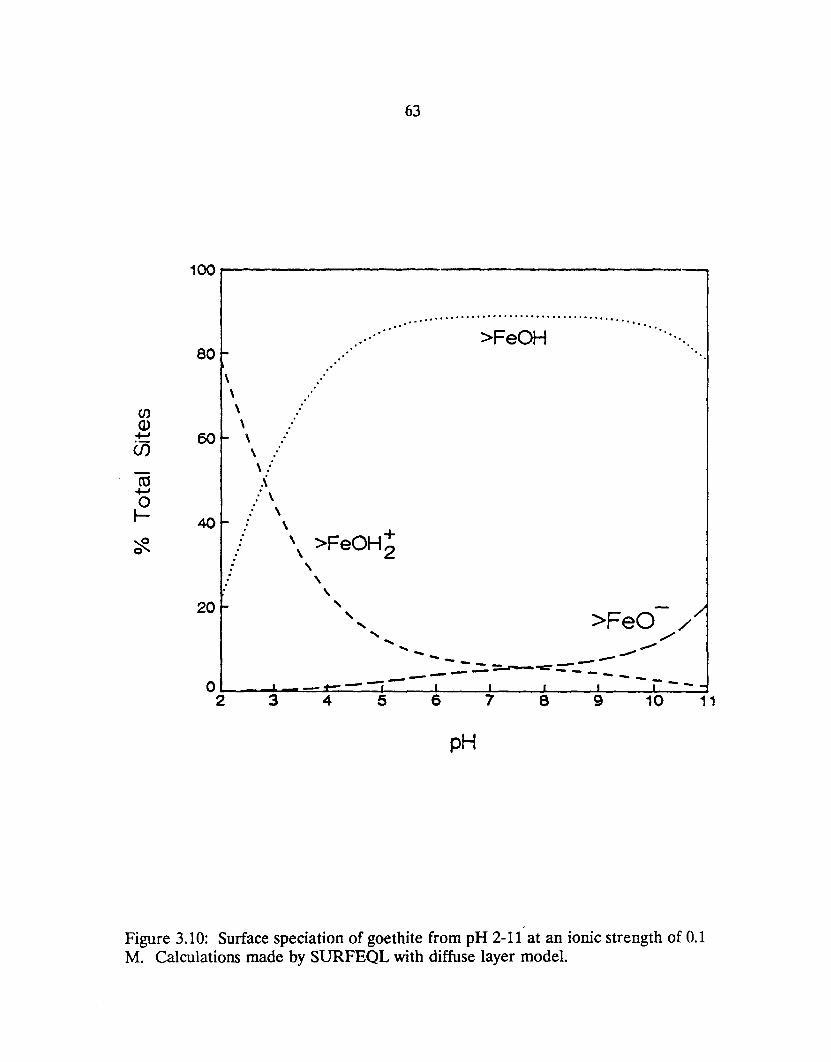
63
100~--------------------'------------------------~
80 ~
\ \ \ \
60 ~ \ \ \ ... . \
... \ :. \
:
......................................... ..... -0 . ... >FeOH
.. ..
.. :
40~:· \
./ \\ >FeOH~ : \
.: \ . \
20 f- ' " >FeO //
" / ... ~ ........... -- ....... ..,.". -= ..=. ::...,r...-.. -c" =-...-: --- - -- -- -- --O~ ___ ~~~--~,+-~--__ --_I~--__ ~I~ __ ~~I __ ~I~ ___ ~I __ ~I~-__ -~-
2 3 4 5 6 7 8 9 10 11
pH
Figure 3.10: Surface speciation of goethite from pH 2-11 at an ionic strength of 0.1 M. Calculations made by SURFEQL with diffuse layer model.
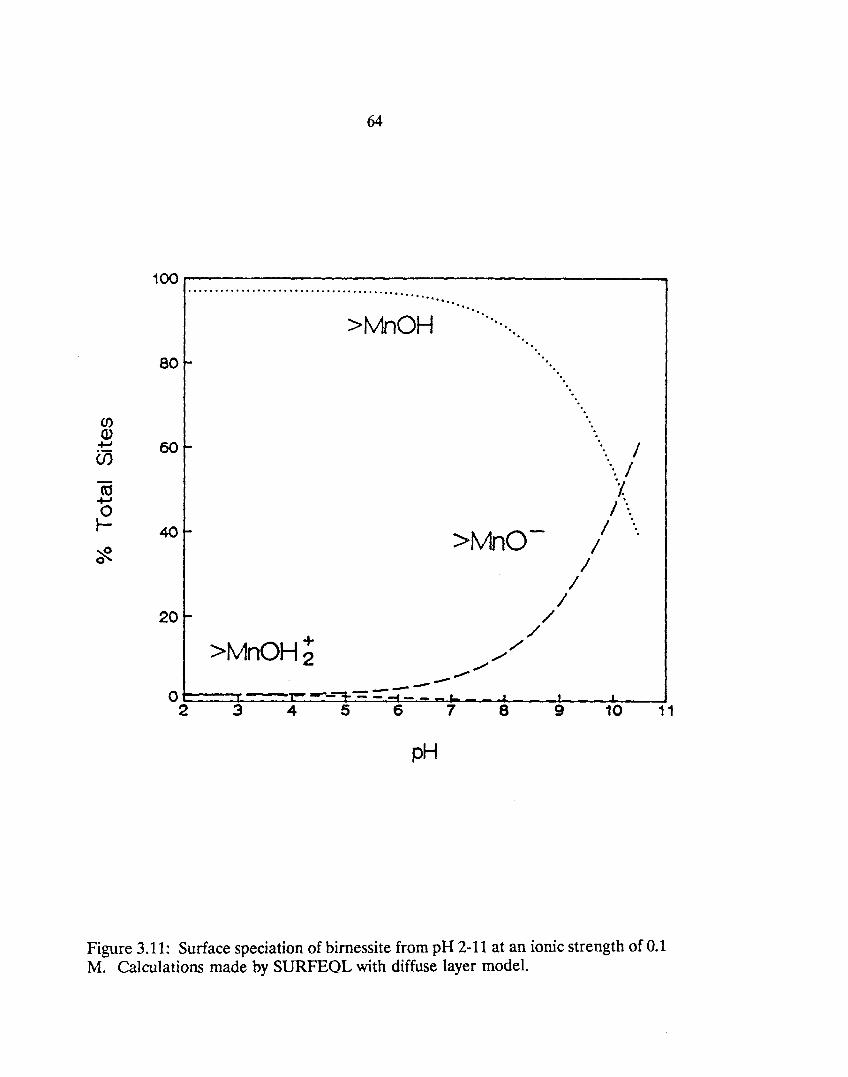
64
100~----'---------------------------------------......................................... ......
>MnOH 80 I-
20 ~
+ >MnOH 2
'" ". ". '.
'. '.
>MnO-
/ /
/' ",
,..,.'"
/ /
/
'.
/ .... /
'1-I ....
/ .... /
--OF===~=--==--=~'-'~--~~~-~~~ .. ~~--~-~_~~L~~~J ____ ~I ____ ~I __ ~ 2 3 4 5 6 7 e 9 10 11
pH
Figure 3.11: Surface speciation of birnessite from pH 2-11 at an ionic strength of 0.1 M. Calculations made by SURFEQL with diffuse layer model.
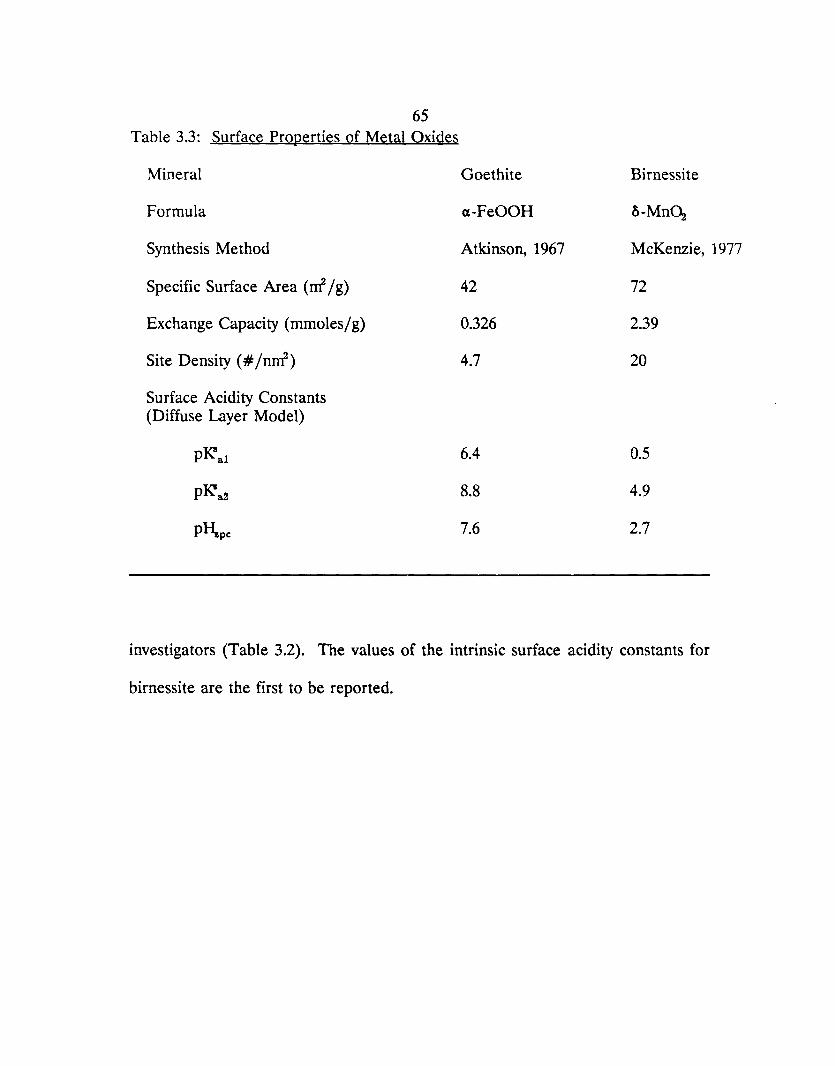
65 Table 3.3: Surface Properties of Metal Oxides
Mineral
Formula
Synthesis Method
Specific Surface Area (nr /g)
Exchange Capacity (mmoles/g)
Site Density (# /nnr)
Surface Acidity Constants (Diffuse Layer Model)
Goethite
u-FeOOH
Atkinson, 1967
42
0.326
4.7
6.4
8.8
7.6
Birnessite
&-Mn~
McKenzie, 1977
72
2.39
20
0.5
4.9
2.7
investigators (Table 3.2). The values of the intrinsic surface acidity constants for
birnessite are the first to be reported.

66
67
Chapter 4
ANION ADSORPTION KINETICS AND EQUILIBRIA
WITH GOETHITE AND BIRNESSITE
4.1 Introduction
This chapter presents experimental results and discusses the rates and
mechanisms of adsorption and desorption of ;lrsenic and selenium oxyanions on
goethite (a-FeOOH) and birnessite (o-Mn~). Anion adsorption involves a ligand
exchange between the anion and a surface hydroxyl group in which the anion binds
directly to a surface metal center. The general adsorption-desorption reaction
between an anion (A-) and an oxide surface (> SOH) can be described as:
k" >SOH + HA .. >SA + H20 (4-1)
kd
where ~ and ka are the rate constants for the adsorption and desorption reactions.
The reactions are monitored by measuring the aqueous concentration of the
adsorbing species as a function of time. The initial rates of the adsorption of As(III),
As(V), Se(IV), and Se(VI) on goethite and birnessite were studied and compared
with the initial rates of adsorption of Mn(II), a cation, on birnessite. The kinetics
and equilibria of As(III) adsorption on goethite were examined in greater detail by
investigating the influence of pH and temperature.
The experimental results are interpreted with a kinetic model that accounts
for both adsorption and desorption. The rate of adsorption (Ra) is a function of the
68
concentrations of the adsorbing species and the reactive surface sites while the rate
of desorption (~) is a function of the concentration of adsorbed species:
~ = ~[>SOH][HA]
~ = ~[>SA]
(4-2)
(4-3)
The total concentration of the reactive surface sites is determined by the product of
the exchange capacity of the oxide surface and the solid concentration of the particle
suspenslOn.
The change in the aqueous concentration of the anion is found by accounting
for both adsorption and desorption:
(4-4)
The expression is solved numerically using the Forward Euler Method (Forsythe et
aI., 1977). The Fortran computer code used to generate the model values is listed
in Appendix B. Values of the rate constants are obtained from the best fit of the
kinetic model to the observed aqueous profiles.
The adsorption of As(V), Se(IV), and Se(VI) on goethite has been described
earlier with a surface complexation model (Chapter 2, Section 3.3). The adsorption
equilibrium of As(III) on goethite is interpreted with a surface complexation model
in order to fill a void in surface chemical modeling data.
4.2 Experimental Methods
4.2.1 Adsorption Kinetic Experiments
The kinetics of adsorption and desorption of aqueous As(III), As(V), Se(IV),
69
and Mn(II) onto metal oxide surfaces were studied by following the disappearance
of the solute over time intervals of minutes to hours. Metal oxide suspensions of
constant ionic strength (0.1 M NaCIO. for As and Mn(II) and 0.001 M NaN~ for
Se) and constant pH (4-10) were prepared in a 250 ml magnetically-stirred double
walled beaker connected to a constant temperature water bath. N2 gas was used to
purge the system of C~. The gas was passed through a column of Ascarite II to
remove any contaminant C~ and rehydrated through a column of D2H.zO before
being introduced into the reaction vessel. Solid concentration was determined
gravimetrically just prior to and following the experiment by filtering 1-3 ml of the
reaction suspension through a 0.2 JJ.m Vniflo filter unit. Solid concentrations of 1-2
giL goethite and 0.2-0.3 giL birnessite were used in order to have a surface site
concentration of approximately 500 JJ.M in each experiment. The aqueous systems
were adjusted to pH 4 with 1.0 M HeIO. to facilitate the removal of aqueous C~.
After at least 3 hours and usually overnight, the pH was readjusted with 0.1 M
HCIO. or NaOH to the planned pH value of the experiment. pH was kept constant
during an experiment with small additions of 0.1 M HCIO. or NaOH when the pH
had drifted ± 0.05 pH units from the initial pH. The oxide suspensions were allowed
to equilibrate for at least two hours at the new pH before a known concentration of
the solute of interest was added to the system and mixed thoroughly. The reaction
was followed by periodically withdrawing and filtering a few milliliters through a 0.2
JJ.m Vniflo filter unit for analysis. The Mn(H) samples were acidified with
concentrated HCI to pH 1 to prevent any oxidation. The effect of temperature on
70
the rate and extent of the As(III) reactions with goethite was studied by conducting
a series of experiments at 15, 25, and 35 0 C.
4.2.2 Adsorption Equilibrium Experiments
Adsorption equilibrium of arsenite onto goethite was studied at various pH
values and an ionic strength of 0.1 M. Goethite suspensions were prepared as
described in Section 4.2.1. The system pH was initially 4 and adjusted with 0.1 M
HCIO .. or 0.1 M NaOH when a different pH value was being studied.
For the adsorption isotherm experiments conducted at a constant pH, a known
amount of arsenite was added to the system and the pH re-adjusted with 0.1 M
HCI04 • After a sufficient equilibrium time (3-16 hours), 2.5 ml of the suspension was
withdrawn and filtered through a 0.2 ~m pre-rinsed Uniflo filter disk. The filtrate
was analyzed for As(III) in solution. More arsenite was then added to the system
and the process repeated until the adsorption of As(III) reached a maximum.
The effect of pH on arsenite adsorption was studied by serial titration of a
goethite suspension amended with 50 ~M arsenite. With the system initially
equilibrated at pH 3.2, arsenite was added and the system re-equilibrated before a
subsample of 3 ml was withdrawn and filtered. The pH of the system was then
raised with 0.1 M NaOH and the system re-equilibrated before another subsample
was withdrawn and filtered. The process continued until the pH reached 11.5. The
filtered subsamples were analyzed for As(III).
71
4.2.3 Chemical Analysis
4.2.3.1. AsCIII): Differential Pulse Polarography
As(III) in filtered samples was determined by a differential pulse polarography
method using a Princeton Applied Research Model 174A polarographic analyzer with
a EG&G P ARC Model 303 Static Mercury Drop Electrode (SMDE) unit (Princeton
Applied Research, 1976). The instrument settings and operation conditions are listed
in Table 4.1. A procedure for a typical analysis was as follows: (i) add blank (9.0-9.8
ml 1 M HCl) and purge for 4-6 minutes to remove any dissolved oxygen and then
scan between -0.25 and -0.50 volts; (ii) add unknown to bring volume to 10 ml, purge
for 2 minutes to remove any dissolved oxygen and to thoroughly mix sample, and
scan; (iii) add 100 J,LI 10-4 M As(III) as a standard, purge for 2 minutes, and scan; and
(iv) add another 100 J,LI 10-4 M As(III) and repeat purge and scan. Concentration of
As(III) in solution is calculated from the following equation:
i v C D [A.s(lll)] =" s I
(i" - i)V (4-5)
where ~ is the peak height of the unknown from the blank
~ is the peak height of the standard addition from the blank
v is the volume of the standard addition
C. is the concentration of the standard addition
V is the initial total volume (before any standard addition)
Df is the dilution factor (Volume of blank/Volume of unknown).
As(III) values from repeated standard additions were averaged and reported.
72
Table 4.1: DPP Instrument Settin~s for As(lII) Analysis
M303 Electrode Mode: Drop Size:
M174A Scan Rate: Direction: Range: Initial Potential: Modulation Amplitude: Operating Mode: Current Range: Drop Time: Offset: Display Direction: Low Pass Filter:
Dropping Mercury Small
2 mY/sec Negative 0.75 volts -0.25 volts 100 mV (PP) Differential Pulse 1 ~A Full Scale 2 sec Off + Off
Detection limits for As(III) using the standard addition method were 0.5 ~M and the
precision of duplicate samples was within 5 percent.
4.2.3.2 As(V): Molybdate Blue Spectrophotometry
A spectrophotometric method for the determination of As(V) was adopted
from Johnson and Pilson (1972) and Oscarson et al. (1980). The method is similar
to the classical molybdate blue method for phosphate determination and is based on
the fact that As(V), like phosphate, forms a blue complex with molybdate, but As(III)
does not. For each sample, 1 mI was mixed with 0.4 ml of a color reagent (mixing
ratio 10:1:3:6 of 5 N sulfuric acid, 0.74 M potassium antimony tartrate, 0.22 M
ammonium molybdate, and 0.01 M ascorbic acid) and diluted to 5 mI. Samples
containing low amounts of As(V) were spiked with an As(V) standard. After 75
minutes of color development, the absorbance was measured on a Hewlett Packard
HP8451 Diode Array Spectrophotometer in a 1 cm quartz cell. The
73
As(V)-molybdate complex has a broad maximum absorbance with the peak at 865
nm and a second broad absorbance peak at 724 nm. The absorbance of the complex
was measured at 724 nm.
4.2.3.3 MnCH): DCP Emission Spectrometty
Mn(II) was determined using a Beckman Spectra Span VB Direct Current
Plasma (DCP) Emission Spectrometer. Filtered samples were acidified with
concentrated HCI and diluted before analysis. Standards were made by dilution of
a 1000 ppm Mn standard solution (VWR). Detection limits were less than 0.3 ~M
and the precision of replicate runs was 2 percent.
4.2.3.4 SeCIV) and SeCVI): Ion Chromatography
Se(IV) and Se(VJ) were determined simultaneously using a Dionex 2020i ion
chromatographic analyzer with a ASA4 anion column and a bicarbonate/carbonate
eluent. 25 JlI eluent stock was added to each 2.5 ml sample before injection. Se(IV)
has a retention time of 1.7 minutes while Se(VJ) elutes at 4.7 minutes. Detection
limits for both oxidation states were 1 JlM and the precision of replicate runs was less
than 1 percent.
4.3 Kinetics of Adsorption
4.3.1 Initial Rate of Adsorption
The initial behavior of As and Se anions following addition to aqueous
suspensions of goethite and birnessite particles was monitored in a set of experiments
at pH 4 and 25 0 C. The initial behavior of Mrr+ (aq) in a birnessite particle
suspension was also monitored at 25 0 C and pH values of 4 and 6. The reaction

74
conditions of each initial rate experiment are listed in Table 4.2 and the experimental
data are listed in Appendix A. Figure 4.1 illustrates the disappearance of the
aqueous species with time at pH 4, 25 0 C, and ionic strength 0.1 M for the As and
Mn experiments and 0.001 M for the Se experiments. The ionic strength of the Se
experiments is lower than in the other experiments as a result of analytical problems
in the determination of Se(IV) and Se(VI) at high salt concentrations. Even though
the experiments were run at different ionic strengths, the Se(IV) results can still be
compared with the As results. Hayes et al. (1987) reported that the adsorption of
Se(IV) on goethite does not change with ionic strength. They attributed the
observation to the formation of an inner sphere complex with Se(lV) and the
goethite surface. Se(VI) forms an outer sphere complex with the surface and no
Se(VI) adsorption was observed in preliminary experiments under similar conditions.
In the goethite suspension, the initial rate of adsorption is nearly identical for
As(V) and Se(IV) with the initial rate of As(III) adsorption slightly slower. However,
As(V) is adsorbed to the greatest extent, with only 40 percent of the initial
concentration remaining in solution after 60 minutes. After the same reaction
period, 50 percent of the initial Se(IV) and 65 percent of the initial As(III) still
remains in solution.
In the birnessite suspension, the initial rate of adsorption appears to be the
greatest for Mn(II), followed by As(lIl) and Se(IV). There was no As(V) adsorption
on the birnessite surface at pH 4 over a time period of 120 minutes. The initial rates
can be qualitatively linked to the effect of the electrostatic charge on the birnessite
75
Table 4.2: Reaction conditions of adsorption kinetics experiments
I Expt. I Solute I Conc. (~M) I Oxide I [SOH] (~M) I pH I G4AS3 As(III) 100 G 541 4
B4AS3 As(III) 100 B 478 4
G4AS5 As(V) 50.1 G 619 4
B4AS5 As(V) 100 B 478 4
G4SE4 Se(1V) 100 G 490 4
B4SE4 Se(IV) 100 B 478 4
B4MN2 Mn(II) 98.9 B 478 4
B6MN2 Mn(II) 98.8 B 478 6 (j = GoethIte, B = BIrneSSIte, SOH = Surt-ace metal group; T = 25 vL, N2(g purge
surface. At pH 4, the birnessite surface is slightly negatively charged (pI\pc = 2.7),
Mn(II) is a bivalent cation (Mrr+ ), As(III) is a neutral species (HsAs<\), and Se(IV)
is an anion (HSe<\ -). The observations suggest that under the experimental
conditions, the more positive the charge of the species is, the faster the initial rate
of adsorption of the species on birnessite.
After 60 minutes of reaction, Mn(II) and Se(IV) are approaching equilibrium
with the surface. Seventy percent of the initial Mn(II) and 82 percent of the initial
Se(IV) remain in solution, whereas only 2 percent of the initial As(IU) remains in
solution. The rapid depletion of As(III) from solution is the result of additional
processes affecting the As(III) concentration. A fast redox reaction between
adsorbed As(IU) and surface Mn(IV) and a rapid release of the products As(V) and
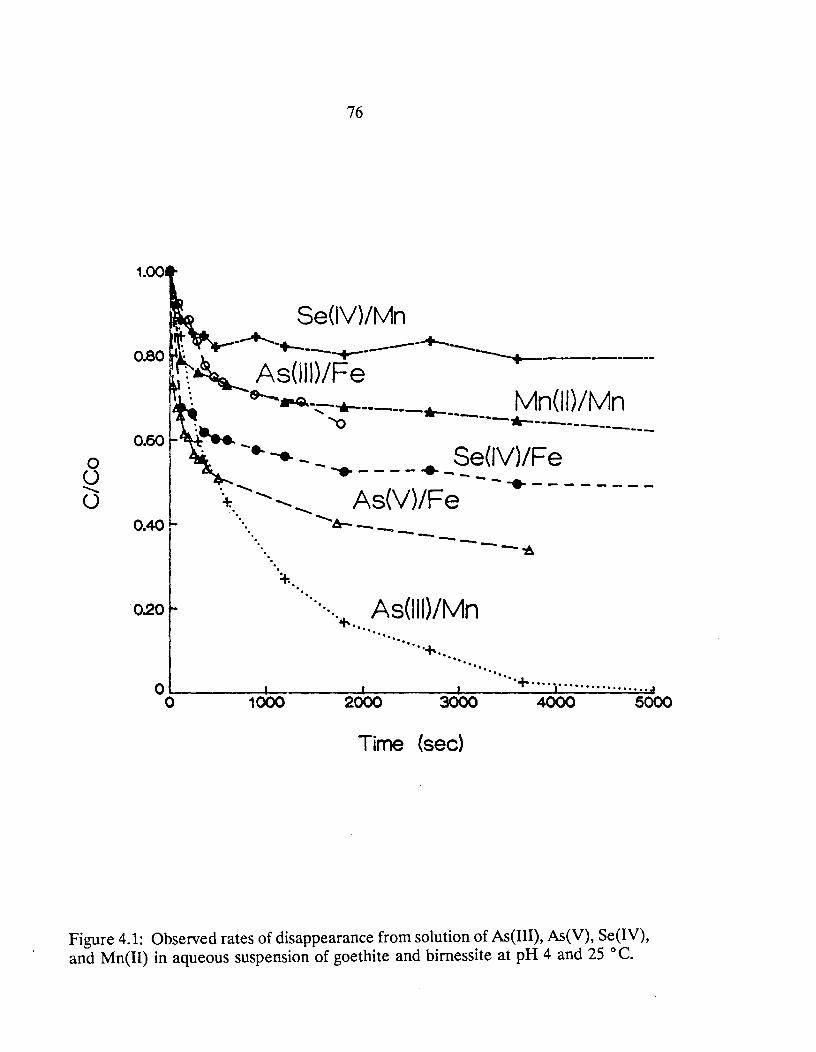
o o ........ o
0.60
0.40
0.20
76
,-------
:~
. -.. -..-_ .... ____ .. _~e(/V)/Fe . ........ ---.--------+'. ........ ........ " As(V)/Fe
'. ........,IL &J- __
----..-----....
"'or, As(lll)/Mn ......
~ .....
'" '" "+" .... "
---6
'" '" "+ O~ ____ ~~ _____ ~I~ ____ ~I~ __ ~"_")L"~"~"~"'~"~"~"'~'d o 1000 2000 3000 4000 5000
Time (sec)
Figure 4.1: Observed rates of disappearance from solution of As(III), As(V), Se(IV), and Mn(II) in aqueous suspension of goethite and birnessite at pH 4 and 25 0 C.
77
Mn(II) allows additional As(UI) to be absorbed. Reactions between As(IU) and
birnessite are discussed in Chapter 5.
The initial rate of As(V) and Se(IV) adsorption on birnessite is slower than
on goethite at pH 4. The results suggest an apparent ele<:trostatic effect between the
oxide surface and the solutes. At the pH of the experiments, the goethite surface is
positively charged, the birnessite surface is slightly negatively charged, and As(V) and
Se(IV) are both negatively charged species. Thus, the rate of adsorption on goethite
is enhanced by the electrostatic attraction between the surface and the anion, while
the rate of adsorption on birnessite is hindered by a small electrostatic repulsion.
The experimental data were interpreted with the kinetic model and the values
of the fitted rate constants are listed in Table 4.3. The results at pH 4 indicate the
rate constants for the reactions between the various solutes and oxide surfaces are
approximately equivalent, ranging from 2 to 8 M-lsec- 1 for 1<a and 0.002 to 0.005 sec!
for kd. The only exception is the value of kd for As(III) desorption from birnessite,
which is an order of magnitude greater than the other kd values. The values of k"a
and kd for the As(III)-birnessite data set are extracted with a more complex kinetic
model which includes steps for electron transfer, release and re-adsorpion of the
products As(V) and Mn(II).
4.3.2 Effect of pH on Mn(II) Adsorption on Birnessite
The extent of Mn(II) adsorption on birnessite increases with pH (Murray,
1975). The experimental results indicate that the rate of adsorption also increases
with pH (Figure 4.2). The value of the rate constant 1<a increases from 5 M-1sec- 1 at
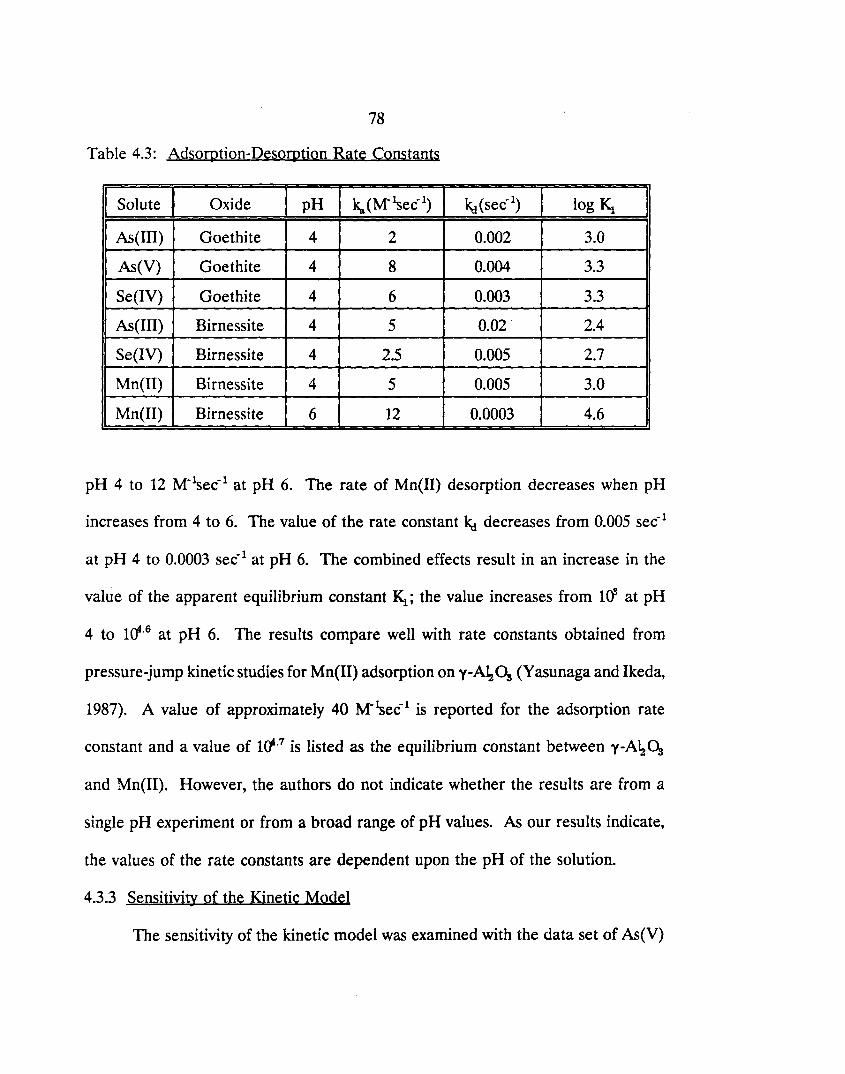
78
Table 4.3: Adsorption-Desorption Rate Constants
I Solute I Oxide I pH I ka(M-lgec- 1) I ~(sec-l) I log Kl I As (III) Goethite 4 2 0.002 3.0
As(V) Goethite 4 8 0.004 3.3
Se(IV) Goethite 4 6 0.003 3.3
As(III) Birnessite 4 5 0.02 2.4
Se(IV) Birnessite 4 2.5 0.005 2.7
Mn(II) Birnessite 4 5 0.005 3.0
Mn(II) Birnessite 6 12 0.0003 4.6
pH 4 to 12 M-~ec-l at pH 6. The rate of Mn(I1) desorption decreases when pH
increases from 4 to 6. The value of the rate constant ~ decreases from 0.005 sec- 1
at pH 4 to 0.0003 sec-1 at pH 6. The combined effects result in an increase in the
value of the apparent equilibrium constant ~; the value increases from 1()'J at pH
4 to 1{f·6 at pH 6. The results compare well with rate constants obtained from
pressure-jump kinetic studies for Mn(II) adsorption on y-~Os (Yasunaga and Ikeda,
1987). A value of approximately 40 M-lgec1 is reported for the adsorption rate
constant and a value of 1{f·7 is listed as the equilibrium constant between y-~~
and Mn(II). However, the authors do not indicate whether the results are from a
single pH experiment or from a broad range of pH values. As our results indicate,
the values of the rate constants are dependent upon the pH of the solution.
4.3.3 Sensitivity of the Kinetic Model
The sensitivity of the kinetic model was examined with the data set of As(V)
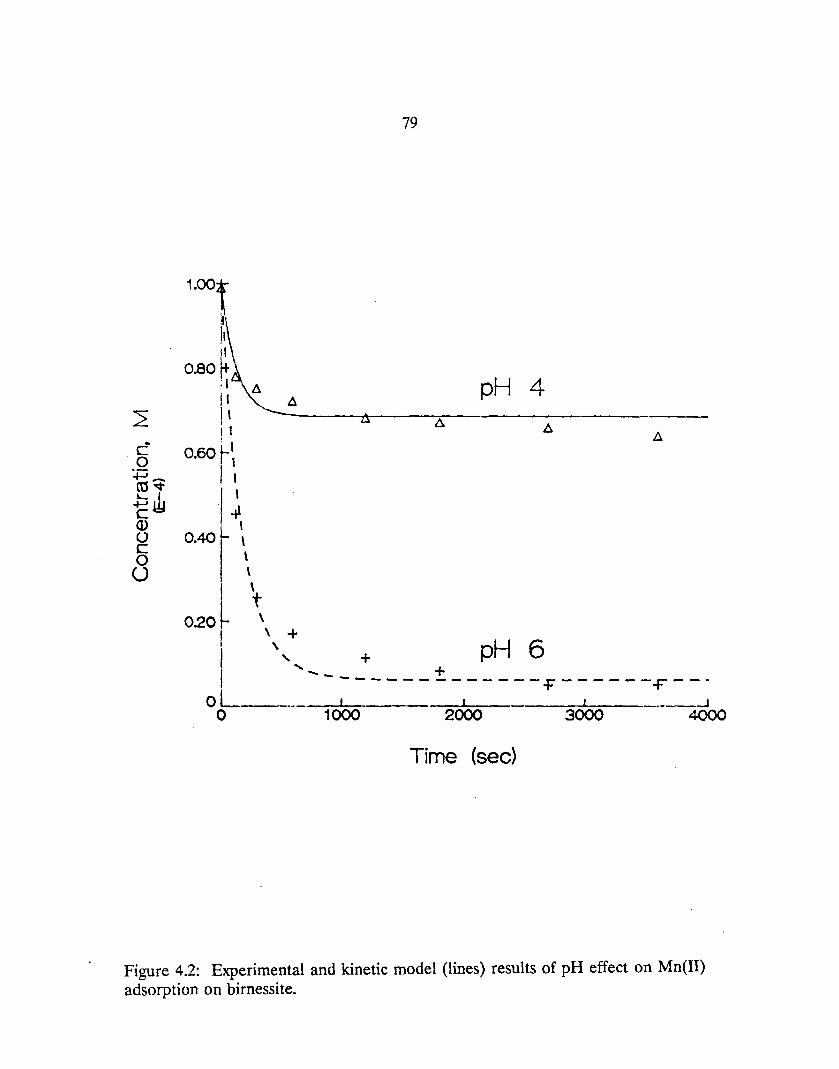
co :p(O~
~lL c Q) () c o U
1.oot ~
II II
0.80~ ; I II A II I
I I ! I
0.60 r I I I
I~ 0.40 L ~
\ \
o20l \ ! \ +
79
pH 4
A
+ pH 6 I " I '---- + -----------~------~--. oL ___ _ o 1000 2000
Time (sec)
3000 ----!
4000
Figure 4.2: Experimental and kinetic model (lines) results of pH effect on Mn(I1) adsorption on birnessite.
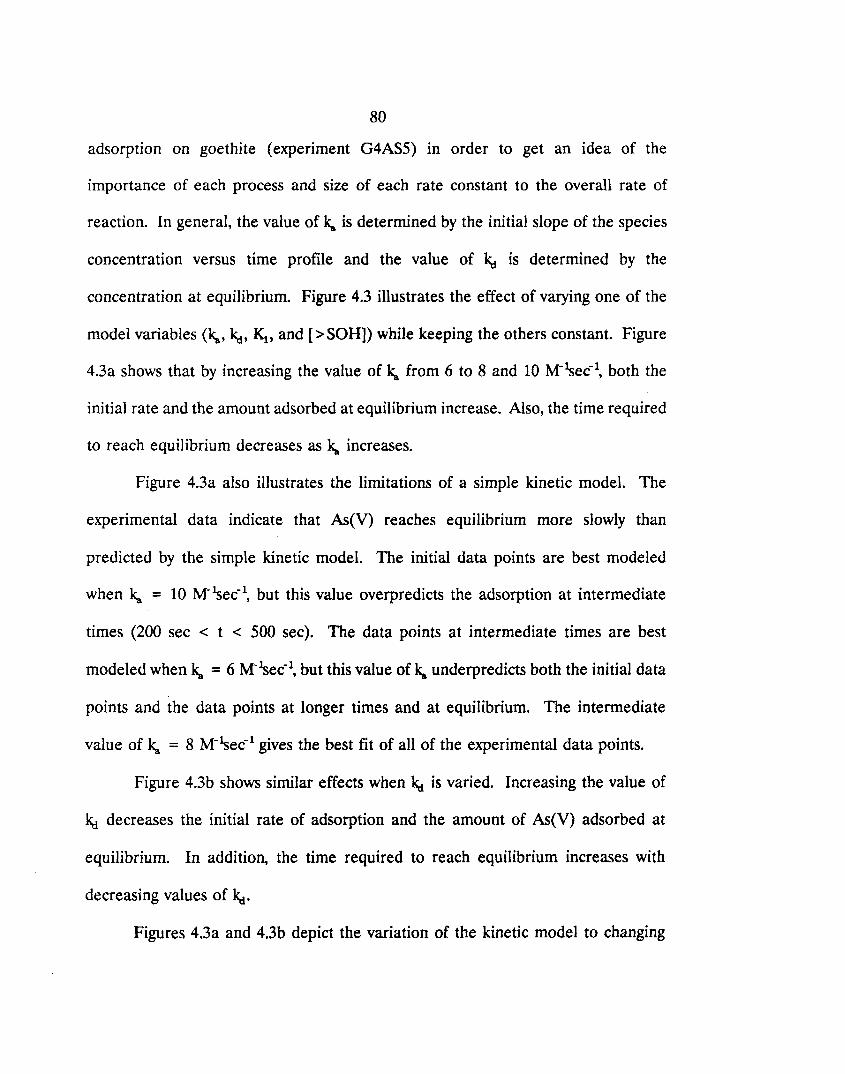
80
adsorption on goethite (experiment G4AS5) in order to get an idea of the
importance of each process and size of each rate constant to the overall rate of
reaction. In general, the value of ~ is determined by the initial slope of the species
concentration versus time profile and the value of ~ is determined by the
concentration at equilibrium. Figure 4.3 illustrates the effect of varying one of the
model variables (~, ~, ~, and [>SOH]) while keeping the others constant. Figure
4.3a shows that by increasing the value of ~ from 6 to 8 and 10 M-lsec-1, both the
initial rate and the amount adsorbed at equilibrium increase. Also, the time required
to reach equilibrium decreases as ka increases.
Figure 4.3a also illustrates the limitations of a simple kinetic model. The
experimental data indicate that As(V) reaches equilibrium more slowly than
predicted by the simple kinetic model. The initial data points are best modeled
when ~ = 10 M-lsec-l, but this value overpredicts the adsorption at intermediate
times (200 sec < t < 500 sec). The data points at intermediate times are best
modeled when ~ = 6 M-lsec-1, but this value of ~ underpredicts both the initial data
points and the data points at longer times and at equilibrium. The intermediate
value of ~ = 8 M-lgec-1 gives the best fit of all of the experimental data points.
Figure 4.3b shows similar effects when ~ is varied. Increasing the value of
~ decreases the initial rate of adsorption and the amount of As(V) adsorbed at
equilibrium. In addition, the· time required to reach equilibrium increases with
decreasing values of ~.
Figures 4.3a and 4.3b depict the variation of the kinetic model to changing
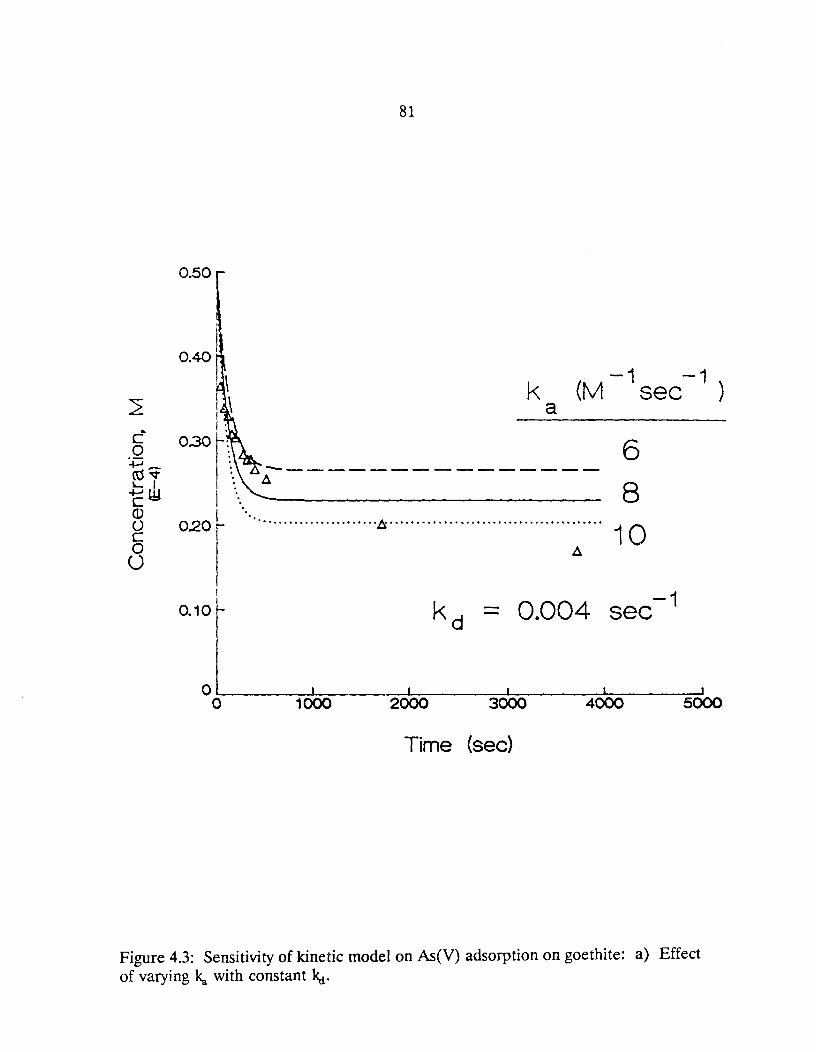
c .0 ~-ro~ L...J
1:~ Cl) o c o o
0.50
0.40'
\ \
81
k a
-1 -1 (M sec )
----------------6
8
10
11
I 020 L .......................... /s. ••••••..•••.••..•••••.•••.. .•••.••••••.•
11
0.004 sec-1 I
O.10r o L..---.-I -l---! I I
o 1000 2000 3000 4000 5000
Time (sec)
Figure 4.3: Sensitivity of kinetic model on As(V) adsorption on goethite: a) Effect of varying ~ with constant ~.
c o +:i_ (\j~ ~I
1:: W (])
0.50
() 0.20 c o U
0.10 I
I
"
82
k (sec- 1) d
-------
---------------- 0.006
0.004
A " . .................................................... _ ........ 0002 .
0~1_ 1dbo·~--·---2~dbo'~-----3~OOO~'~----4-000~'~-----5~600 o
Time (sec)
Figure 4.3: Sensitivity of kinetic model on As(V) adsorption on goethite: b) Effect of varying kd with constant ~.
83
values of the equilibrium constant. Figure 4.3c illustrates the effect of changing both
rate constants but keeping the same ratio between the rate constants (Le., the value
of Kl is not changed), The predicted equilibrium concentration does not change, but
by increasing the value of the rate constants, the initial rate increases, and the time
to reach equilibrium is shortened.
The influence of the initial concentration of reactive surface sites [> SOH1,
is examined in Figure 4.3d. By varying [>SOH1, the initial rate, the time to
equilibrium, and the equilibrium concentration are all affected. For a goethite
suspension, the difference between the surface site concentrations of 520 and 720 ).LM
is equivalent to differences in solid concentrations of 1.6 and 2.2 giL.
The simple kinetic model may be improved by adding parallel reactions
involving a range in the reactivity of the surface groups. For example, instead of
considering the mineral surface to be homogeneous in reactivity, the surface can be
divided into groups with varying reactivity. Infrared spectroscopic studies have
indicated the existence of different types of hydroxyl sites on metal oxides (Boehm,
1971; Parfitt et aI., 1977)." Yates (1975) reported that the different exposed crystal
planes of goethite vary in respect to the number of ionizable protons per nM. The
surface crystal planes 100,010, and 001 make up 60, 35 and 5 percent of the surface,
respectively, and have a calculated number of ionizable protons per nnr of 13.4,21.8,
and 22.0, respectively, with an average of 16.6 ionizable protons per nnr. It may be
possible that the number of sites on a crystal plane influences the reactivity of the
sites. Dzombak and Morel (1990) present a surface complexation model in which
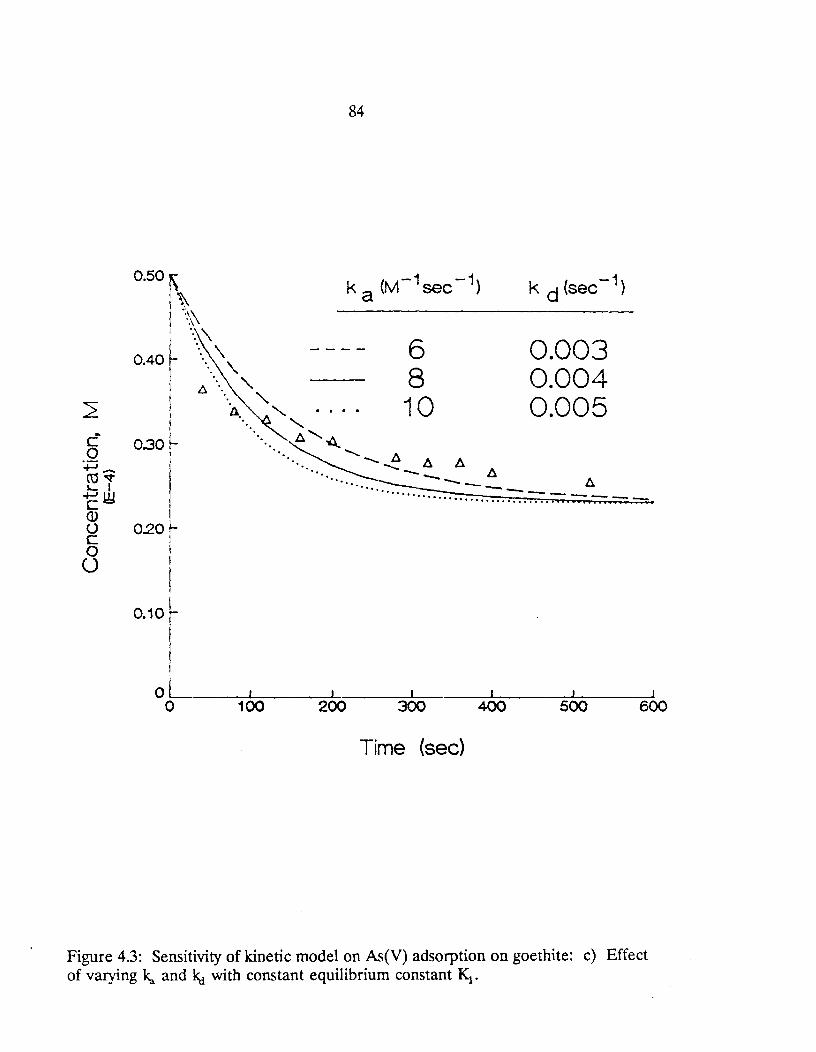
c o ~lU~ 1...1 +-'1:!l C <D o c o U
0.50 r\ i~ I \\ : ", \.
I .... \ 0.40 ", "-
D. .... '\.
84
I ','\. ! l\." . ...
6 8 10
0.003 0.004 0.005 , ',,-
0.30 ~ ',A '-4.. , '-.. A A A
--- A --_ A ..... -----------.........................
0.20 t-I
i I
I 0.10 L
I
O~ ____ ~/~ ____ ~I _______ ~I _______ ~/ _______ I~ ____ ~I o 100 200 300 400 500 600
Time (sec)
Figure 4.3: Sensitivity of kinetic model on As(V) adsorption on goethite: c) Effect of varying ~ and ~ with constant equilibrium constant ~.
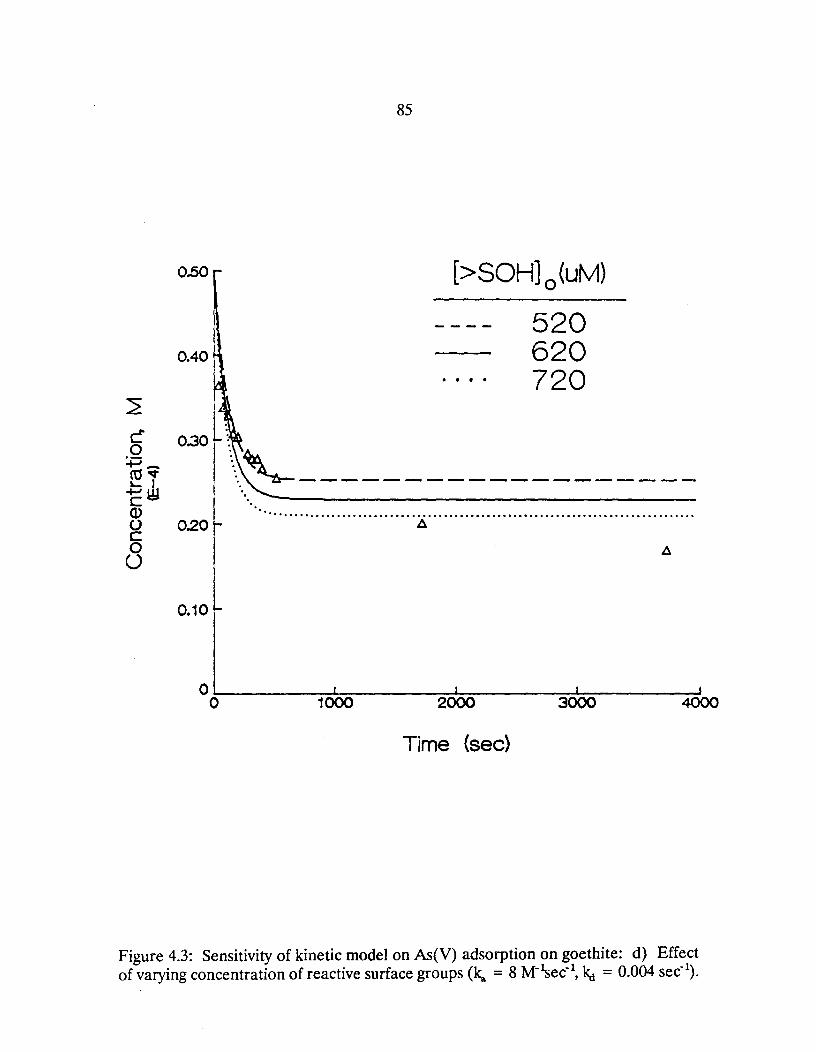
0.50
0.40
:2 C 0.30 o +i_ ro~
-P~ c (l) () 0.20 c o o
0.10
85
[>SOH]o(uM}
520 620
. . . . 720
\.~-------------------'. .......... .................... ~ ................................................. .
f:l
o~ ______ ~~~ ______ ~~ ______ -=~~ ______ ~ o 1000 2000 3000 4000
Time (sec)
Figure 4.3: Sensitivity of kinetic model on As(V) adsorption on goethite: d) Effect of varying concentration of reactive surface groups (~ = 8 M-lsec-l, kd = 0.004 sec-I).
86
two site types are required to describe cation sorption while only one site type is
necessary to describe anion adsorption. For cation sorption, both site types are
considered to have the same proton binding characteristics. The site types are
divided into strong or high affinity bindings sites and weak or low affinity binding
sites. In their model, the concentration of low affinity sites is typically much larger
than the concentration of high affinity sites.
For simplicity, consider a two site model where the reactivity of > SA OR sites
is greater than the reactivity of > Sa OR sites. Two possible parallel reactions are
described as:
The values of the rate constants for these reactions are of the order:
~.A > ~.B
kd.A > kd.B
(4-6)
(4-7)
For the set of mechanisms, the overall rate of reaction of As(III) is expressed as:
(4-8)
87
The numerical solution of this equation requires information about the number of
each type of group on the heterogeneous surface. Spectroscopic studies may be
useful in providing the necessary information for the model.
In order to illustrate improvements in the kinetic model, the assumption of
an approximately equal number of "A" and "B" sites is made. Figure 4.4a shows the
success of the two site model in describing the adsorption of As(V) on goethite. The
two site model fits the experimental data well at all times. For comparison, the best
fit of the one site model is also shown. The values of the rate constants are:
One Site Model
~ = 8 M-~ec-l
~ = 0.004 sec-1
Two Site Model
~,A = 0.01 sec-1
~,B = 2 M-~ec-l
~,B = 0.0003 sec-1
Figure 4.4b illustrates the relative importance of each type of site to the overall rate
of reaction. As(V) reacts rapidly with the type A sites and reaches equilibrium
quickly. At the same time As(V) also reacts with type B sites although at a much
slower rate. The adsorption of As(V) at type B sites affects the equilibrium at type
A sites. As(V) adsorbed at type A sites begins to desorb as a consequence of less
As(V) in solution. At equilibrium, the model predicts that more As(V) is adsorbed
at type B sites than type A sites.
The rate constants are highly dependent upon the concentration of surface
sites. In order to predict the same initial rate as the one site model, the rate
constant ~,A had to be more than doubled that of kl as a result of the concentration
of surface sites being almost halved. Also, the larger equilibrium constant K1,B is
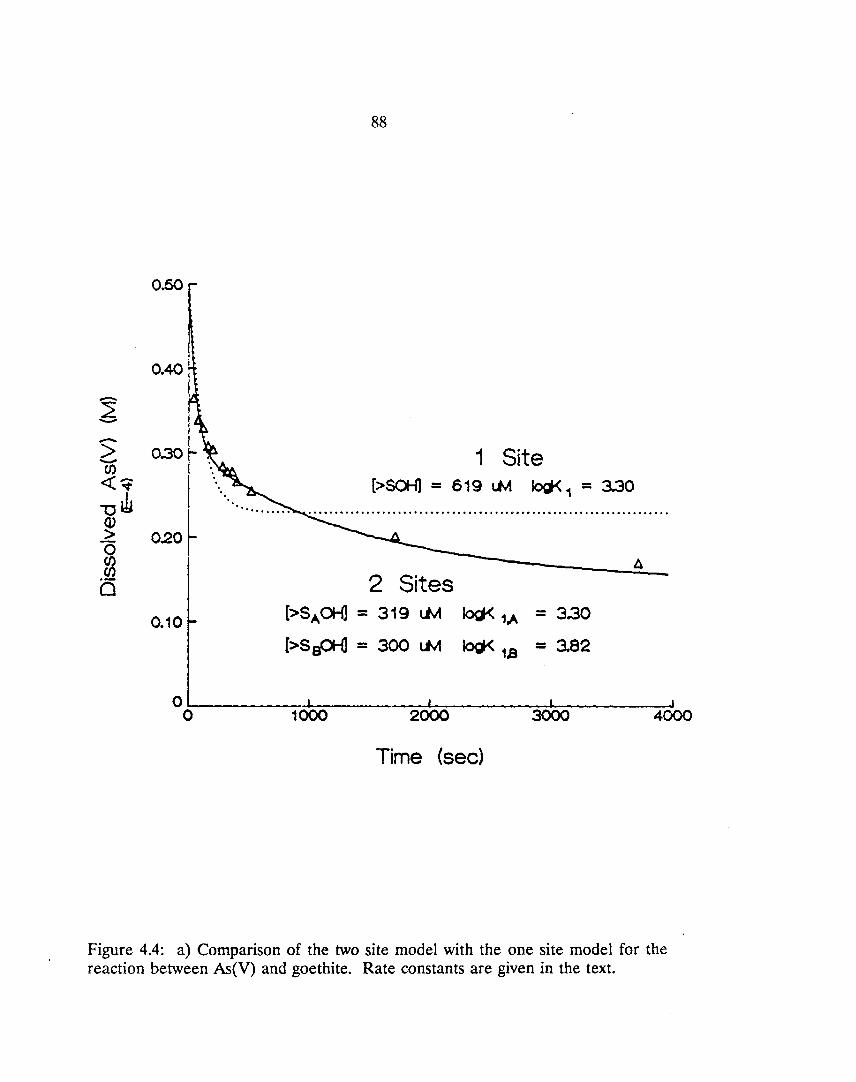
88
0.50
-L - I - I > 0.30 t- " -(/) 1 Site
«~ "
-C~ 020~ <l>
> 0 ~ (:)
[>SOH) = 619 l.M log.< 1 = 3.30
2 Sites A
0.10 [>5 A OH] = 319 t.M Jog< 1,A - 3.30
[>5 aOHl = 300 LM Jog< 1.8 - 3.82
o~ ________ ~~ ______ ~~ ________ ~~ ______ ~ o 1000 2000 3000 4000
Time (sec)
Figure 4.4: a) Comparison of the two site model with the one site model for the reaction between As(V) and goethite. Rate constants are given in the text.
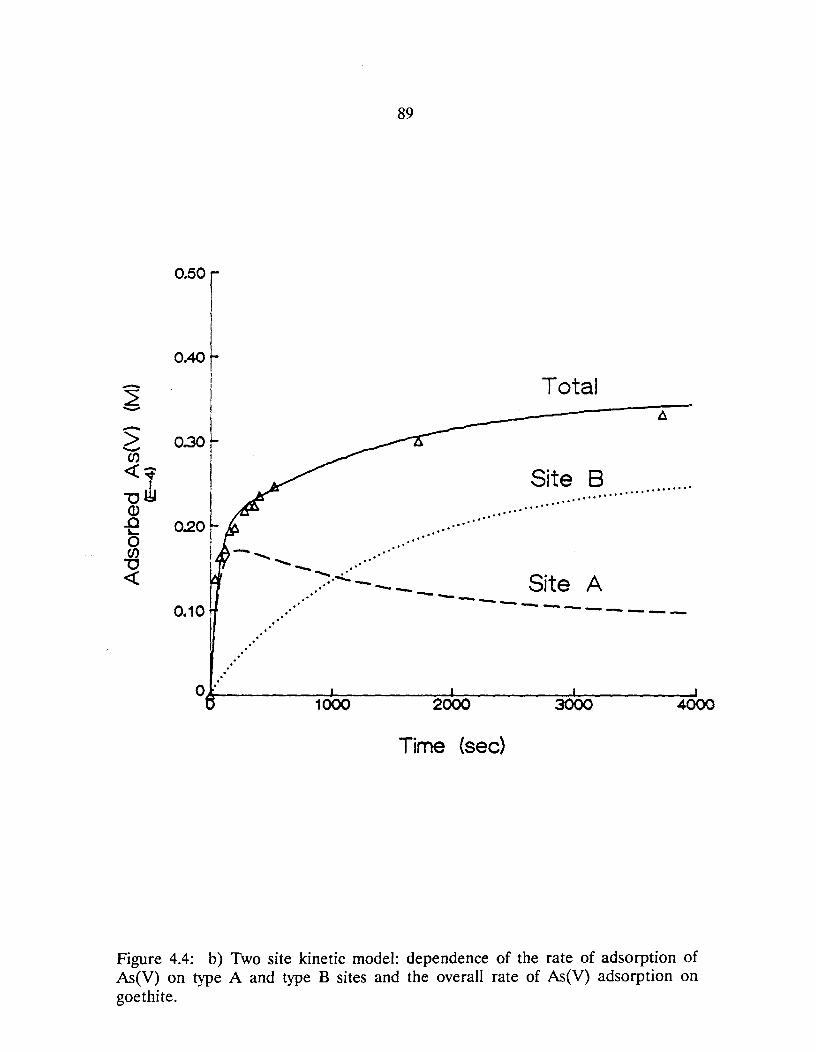
0.50
" "
"
89
,.' ."
---", ", ", ,.'
.... ....
Total A
Site 8 , ................ ..... ..... .....
Site A --- ---. ....... ----- ---- ...... _--
2000 3000 4000
Time (sec)
Figure 4.4: b) Two site kinetic model: dependence of the rate of adsorption of As(V) on type A and type B sites and the overall rate of As(V) adsorption on goethite,
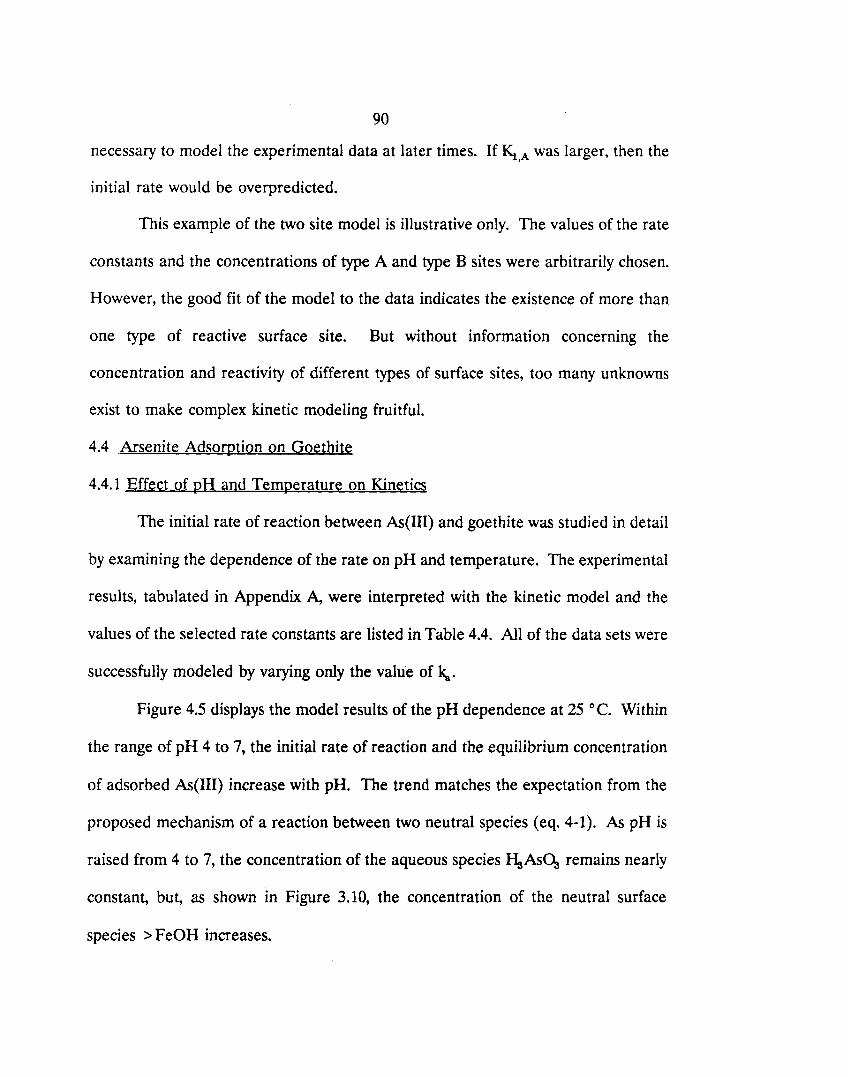
90
necessary to model the experimental data at later times. If Kl A was larger, then the ,
initial rate would be overpredicted.
This example of the two site model is illustrative only. The values of the rate
constants and the concentrations of type A and type B sites were arbitrarily chosen.
However, the good fit of the model to the data indicates the existence of more than
one type of reactive surface site. But without information concerning the
concentration and reactivity of different types of surface sites, too many unknowns
exist to make complex kinetic modeling fruitful.
4.4 Arsenite Adsorption on Goethite
4.4.1 Effect of pH and Temperature on Kinetics
The initial rate of reaction between As(III) and goethite was studied in detail
by examining the dependence of the rate on pH and temperature. The experimental
results, tabulated in Appendix A, were interpreted with the kinetic model and the
values of the selected rate constants are listed in Table 4.4. All of the data sets were
successfully modeled by varying only the value of ka.
Figure 4.5 displays the model results of the pH dependence at 25 0 C. Within
the range of pH 4 to 7, the initial rate of reaction and the equilibrium concentration
of adsorbed As(III) increase with pH. The trend matches the expectation from the
proposed mechanism of a reaction between two neutral species (eq. 4-1). As pH is
raised from 4 to 7, the concentration of the aqueous species I\As(\ remains nearly
constant, but, as shown in Figure 3.10, the concentration of the neutral surface
species> FeOH increases.
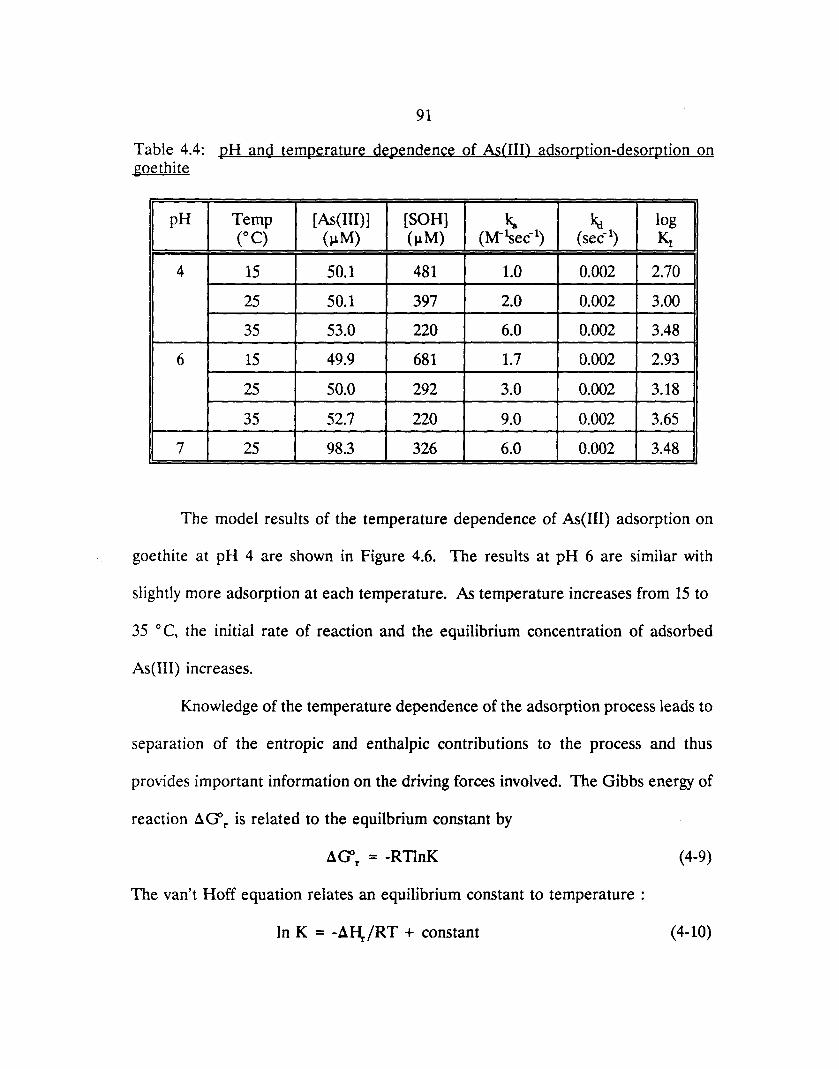
91
Table 4.4: pH and temperature dependence of As(III) adsorption-desorption on goethite
pH Temp [As(III)] [SOH] ~ ko log (OC) (~M) (~M) (M-lsec- l ) (sec-I) KI
4 15 50.1 481 1.0 0.002 2.70
25 50.1 397 2.0 0.002 3.00
35 53.0 220 6.0 0.002 3.48
6 15 49.9 681 1.7 0.002 2.93
25 50.0 292 3.0 0.002 3.18
35 52.7 220 9.0 0.002 3.65
7 25 98.3 326 6.0 0.002 3.48
The model results of the temperature dependence of As(III) adsorption on
goethite at pH 4 are shown in Figure 4.6. The results at pH 6 are similar with
slightly more adsorption at each temperature. As temperature increases from 15 to
35 ° C, the initial rate of reaction and the equilibrium concentration of adsorbed
As(III) increases.
Knowledge of the temperature dependence of the adsorption process leads to
separation of the entropic and enthalpic contributions to the process and thus
provides important information on the driving forces involved. The Gibbs energy of
reaction fl. G'r is related to the equilbrium constant by
fl.CJl = -RTlnK r (4-9)
The van't Hoff equation relates an equilibrium constant to temperature :
In K = -AHJRT + constant (4-10)
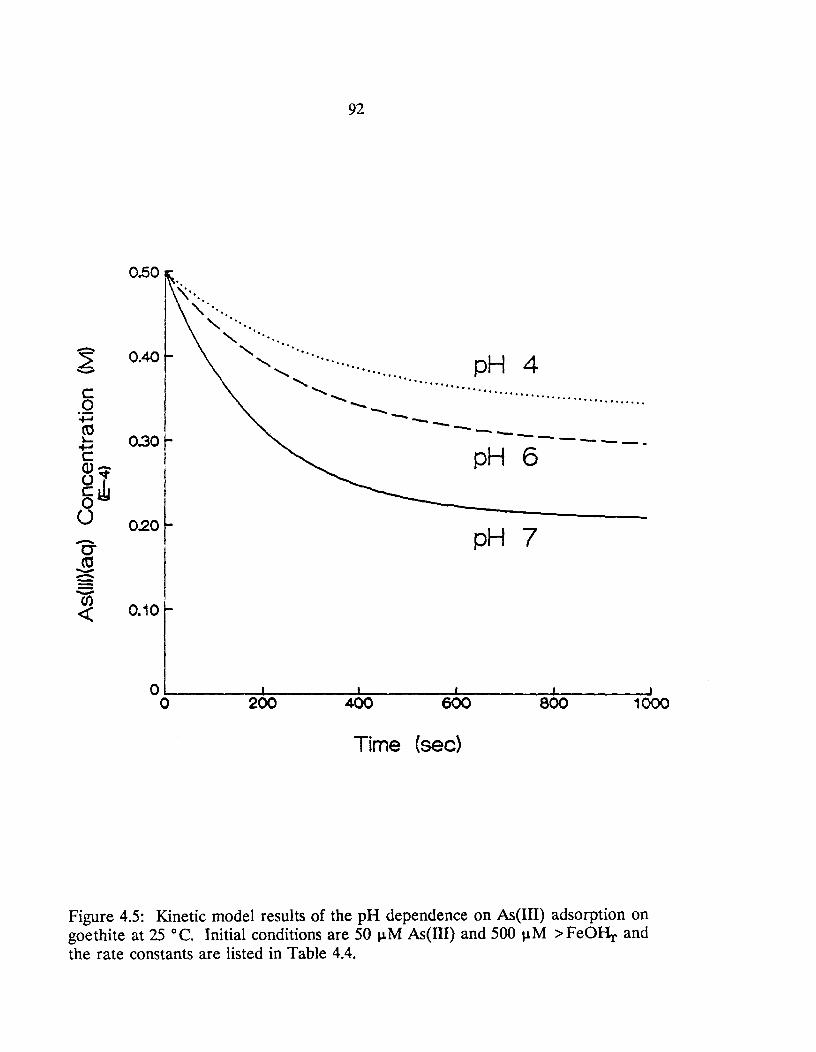
92
0.50
\'" " ..... " ..... "-
0.40
0.30~
02J
" '" "....... pH 4 ......... . ...... . " ..... ..................... - ..................................... .
--------- -..... - -- --- -pH 6
pH 7
0.10
O~------~~--____ ~--____ ~ ______ ---L--____ ~ o 200 400 600 800 1000
Time (sec)
Figure 4.5: Kinetic model results of the pH dependence on As(III) adsorption on goethite at 25°C. Initial conditions are 50 \.1M As(III) and 500 \.1M >FeOHr and the rate constants are listed in Table 4.4.
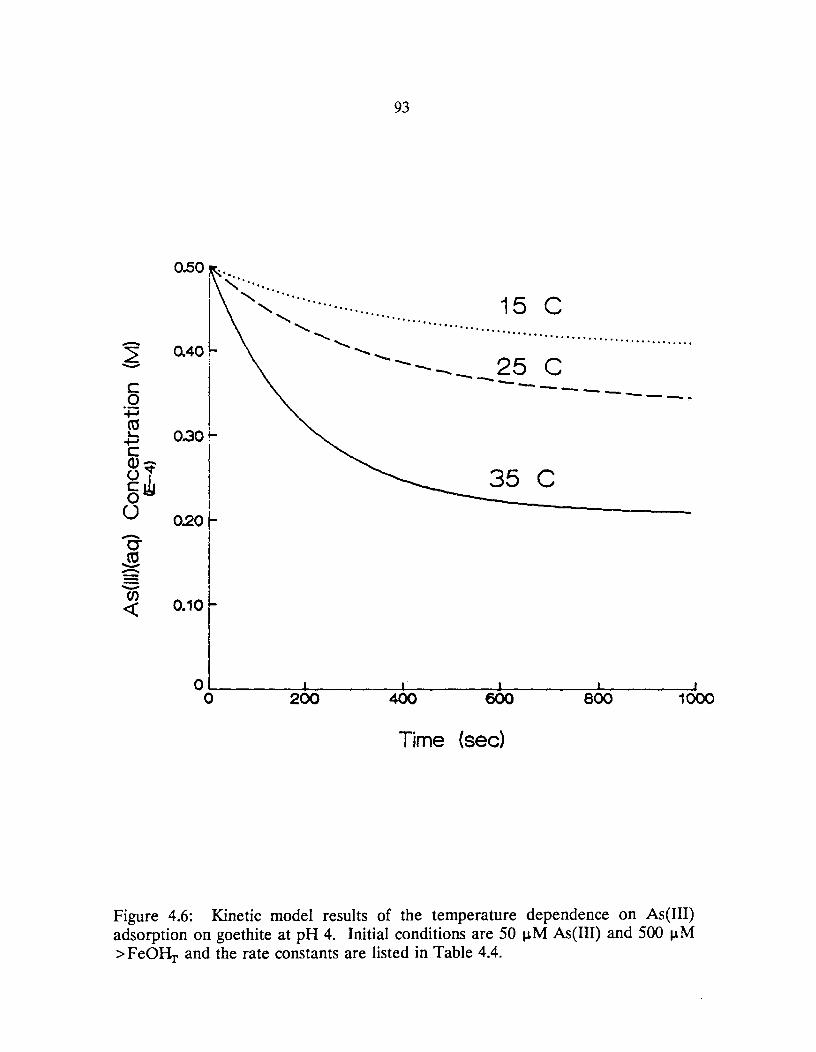
-0-ro --::::
.::::;
0.50
0.40,
O~l I I I
Q.20 t
93
.. , .... ..... ....... . "" ". '- .... "' ......... . " ........ . ....... .. ....... .
..................
15 C ............... . ......................... .
-.....-..... --__ 25 C --- ----- ---.
---. - ----
35 C
(/) <{ 0.10
O~ ______ ~~ ____ ~~ ______ ~ ________ -L ______ ~
o 200 400 600 800 1000
Time (sec)
Figure 4.6: Kinetic model results of the temperature dependence on As(III) adsorption on goethite at pH 4. Initial conditions are 50 J,LM As(I1I) and 500 J,LM > FeOHr and the rate constants are listed in Table 4.4.
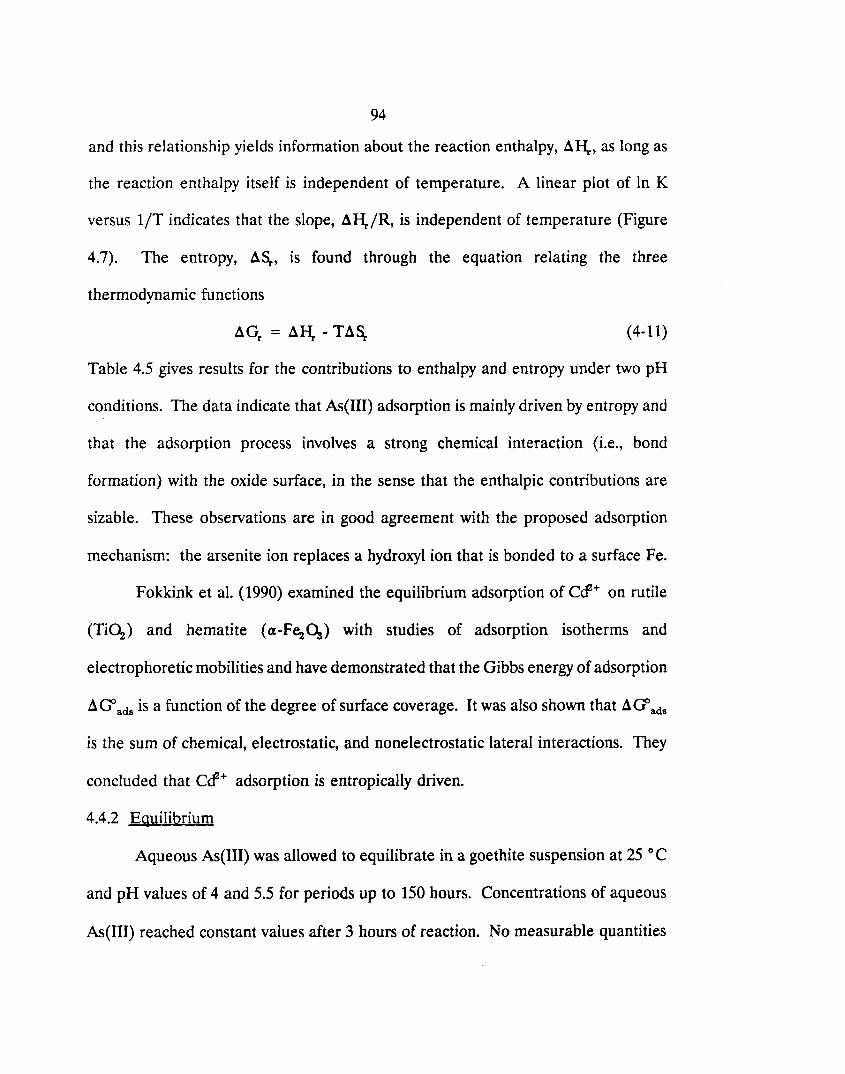
94
and this relationship yields information about the reaction enthalpy, Af\., as long as
the reaction enthalpy itself is independent of temperature. A linear plot of In K
versus liT indicates that the slope, Af\/R, is independent of temperature (Figure
4.7). The entropy, A~, is found through the equation relating the three
thermodynamic functions
(4-11)
Table 4.5 gives results for the contributions to enthalpy and entropy under two pH
conditions. The data indicate that As(III) adsorption is mainly driven by entropy and
that the adsorption process involves a strong chemical interaction (Le., bond
formation) with the oxide surface, in the sense that the enthalpic contributions are
sizable. These observations are in good agreement with the proposed adsorption
mechanism: the arsenite ion replaces a hydroxyl ion that is bonded to a surface Fe.
Fokkink et al. (1990) examined the equilibrium adsorption of ccf+ on rutile
(Ti~) and hematite (a-F~~) with studies of adsorption isotherms and
electrophoretic mobilities and have demonstrated that the Gibbs energy of adsorption
A G' ads is a function of the degree" of surface coverage. It was also shown that A G' ads
is the sum of chemical, electrostatic, and nonelectrostatic lateral interactions. They
concluded that ccf+ adsorption is entropically driven.
4.4.2 Equilibrium
Aqueous As(III) was allowed to equilibrate in a goethite suspension at 25 0 C
and pH values of 4 and 5.5 for periods up to 150 hours. Concentrations of aqueous
As(III) reached constant values after 3 hours of reaction. No measurable quantities
9
I 8r
7
6
I I j
'.
"
95
• ..• .&
" . " + .....
'" pH 6
" " " " ,6.'. " -".
PH 4 " ~" "" ..... ~ " .... " '. ,,+ '.
" " " " g~~1~----~~----~O~~~----~O~~----~O~~~5~-----JO~6
(E-2)
1/T(K)
Figure 4.7: van't Hoff plot of the experimentally-derived equilibrium constants and best-fit lines for As(III) adsorption-desorption at pH 4 and pH 6. The slope of each line is equal to -.:1HJR.
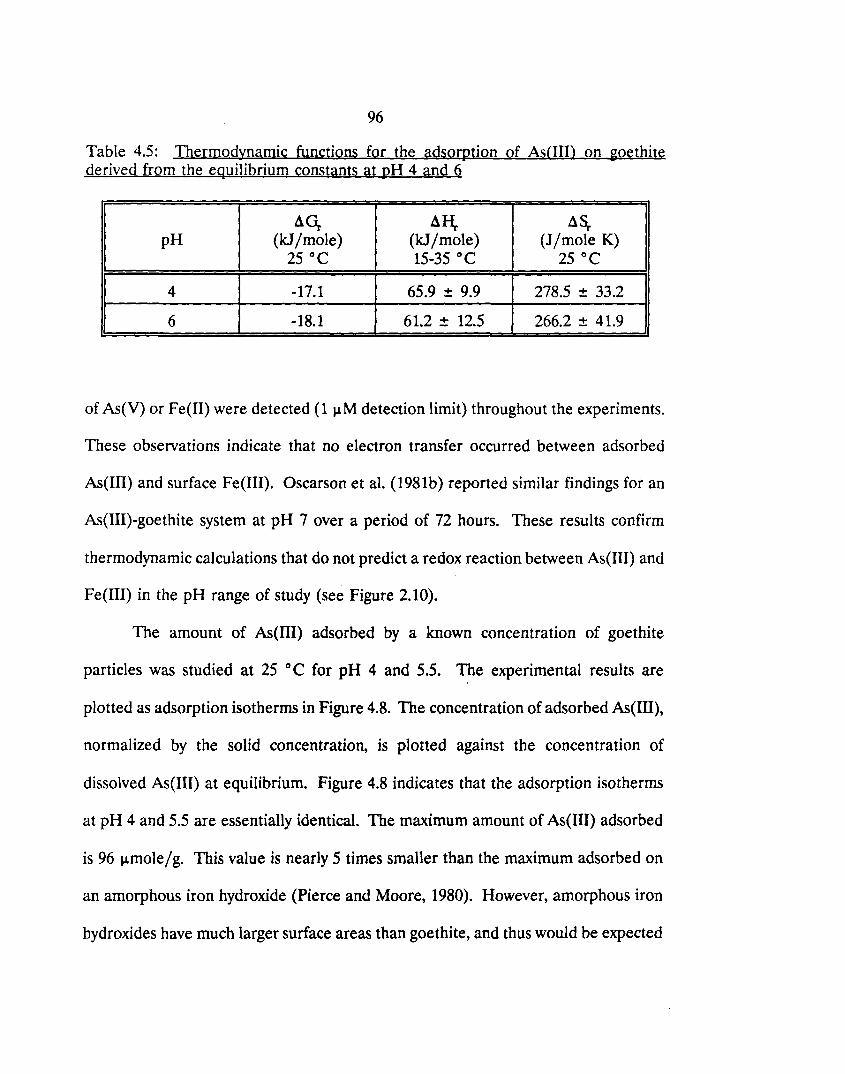
96
Table 4.5: Thermodynamic functions for the adsorption of As(III) on ~oethite derived from the equilibrium constants at pH 4 and 6
A~ Af\ A~ pH (kllmole) (kJ/mole) (J/mole K)
25°C 15-35°C 25°C
4 -17.1 65.9 ± 9.9 278.5 ± 33.2
6 -18.1 61.2 ± 12.5 266.2 ± 41.9
of As(V) or Fe (II) were detected (1 ~M detection limit) throughout the experiments.
These observations indicate that no electron transfer occurred between adsorbed
As(III) and surface Fe(III). Oscarson et al. (1981b) reported similar findings for an
As(I1I)-goethite system at pH 7 over a period of 72 hours. These results confirm
thermodynamic calculations that do not predict a redox reaction between As(I1I) and
Fe (III) in the pH range of study (see Figure 2.10).
The amount of As(III) adsorbed by a known concentration of goethite
particles was studied at 25 ° C for pH 4 and 5.5. The experimental results are
plotted as adsorption isotherms in Figure 4.8. The concentration of adsorbed As(III),
normalized by the solid concentration, is plotted against the concentration of
dissolved As(III) at equilibrium. Figure 4.8 indicates that the adsorption isotherms
at pH 4 and 5.5 are essentially identical. The maximum amount of As(IIl) adsorbed
is 96 ~mole/g. This value is nearly 5 times smaller than the maximum adsorbed on
an amorphous iron hydroxide (Pierce and Moore, 1980). However, amorphous iron
hydroxides have much larger surface areas than goethite, and thus would be expected
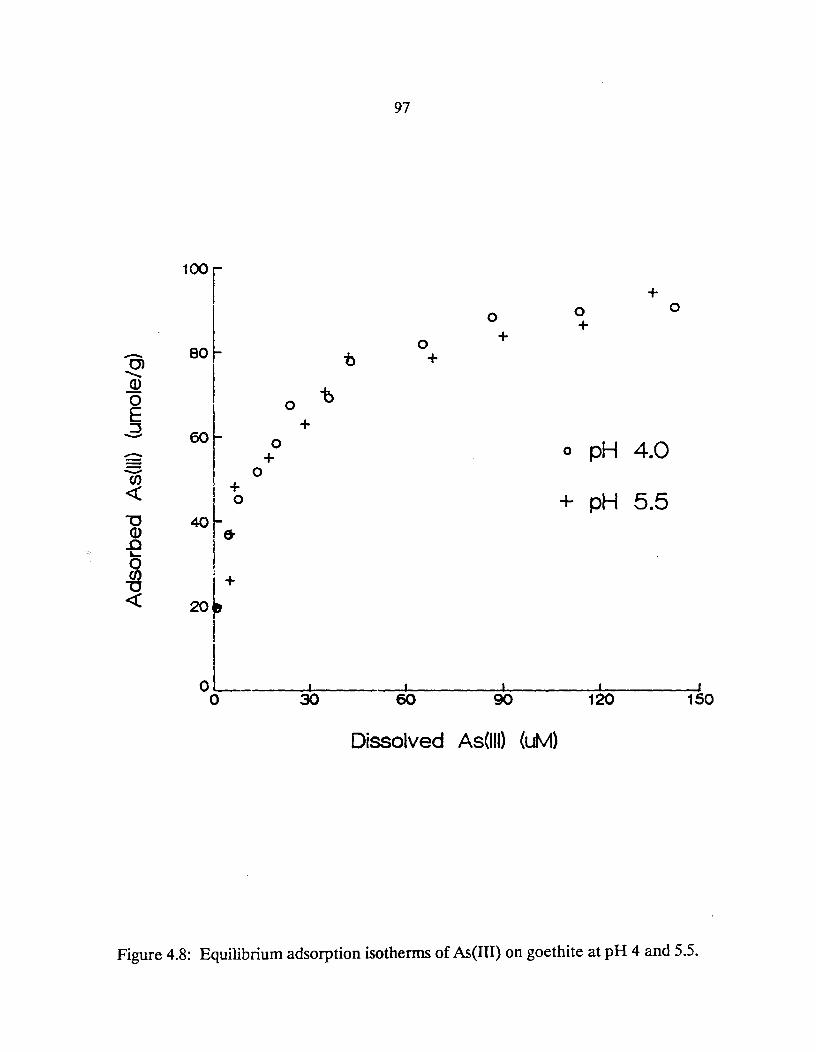
97
100r +
8O~ 0 0 0
+ 0 + - "b + 0)
........ Q)
1; 0 0 E :::J + - 60 0 pH 4.0 -::: + 0
~ 0 (J) I + « 40~ 0
+ pH 5.5 '"0 Q) ..c ,& .... ~
20~ + '"0 «
I
oL I I I I I 0 30 60 90 120 150
Dissolved As(lll) (utv1)
Figure 4.8: Equilibrium adsorption isotherms of As(III) on goethite at pH 4 and 5.5.
98
to be adsorbed more on a JJ,mole/g basis. A surface area was not reported by Pierce
and Moore, but Dzombak and Morel (1990) reported that the surface area of most
amorphous iron hydroxides falls within the range of 200-840 rrr / g.
The computer program FITEQL (Westall, 1982) was used to fit the adsorption
data with a surface complexation model. The formation of a single surface complex
was considered and described by the following reaction:
Kl H#03 + >FeOH .. >FeH,.As03 + H20
(4-12)
A value of 1(f·2 for the surface complexation constant was obtained from FITEQL.
The experimental results of the pH effect of As(III) adsorption equilibrium
on goethite are plotted in Figure 4.9. Adsorption reaches a maximum between pH
7 and 8 with a gradual decline in the amount adsorbed as pH is increased or
decreased. Under the reaction conditions of the experiment, only 85 percent is
adsorbed between pH 7 and 8 while more than 50 percent remains adsorbed at pH
3 and 10. The adsorption of As(llI) appears to be correlated to the concentration
of the neutral surface species> FeOH, which has a maximum concentration at the
pI-\pc (7.6). This adsorption behavior is different from that of typical anion or cation
adsorption. Typical anion adsorption (Le., phosphate, arsenate, selenite) is greatest
at pH values below the pH.pc of the adsorbent and diminishes sharply as pH goes
above the pI-\pc' Typical cation adsorption (Le., plf+ , Mrr+) displays the opposite
pH dependency; adsorption is the greatest at pH values above the pl\pc and
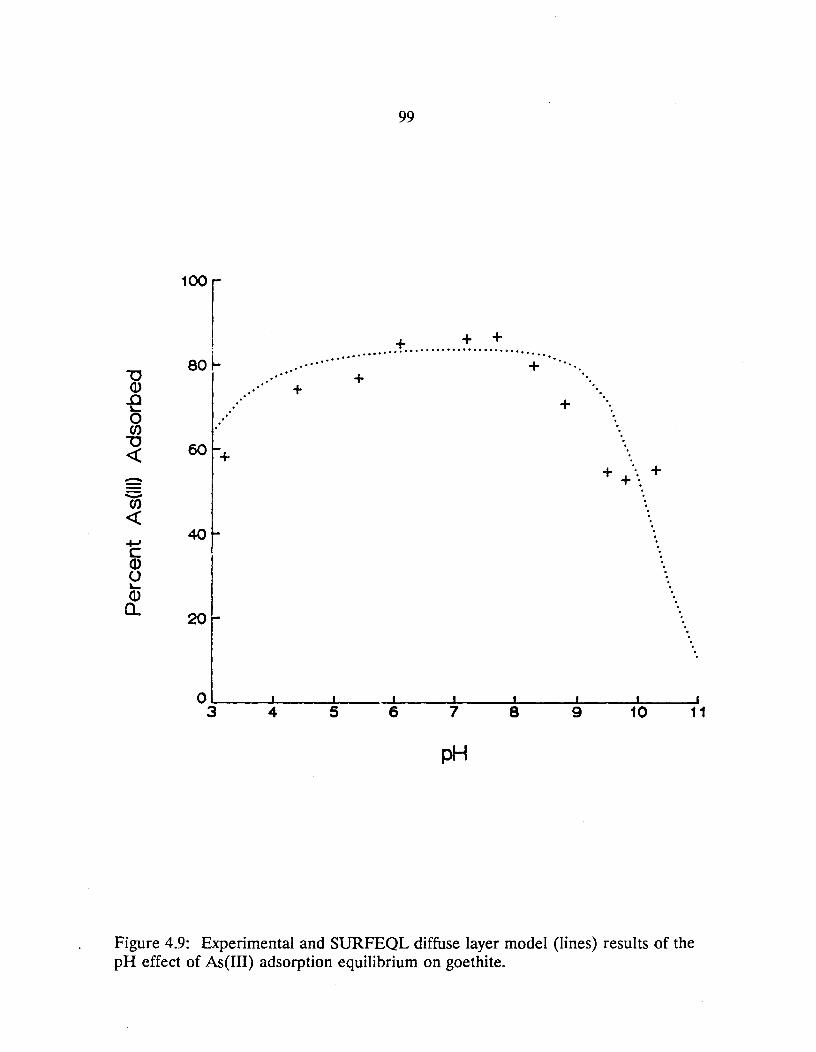
99
+ + + .......................................... ...... + ...
+ .. + . . .. + .. .. ..
60+ + .. +
+ ...
c 40
Q) o ~
Q) Q.
20
O~ __ ~~ __ ~~ __ ~I ____ ~I ____ ~I~ __ ~~I ____ ~I~ __ ~I
3 6 7 8 9 10 11
pH
Figure 4.9: Experimental and SURFEQL diffuse layer model (lines) results of the pH effect of As(III) adsorption equilibrium on goethite.
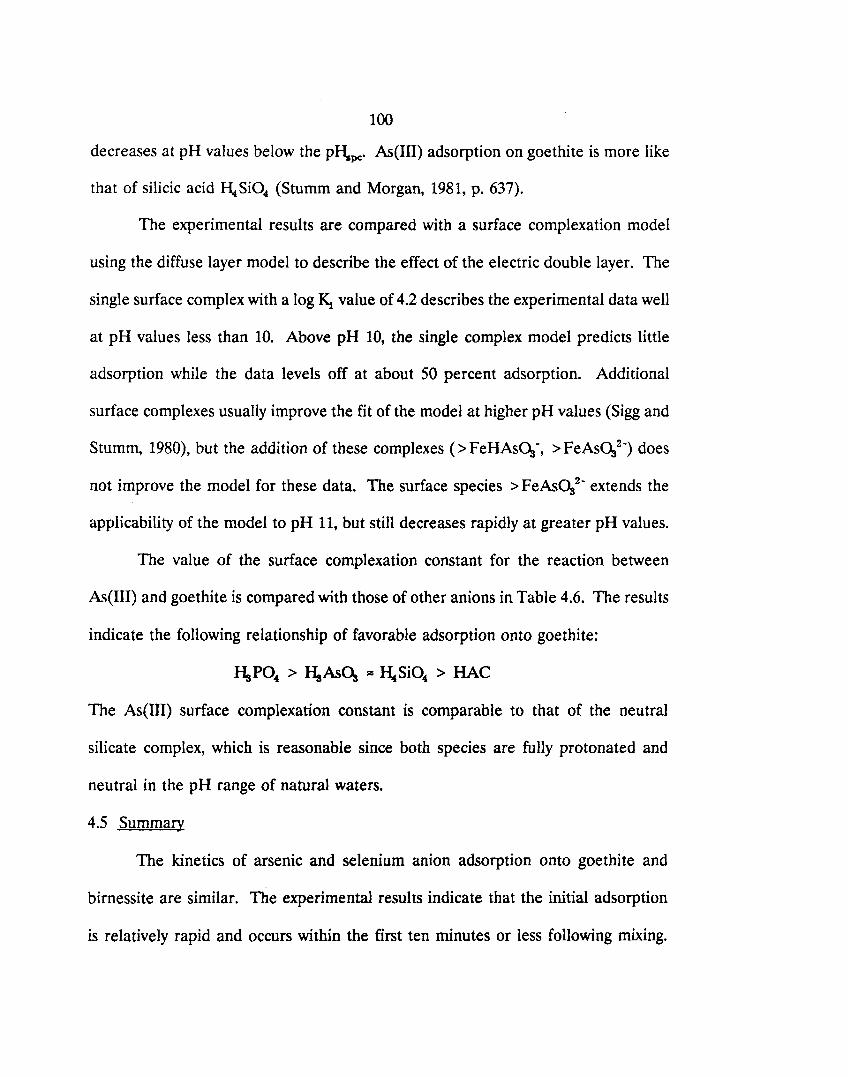
100
decreases at pH values below the PH.pc. As(III) adsorption on goethite is more like
that of silicic acid I\Si04 (Stumm and Morgan, 1981, p. 637).
The experimental results are compared with a surface complexation model
using the diffuse layer model to describe the effect of the electric double layer. The
single surface complex with a log ~ value of 4.2 describes the experimental data well
at pH values less than 10. Above pH 10, the single complex model predicts little
adsorption while the data levels off at about 50 percent adsorption. Additional
surface complexes usually improve the fit of the model at higher pH values (Sigg and
Stumm, 1980), but the addition of these complexes (> FeHAs~-, > FeAs~2-) does
not improve the model for these data. The surface species > FeAs~2- extends the
applicability of the model to pH 11, but still decreases rapidly at greater pH values.
The value of the surface complexation constant for the reaction between
As(III) and goethite is compared with those of other anions in Table 4.6. The results
indicate the following relationship of favorable adsorption onto goethite:
HsP04 > HsAs~ ::: I\Si04 > HAC
The As(III) surface complexation constant is comparable to that of the neutral
silicate complex, which is reasonable since both species are fully protonated and
neutral in the pH range of natural waters.
4.5 Summary
The kinetics of arsenic and selenium anion adsorption onto goethite and
birnessite are similar. The experimental results indicate that the initial adsorption
is relatively rapid and occurs within the first ten minutes or less following mixing.
101
Table 4.6: Comparison of Surface Complexation Constants for several species on goethite
REACUON log K Ref.
>FeOH + HsP04 = >Fe~P04 + ~O 9.5 1
>FeOH + HsP04 = >FeHP04- + W 5.1 1
> FeOH + HsP04 = >FePOl- + 2 W -1.5 1
>FeOH + HsAsOs = > Fel\AsOs + 1\0 4.2 2
>FeOH + ~Si04 = > FeHsSi04 + ~O 4.1 1
>FeOH + H..Si04 = > FeI\Si04- + H+ -3.3 1
>FeOH + HAc = >FeAc + ~O 2.9 1
(1) Sigg & Stumm, 1980; (2) This study
In a goethite suspension at pH 4, the initial rate of adsorption is nearly identical for
As(V) and Se(IV); for As(III), the rate is slightly slower. In a birnessite suspension
at pH 4, the initial rate of adsorption follows the trend:
Mn(II) > As(III) > Se(JV)
As(V) is not adsorbed on -birnessite at pH 4 and Se(VJ) is not adsorbed by either
oxide. It is also observed that at pH 4 the initial rate of As(V) and Se(IV)
adsorption is greater on goethite than birnessite while As(III) adsorption is faster on
birnessite. The extent of adsorption is qualitatively linked to the effect of the
electrostatic charge on the oxide surface and the charge of the aqueous ion.
The time dependency of the adsorption and desorption processes was
adequately described by a simple one-site kinetic model. It was also shown that the
102
kinetic description was improved by a more complex two-site model. However, the
complex model requires detailed and unknown information about the number and
reactivity of each type of surface site.
As(III) adsorption on goethite was investigated in greater detail with respect
to pH and temperature. Both the initial rate of adsorption and the equilibrium
concentration of adsorbed As(III) increase with increasing pH and temperature. As
predicted from thermodynamic calculations, no redox reaction between adsorbed
As(III) and surface Fe(I1I) was observed over an extended reaction period. At
equilibrium, the maximum adsorption of As(III) occurs between pH 7 and 8 and
there is a gradual decline in the quantity adsorbed as pH is increased from pH 8 or
decreased from pH 7. Surface complexation modeling indicates that As(III)
adsorption is less favored than phosphate adsorption, approximately equivalent to
silicate adsorption, and more favored than acetate adsorption on goethite.
103
Chapter 5
REACTIONS AT OXIDE SURFACES:
OXIDA nON OF AS(ITI) AND SE(IV) WIlli BIRNESSITE
5.1 Introduction
This chapter presents experimental results and discusses the rates and
mechanisms of the reactions of As(ITI) and Se(IV) with the birnessite surface. The
reactions obey the following overall stoichiometries:
(>MnO)3MnOH + HSe03- + H+ .. 3>MnOH + Mn 2+ + SeO;- (5-2)
The reactions are monitored by measuring the aqueous concentrations of the
reactants (As(III), Se(IV» and the products (As(V), Se(VJ), Mn(II» as functions of
time. For the As(III)-birnessite system, the effects of initial As(III) concentration,
pH, temperature, dissolved oxygen, and competitive bivalent cations were studied.
The influence of the concentration of reactants, pH, and temperature on the rate of
oxidation of Se(IV) was investigated. The experimental results are interpreted with
a kinetic model for the reaction sequence of adsorption, electron transfer, desorption,
and dissolution.
5.2 Experimental Methods
Deionized distilled water (~l\O) from a MILU-Q water purification system
(Millipore Corp., Bedford, MA) was used to prepare all solutions. All reagents were
104
analytical grade and used without further treatment. All solutions were filtered
through a 0.2 ~m Nucleopore filter to remove possible particle contaminants. All
glassware was cleaned with 4 M HN(ls or 4 M HCI and rinsed several times with
~HzO.
The pH of solution was monitored in all experiments using a Radiometer glass
combination electrode (Model GK2401C) and a Radiometer Model PHM84 research
pH meter. The electrode was calibrated with NBS buffers.
Experiments studying the reaction of As(III) with birnessite were performed
in a 250 ml magnetically-stirred double-walled beaker connected to a constant
temperature water bath. N2 gas was used to purge the system of CC\. The gas was
passed through a column of Ascarite II to remove any contaminant CC\ and
rehydrated through a column of ~Hz0 before being introduced into the reaction
vessel. The experiments were performed in aqueous suspensions consisting of 0.1 M
NaCIO. and a known solid concentration. Solid concentration was determined
gravimetrically just prior to and following the experiment by filtering 1 ml of the
reaction suspension through a 0.2 "Jlm Nuc1eopore filter. The aqueous systems were
adjusted to pH 4 with 1.0 M HCIO. to facilitate the removal of aqueous CC\. After
at least 3 hours, and usually overnight, the pH was readjusted with 0.1 M HCIO. or
NaOH to the planned pH value of the experiment. pH was kept constant during an
experiment with small additions of 0.1 M HeIO. or NaOH when the pH had drifted
± 0.05 pH units from the initial pH. The oxide suspensions were allowed to
equilibrate for at least two hours at the new pH before a known concentration of
105
As(IU) as Na~As~ was added to the system and mixed thoroughly. The reaction
was followed by periodically withdrawing and filtering a few milliliters through a 0.2
~m Uniflo filter unit for analysis. The filtered samples were divided for analysis of
As(III), As(V), and Mn(II). The Mn(II) subsamples were acidified with concentrated
HCI to pH 1 to prevent any re-oxidation. The effects of initial As(III) concentration,
temperature, pH, and dissolved oxygen were examined in a series of experiments.
Competition for reactive surface sites was studied by equilibrating the particle
suspension at pH 4 with a bivalent cation (Ci+, Mrr+) before adding As(IIl).
Bivalent cations such as Ci+ and Mrr+ bind appreciably to negatively charged
surfaces and thus should compete with As(IIl) for reactive surface sites and reduce
the rate and extent of reaction.
To study the reaction of Se(lV) with birnessite, the reaction suspension was
prepared in a 125 ml polystyrene bottle to prevent evaporation of the solution during
the duration of the experiment. Reaction bottles were placed in a constant
temperature shaker bath. Samples were purged with C~-free ~ gas prior to and
for the first two hours of each experiment. Ionic strength was controlled by NaNOs
instead of NaCIO. or NaCI because the CIO.- ion contaminates the anion column of
the ion chromatography unit and the cr ion at high concentrations can interfere with
determination of Se(IV). An ionic strength of 0.001 M was used due to similar
interferences of higher concentrations of NOs- with Se(VJ). Additions of 0.1 M
HNOs or NaOH were made to initially adjust the pH of each solution and pH was
monitored during the first two hours and then periodically over the duration of each
106
experiment. The reaction bottles were sampled over a period of 4 weeks. Each
subsample (5 ml) was filtered through a 0.2 \.Lm Uniflo filter unit and separated for
analysis of Se(IV) and Se(VJ) (together) and Mn(I1). The effects of initial Se(IV)
concentration, solid concentration, pH, and temperature were studied with a series
of experiments.
5.3 Dynamics of AsCIII) and Birnessite
5.3.1 Behavior of As (Ill) , AsCV), and MnCIl) in Solution
Reaction conditions for the As(III)-birnessite experiments are listed in Table
5.1. In all experiments, total manganese and total manganese surface sites are in
excess of total arsenic. Data from all of the experiments are listed in Appendix A.
Figure 5.1 illustrates the behavior of aqueous arsenic and manganese species with
time when aqueous As(III) is introduced into a suspension of birnessite particles
under the conditions pH 4, 25 0 C, and ionic strength 0.1 M.
The depletion of As(III) from solution is rapid. Fifty percent of the initial
As(III) is removed from solution within 10 minutes and, after 90 minutes, the
concentration is below the detection limit of 1 ~M (> 99% removal). As(V) is
released into solution as rapidly as As(III) is depleted and the total concentration of
aqueous As is almost constant over the duration of the experiment. These
observations suggest that the processes of electron transfer and release of As(V) into
solution are fast when compared to adsorption of As(III). The observations also
suggest that the adsorption of the released product As(V) on the birnessite surface
is very limited.
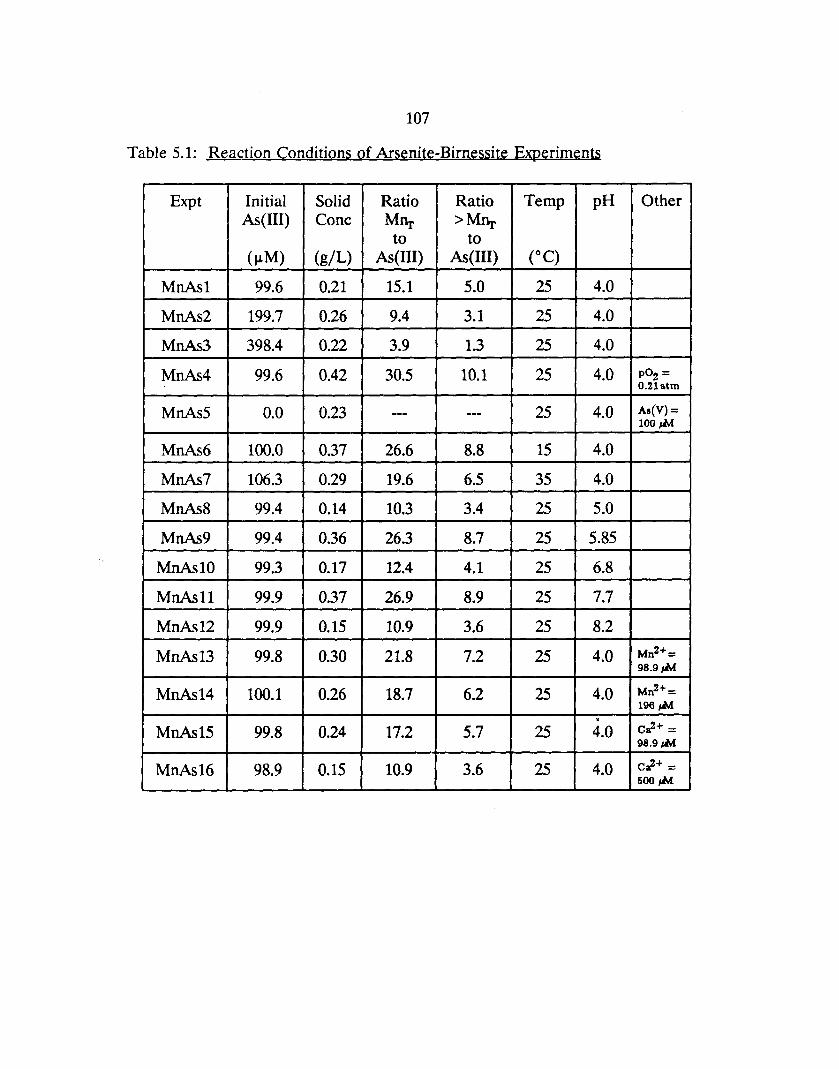
107
Table 5.1: Reaction Conditions of Arsenite-Birnessite Experiments
Expt Initial Solid Ratio Ratio Temp pH Other As(III) Cone MIlr >MIlr
to to (~M) (giL) As(I1I) As(I1I) (OC)
MnAsl 99.6 0.21 15.1 5.0 25 4.0
MnAs2 199.7 0.26 9.4 3.1 25 4.0
MnAs3 398.4 0.22 3.9 1.3 25 4.0
MnAs4 99.6 0.42 30.5 10.1 25 4.0 p02= 0.2latm
MnAs5 0.0 0.23 --- --- 25 4.0 .AII(V) = 100,.M
MnAs6 100.0 0.37 26.6 8.8 15 4.0
MnAs7 106.3 0.29 19.6 6.5 35 4.0
MnAs8 99.4 0.14 10.3 3.4 25 5.0
MnAs9 99.4 0.36 26.3 8.7 25 5.85
MnAs10 99.3 0.17 12.4 4.1 25 6.8
MnAs11 99.9 0.37 26.9 8.9 25 7.7
MnAs12 99.9 0.15 10.9 3.6 25 8.2
MnAs13 99.8 0.30 21.8 7.2 25 4.0 Mn2+= 98.9,.M
MnAs14 100.1 0.26 18.7 6.2 25 4.0 Mn2+: 196 ,.M
MnAs15 99.8 0.24 17.2 5.7 .
25 4.0 c;.+ = 98.9,.M
MnAs16 98.9 0.15 10.9 3.6 25 4.0 c;.+ = 500 ,.M
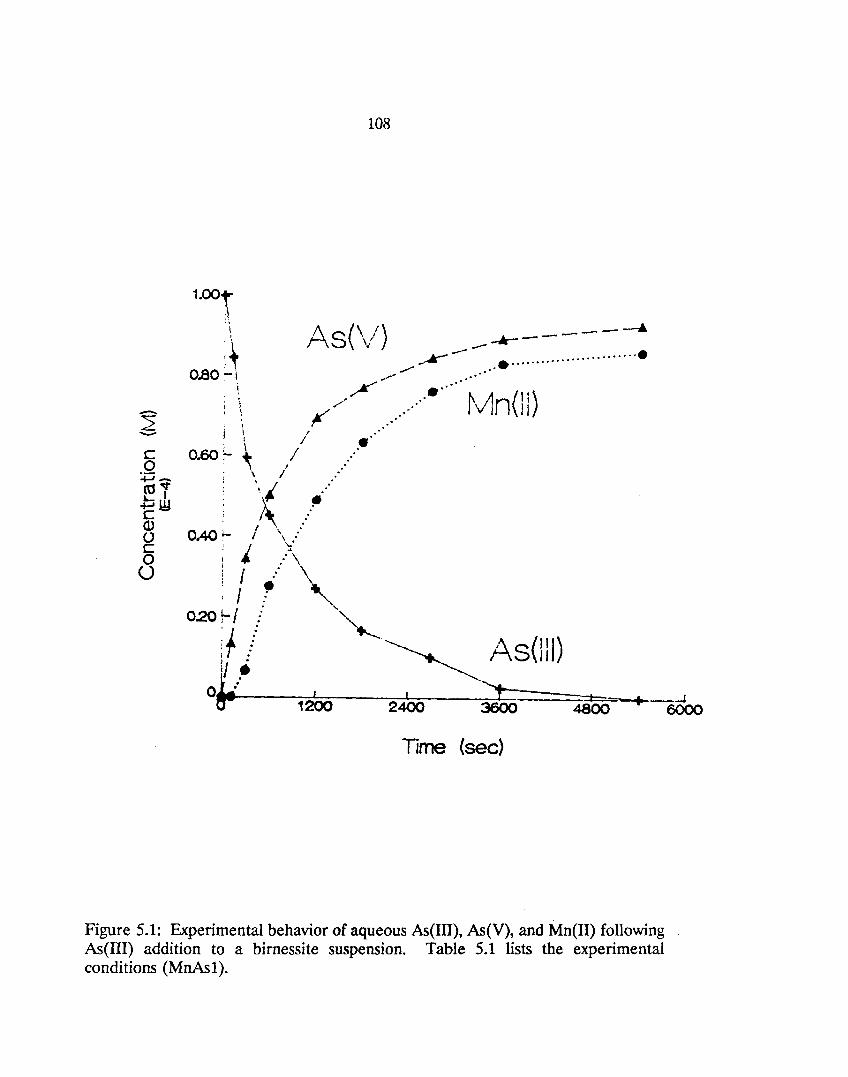
c o :p(lj'V
.t::;~ C Q) () c o
U
108
1.00, I
J ~
0.80 ~\ AS(\/) _-4c-----------'
~- .•.........................•
I i J
0.60:- ~ ; '. / : '"
I
/
/
/~,. ....!II OAO~ / \;
, \.: ; j :\ j I .. : ~ ,I.: "
--.,..' /
.' .. .'
.' "
e" .' ~v1n(lj)
0.20~1 ./ '~ if / .~ As(lll) 1/- .~
o~: 12bo 2400 ·~::t::::====:::::48::t~==---t--sobo Time (sec)
Figure 5.1: Experimental behavior of aqueous As(III), As(V), and Mn(II) following As(III) addition to a birnessite suspension. Table 5.1 lists the experimental conditions (MnAs 1).
109
The adsorption of 100 JlM As(V) on the birnessite surface was explored under
the experimental conditions of pH 4 and 25 0 C. No As(V) was adsorbed during the
four hours of the experiment. This behavior is expected from the coulombic
features of the surface chemistry of As(V) with metal oxides. The negatively-charged
As(V) anion binds strongly to positively-charged oxide surfaces (Le., when the pH of
the solution is less than the pI\p<: of the oxide) and desorbs when the oxide surface
is negatively charged (Le., at pH values above the pI\pc)' The birnessite surface is
negatively charged at pH 4 (Figure 3.11) and thus As(V) adsorption is not favorable
under the experimental conditions.
The release of the reduced product Mrr+ is slower than the release of the
oxidized product As(V). Also the ultimate extent of Mrr+ release is less than the
extent of As(V) release. The ratio of Mrr+ / As(V) in solution as a function of time
is presented in Figure 5.2. If the products both were released simultaneously into
solution and neither reacted further with the surface, then the ratio should be
predicted from the reaction stoichiometry, which under the experimental conditions
is 1. If the reduced product is accumulating at the surface, by either not being
released into solution with the oxidized product, or by being adsorbed to a greater
extent, then the ratio would be less than predicted. The observed Mrr+ / As(V) ratio
after the first two minutes of reaction is zero and then gradually increases until it
reaches a maximum of 0.93 after 45 minutes of reaction. Stone and Ulrich (1989)
reported similar behavior when studying the reductive dissolution of Mn(IV) dioxide
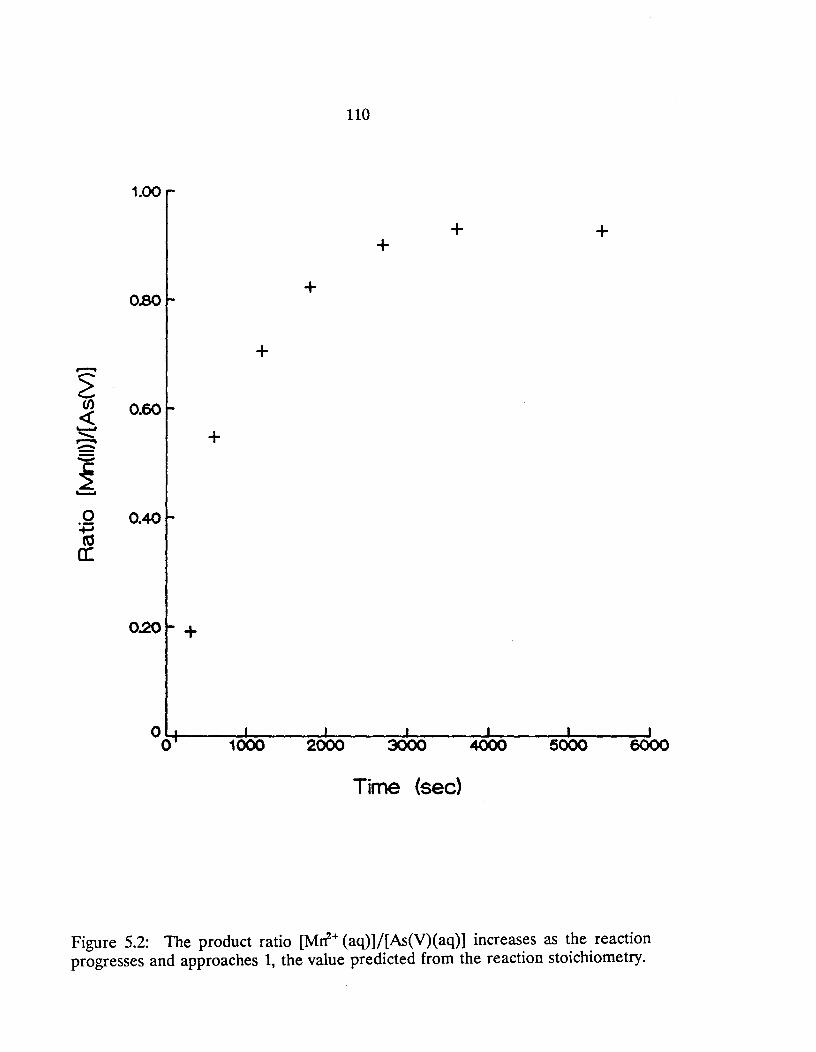
110
0.20 +
O~ ____ ~~ __ ~~~ __ ~~ ____ ~~ ____ -L ____ ~
o 2000 3000 4000 5000 6000
Time (sec)
Figure 5.2: The product ratio [Mrr+ (aq)]j[As(V)(aq)] increases as the reaction progresses and approaches 1, the value predicted from the reaction stoichiometry.
111
and Co(III) oxide particles by hydroquinone. The behavior of reduced Mn in
solution is probably controlled by both processes: (i) the slower release of Mn
causes the ratio to be initially less than predicted and (ii) the adsorption of Mrr+
keeps the ratio from reaching the predicted value at longer times.
5.3.2 Kinetic Mechanisms and Expressions
A kinetic model that describes the reductive dissolution of metal oxides by
organic reductants via surface reactions has been discussed in detail (Stone, 1986;
Stone and Morgan, 1987; Stone and Ulrich, 1989). The general framework of the
model can be used to describe the oxidation of trace reduced species by metal oxide
surfaces. Surface redox reactions between reduced anions and oxidized surface metal
ions occur through a multi-step mechanism, which can be best represented by four
general steps. The first step is assumed to be the formation of an inner-sphere
complex where the reduced anions displace surface-bound OH- and .I-laO via ligand
substitution and bind directly to the oxidized metal ion. The next step represents a
multi-step process that includes a transfer of two electrons from the anion to the
metal ion, breaking of two Mn-O bonds, and addition of an oxygen from water to
As(V). The release of the surface-bound oxidized anion and reduced metal ion
constitutes the third and fourth general steps. The following equations, for reaction
of As(III) with a Mn(IV) oxide, illustrate this mechanism:
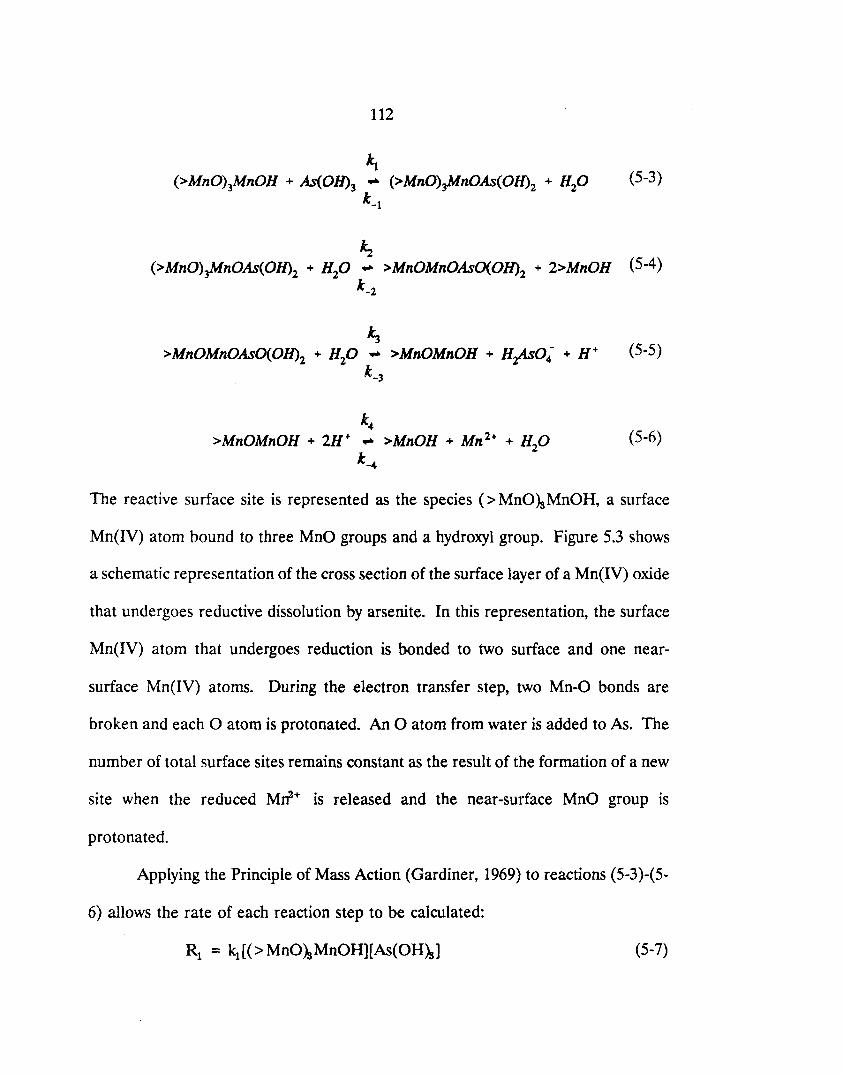
112
11 (>MnO)3MnOH + As(0H)3 ... (>MnO)~nOAs(0H)2 + H20
k_l
Is
(5-3)
(>MnO)~nOAs(01l)2 + H20 ... >MnOMnOAsO(OH)2 + 2>MnOH (5-4) 1_2
1) >MnOMnOAsO(OH)l + H20 ... >MnOMnOH + H#04- + H+
1_3
1 ... >MnOMnOH + 2H+ ... >MnOH + Mn 2+ + H
20
k-.4
(5-5)
(5-6)
The reactive surface site is represented as the species (> MnO>SMnOH, a surface
Mn(lV) atom bound to three MnO groups and a hydroxyl group. Figure 5.3 shows
a schematic representation of the cross section of the surface layer of a Mn(IV) oxide
that undergoes reductive dissolution by arsenite. In this representation, the surface
Mn(IV) atom that undergoes reduction is bonded to two surface and one near-
surface Mn(lV) atoms. During the electron transfer step, two Mn-O bonds are
broken and each 0 atom is protonated. An 0 atom from water is added to As. The
number of total surface sites remains constant as the result of the formation of a new
site when the reduced Mrf+ is released and the near-surface MnO group is
protonated.
Applying the Principle of Mass Action (Gardiner, 1969) to reactions (5-3)-(5-
6) allows the rate of each reaction step to be calculated:
(5-7)
113
I I I I - Mn-o- Mn-OH
I I - Mn-O- Mn-OH
I I ° ° I I
- Mn-O-Mn-OH I I
° ° I I
° ° I I /OH -Mn-O-Mn-O-As
I I 'OH o ° I I
- Mn-O- Mn-OH I I
-Mn-O-Mn-OH I I
Adsorption of As(Ill)
A • B
Equivalent Surfaces I I I
-Mn-O-Mn-OH I I E o OH I
-Mn-OH Mn2+ I o OH I I
-Mn-O-Mn-OH
I Electron Transfer
I I -Mn-O-Mn-OH
C I I o OH OH I I
-Mn-O-Mn-O-As=O I I o OH OH I I
I I \
Release of Mn(II)
-Mn-O-Mn-OH
/
I I
Release of As(V)
D
I I -Mn-O-Mn-OH
I I o OH I
-Mn-O-Mn-OH I o OH I I
-Mn-O-Mn-OH I I
OH I
-O-As= 0 I OH
Figure 5.3: A) Schematic representation of the cross section of the surface layer of a Mn(IV) oxide and B) the resulting surface structure following arsenite adsorption, C) electron transfer, D) arsenate release and E) Mrf+ release.
114
Rl = k 1[( > MnO)"MnOAs(OHh]
~ = Is[(> MnO)"MnOAs(OHh]
R_2 = kJ>MnOMnOAsO(OHh][>MnOHf
Rs = ks[ > MnOMnOAsO(OH~]
R_s = ksl > MnOMnOH](HAsO.-](H+ ]
~ = ~[>MnOMnOH][H+ f
R_4 = kJ > MnOH][Mrr+ ]
(5-8)
(5-9)
(5-10)
(5-11)
(5-12)
(5-13)
(5-14)
Changes in the concentrations of the chemical species are found by accounting for
both production and consumption:
d[As(OH)J = Rl - R_l (5-15) dt
d[(>MnO)~nOH] (5 6) ------ = Rl - R_l - R4 + R_4 -1
dt
d[>MnOMnOAsO(OH)21 = _ 11 + R + 11 - R (5-18) dt &'2 -2 &"3 -3
d[>MnOMnOH] = _ 11 + R + R - R (5-20) dt &"3 -3 4 -4
115
d[Mnz,,] - = -R +R tit 4-4
(5-21)
The expressions can be solved numerically using the Forward Euler Method
(Forsythe et aI., 1977). The computer code used to calculate the concentrations of
the chemical species as a function of time is listed in Appendix B. Experimentally
observed quantities such as the aqueous concentrations of the reduced and oxidized
anion and the reduced metal as functions of time provide a basis for determining
values for the rate constants (kl' k_ 1,. •. , ~,k_J. However, these values alone are not
sufficient for determining unique values for all eight rate constants; although, they
do limit the range of possibilities. The goodness of fit of the kinetic model was
determined by minimizing the average and maximum difference between observed
and predicted concentrations of each measured species at each sampling time. The
general modeling procedure and sensitivity analyses of the model for MnAs and
MnSe data sets are described in Appendix C. The ability of this kinetic model to
describe the observed dynamic behavior of the aqueous concentrations of the
reactants and products in the reactions of As(III) and Se(IV) with the birnessite
surface is discussed in the following sections.
The best model fits of the three aqueous species profiles are shown with the
experimental data (MnAsl) in Figure 5.4 and the values of the rate constants are
listed in Table 5.2. Figure 5.5 displays the model-predicted profiles of all the
proposed species, except for the reactive surface sites, (> MnO)gMnOH. The model-
predicted curves of the three aqueous species are repeated in the figure in order to
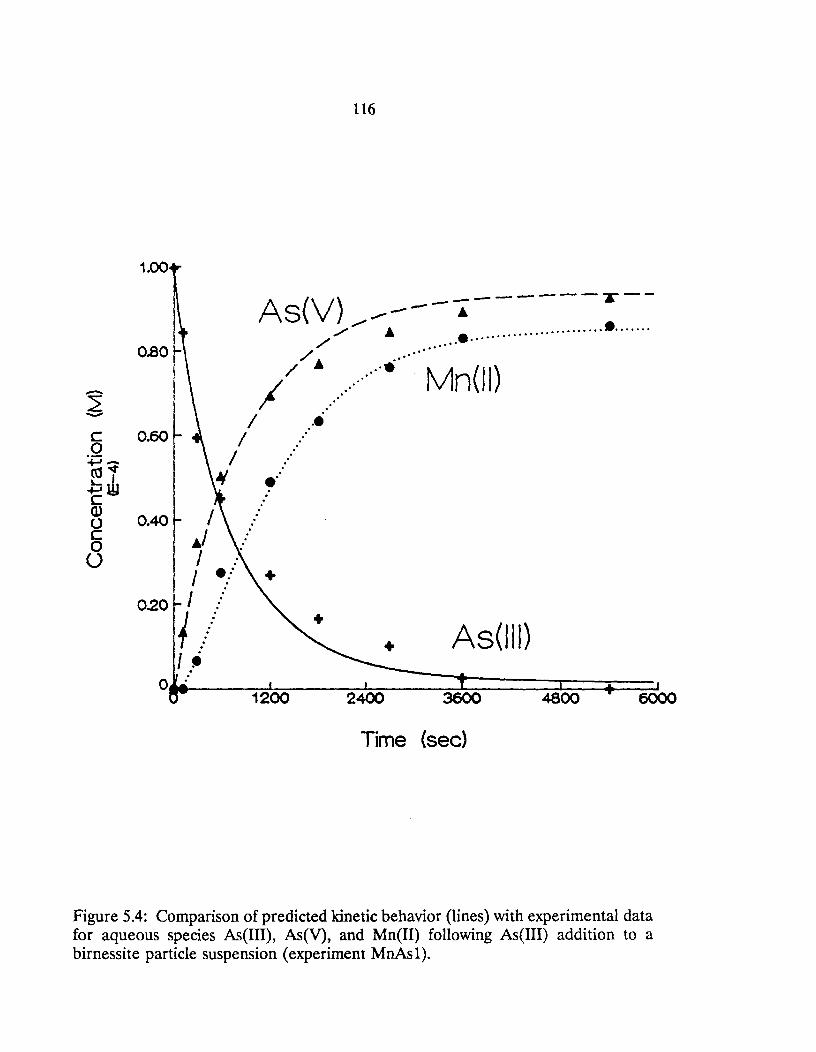
~ -c o :p~
~~ c Q) u c o o
1.00
0.80
0.60
0.40 / AI I
~
/ /
/
I .... 0.20 I
+ .... : J .;
o :
116
As(V) / ..... _--.------T--./ A • . ...................•....... /" .....
/ ........ . .. '
/ A..... Mn(11) /
.'. •• .
:
+ As(IID
1200 2400 3600 4800 6000
Time (sec)
Figure 5.4: Comparison of predicted kinetic behavior (lines) with experimental data for aqueous species As (III) , As(V), and Mn(JI) following As(III) addition to a birnessite particle suspension (experiment MnAs 1).
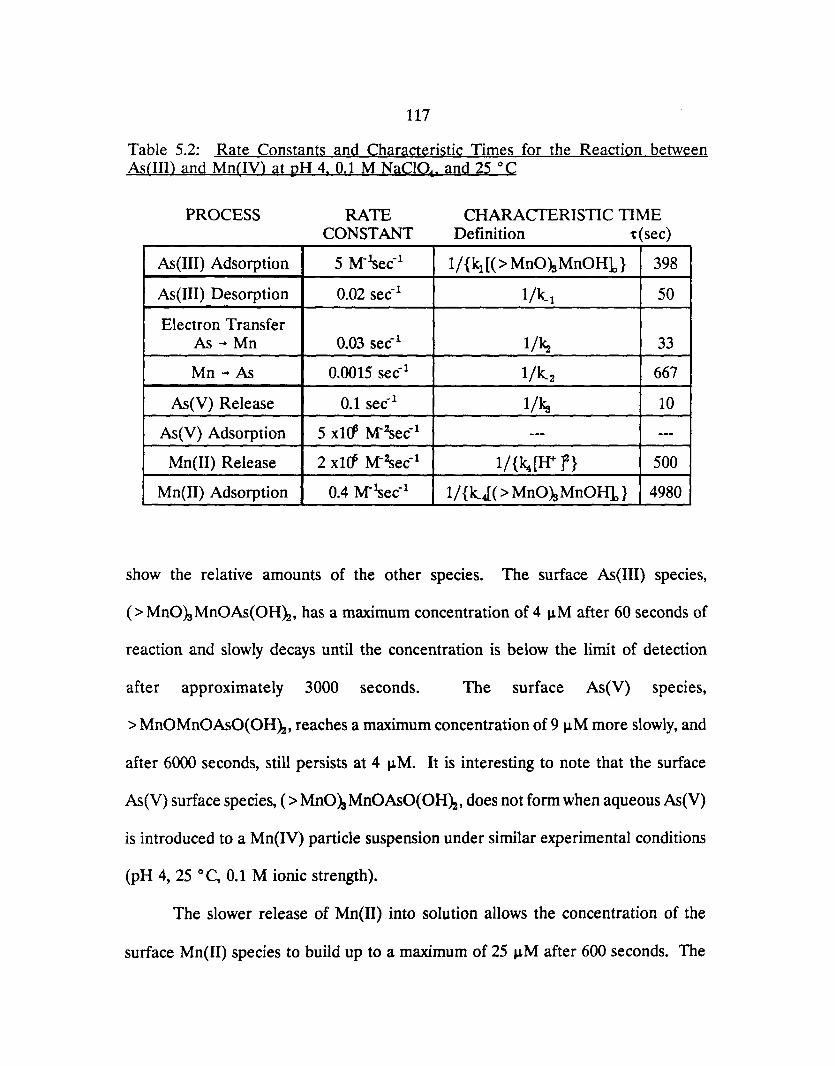
117
Table 5.2: Rate Constants and Characteristic Times for the Reaction between As(III) and Mn(IV) at pH 4, 0.1 M NaCI(4, and 25 0 C
PROCESS
As(III) Adsorption
As(III) Desorption
Electron Transfer As ~ Mn
Mn -As
As(V) Release
As(V) Adsorption
Mn(II) Release
Mn(II) Adsorption
RATE CONSTANT
5 M-lsec-1
0.02 sec-1
0,03 sec-1
0.0015 sec-1
0.1 sec-1
5 x1O' M-\ec- 1
2 x1c1 M-\ec-1
0.4 M-lsec- l
CHARACTERISTIC TIME Definition 't(sec)
1/{k1[(> MnOhMnOH1} 398
l/kl 50
1/~ 33
1/k2 667
l/ks 10
--- ---l/{~[H+ f} 500
1/ {kJ( > MnOhMnOH1} 4980
show the relative amounts of the other species. The surface As(III) specIes,
(> MnOhMnOAs(OHh, has a maximum concentration of 4 ~M after 60 seconds of
reaction and slowly decays until the concentration is below the limit of detection
after approximately 3000 seconds. The surface As(V) specles,
> MnOMnOAsO(OHh, reaches a maximum concentration of 9 ~M more slowly, and
after 6000 seconds, still persists at 4 ~M. It is interesting to note that the surface
As(V) surface species, (> MnO>:,MnOAsO(OHh, does not form when aqueous As(V)
is introduced to a Mn(IV) particle suspension under similar experimental conditions
(pH 4, 25 0 C, 0.1 M ionic strength).
The slower release of Mn(II) into solution allows the concentration of the
surface Mn(II) species to build up to a maximum of 25 ~M after 600 seconds. The
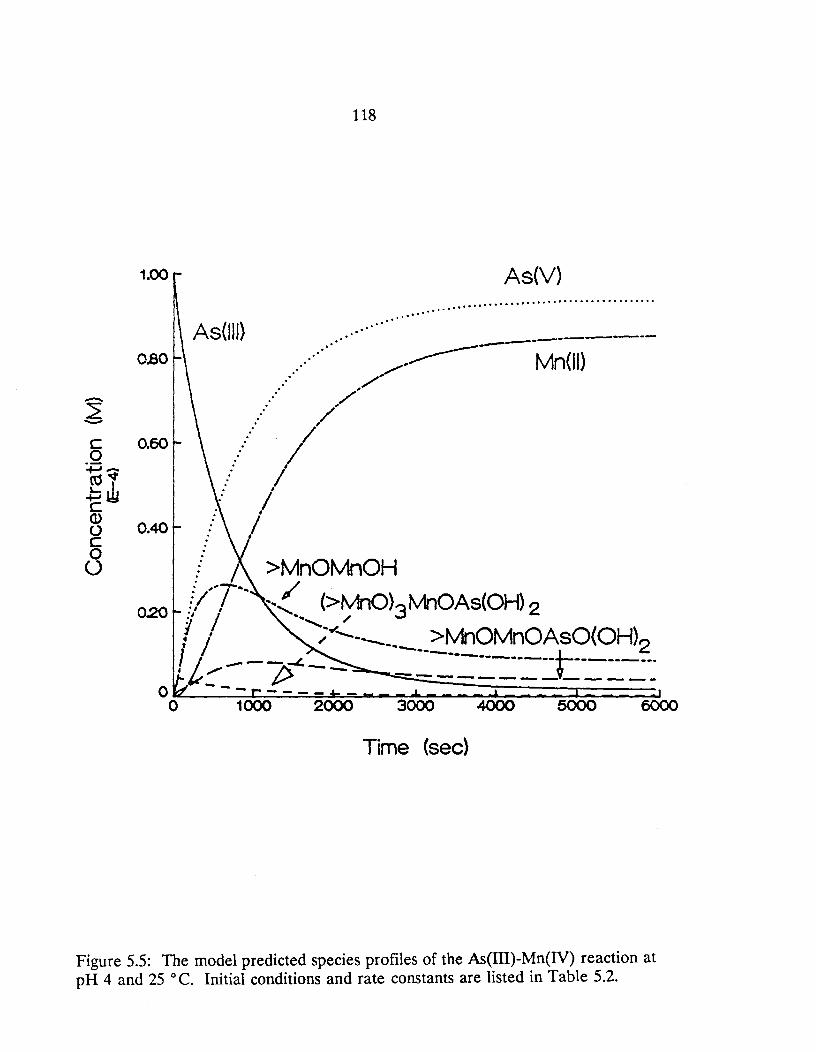
c .0 +-'~
£~ c (l) () c o o
1.00
As(lll) 0.80
.. ,.
0.60
0.40
118
.. ' .. ' ....
As{V) ....................................... .....
. / >~OMnOH 0.20 /7" .... ,.. (>~)3tv1nOAs(OH) 2
I i ;.,-.....--______ ~~OMnOASO(OH)2 ! i ",. - - A~ - - ---------t--------·
k f,,/' -------------o ---.-. ---- -o 1000 2000 3000 4000 5000 6000
Time (sec)
Figure 5.5: The model predicted species profiles of the As(III)-Mn(IV) reaction at pH 4 and 25 0 C. Initial conditions and rate constants are listed in Table 5.2.
119
concentration then decreases as a result of decreased formation of precursors and
coupled with continued release of Mn(II). The model indicates that after 6000
seconds about 10 percent of Mn(II) produced remains at the surface while the other
90 percent is in solution.
Overall rates of reactions in series are most influenced by the step with the
longest characteristic time and the relative importance of each process to the overall
rate of reaction can be determined by comparing the characteristic times for each
process. The characteristic time, 1', is easily defined for first-order reaction, and is
the reciprocal value of the rate constant (11k). Half of the processes in the overall
reaction are first-order reactions. The adsorption reactions (Rl' R_ SI RJ and the
release of Mn(II) (R.) are higher-order reactions. Defining characteristic times of
higher-order reactions is more complicated. If the experimental conditions are such
that the concentration of one of the reactants remains constant during the reaction,
then the process can be considered a pseudo first-order reaction and the
characteristic time is the reciprocal value of the product of the rate constant and the
initial concentration of the reactant that remains constant. The adsorption of As(III)
and Mn(II) (processes Rl and R_J can be considered pseudo first-order reactions
because the initial concentration of the reactive surface sites is much greater than the
initial concentrations of As(III) and Mn(II). The release of Mn(II) can also be
treated as a pseudo first-order reaction as a result of the concentration of H+ being
held constant throughout the experiment. However, the adsorption of As(V) (process
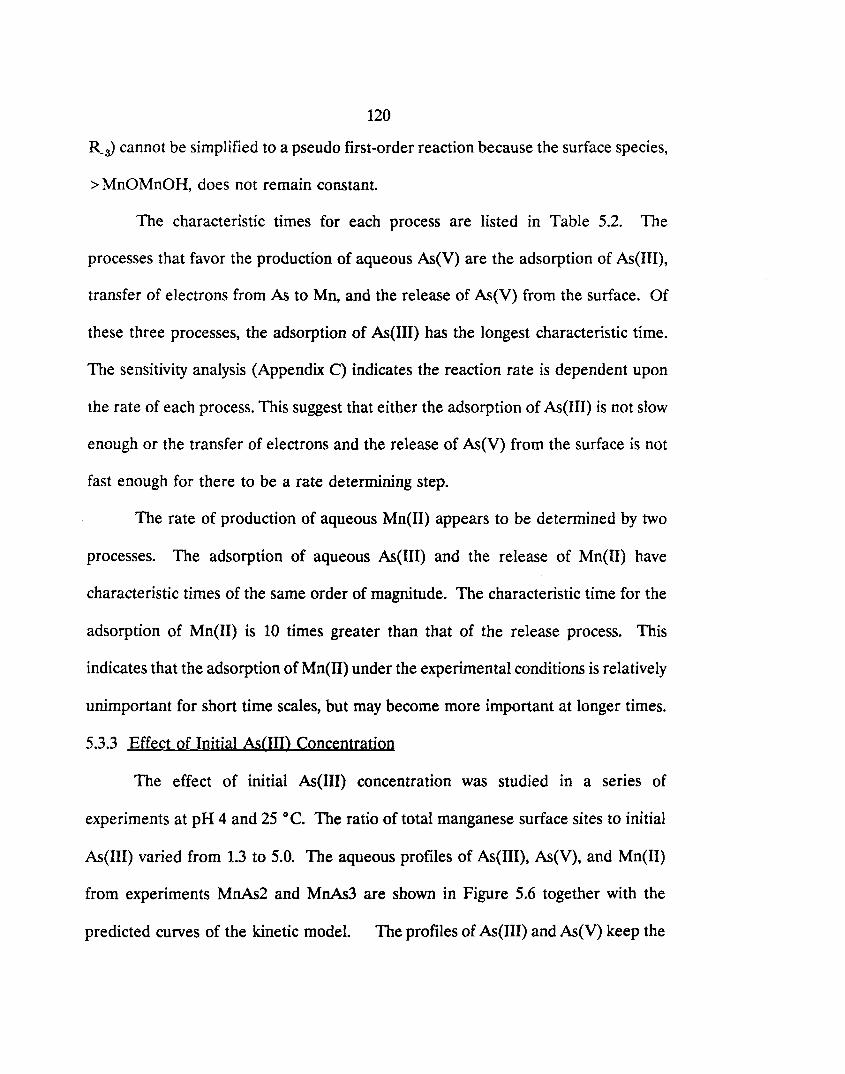
120
RJ cannot be simplified to a pseudo first-order reaction because the surface species,
> MnOMnOH, does not remain constant.
The characteristic times for each process are listed in Table 5.2. The
processes that favor the production of aqueous As(V) are the adsorption of As(III),
transfer of electrons from As to Mn, and the release of As(V) from the surface. Of
these three processes, the adsorption of As(III) has the longest characteristic time.
The sensitivity analysis (Appendix C) indicates the reaction rate is dependent upon
the rate of each process. This suggest that either the adsorption of As(IU) is not slow
enough or the transfer of electrons and the release of As(V) from the surface is not
fast enough for there to be a rate determining step.
The rate of production of aqueous Mn(II) appears to be determined by two
processes. The adsorption of aqueous As(III) and the release of Mn(II) have
characteristic times of the same order of magnitude. The characteristic time for the
adsorption of Mn(U) is 10 times greater than that of the release process. This
indicates that the adsorption of Mn(II) under the experimental conditions is relatively
unimportant for short time scales, but may become more important at longer times.
5.3.3 Effect of Initial As(I1I) Concentration
The effect of initial As(III) concentration was studied in a series of
experiments at pH 4 and 25 °C. The ratio of total manganese surface sites to initial
As(UI) varied from 1.3 to 5.0. The aqueous profiles of As(III), As(V), and Mn(U)
from experiments MnAs2 and MnAs3 are shown in Figure 5.6 together with the
predicted curves of the kinetic model. The profiles of As(I1I) and As(V) keep the
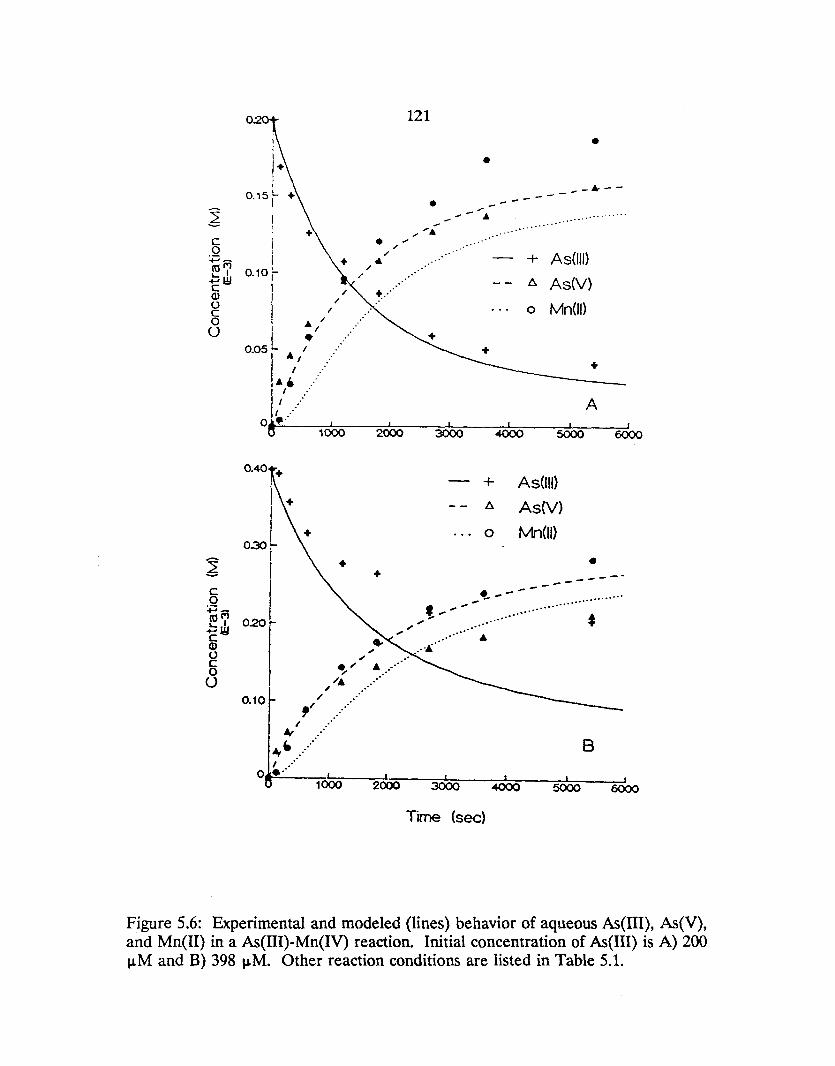
o
i i
0.1or I I
I " i A,
L • :.' 0.05/ A/ ..... :
I :
I ... I .. '
0.'· I lA/I : .....
;000
+
2000
+
" " ~" A ...... '. .... , .' , .... ", ........ .
4- ....
0.10
..... .. ,/ I ....
o •. ' 1000 2000
121
•
•
... - - - .&
3000
•
_----1..----
+ As(lll)
~ As(V)
o Mn(ll)
+
A I I
4000 5000 6000
+ As(U1)
~ AsN)
o tv1n(/l)
• -----------~--t ."..".., ,. .", .. -.",. ....
.•. A
3000
Time (sec)
.. , ...
4000
..... .... ...... .......
8
5000 6000
Figure 5.6: Experimental and modeled (lines) behavior of aqueous As(TII), As(V), and Mn(II) in a As(III)-Mn(IV) reaction. Initial concentration of As(TII) is A) 200 ~M and B) 398 ~M. Other reaction conditions are listed in Table 5.1.
122
same shape as more As(IU) is added to the reaction. Initially the release of Mn(lI)
is slower than the release of As(V) but after a reaction period of 10-20 minutes,
more Mn(lI) is released than As(V). Using the same set of rate constants extracted
from the data set of experiment MnAs1 ([As(IlI)] = 100 ~M), the kinetic model was
able to predict the initial behavior of As(IlI)(aq) and As(V)(aq). However, at longer
times the model overpredicts the observed disappearance of As(III) and appearance
of As(V). The disappearance of As(lIl) may be slowed by a greater loss of reactive
surface sites than predicted by the model. The product Mrr+ may bind to two
surface sites rather than one or the newly generated surface sites may not be as
reactive as the sites they replace. It is also possible that the adsorption of As(IU)
becomes limited after a certain degree of surface coverage or that the electrostatic
properties of the surface are altered such that adsorption of As(IlI) is less favored.
The model is also unable to predict the observed release of more Mn(Il) than
As(V). The simple model was constructed to predict Mrr+ concentrations that are
equal to or less than the concentration of As(V). The extra Mrr+ may be a
consequence of the difference between the true average Mn oxidation state of the
oxide particles and the assumed state of + IV. If the average Mn oxidation state is
less than +4, then the product ratio Mn(Il)/As(V) will be greater than one. Figure
5.7 illustrates the relationship between the average Mn oxidation state in a Mn oxide
and the product ratio Mn(U)/ As(V). The observed product ratios from experiments
MnAs2 and MnAs3 are also plotted in Figure 5.7 and indicate that the apparent Mn
oxidation states are + 3.6 and + 3.42, respectively. The implied oxidation states are
123
2.00 \
\ '.
- 1.80 \ > \ - , C/'J \
« \
....... ~ ~ .;:; '-.
§ 1.60 ,
, '-,
0 ~ ~ to a: 1.40 -+J 0
-5 MnAs2 0 '-a. 1.20
1.00 ;;;;-__ --;;-~----;;;~-----:;±-----::-!-:=-----=::::.J ~OO 3.20 a40 ~60
Average Oxidation State of Mn Oxide
Figure 5.7: The product ratio Mn(II)/ As(V) is dependent upon the average Mn oxidation state of the oxide. The observed ratios for MnAs2 and MnAs3 indicate lower oxidation states than expected for birnessite.
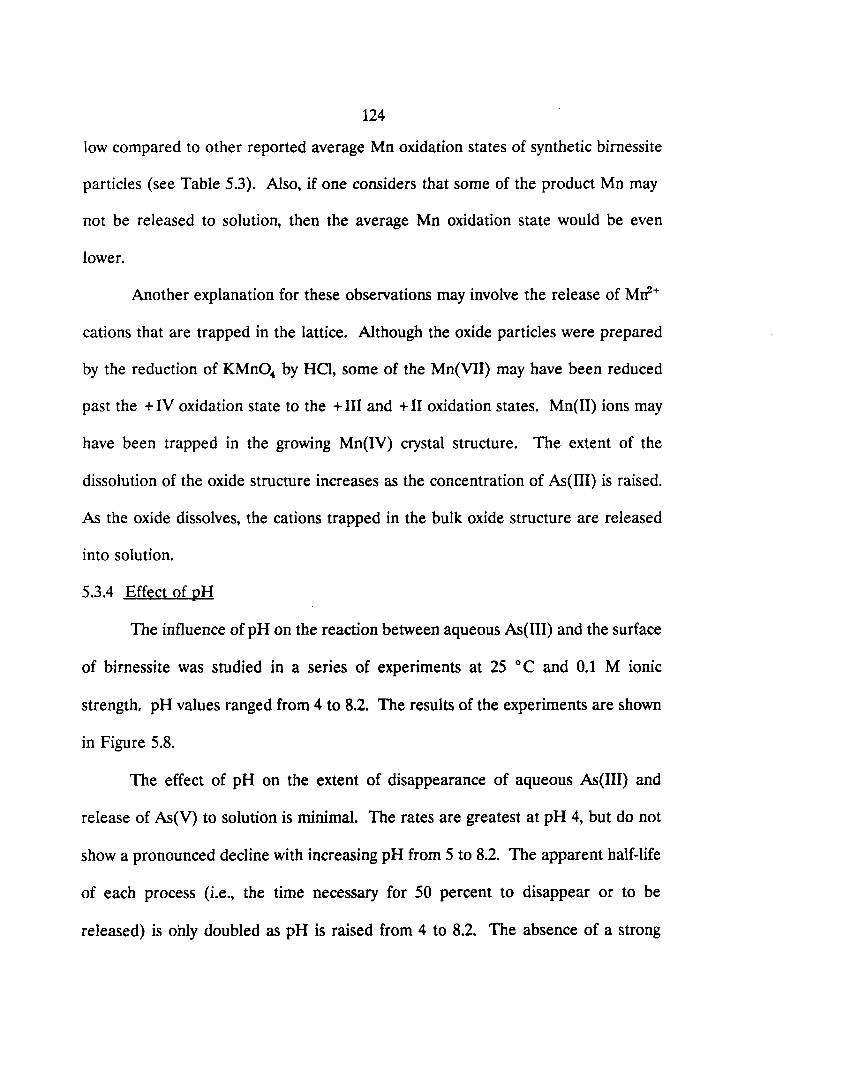
124
low compared to other reported average Mn oxidation states of synthetic birnessite
particles (see Table 5.3). Also, if one considers that some of the product Mn may
not be released to solution, then the average Mn oxidation state would be even
lower.
Another explanation for these observations may involve the release of Mrf+
cations that are trapped in the lattice. Although the oxide particles were prepared
by the reduction of KMnO. by HCI, some of the Mn(VII) may have been reduced
past the + IV oxidation state to the + III and + II oxidation states. Mn(II) ions may
have been trapped in the growing Mn(IV) crystal structure. The extent of the
dissolution of the oxide structure increases as the concentration of As(III) is raised.
As the oxide dissolves, the cations trapped in the bulk oxide structure are released
into solution.
5.3.4 Effect of pH
The influence of pH on the reaction between aqueous As(III) and the surface
of birnessite was studied in a series of experiments at 25 0 C and 0.1 M ionic
strength. pH values ranged from 4 to 8.2. The results of the experiments are shown
in Figure 5.8.
The effect of pH on the extent of disappearance of aqueous As(III) and
release of As(V) to solution is minimal. The rates are greatest at pH 4, but do not
show a pronounced decline with increasing pH from 5 to 8.2. The apparent half-life
of each process (i.e., the time necessary for 50 percent to disappear or to be
released) is only doubled as pH is raised from 4 to 8.2. The absence of a strong
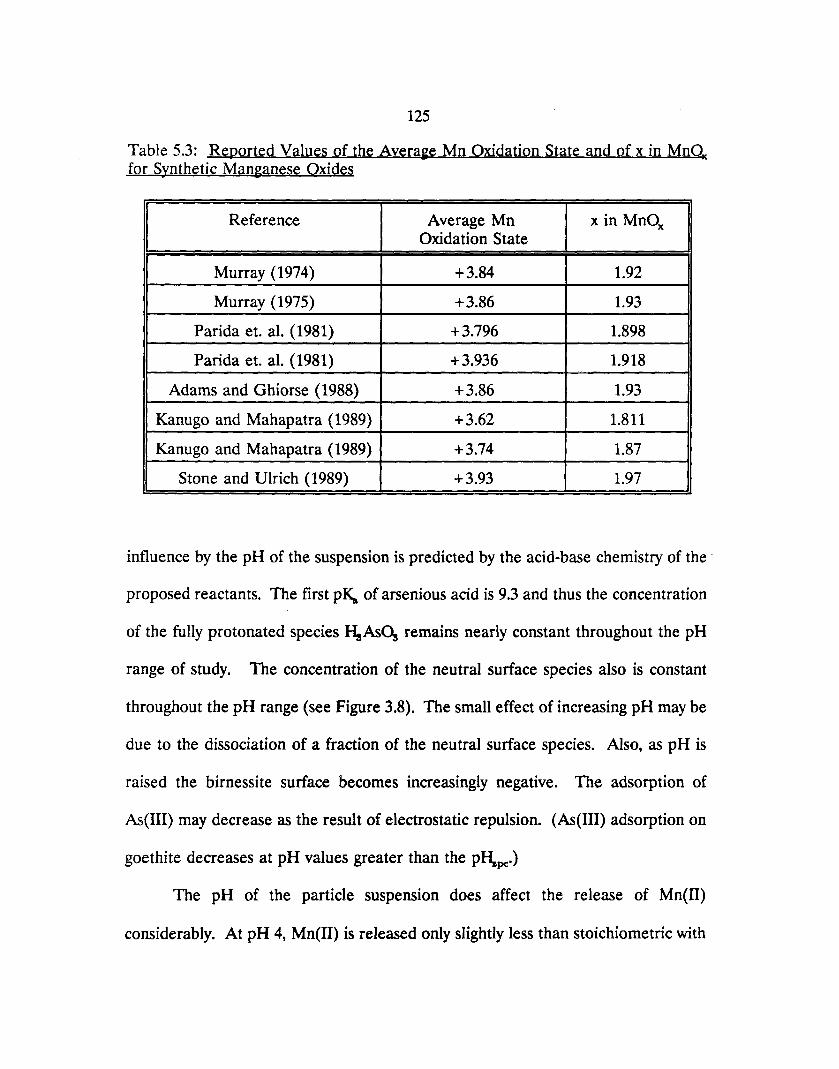
125
Table 5.3: Reported Values of the Avera~e Mn Oxidation State and of x in MnOJ( for Synthetic Manganese Oxides
Reference Average Mn x in MnOx Oxidation State
Murray (1974) +3.84 1.92
Murray (1975) +3.86 1.93
Parida et. al. (1981) +3.796 1.898
Parida et. al. (1981) +3.936 1.918
Adams and Ghiorse (1988) +3.86 1.93
Kanugo and Mahapatra (1989) +3.62 1.811
Kanugo and Mahapatra (1989) +3.74 1.87
Stone and Ulrich (1989) +3.93 1.97
influence by the pH of the suspension is predicted by the acid-base chemistry of the·
proposed reactants. The first pKa of arsenious acid is 9.3 and thus the concentration
of the fully protonated species HsAso., remains nearly constant throughout the pH
range of study. The concentration of the neutral surface species also is constant
throughout the pH range (see Figure 3.8). The small effect of increasing pH may be
due to the dissociation of a fraction of the neutral surface species. Also, as pH is
raised the birnessite surface becomes increasingly negative. The adsorption of
As(III) may decrease as the result of electrostatic repulsion. (As(III) adsorption on
goethite decreases at pH values greater than the pI\pc')
The pH of the particle suspension does affect the release of Mn(II)
considerably. At pH 4, Mn(II) is released only slightly less than stoichiometric with
E ~ ... C 4IJ o C o ()
100
100
eo
70
60
, Eo
126
100
pH5
25 C 100 lM As(\II)i
0.2 gA. 0.1 M I
-e-- p-4 5.8
........ p-4 6.8
--- p-47.7
-- p-4 8.2
,~--~-----~-----6
pH 5.8
... _--------0 I ..... -
10 I .--- pH 6.8 pH 7.7 pH 82 if ......... ················+····1········ ..
o . ~_ •.. * ·4,=:;---4-=t====1 /' 100 2QO m
Tme <min)
Figure 5.8: The influence of the pH of the particle suspension on the aqueous profiles of As(III), As(V), and Mn(II). Reaction conditions are listed in Table 5.1.
127
As(V). As the pH of the particle suspension is raised, less Mn(II) is released. After
90 minutes of reaction, the aqueous concentration of Mn(II) decreases from 3 ~M
to 1 ~M to less than 0.4 ~M as the pH of the system increases from 6.8 to 7.7 to 8.2.
Stone and Ulrich (1989) report similar behavior of Mn(II) in aqueous suspensions
of synthetic birnessite particles. They found for similar ratios of total Mn to Mn(II)
that 20 % of Mn(II) adsorbed at low pH values with nearly 100 % adsorption at pH
values greater than 6.
The reaction rate constants extracted from the numerical modeling of the
three aqueous species concentration profiles as a function of pH are listed in Table
5.4. The first rate constant, kI' varies slightly as pH is changed. Rate constants k l •
k2. k_2' and ks do not vary with pH.
Another effect of pH on the reaction was observed during the experimental
runs. The reaction suspensions were weakly buffered by a small amount of strong
acid (or base) and by the oxide particle surface. In order to maintain a constant pH
throughout the experiment, small amounts of strong acid or base were added
periodically. At pH values less than 6, the pH of the suspension increased during the
reaction and strong acid was added. At pH values greater than 6.6, the pH of the
suspension decreased as the reaction progressed and a strong base was needed to
maintain the initial pH. These observations suggest that the overall reaction
stoichiometry changes at a pH between 6 and 6.6. For pH values less than 6 the
stoichiometry of equation (5-1) is followed, in which a proton is consumed for every
As(III) reacted. As pH increases, both I\AsO. - and the surface species release a
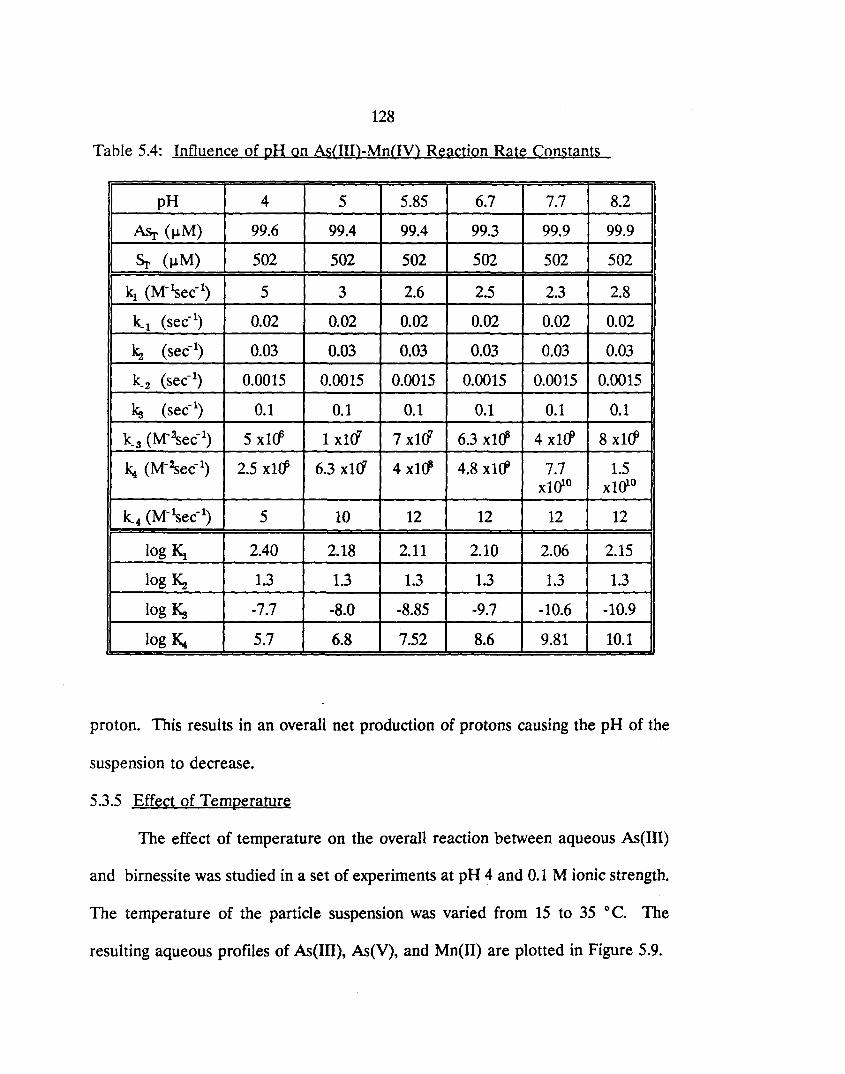
128
Table 5.4: Influence of pH on As(III)-Mn(IV) Reaction Rate Constants
pH 4 5 5.85 6.7 7.7 8.2
Asr (~M) 99.6 99.4 99.4 99.3 99.9 99.9
Sr (~M) 502 502 502 502 502 502
kl (M-~ec-I) 5 3 2.6 2.5 2.3 2.8
k-I (sec-I) 0.02 0.02 0.02 0.02 0.02 0.02
~ (sec-I) 0.03 0.03 0.03 0.03 0.03 0.03
k2 (sec-I) 0.0015 0.0015 0.0015 0.0015 0.0015 0.0015
ks (sec-I) 0.1 0.1 0.1 0.1 0.1 0.1
k_s (M-2sec-1) 5 xHf 1 xHf 7 xU! 6.3 x1(/ 4 x1cf 8 xHf
~ (M-2sec- l ) 2.5 x1f1 6.3 x10" 4 xHI 4.8 x1cP 7.7 1.5 x1ot° x1ot°
k4 (M-liec-I) 5 10 12 12 12 12
log KI 2.40 2.18 2.11 2.10 2.06 2.15
log Ka 1.3 1.3 1.3 1.3 1.3 1.3
log Ks -7.7 -8.0 -8.85 -9.7 -10.6 -10.9
log ~ 5.7 6.8 7.52 8.6 9.81 10.1
proton. This results in an overall net production of protons causing the pH of the
suspension to decrease.
5.3.5 Effect of Temperature
The effect of temperature on the overall reaction between aqueous As(IU)
and birnessite was studied in a set of experiments at pH 4 and 0.1 M ionic strength.
The temperature of the particle suspension was varied from 15 to 35 0 C. The
resulting aqueous profiles of As(III), As(V), and Mn(II) are plotted in Figure 5.9.
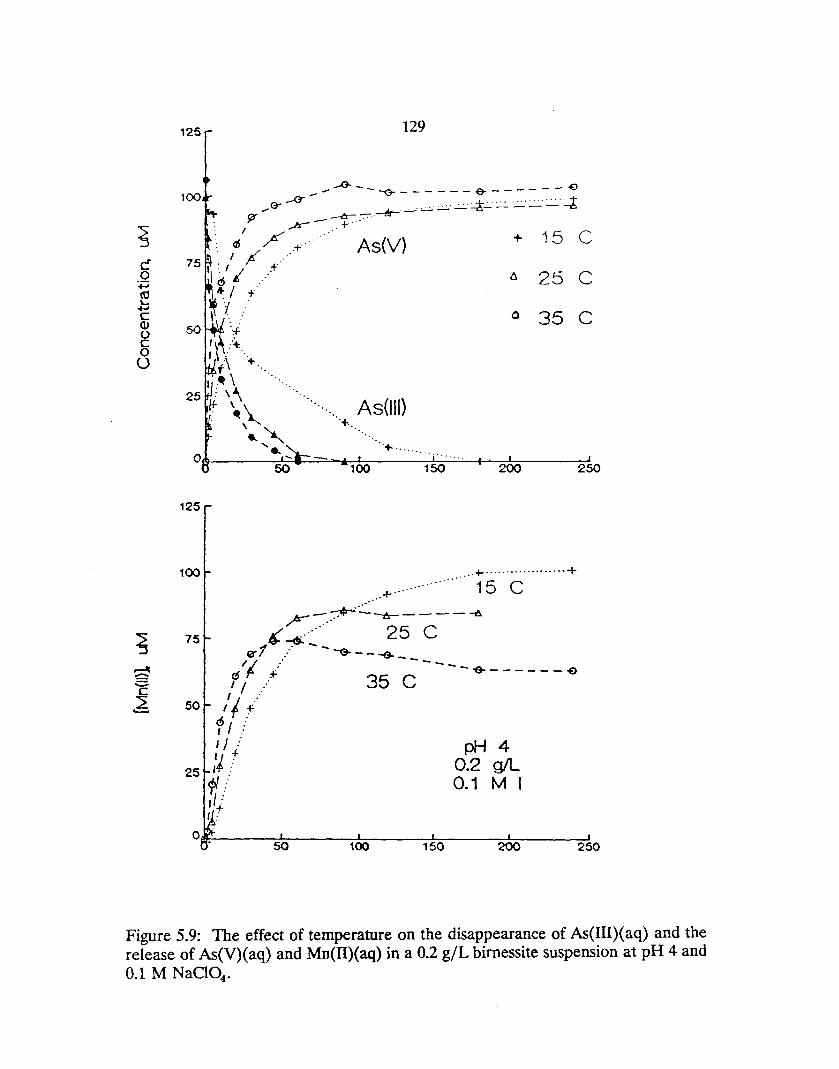
c o
+J 10 ~ ~ c (l) u c o o
129
__ --o-----(T------e-------~ .... e-~ --&- -:-:-' ,-tit-' -'-'-' ~''-'-'- :.:.:. :.:6~ :..:.:..' ~. :.:-' : .. :-:: 4
$iY 10.-- - ,+ .. , I ~ .'
o /.+ .' As{V) + 1 5 C 75 : / ,: +".
lid' . 25 C It- / T'
~ "~ ::'
so ' :..j.
'v :'+. I ,\. .
o 35 C
t\ + .... I .~ \
25 : \\
/l- \~ '. .. ~
' ..
As(lll) +.
50 100 150 200
125
100 .... + ...... _ .... __ ...... +
. of- .... 15 C ~~_~:.::.:-tr-----~
~ -Go---" 25 C 75 r;r1 .--' - - -Go - --e.
/ / :- -----~,. :f --e-------e '/ :-' 35 C
I -' 50 'I f'
<!J I :' I : 1/ .: I J +
25 l-to:·
<1'1/ ,I :' + ,:
pH 4 0.2 gIL 0.1 M I
250
o~----~~----~~--__ ~----~~ __ --~ 50 100 150 200 250
Figure 5.9: The effect of temperature on the disappearance of As(I1I)(aq) and the release of As(V)( aq) and Mn(n)( aq) in a 0.2 giL birnessite suspension at pH 4 and 0.1 M NaCI04 •
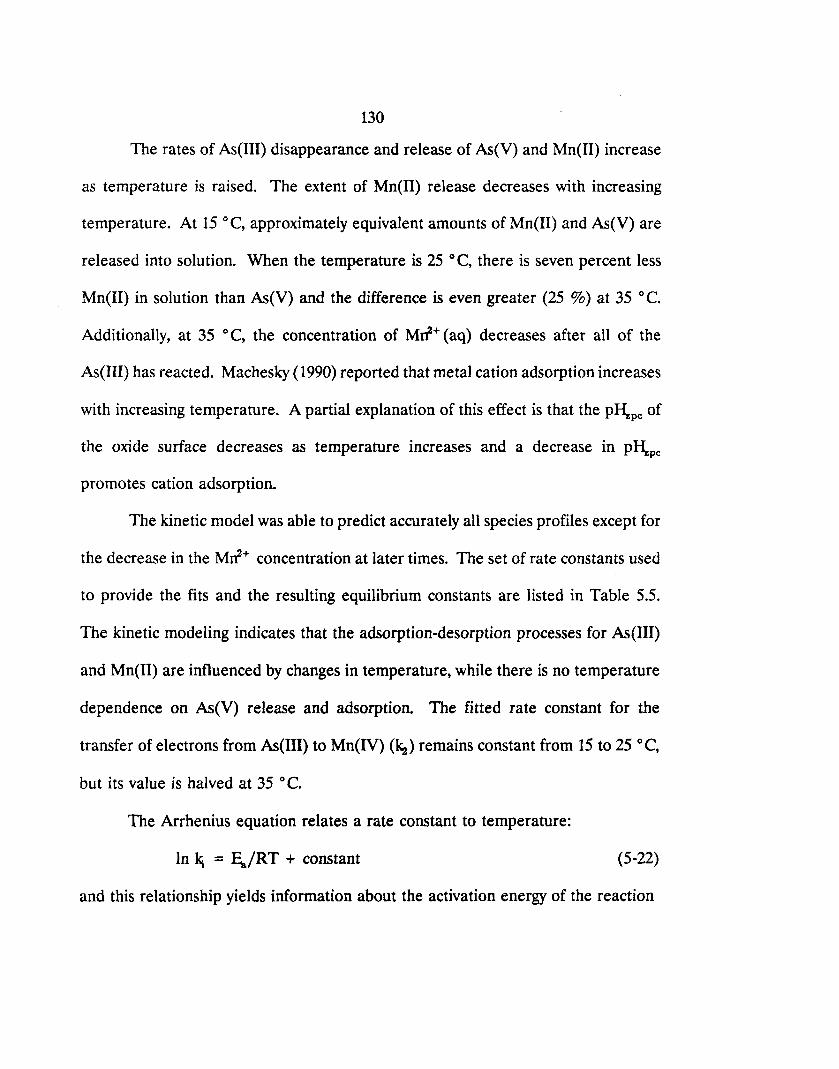
130
The rates of As(III) disappearance and release of As(V) and Mn(II) increase
as temperature is raised. The extent of Mn(II) release decreases with increasing
temperature. At 15 0 C, approximately equivalent amounts of Mn(II) and As(V) are
released into solution. When the temperature is 25 0 C, there is seven percent less
Mn(II) in solution than As(V) and the difference is even greater (25 %) at 35 ° C.
Additionally, at 35 °C, the concentration of MIf+ (aq) decreases after all of the
As(III) has reacted. Machesky (1990) reported that metal cation adsorption increases
with increasing temperature. A partial explanation of this effect is that the PI-\pc of
the oxide surface decreases as temperature increases and a decrease in pI-\pc
promotes cation adsorption.
The kinetic model was able to predict accurately all species profiles except for
the decrease in the Mrr+ concentration at later times. The set of rate constants used
to provide the fits and the resulting equilibrium constants are listed in Table 5.5.
The kinetic modeling indicates that the adsorption-desorption processes for As(III)
and Mn(II) are influenced by changes in temperature, while there is no temperature
dependence on As(V) release and adsorption. The fitted rate constant for the
transfer of electrons from As(III) to Mn(IV) (kz) remains constant from 15 to 25 ° C,
but its value is halved at 35 0 C.
The Arrhenius equation relates a rate constant to temperature:
In ~ = Ea/RT + constant (5-22)
and this relationship yields information about the activation energy of the reaction
131
Table 5.5: Influence of Temperature on As(III)-Mn(IV) Reaction Rate Constants and Equilibrium Constants
Temperature (0 C) 15 25 35
Asr (~M) 100.0 99.4 106.3
Sr (~M) 502 502 502
ki (M-~ec-I) 2.5 5 7.5
k_I (sec-I) 0.02 0.02 0.02
~ (sec-I) 0.03 0.03 0.015
k-2 (sec-I) 0.0015 0.0015 0.0015
ks (sec-I) 0.1 0.1 0.1
ks (M-2sec- I) 5 x1cf 5 x1cf 5 x1cf
k.t (M-2sec- I) 2.5 x1cf 2.5 x1cf 9 x1(1l
k.. (M-lsec- I) 2.5 5 35
log ~ 2.10 2.40 2.57
log ~ 1.3 1.3 1.0
log Ks -7.7 -7.7 -7.7
log ~ 6.0 5.7 5.4
step, Ea. Arrhenius treatment of the data gives the activation energies of the process
whose rate is affected by changes in temperature.
Process and Rate Constant .E. ± Std Error (kJ Imole) t
As(OH)., Adsorption, kl 40.6 ± 5.3 0.983
Mrr+ Release, k.t 45.7 ± 27.5 0.733
Mrr+ Adsorption, k.4 99.3 ± 30.1 0.916
The values of the activation energies of these processes indicate that each of the
132
processes are controlled by chemical reactions rather than diffusion limited.
Diffusion limited reactions have activation energies of about 15 to 21 kJ/mole. The
goodness of fit of the data to the Arrhenius equation is indicated by the value of r.
The value of the standard error is also an indicator of goodness of fit. The goodness
of fit is best for the As(OH>S adsorption activation energy, poorest for the Mrr+
release activation energy.
The van't Hoff equation relates an equilibrium constant to temperature:
In K = - ~I\/RT + constant (5-23)
and this relationship yields information about the reaction enthalpy ~l\ as long as
the reaction enthalpy is independent of temperature. A linear plot of In K versus
liT indicates that the slope, ~l\, is independent of temperature. Figure 5.10 is a
linear van't Hoff plot of the equilibrium constants ~ and 1<.. The resulting values
of the reaction enthalpies are given below.
PROCESS ill (kJ Imole)
As(OH>S Adsorption-Desorption (~) 41 ± 5
Mrf+ Release-Adsorption (1<.) -54 ± 3
Machesky (1990) reported that anion adsorption is exothermic (~l\ < 0) while
cation adsorption is endothermic (~l\ > 0). The data indicate that the adsorption
of both As(III) and Mn(II) is endothermic. Machesky (1990) also reported that the
reaction enthalpies of cadmium, zinc, and nickel adsorption on hematite (a-F~Os)
at pH 6 are, respectively, + 13, + 49, and + 30 kJ /mole. In comparison with the
133
I 6' ...... .
............. ....... .... t!. ...... ' .
~ ........... ' 12 ~
l I I I
10~ I I
I 8~
j I ! I I I
.... ·6' ...... . ..... ..... ..... ......
6~---+-___ K 1
4L ~=---~----~-~ O~ 033 O~ 035
(E-2)
11T(K)
Figure 5.10: van't Hoff plot of the equilibrium constants and linear regression lines for As(III) adsorption-desorption (~) and Mn(II) release-adsorption (K.). The slope of each line is -a ~ /R.
134
reaction enthalpy of Mn(H), the data indicate that the affinity of the bivalent cations
for the surface followed the order:
Mn(lI) > Zn(lI) > Ni(lI) > Cd(lI)
and this is the same order of affinity that Murray (1975) described for the interaction
of metal ions at the manganese dioxide-solution interface.
The reaction enthalpy of an individual reaction and the activation energies of
the forward and reverse steps are related by the expression
which follows from the Arrhenius and van't Hoff equations and the definitions ~ =
kJk i and In(~) = In(~) - In(kJ. We can compare temperature dependences of
equilibria and kinetics on this basis.
5.3.6 Effect of Dissolved Qxy~en
Dissolved oxygen is a stronger oxidant than Mn(IV). However, the reaction
between dissolved oxygen and As(III) is very slow. Eary and Schramke (1990)
showed that the oxygenation of As(III) in freshwater had a half-life in the range of
one to three years. In our laboratory, standard arsenite solutions remained constant
over a period of several days to a week.
The reaction suspension was purged with air (p~ = 0.21 atm) instead of
N2 (g) to study the effect of dissolved oxygen on the reaction between the birnessite
surface and As(III). Figure 5.11 shows that there is no difference in the rate of
As(V) release to solution at pH 4 and 25 0 C when dissolved oxygen is present or not.
135
This observation confirms that the surface Mn(IV) is the oxidant in the reaction and
is not just a catalyst in the oxygenation of As(III).
Another effect of dissolved oxygen is the oxidation of the product Mn(U).
The homogeneous oxygenation of Mn(II) below pH values of 8 is very slow. Davies
and Morgan (1989) have shown that the oxidation of Mn(II) is more rapid in metal
oxide suspensions although the reaction rates are much slower than the rate of
adsorption. For the short reaction time and pH conditions of this experiment, the
fate of the product Mn(II) is probably controlled by adsorption and not oxidation by
dissolved oxygen.
5.3.7 Effect of Bivalent Cations ci+ and Mrr+
The effect of an additional adsorbing aqueous species on the rate of reaction
between As(IU) and Mn(IV) was examined in a set of experiments at pH 4, 25 0 C,
0.2 giL solid concentration, and 0.1 M ionic strength. The effect was studied by pre
equilibrating the particle suspension with various concentrations of ci+ (aq) and
Mrr+ (aq) and by monitoring the appearance of As(V)( aq). Mrr+ (aq) appearance
also was monitored in the Mn addition experiments. Previous studies (Murray, 1975;
Loganathan et. aI., 1977; Stone and Ulrich, 1989) report that both cations bind
specifically to the surface, with Mrf+ binding to a much greater extent. The reaction
between the particle surface and the bivalent cation can be expressed by the
following equations:
> MnOH + c;i+ • > MnOCa+ + H+
> MnOH + Mrf+ • > MnOMn+ + W
(5-24)
(5-25)
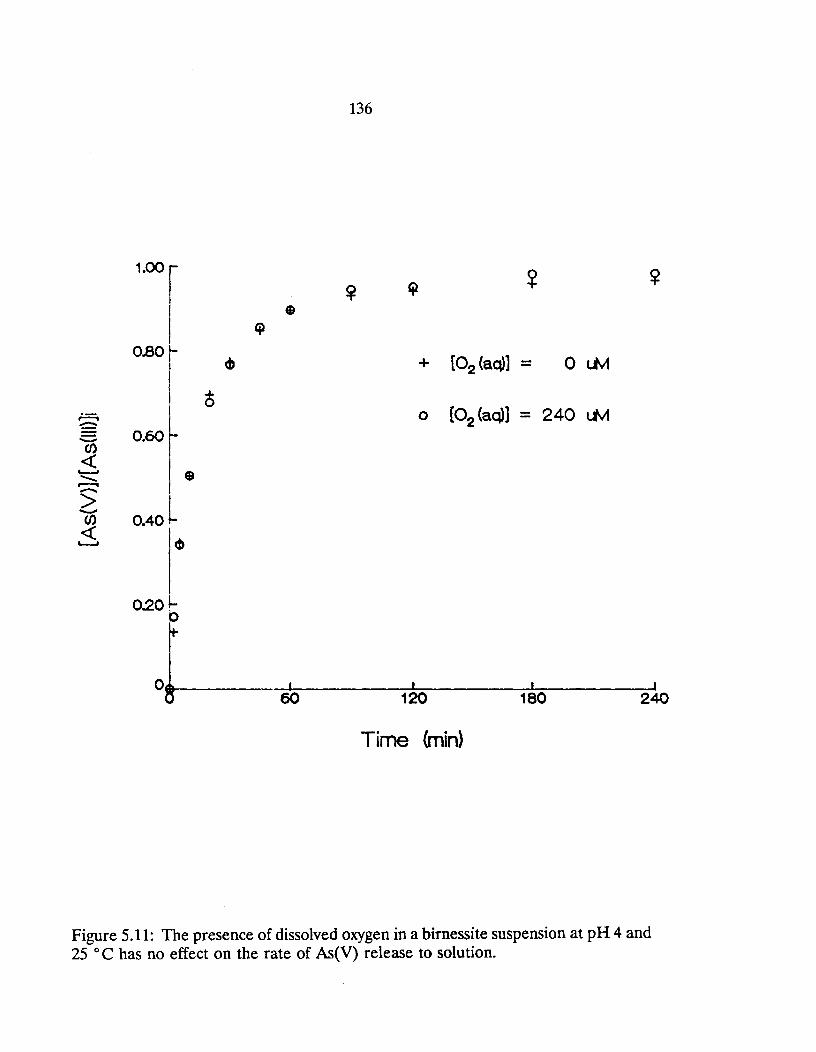
;.=; --Cf)
« ~
""-...--. -> -Cf)
« ~
1.00 r
0.801-
0.60
0.40
~
0.20~ b
~
~
$
136
$
cp
+ [02 (aq)] - Ou'v1
0 [02 (aq)] - 240 t.M
60 120 180 240
Time (min)
Figure 5.11: The presence of dissolved oxygen in a birnessite suspension at pH 4 and 25 0 C has no effect on the rate of As(V) release to solution.
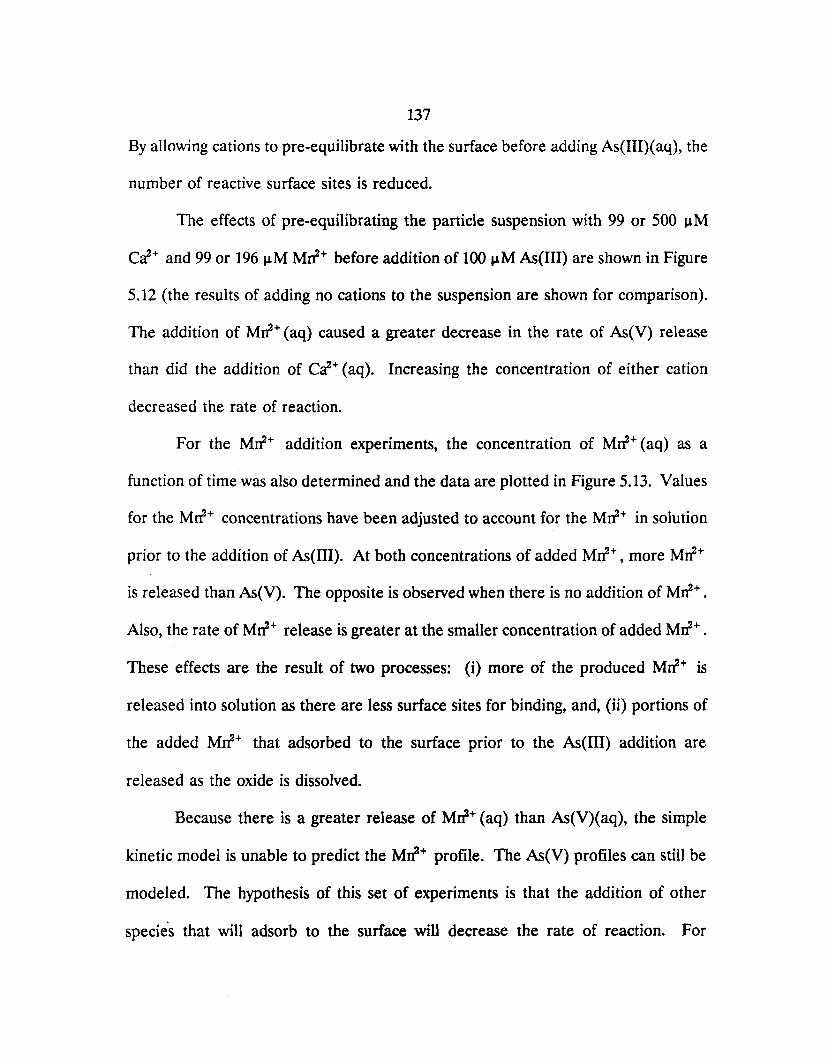
137
By allowing cations to pre-equilibrate with the surface before adding As(III)(aq), the
number of reactive surface sites is reduced.
The effects of pre-equilibrating the particle suspension with 99 or 500 ~M
ci+ and 99 or 196 ~M Mrr+ before addition of 100 ~M As(III) are shown in Figure
5.12 (the results of adding no cations to the suspension are shown for comparison).
The addition of Mrr+ (aq) caused a greater decrease in the rate of As(V) release
than did the addition of ci+ (aq). Increasing the concentration of either cation
decreased the rate of reaction.
For the Mrr+ addition experiments, the concentration of Mrr+ (aq) as a
function of time was also determined and the data are plotted in Figure 5.13. Values
for the Mrr+ concentrations have been adjusted to account for the Mrr+ in solution
prior to the addition of As(III). At both concentrations of added Mrr+ , more Mrr+
is released than As(V). The opposite is observed when there is no addition of Mrr+ .
Also, the rate of Mrr+ release is greater at the smaller concentration of added Mrr+ .
These effects are the result of two processes: (i) more of the produced Mrr+ is
released into solution as there are less surface sites for binding, and, (ii) portions of
the added Mrr+ that adsorbed to the surface prior to the As(III) addition are
released as the oxide is dissolved.
Because there is a greater release of Mrr+ (aq) than As(V)( aq), the simple
kinetic model is unable to predict the Mrr+ profile. The As(V) profiles can still be
modeled. The hypothesis of this set of experiments is that the addition of other
species that will adsorb to the surface will decrease the rate of reaction. For
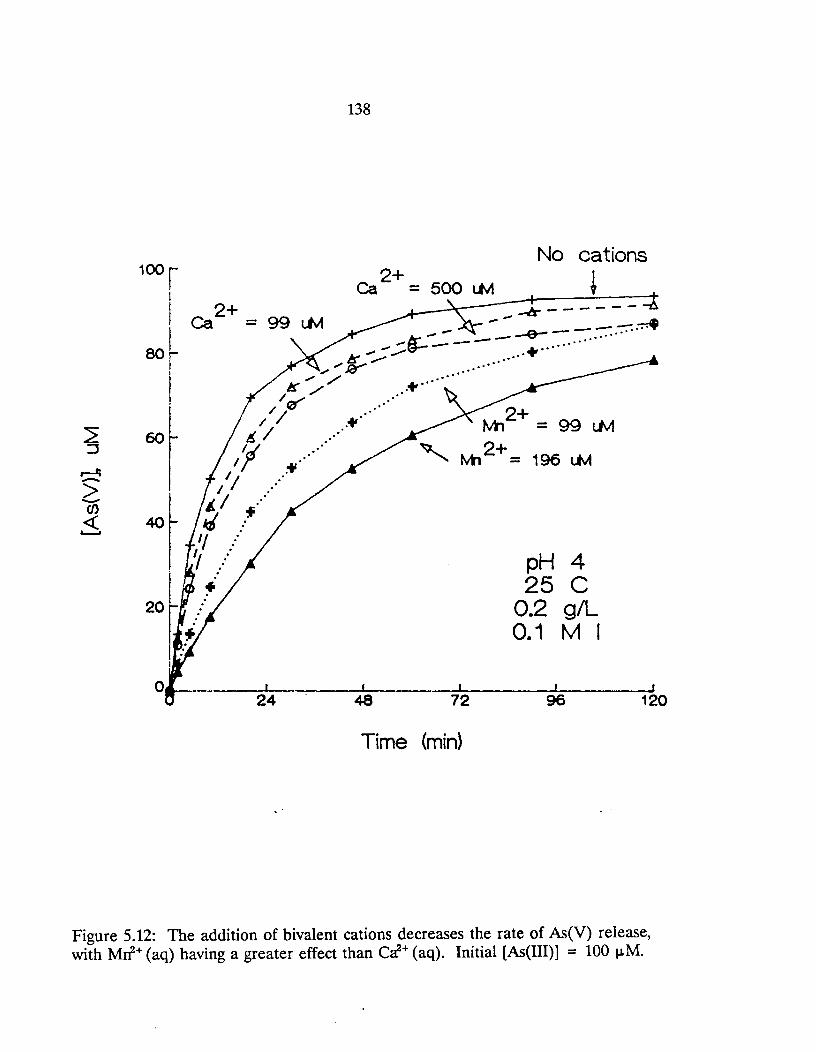
.. r--'I -> -(J)
« '---'
100r I
I 80~
2+ Ca =99LM
I
I 60
24
138
No cations 2+
Ca = 500 LM !
tvh2+ = 99 Ltv!
M12+ = 196 LM
48 72
Time (min)
pH 4 25 C
0.2 giL 0.1 M I
96 120
Figure 5.12: The addition of bivalent cations decreases the rate of As(V) release, with Mrr+ (aq) having a greater effect than 01+ (aq). Initial [As(III)] = 100 J,lM.
139
O.15f -...b:---' -----
O.12f -~-
."
~ ." ,-
."
K
c MJ ."
."
0 ."
:.p ."
to If ~
~l /
/ cM /
~dl c / Mn2+ 0 Added (uM) u -= + 0 .:::::::.
~ ~ 99 0 196
I I I I I 20 40 60 80 100
Time (min)
Figure 5.13: The addition of Mrf+ to a birnessite suspension prior to reaction with As(III) results in the release of greater amounts of Mrf+ (aq) during the reaction.
140
example, if the total concentration of sites is reduced from 502 ~M to 200 ~M, the
As(V) profiles can be predicted from the set of rate constants derived from the
experimental data in absence of cation addition. However, such a loss of reactive
surface sites is much greater than predicted from the amount of Mn adsorbed. In
the experiment where 99 ~M Mrr+ is equilibrated with the oxide surface, 54 ~M
Mrr+ was adsorbed when the As(III) was added. If each Mn atom bonded with one
surface site, then the total concentration of reactive surface sites would only be
reduced to 448 ~M. Likewise, if each Mn atom formed a bidentate complex with two
surface sites, then the total concentration of reactive surface sites would be 394 ~M,
which is still much greater than the concentration needed to model the data.
Another approach to modeling the As(V) data would be, first, to assume that
the total concentration of reactive surface sites is only reduced by the concentration
of adsorbed Mrr+ , and second, to vary the rate constant, k1• This approach results
in a good prediction of the As(V) data when kl is reduced from 5 to 2 M-~ec-l. Both
approaches imply that the adsorbed Mn influences the reactivity of more than one
surface site.
5.3.8 Summary of the Dynamics of N(III) and Birnessite
The experiments involving aqueous As(III) and birnessite at pH 4 and 25 0 C
indicate that the depletion of As(III) from solution is rapid with a time scale of
minutes. The oxidation product As(V) is released almost as quickly, while the
release of the reduction product Mn(II) is slightly slower. The results also show that
the concentration of dissolved oxygen has no effect on the rate of reaction. These
141
observations suggest (i) birnessite directly oxidizes As(III) through a surface
mechanism, (ii) the adsorption of As(III) is the slowest step in the production of
As(V), and (iii) the reaction products As(V) and Mn(II) are released by different
mechanisms.
The effect of increasing pH from 4 to 8.2 has a small influence on the rate
and extent of As(III) uptake and As(V) release, but it greatly reduces the rate and
amount of Mn(II). Near-equivalent quantities of As(V) and Mn(U) are released at
pH 4, while very little Mn(U) is released at pH values above 7.
Increasing the temperature of the birnessite suspension from 15 to 35 0 C
results in increased rates of reaction for all species. The extent of As(UI) depletion
and As(V) release is equivalent for all temperatures, but the extent of Mn(U) release
decreases with increasing temperature. This is consistent with equilibrium
observations of metal cation adsorption by Machesky (1990).
It is also observed that the rates of reaction decrease when adsorption
competitive bivalent cations (Mn2+ , Ci+) are added to and equilibrated with the
particle suspension. All of the observations are consistent with the surface reaction
hypothesis.
The proposed four-step reversible kinetic model is successful in describing the
time-dependent behavior of the aqueous reactants and products over a pH range
from 4 to 8.2 and a temperature range from 15 to 35 0 C. The kinetic description
allows the reaction to be described in terms of specific aqueous and surface
processes.
142
5.4 Dynamics of Se(IV) and Birnessite
5.4.1 Behavior of Se(IV). Se(VI). and Mn(H)
Reaction conditions for the Se(IV)-birnessite experiments are listed in Table
5.6. In all experiments, total manganese and total manganese surface groups are in
excess of total selenium. Data from all of the experiments are listed in Appendix A.
The experiments were run for a time period of nearly a month and the reactions had
not yet reached completion. With the extended time period of the experiment, other
reactions than those proposed were possible. Two experiments were run to assess
the possibility and extent of the additional reactions.
One possible reaction pathway in the transformation of Se(IV) to Se(VI) is
the homogeneous oxidation of Se(IV) by dissolved oxygen. This pathway was
explored by monitoring the Se(IV) concentration in a birnessite-free solution at pH
4 and 25°C (experiment MnSe4). For the duration of the experiment (673 hours),
no changes in the concentration of Se(IV) were observed and no Se(VJ) appeared,
indicating that the homogeneous oxidation of Se(IV) under the experimental
conditions either does not occur or is extremely slow.
Another possible reaction that is independent of the proposed mechanism is
the acidic dissolution of the oxide phase. Eary and Rai (1987) had observed the
appearance of 20 to 50 ~M MJiZ+ (aq) in a suspension of pyrolusite (Il-MnOAs» at
pH values between 3.0 and 4.0 on time scales of hundreds of hours. In our
laboratory, birnessite particles were suspended in a Se(IV)-free solution at pH 4 and
25°C for 673 hours and the solution was sampled periodically for MJiZ+ (aq)
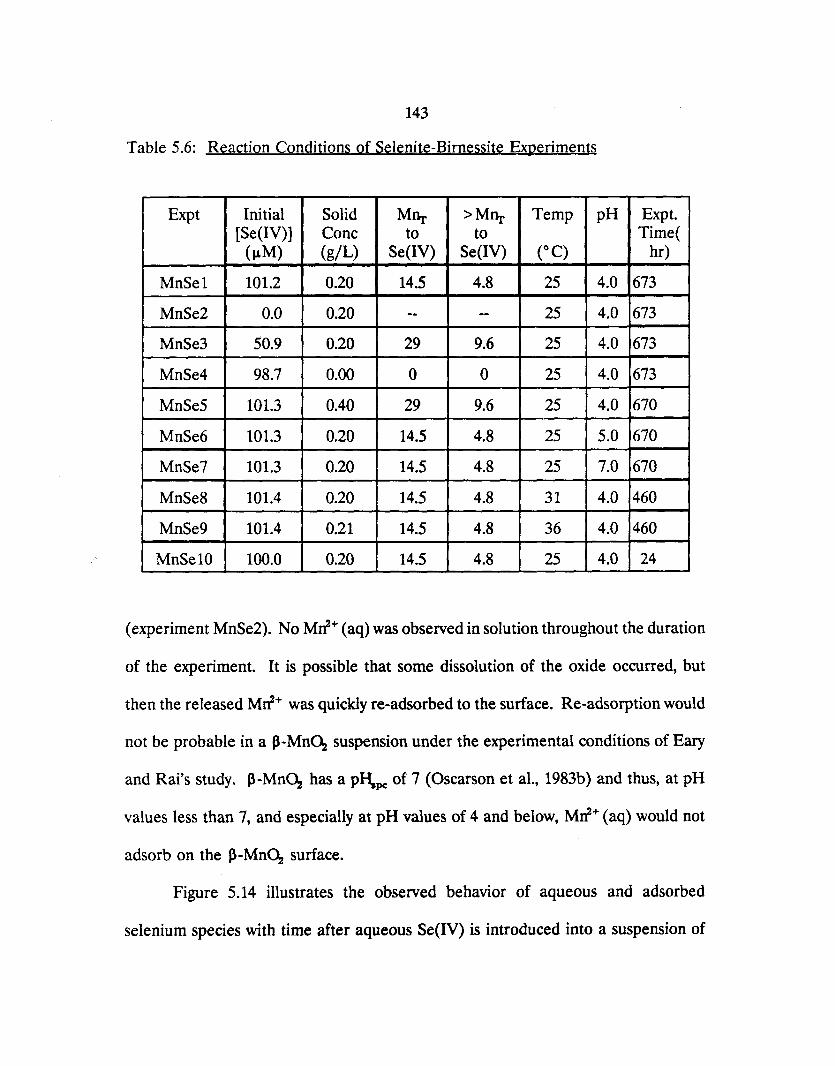
143
Table 5.6: Reaction Conditions of Selenite-Birnessite Experiments
Expt Initial Solid Mfir >Mnr Temp pH Expt. [Se(IV)] Cone to to Time( (~M) (giL) Se(IV) Se(IV) (OC) hr)
MnSe1 101.2 0.20 14.5 4.8 25 4.0 673
MnSe2 0.0 0.20 -- -- 25 4.0 673
MnSe3 50.9 0.20 29 9.6 25 4.0 673
MnSe4 98.7 0.00 0 0 25 4.0 673
MnSe5 101.3 0.40 29 9.6 25 4.0 670
MnSe6 101.3 0.20 14.5 4.8 25 5.0 670
MnSe7 101.3 0.20 14.5 4.S 25 7.0 670
MnSeS 101.4 0.20 14.5 4.8 31 4.0 460
MnSe9 101.4 0.21 14.5 4.8 36 4.0 460
MnSelO 100.0 0.20 14.5 4.S 25 4.0 24
(experiment MnSe2). No Mrr+ (aq) was observed in solution throughout the duration
of the experiment. It is possible that some dissolution of the oxide occurred, but
then the released Mrr+ was quickly re-adsorbed to the surface. Re-adsorption would
not be probable in a Jl-Mn~ suspension under the experimental conditions of Eary
and Rai's study. Jl-Mn~ has a pf\pc of 7 (Oscarson et aI., 1983b) and thus, at pH
values less than 7, and especially at pH values of 4 and below, Mrr+ (aq) would not
adsorb on the Jl-Mn~ surface.
Figure 5.14 illustrates the observed behavior of aqueous and adsorbed
selenium species with time after aqueous Se(IV) is introduced into a suspension of
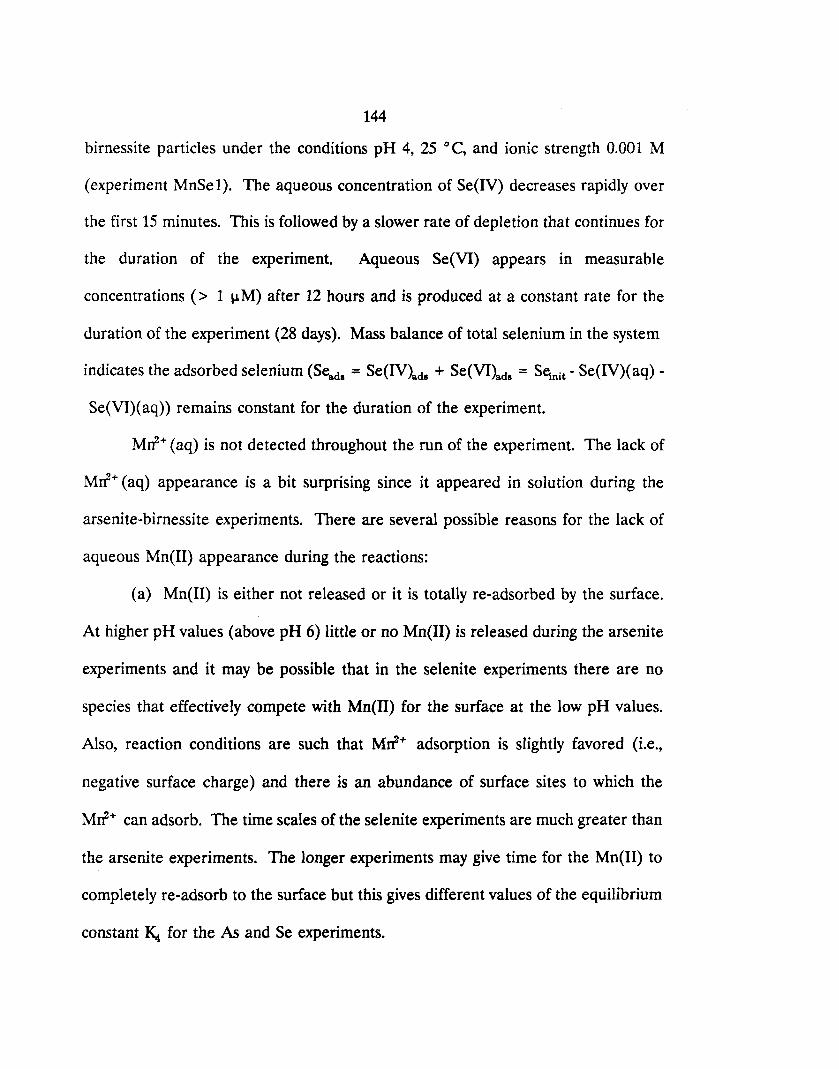
144
birnessite particles under the conditions pH 4, 25°C, and ionic strength 0.001 M
(experiment MnSe1). The aqueous concentration of Se(IV) decreases rapidly over
the first 15 minutes. This is followed by a slower rate of depletion that continues for
the duration of the experiment. Aqueous Se(VI) appears in measurable
concentrations (> 1 "" M) after 12 hours and is produced at a constant rate for the
duration of the experiment (28 days). Mass balance of total selenium in the system
indicates the adsorbed selenium (Seadl = Se(IV)adl + Se(VI)ads = Stinit - Se(IV)( aq) -
Se(VI)( aq» remains constant for the duration of the experiment.
Mrr+ (aq) is not detected throughout the run of the experiment. The lack of
Mrr+ (aq) appearance is a bit surprising since it appeared in solution during the
arsenite-birnessite experiments. There are several possible reasons for the lack of
aqueous Mn(II) appearance during the reactions:
(a) Mn(II) is either not released or it is totally re-adsorbed by the surface.
At higher pH values (above pH 6) little or no Mn(II) is released during the arsenite
experiments and it may be possible that in the selenite experiments there are no
species that effectively compete with Mn(II) for the surface at the low pH values.
Also, reaction conditions are such that Mrr+ adsorption is slightly favored (i.e.,
negative surface charge) and there is an abundance of surface sites to which the
Mrr+ can adsorb. The time scales of the selenite experiments are much greater than
the arsenite experiments. The longer experiments may give time for the Mn(II) to
completely re-adsorb to the surface but this gives different values of the equilibrium
constant K. for the As and Se experiments.
c o +J~'<t .p~ C Q) () c o U
1,OOr
I I
O.B°t .
145
300 400 ~I .,--.-_---.1.1 ____ ---1
500 600 700
Time (hr)
Figure 5.14: Experimental behavior of aqueous and adsorbed Se species in a 0.2 giL birnessite suspension at pH 4, 25°C, and 0.001 M NaN(\. Initial concentration of Se(IV) is 100 ~M.
146
(b) Other reactions which have not been identified either tied up Mn(II) on
the surface in the Se experiments or kept Mn(II) in solution at low pH values in the
As experiments. Possible explanations are that in the Se experiments the time scale
is long enough for Mn(II) to be oxidized to either Mn(III} or Mn(IV} forming a
solid, or Mn(II) forms an aqueous complex with As(V) that keeps it in solution.
(c) Mn(II) is not produced during the reaction of birnessite with selenite.
Instead of transferring both electrons to on Mn(JV) atom, two Mn(IV) atoms each
receive one electron and form Mn(III) atoms on the surface which would not be as
likely to desorb or be released into solution. Assuming that the energetics of a
surface reaction is approximated by the energetics of a bulk solid reaction, the
energetics of Mn(IV}-Mn(III) redox reactions are estimated from
Mn~(s) + W + e- = MnOOH(s} ~o = 1.04 volts
At pH 4, & ~ 0 = 0.083 volts for the 2Mn(IV) + Se(IV} = 2Mn(III} + Se(VI)
reaction. This value is less than the value of &E1t = 0.092 volts for the Mn(IV) +
Se(IV) = Mn(II) + Se(VI) reaction. Thus, energetics are lower for this type of
reaction, but they are still favorable. Another observation that might support a
mechanism of this type is the conclusion of an EXAFS spectroscopic analysis for the
occurrence of a Se(IV)-Fe(III) bidentate surface species when selenite is added to
a goethite suspension and then dried (Hayes et aI., 1987). If it was assumed that
Se(IV) also formed a bidentate surface species with birnessite, then spreading the
electrons to two Mn(IV) atom might be more plausible. However, in the EXAFS
study, the experimental conditions where such that Se(IV) adsorption was highly
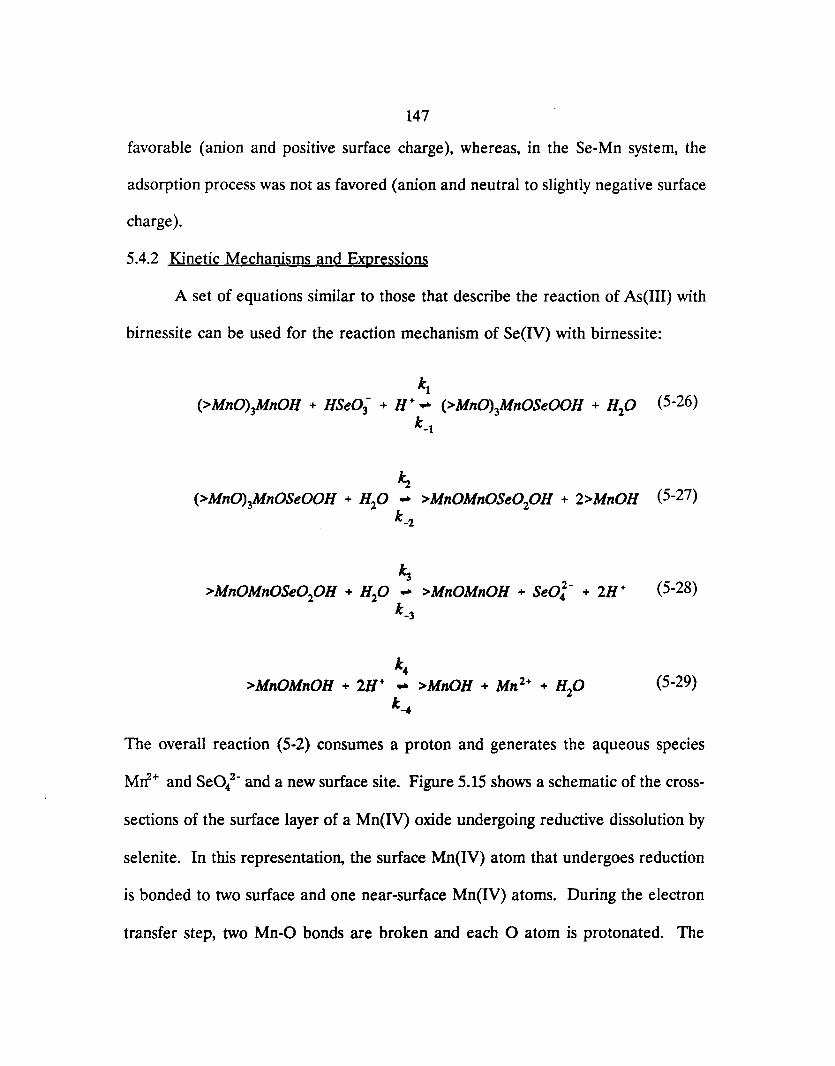
147
favorable (anion and positive surface charge), whereas, in the Se-Mn system, the
adsorption process was not as favored (anion and neutral to slightly negative surface
charge).
5.4.2 Kinetic Mechanisms and Expressions
A set of equations similar to those that describe the reaction of As(III) with
birnessite can be used for the reaction mechanism of Se(IV) with birnessite:
kl (>MnO)3MnOH + HSe03- + H+ ... (>MnO)3MnOSeOOH + H
20 (5-26)
k_l
~ (>MnO)3MnOSeOOH + H20 ... >MnOMnOSe020H + 2>MnOH (5-27)
k_2
k4 >MnOMnOH + 2H+ ... >MnOH + Mn 2+ + H20
k~
(5-28)
(5-29)
The overall reaction (5-2) consumes a proton and generates the aqueous species
Mrr+ and SeQt and a new surface site. Figure 5.15 shows a schematic of the cross-
sections of the surface layer of a Mn(IV) oxide undergoing reductive dissolution by
selenite. In this representation, the surface Mn(IV) atom that undergoes reduction
is bonded to two surface and one near-surface Mn(IV) atoms. During the electron
transfer step, two Mn-O bonds are broken and each 0 atom is protonated. The
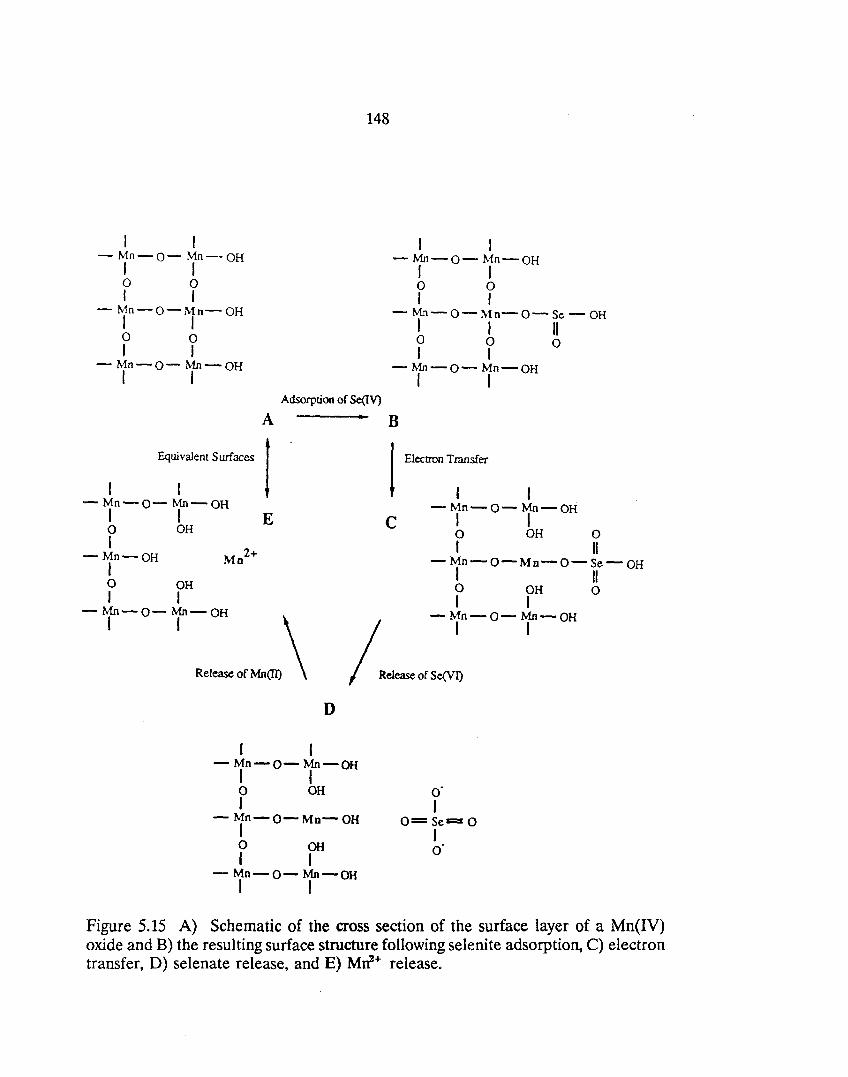
148
I I - Mn-o- Mn-OH
I I o 0 I I
- Mn-O-Mn-OH I I o 0 J J
-Mn-O-Mn-OH I I
J I -Mn-O-Mn-OH
I I o 0 I I
-Mn-O-Mn-O-Se-OH
I I " o 0 0 I I
- Mn-O- Mn-OH I I
Adsorption of Se(IV)
A ... B
Equivalent Surfaces I I I
-Mn-O-Mn-OH I I E o OH I
-Mn-OH Mo2+ I o OH I I
I Electron Transfer
I I -Mn-O-Mn-OH
C I I o OH 0
I " -Mn-O-Mn-O-Se-OH
I " o OH 0 I I
-Mn-O-Mn-OH
I I \
Release of Mn(Il) /
-~1"-O-f-OH
Release of Se(VI)
D
I I - Mn-o- Mn-OH
I I o OH I
-Mn-O-Mn-OH I o OH I I
- Mn-o- Mn-OH I I
O· I
O=Se=O I O·
Figure 5.15 A) Schematic of the cross section of the surface layer of a Mn(IV) oxide and B) the resulting surface structure following selenite adsorption, C) electron transfer, D) selenate release, and E) Mrr+ release.
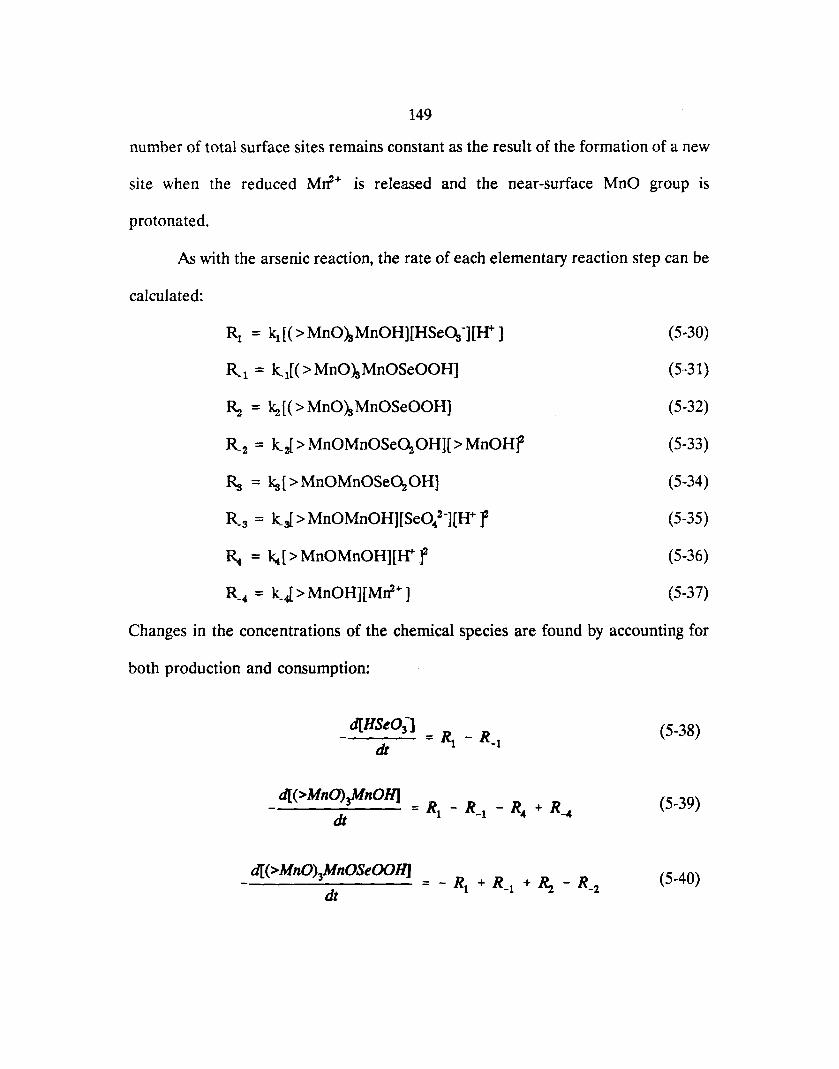
149
number of total surface sites remains constant as the result of the formation of a new
site when the reduced MIf+ is released and the near-surface MnO group is
protonated.
As with the arsenic reaction, the rate of each elementary reaction step can be
calculated:
Rl = k1[(>MnO>SMnOH][HSeOs-][W] (5-30)
R_l = k_ 1[( > MnO>SMnOSeOOH] (5-31)
~ = ~[(>MnO~MnOSeOOH] (5-32)
R_2 = kJ>MnOMnOSe~OH][>MnOHr (5-33)
Rs = ks[>MnOMnOSe~OH] (5-34)
R_3 = kJ> MnOMnOH][SeOl-](H+ r (5-35)
~ = ~[>MnOMnOH][Wf (5-36)
R-4 = kJ > MnOH][MIf+ ] (5-37)
Changes in the concentrations of the chemical species are found by accounting for
both production and consumption:
d[(>MnO)3MnOSeOOIlJ = _ R + R + P - R (5-40) dt 1 -1 '"'2, -2
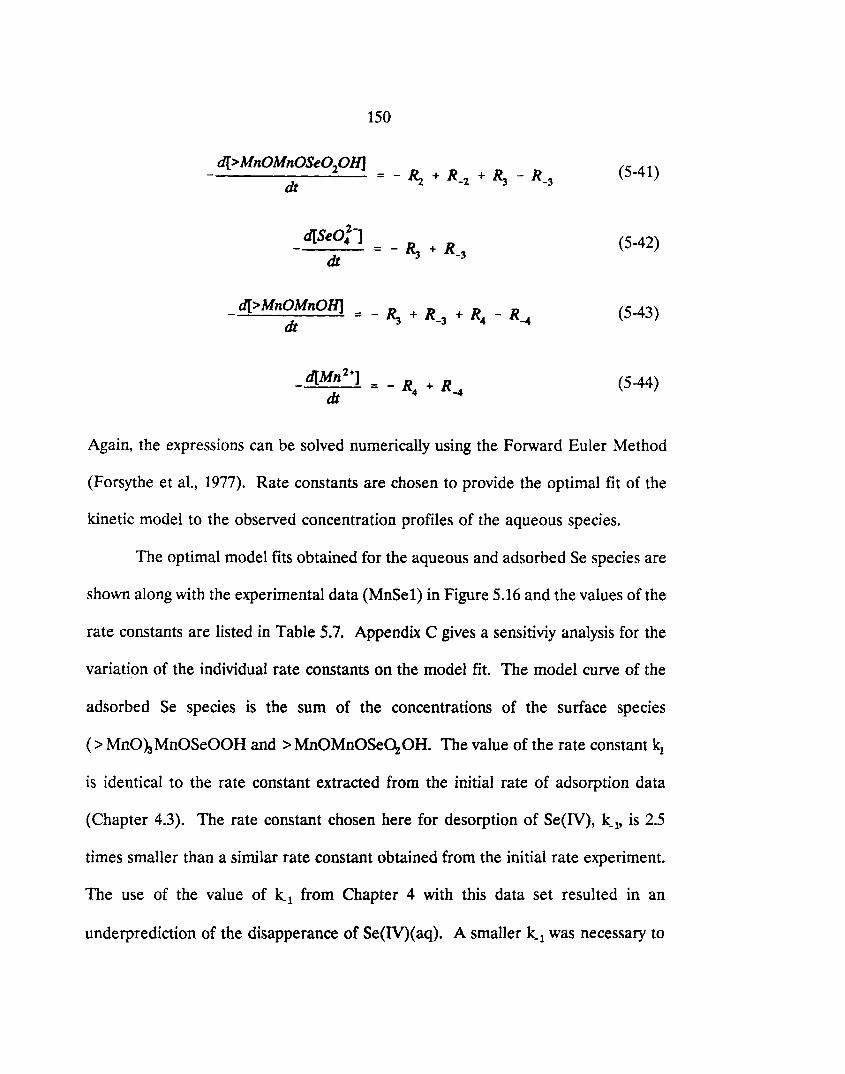
d[>MnOMnOSe02°H]
dt
2-d[SeO" ]
dt
d[> MnOMnOH] = tit
150
(5-41)
= - 11 + R .&'3 -3 (5-42)
(5-43)
(5-44)
Again, the expressions can be solved numerically using the Forward Euler Method
(Forsythe et aI., 1977). Rate constants are chosen to provide the optimal fit of the
kinetic model to the observed concentration profiles of the aqueous species.
The optimal model fits obtained for the aqueous and adsorbed Se species are
shown along with the experimental data (MnSe1) in Figure 5.16 and the values of the
rate constants are listed in Table 5.7. Appendix C gives a sensitiviy analysis for the
variation of the individual rate constants on the model fit. The model curve of the
adsorbed Se species is the sum of the concentrations of the surface species
(> MnOhMnOSeOOH and > MnOMnOSe~OH. The value of the rate constant kl
is identical to the rate constant extracted from the initial rate of adsorption data
(Chapter 4.3). The rate constant chosen here for desorption of Se(IV), kl' is 2.5
times smaller than a similar rate constant obtained from the initial rate experiment.
The use of the value of kl from Chapter 4 with this data set resulted in an
underprediction of the disapperance of Se(IV)(aq). A smaller kl was necessary to
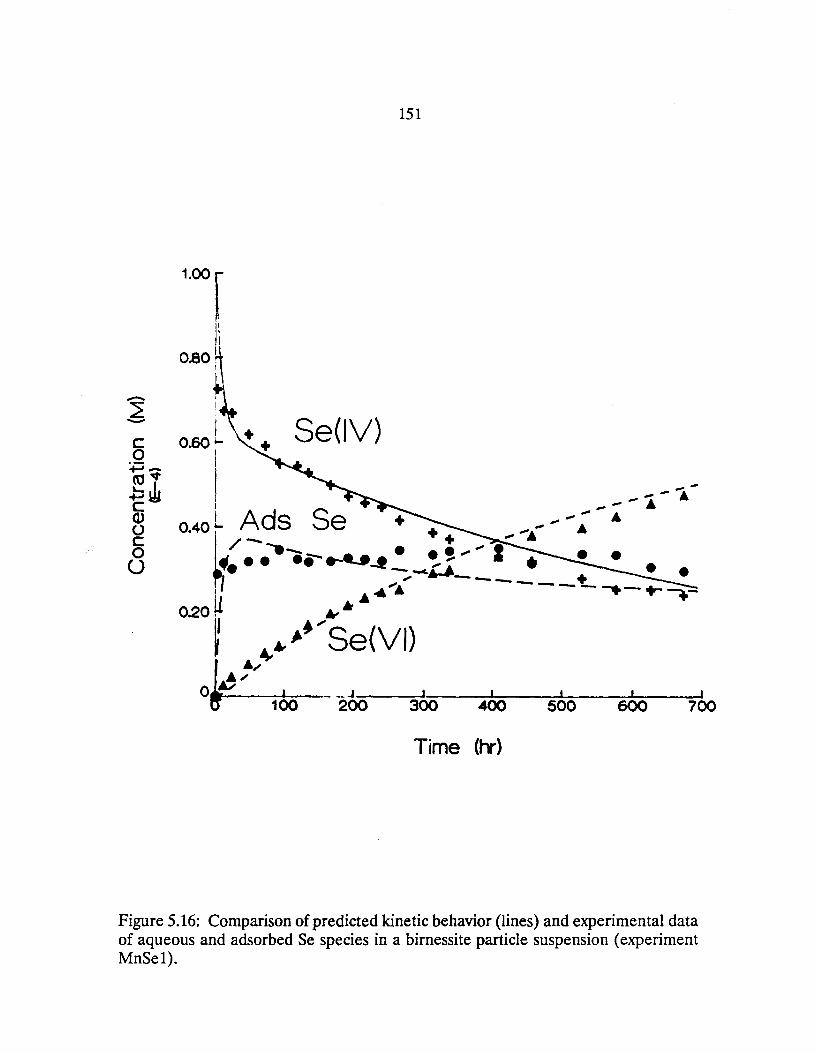
c o :p-(Ov .t:;JJ C Q) o c o o
151
Se(IV) I 0.60"-
I I --I - - • I _--A
0.40 L Ads Se + + _-,,; •
~/_ + -6 .. • .--....... --.-1. .! ,"" I • . ---~ .. 1 .,.. ---- +
I ....... ----.-+--..-O.2oU .,. ~
~ 4-"~~" Se(VI)
~ ./
~/ o 160 - 200-=----3~OO!.I-: ::---~400~1 -=---'"""':5~6:-::0~--=600~1 -=---~7~bo
Time (IT)
Figure 5.16: Comparison of predicted kinetic behavior (lines) and experimental data of aqueous and adsorbed Se species in a birnessite particle suspension (experiment MnSe1).
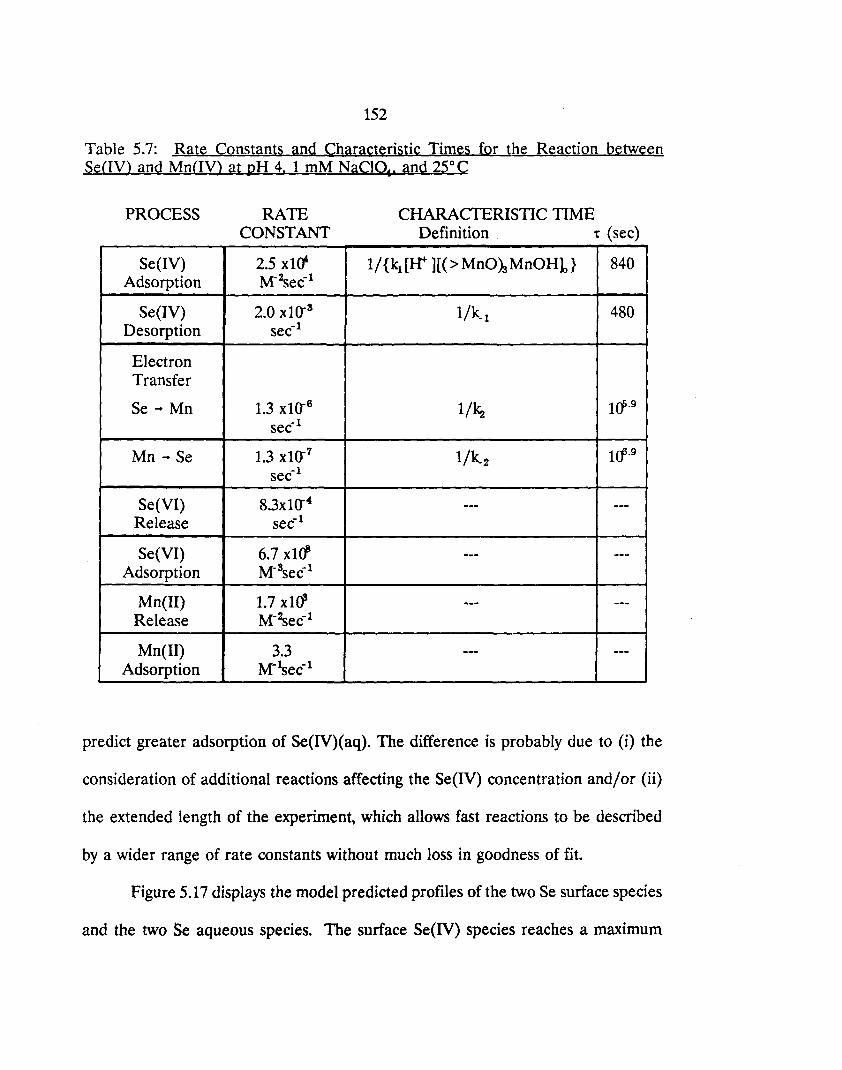
152
Table 5.7: Rate Constants and Characteristic Times for the Reaction between Se(IV) and Mn(IV) at pH 4. 1 mM NaCl<4. and 25° C
PROCESS
Se(IV) Adsorption
Se(IV) Desorption
Electron Transfer
Se .... Mn
Mn .... Se
Se(VI) Release
Se(VI) Adsorption
Mn(II) Release
Mn(II) Adsorption
RATE CONSTANT
2.5 x10' M-2sec- l
2.0 xl(rs
sec-1
1.3 xlo-6
sec-1
1.3 X1o-7 sec-1
8.3xlo-4
sec-1
6.7 xU! M-Ssec-1
1.7 xlfP M-\ec-1
3.3 M-~ec-l
CHARACfERISTIC TIME Definition t (sec)
1/{k1[Ir- ][(>MnOkMnOH1} 840
1/kl 480
l/~ 1cr·9
1/k2 1(f-9
--- ---
--- ---
--- ---
--- ---
predict greater adsorption of Se(IV)(aq). The difference is probably due to (i) the
consideration of additional reactions affecting the Se(IV) concentration and/or (ii)
the extended length of the experiment, which allows fast reactions to be described
by a wider range of rate constants without much loss in goodness of fit.
Figure 5.17 displays the model predicted profiles of the two Se surface species
and the two Se aqueous species. The surface Se(IV) species reaches a maximum
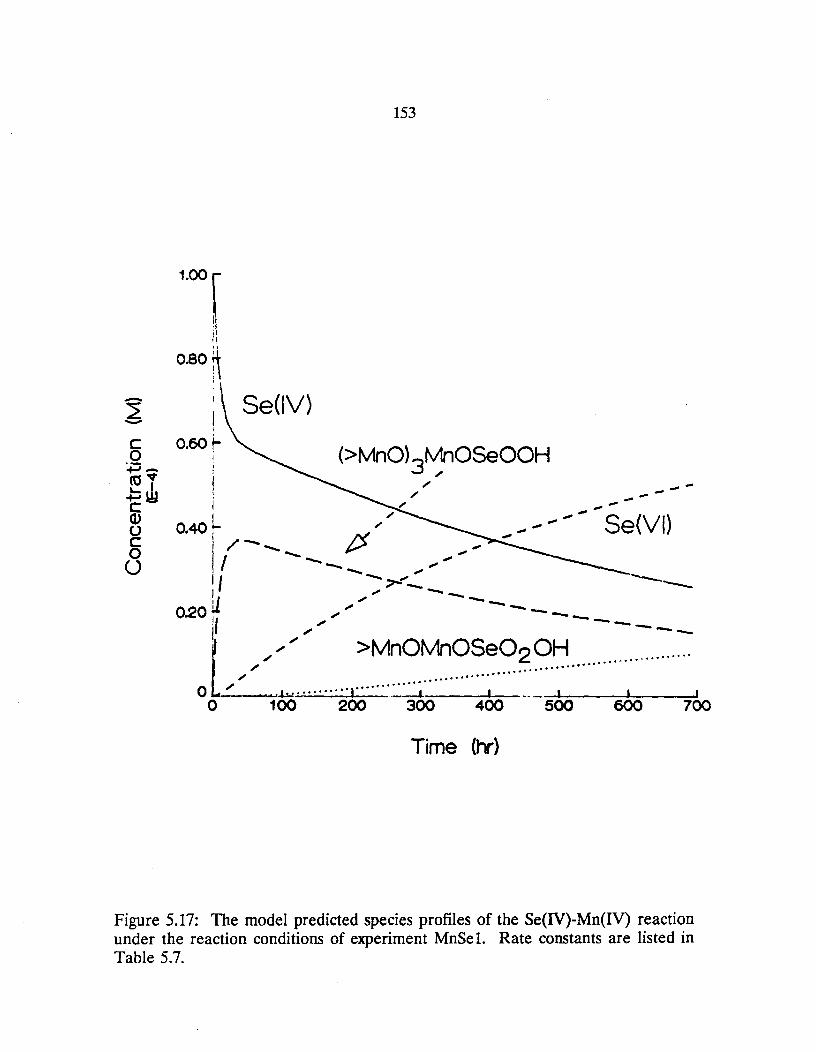
153
Se(lV)
(>MnO)3~nOSeOOH ;' --. ;'
I ;' L ;';'
0.40, N II /-.............. V ,
I """'-....... ", 'I -. ;::r-t'" -I "'-_ lL '" -
-----_...... Se(VI)
-----0.20' ",'" ----
JI '" --_ I ; ~~~
t~~~~~~ :~~~.~~~.?~?~ ..................... . o ..L:.: .......... 1._--1 I __ I I ,
o 100 200 300 400 500 600 700
Time (ty)
Figure 5.17: The model predicted species profiles of the Se(IV)-Mn(IV) reaction under the reaction conditions of experiment MnSe 1. Rate constants are listed in Table 5.7.
154
concentration of 36 ~M after 40 hours and then slowly decays at about the same rate
of the decay of aqueous Se(IV). The surface Se(VJ) species begins to appear after
approximately 100 hours, and at the end of the experiment is only ten percent of the
total selenium in the system. This is a result of a larger rate of Se(VJ) release than
rate of electron transfer. Once the surface Se(VJ) species is formed from electron
transfer, the complex is immediately released into solution. The increase in the
concentration of the surface species at later times is the result of re-adsorption of
aqueous Se(VJ). The re-adsorption is not highly favored and only occurs once the
concentration of Se(VJ)(aq) is relatively large.
The concentration of Se(IV)(aq) is controlled initially by the adsorption and
desorption processes, but at longer times is controlled by the transfer of electrons.
There appears to be a limit to the total amount of Se (Se(IV :nd Se(VJ» that will
adsorb to the surface. The surface is quickly filled with Se(IV). The adsorption of
Se(IV) only continues after Se(IV) on the surface has been transformed and Se(VJ)
has been released. Se(VJ) does not compete well with Se(IV) for surface sites and
is only adsorbed after the concentration of Se(IV)( aq) has been greatly reduced.
The forward processes that favor the production of aqueous Se(VJ) are the
adsorption of Se(IV), transfer of electrons from Se(IV) to Mn(IV), and the release
of Se(VJ) from the surface. Of these three processes, the transfer of electrons from
Se(IV) to Mn(IV) has the longest characteristic time and is thus the rate-determining
step in the production of Se(VI). The characteristic times for those steps that
occurred prior to the rate limiting step are listed in Table 5.7. Also, the sensitivity
155
analyses in Appendix C indicate that only the ratios of ks/k-s and ~/k4 are
obtainable from the data since no kinetic information of individual steps (e.g., values
of individual rate constants) is available from steps that occurs after the rate limiting
step. Data for reaction processes that occur after the rate limiting step can only be
described by equilibrium constants.
5.4.3 Effect of Initial Concentrations of Se{IV) and t»-Mn(4
The applicability of the kinetic model is tested by varying the initial
concentrations of the reactants. The same set of rate constants should be able to
model a range of initial concentrations. The effect of initial concentration of the
reactants on the rate of reaction was studied in a series of experiments at pH 4 and
25 0 C. Figure 5.18 details the behavior of aqueous Se(IV) and Se(VJ). Increasing
the relative amount of Mn to Se in a system promotes the depletion of Se(IV) from
solution and the release of aqueous Se(VJ). Doubling the initial concentration of
both reactants produces the same relative rates of Se(IV) depletion and Se(VJ)
release.
The kinetic model describes the experimental data well. The predicted
behavior of the aqueous concentrations of Se(IV) and Se(VJ) are plotted together
with the experimental data points in Figure 5.18. The set of rate constants and
equilibrium constants for each experiment are listed in Table 5.8. The rate constants
from experiment MnSe 1 were used to describe the other data sets, and it was
necessary to adjust only the values of the rate constants kI' kI' and k_s to provide a
more accurate fit. The rate constants ki and k_I are the smallest for the data set with

'+-o
c (J.) o '-(J.)
Q.
80
6O~ Ii
40 ':'.1 .;,..~
~
20
"., . ..... A ... ·
156
- + 100 LM Sea\I) + ~ 78 LM >M-O-I
4 50 LM SeQV1 + ~ 78 LM >M-O-I
• 100 LM SeQV1 + 956 LM >M-O-I
...... 4 At· ........
• "'1'--+
-.... -• I .~....,,,-,.,..,-• .A. ---_ . .-O~ __ -*~~~~~~ __ ~~ __ ~~ __ ~ __ ~ o 100 200 300 400 500 600 700
20
+ 100 1M SeeM + 478 1M >M1O-I
• 50 1M SeOV1 + 478 1M >M1O-I
• 100 10M SeOV1 + 956 1M >M1O-I
_ ....... ~.~ ..... .... ~. .. .... ~.~.. .. ............ .
... "".. .. ........ .. o{<.
~. .. ~.~. I A
~.
(c •• A <" ~. ,.
/ ... -..... ..... ~ .•
1+ -+
100 200 300 400 500 600 700
Time <tTl
Figure 5.18: Experimental and modeled (lines) profiles of aqueous Se(JV) and Se(VJ) in a birnessite suspension with varying initial concentrations of Se(IV) and 0-Mn~.
157
the highest total concentration of reactants (MnSe5), but the equilibrium constant
Kl is the same for the data set with the same initial Se(IV) concentration (MnSe 1).
The first equilibrium constant for the data set with the lowest total concentration of
reactants (MnSe3) is larger by a factor of two (+0.3 log units). Although some of
the rate constants for the experiments with the same initial Mn/Se ratio are different,
the overall equilibrium constant, K, is the same. These experiments give a small
range of values for the rate constants and equilibrium constants and thus provide a
good test for the applicability of the kinetic model.
5.4.4 Effect of pH
The reaction between selenite and birnessite was studied as a function of pH
and the resulting concentration profiles of aqueous Se(IV) and Se(VI) are plotted in
Figures 5.19 and 5.20, respectively. Aqueous Se(IV) depletion initially is rapid with
the extent of depletion increasing with decreasing pH. At pH 4, the removal of
aqueous Se(lV) continues until only 25 percent of the initial Se(IV) remains after
670 hours. At pH 5, the data indicate that the concentration of aqueous Se(IV)
decreases for the first 150 hours of the experiment, reaching about 60 percent of the
initial Se(IV). For the next 250 hours of the experiment the concentration is
constant but then begins to decrease again. After 670 hours, 50 percent of the initial
Se(IV) remains in solution. At pH 7, the removal of aqueous Se(IV) stops after 48
hours at about 70 percent and then increases to about 75 percent after 300 hours and
remains constant for the duration of the experiment. The observed increases in
Se(IV) concentration may be due to experimental uncertainties or a result of
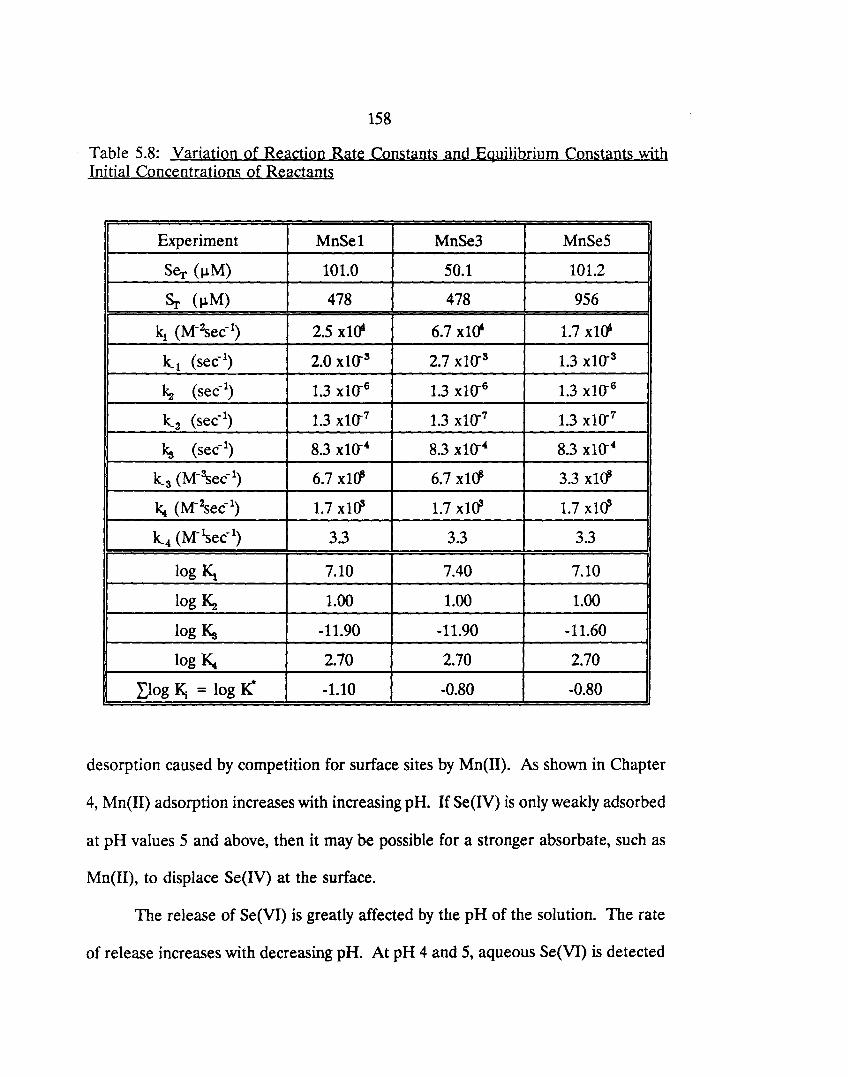
158
Table 5.8: Variation of Reaction Rate Constants and Equilibrium Constants with Initial Concentrations of Reactants
Experiment MnSel MnSe3 MnSe5
Se,. (JlM) 101.0 50.1 101.2
Sr (JlM) 478 478 956
kl (M-Zgec- 1) 2.5 xl<1 6.7 x1<1 1.7 xl<1
ki (sec-I) 2.0 xla-s 2.7 xla-s 1.3 xlo-s
~ (sec-I) 1.3 x1a-6 1.3 xla-6 1.3 xlo-6
k2 (sec-I) 1.3 xla-7 1.3 x1a-7 1.3 xlo-7
ks (sec-I) 8.3 xla-· 8.3 xlo-· 8.3 xlo-·
k_3 (M-'sec-1) 6.7 xlc1 6.7 xlc1 3.3 xlc1
~ (M-2sec-1) 1.7 xlc1 1.7 xlc1 1.7 xlc1
k_4 (M-~ec-l) 3.3 3.3 3.3
log ~ 7.10 7.40 7.10
log ~ 1.00 1.00 1.00
log Ks -11.90 -11.90 -11.60
log K. 2.70 2.70 2.70
Dog 1\ = log K -1.10 -0.80 -0.80
desorption caused by competition for surface sites by Mn(II). As shown in Chapter
4, Mn(IJ) adsorption increases with increasing pH. If Se(lV) is only weakly adsorbed
at pH values 5 and above, then it may be possible for a stronger absorbate, such as
Mn(II), to displace Se(IV) at the surface.
The release of Se(VI) is greatly affected by the pH of the solution. The rate
of release increases with decreasing pH. At pH 4 and 5, aqueous Se(VI) is detected
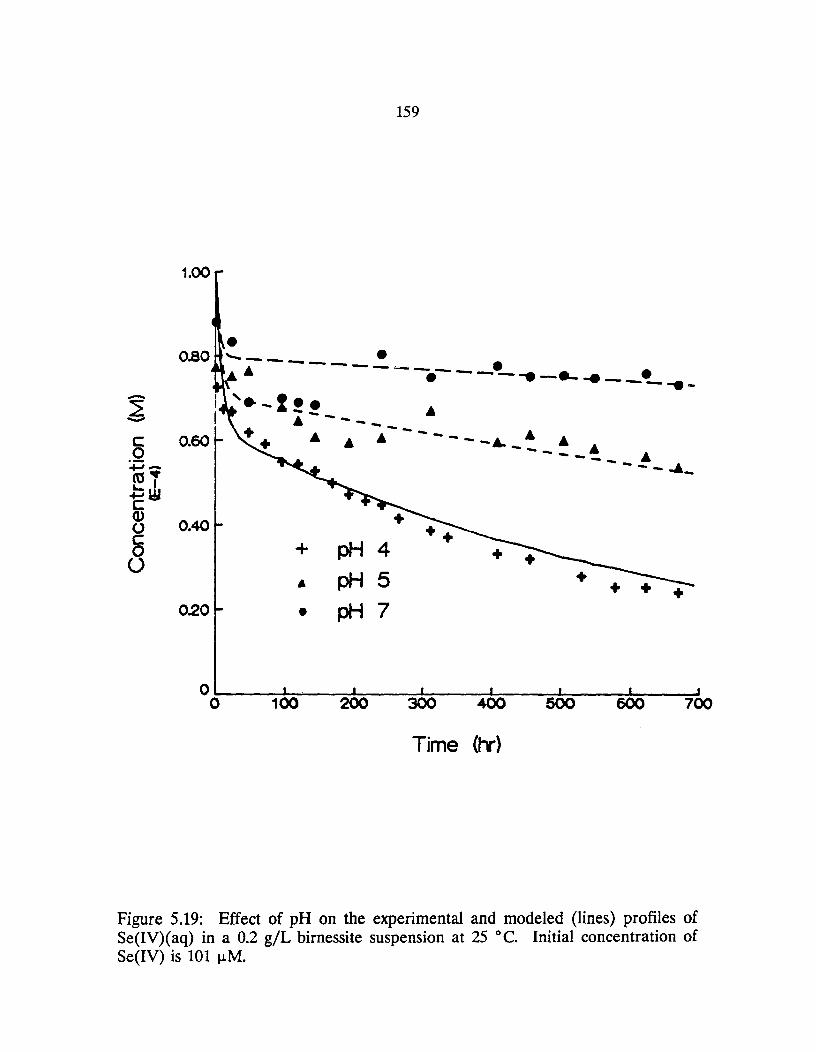
159
1.00
• 0.80 '-------- . .. -----_. . .'" . --- ... - ...... r ----e-
0.60
'.-!!! .. .. ----+ --__.6. + ...... - - -&. - .. -- - _.. .6. ---- ... --- -- ---A_
0.40
+ pH 4
• pH 5 +
0.20 • pI-i 7
Time (ty)
Figure 5.19: Effect of pH on the experimental and modeled (lines) profiles of Se(IV)( aq) in a 0.2 giL birnessite suspension at 25 0 C. Initial concentration of Se(IV) is 101 J.LM.
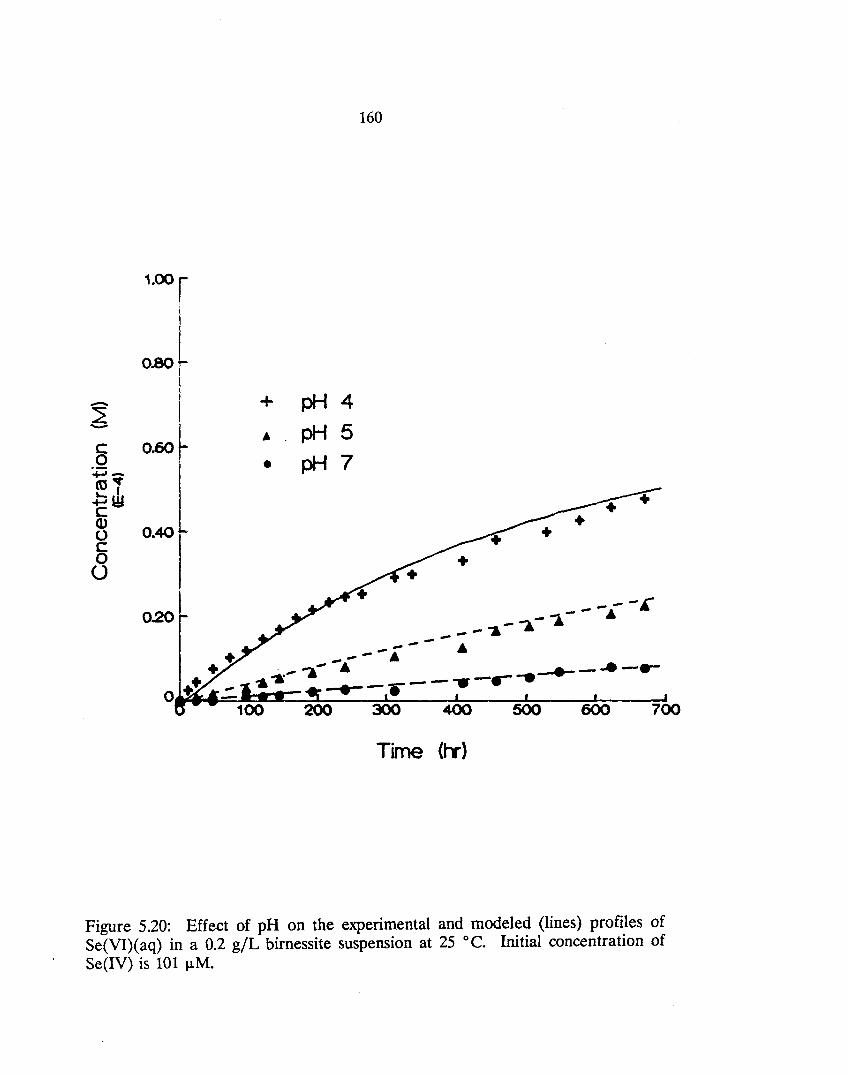
~ -
1.00 r I
0.80~ I !
I 0.60~
O.40l
0.20
+
•
pH4
pH5
pH7
160
__ ~-A-A --- "
Time (tT)
__ r
-- -" ..
Figure 5.20: Effect of pH on the experimental and modeled (lines) profiles of Se(VI)( aq) in a 0.2 giL birnessite suspension at 25 0 C. Initial concentration of Se(IV) is 101 ~M.
161
after 12 hours and continues to increase with time. After 670 hours, 48 percent and
22 percent of the initial Se(IV) has been oxidized to Se(VI) at pH 4 and 5,
respectively. At pH 7, measurable quantities of Se(VI) are not detected until 96
hours and only 8 percent of the initial Se(IV) is oxidized to Se(VI) after 670 hours.
The best model fits of the concentration profiles of the aqueous Se species are
also shown in Figures 5.19 and 5.20 and the values of the selected rate constants are
listed in Table 5.9. For the Se(IV) profiles, the best overall fit was obtained at pH
4. The model was unable to accurately describe the observed increase in Se(IV)
concentration at later times at pH 5 and 7. The best modeled results for the data
sets at pH 5 and 7 were obtained by fitting the initial data points and the linear set
of data points after approximately 250 hours. The maximum difference between the
observed and predicted data points for this approach was less than ten percent.
On the other hand; the agreement between the observed and predicted
concentration curves of aqueous Se(VI) is excellent for all pH values. The observed
variations with pH were easily modeled by adjusting the values of only two rate
constants, k_l and k2. The intrinsic values of k1, k_s. and k,. vary considerably with pH
but the product of the rate constant and [H+] is the same at each pH (i.e., k/ =
k1[H+] = 1.5 M-min-1 at all pH values). The fitted rate constant for the desorption
of Se(IV), k_l' increases with increasing pH. This result agrees in principle with the
observations that, as pH is increased, the surface charge of the birnessite particles
becomes more negative, thus promoting desorption of Se(IV).
162
Table 5.9: Influence of pH on the Se(IV)-Mn(IV) Reaction Rate Constants and Equilibrium Constants
pH 4 5 7
Ser (~M) 101.0 101.3 101.3
Sr (~M) 478 478 478
kl (M-2sec- I) 2.5 xla' 2.5 xl<f 2.5 xl<1
k_l (sec-I) 2.0 xlo-3 3.0 xlo-s 5.0 xlo-s
~ (sec-I) 1.3 xlo-6 5.0 xlo-7 2.0 xlo-7
k2 (sec-I) 1.3 xlo-7 1.3 xlo-7 1.3 xlo-7
ks (sec- l ) 8.3 xlo-· 8.3 xlo-· 8.3 xlo-·
k_s (M-Ssec- I) 6.7 xl£1 6.7 xlot° 6.7 xlOX·
~ (M-2sec-I) 1.7 xlO' 1.7 xl<f 1.7 xl<f
k4 (M-~ec-l) 3.3 3.3 3.3
log ~ 7.10 7.92 9.70
log Ka 1.00 0.57 0.18
log Ks -11.90 -13.90 -17.90
log ~ 2.70 4.70 8.70
The value of the rate constant for the transfer of electrons from Se(IV) to
Mn(lV) decreases with increasing pH. This result is consistent with the decline in
the thermodynamic driving force (ApE or A&r, Table 5.10) of the redox reaction
between HSeOs- and ~-MnOz(s) with increasing pH. At pH 7, the small driving force
of the reaction makes it barely thermodynamically possible (A&r = + 0.004 volts) and
the corresponding rate of Se(VI) release is extremely slow (2 xlo-lO M Se/min). The . driving force increases to 0.092 volts at pH 4. In contrast, the driving force of the
163
Table 5.10 Thermodynamic Drivini Forces for the Se(IV)-Mn(IV) Redox Reaction at Various pH Values
pH 4pE 4Efl (volts)
4 + 1.56 +0.092
5 +1.06 +0.063
7 +0.06 +0.004
redox reaction between HsAs(\(aq) and ~-Mn~(s) reaction is much larger (4Efl =
0.529 volts at pH 4) and the rate of As(V) release is over 4 orders of magnitude
faster (5 x 1<T6 MAs/min).
5.4.5 Effect of Temperature
The effect of temperature on the reaction between selenite and birnessite at
pH 4 was studied. Experiments were run at 25, 31, and 35 ° C, and the resulting
profiles of aqueous Se(IV) and Se(VJ) are plotted in Figures 5.21 and 5.22. Lower
temperatures that may be more typical of some aquatic environments (e.g., lake
sediments, aquifers) were not studied because of the slow rate of reaction at 25 °C.
Temperature has little effect on the aqueous Se(IV) profiles during the initial 100
hours of the reaction. Mter 100 hours, the 35 ° C profile decreases more rapidly
than the lower-temperature profiles. Mter 460 hours, only 14 percent of the initial
Se(IV) at 35 ° C remains in solution, compared to 32 percent at 25 ° C after 450
hours.
While temperature has little apparent effect on the depletion of aqueous
Se(IV), it has a considerable effect on the release of Se(VJ) in solution. Increasing
1.00
0.80
~ -C 0.60 .0 +-' -CO· .p~ C Q) U 0.40 C o o
0.20
~ ..... + A " ..... , ..... , .........
" ,
164
....
+ 25 C
& 31 C
• 36 C
....... .... ............... .... ............ A + +
....... -............. --4.. __ J ....... -.......... --....l ..........
-...-... -.--..
+
o~ ____ ~~ ____ ~~ ______ ~~ ____ ~ ______ ~ o 100 200 300 400 500
Time (tv)
Figure 5.21: Effect of temperature on the experimental and modeled (lines) profiles of Se(IV)(aq) in a 0.2 giL birnessite suspension at pH 4. Initial concentration of Se(IV) is 101 ~M.
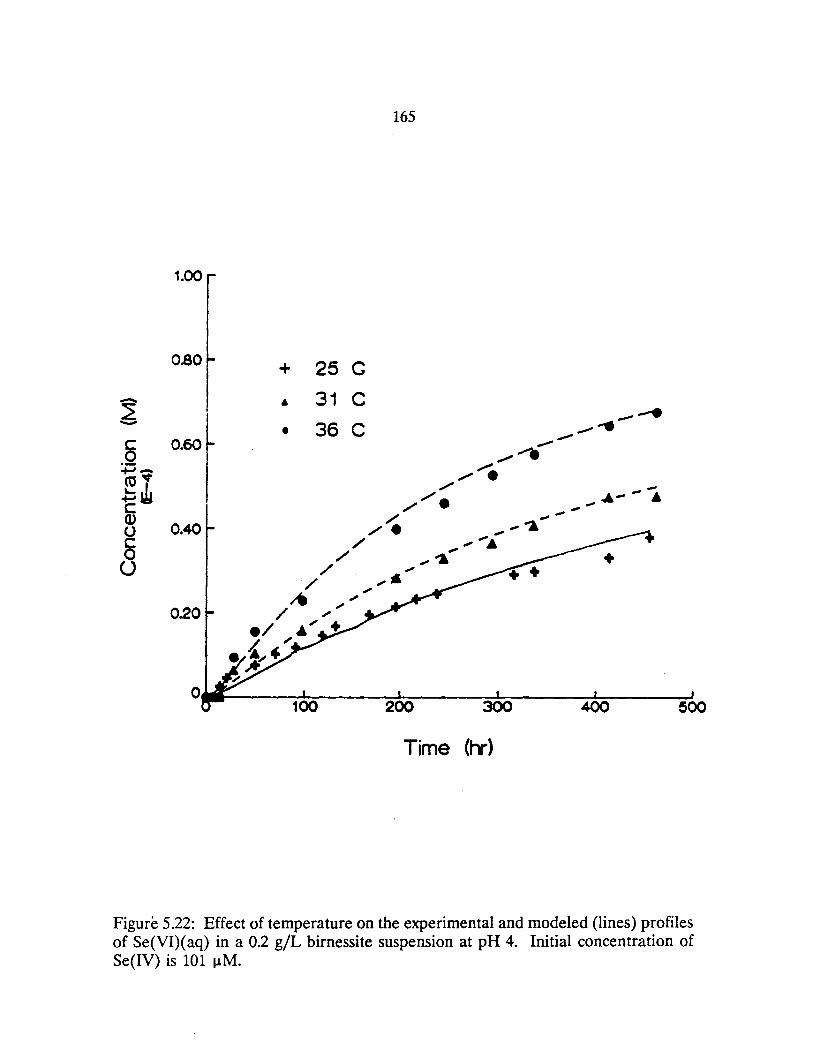
165
0.80 + 25 C
- " 31 C :2 - 36 C • 5 0.60
~-(0 "It
~1Y .. --~ c: --Q) --U 0.40 -~ -6 .". ..... .... U .".~
500
Time (fy)
Figure 5.22: Effect of temperature on the experimental and modeled (lines) profiles of Se(VJ)( aq) in a 0.2 giL birnessite suspension at pH 4. Initial concentration of Se(IV) is 101 ~M.
166
temperature increases the amount and rate of Se(VI) release to solution. Mter 460
hours, 68 percent of the initial Se(IV) at 35 0 C is oxidized to Se(VI) while only 38
and 48 percent is oxidized at 25 and 31 0 C, respectively.
The kinetic model was able to predict accurately the concentration profiles of
the aqueous Se species. The model curves are shown in Figures 5.21 and 5.22 with
the experimental data at each temperature, and the corresponding sets of the rate
constants used to provide the best fits are listed in Table 5.11. The three modeled
curves representing the concentration of Se(IV)(aq) initially lie on top of each other,
and as a consequence the rate constants for adsorption and desorption of Se(IV) are
identical for each temperature data set. The time scales for adsorption and
desorption of the various species are much shorter than the time scale of electron
transfer and the time scale of our observations. Any differences in the rate of
adsorption and desorption due to temperature are not observed at time scales greater
than a few hours. As in the As(III)-Mn(IV) system, only the rate of reaction varied
with temperature; after a few hours, the extent of the reaction was the same for the
range of studied temperatures. At the time scales necessary to observe the redox
transformations between Se(IV) and Mn(IV), the variation of adsorption and
desorption with temperature is too small to notice an effect of temperature on the
adsorption and desorption of aqueous Se(IV).
The model curves for Se(IV)( aq) begin to differ after 24 hours as a
consequence of different rates of electron transfer. The rate constant for the transfer
of electrons from Se(IV) to Mn(IV) increases with increasing temperature. Even
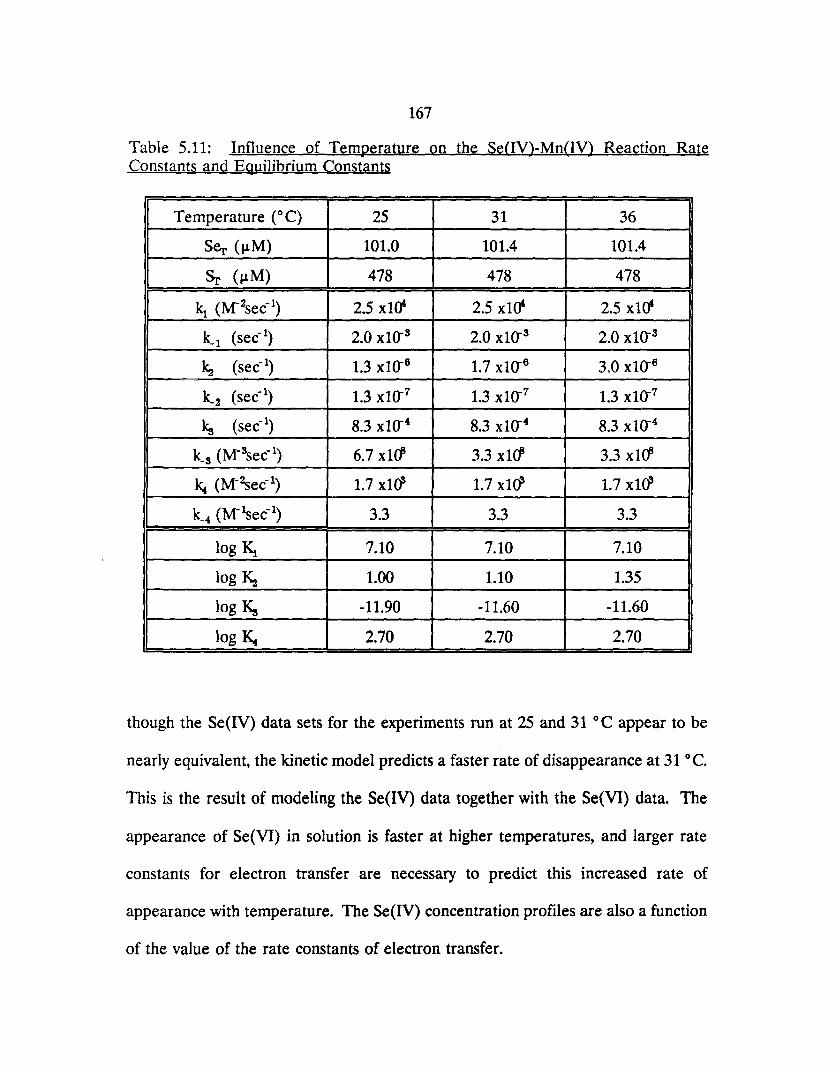
167
Table 5.11: Influence of Temperature on the Se(lV)-Mn(lV) Reaction Rate Constants and Equilibrium Constants
Temperature (OC) 25 31 36
Ser (~M) 101.0 101.4 101.4
Sr (~M) 478 478 478
kl (M- 2sec-1) 2.5 x10' 2.5 x10' 2.5 x10'
k_l (sec-I) 2.0 xl()"s 2.0 xla-s 2.0 x1a-3
kz (sec-I) 1.3 x1a-6 1.7 x1a-6 3.0 xla-6
k.2 (sec- l ) 1.3 x1a-7 1.3 x1a-7 1.3 x1a-7
kg (sec-I) 8.3 xla-· 8.3 xla-· 8.3 x1a-4
k-s (M-Ssec-1) 6.7 x1<f 3.3 x1<f 3.3 x1<f
k. (M-2sec- 1) 1.7 x1<1 1.7 x1<1 1.7 x1<1
k4 (M- ~ec-l) 3.3 3.3 3.3
log ~ 7.10 7.10 7.10
log ~ 1.00 1.10 1.35
log Ks -11.90 -11.60 -11.60
log ~ 2.70 2.70 2.70
though the Se(lV) data sets for the experiments run at 25 and 31 ° C appear to be
nearly equivalent, the kinetic model predicts a faster rate of disappearance at 31 ° C.
This is the result of modeling the Se(IV) data together with the Se(VJ) data. The
appearance of Se(VJ) in solution is faster at higher temperatures, and larger rate
constants for electron transfer are necessary to predict this increased rate of
appearance with temperature. The Se(IV) concentration profiles are also a function
of the value of the rate constants of electron transfer.
168
The model curves plotted in Figures 5.21 and 5.22 essentially illustrate the
variation of the model with changes in the value of k2, the rate constant for the
transfer of electrons from Se(IV) to Mn(IV). With the other reaction parameters
held constant, increasing k2 increases the disappearance of Se(IV) from solution at
long times and the appearance of Se(VI) into the aqueous phase.
5.4.6 Summary of the Dynamics of Se(IV) and Birnessite
The experiments between Se(IV) and birnessite indicate that the initial
disappearance of Se(IV) from solution is rapid with a time scale of minutes. At pH
4 and 25 0 C, aqueous Se(VI) appears after 12 hours of reaction and is slowly
produced at a constant rate throughout the duration of the experiments (28 days).
The extended reaction period results in most of the product Mn(U) being adsorbed
by the oxide surface. The lack of oxidation of Se(IV) in a oxygenated homogeneous
solution and the appearance of aqueous Se(VI) in an (\-free birnessite suspension
is evidence for the redox reaction between Se(IV) and Mn(IV).
Increasing the pH of the particle suspension from 4 to 7 decreases the initial
uptake of Se(IV) and production of Se(VI). Increasing the temperature of the
particle suspension from 25 0 C to 35 0 C has little effect on the rate of disappearance
of aqueous Se(IV) during the initial 100 hours, but after this time period, higher
temperatures increase the rate of Se(IV) depletion. Increasing the temperature of
the solution does increase the rate and amount of Se(VI) that is released into
solution.
The four-step reversible kinetic model is successful in describing the time

169
dependent behavior of the aqueous species Se(IV) and Se(VI) over a pH range from
4 to 7 and a temperature range from 25 to 35 0 C. The kinetic data suggest that the
electron transfer step is the rate determining process for the production of Se(VI).

170
171
Chapter 6
I MPLICA nONS FOR GEOCHEMICAL SYSTEMS
6.1 Introduction
With insight into the rates and mechanisms of arsenic and selenium
transformations derived from controlled experiments in simple heterogeneous
systems, a better understanding of the geochemical cycles of arsenic and selenium is
possible. The purpose of this concluding chapter is to explore the larger geochemical
implications of the experimental results. Four topics are discussed in detail: (i) a
practical use of the kinetic data; (ii) the important role that metal oxide surfaces play
in the overall arsenic and selenium geochemical cycles; (iii) a comparison of
oxidation rates and mechanisms of various inorganic reduced metal species with
manganese oxides; and, (iv) the kinetic estimation of redox potentials of metal oxide
surfaces. A few ideas for future research exploring the geochemistry of trace
elements are also presented.
6.2 Practical Use of Kinetic Data
Despite the success of the kinetic model, it will be rare that future problems
concerning the adsorption and oxidation of arsenic and selenium species will be as
well characterized as the experimental systems presented in this thesis. Given this,
the following exercise is presented to indicate the practical use of the kinetic data.
Let us imagine an industrial environmental engineer who is faced with
designing waste treatment processes for two new waste streams: one which contains
10-4 M As(III) and one with 10-4 M Se(IV) as the only toxic and redox-active
172
constituents. The plant already has the ability to handle As(V) and Se(VI) wastes,
but a new product synthesis now produces As(III) and Se(IV) and the current waste
treatment process does not reduce the concentrations of As(III) and Se(IV) to
regulatory discharge level of 1O-6M. The engineer has heard of a new single
technology consisting a manganese dioxide columns that will convert As(III) and
Se(IV) to As(V) and Se(VI). She needs to estimate what retention times are
necessary to reduce the concentrations of As(III) and Se(IV) to regulatory discharge
levels.
In the arsenic case, the rate of As(III) disappearance is described by
Figure 5.5 indicates that the species> MnAs(III) occurs in only small concentrations
(4 % is the maximum percentage of the initial As(lII) added) which allows the rate
equation to be simplified to
d[As(//l)] = Ie [>MnOH][As(//l)] dt 1
(6-2)
The manufacturer of the column supplies the following information:
Solid Manganese Concentration, Sc = 0.5 giL
Column Exchange Capacity, -"ept = 0.000326 moleslg
With this information, the concentration of surface sites can be determined:
[>MnOH] = Sc-"ePt = 1.63 X 10⁻⁴ M
Manganese in the column is also in excess of both Se(IV) and As(III) in the waste
173
stream. Thus the rate expression becomes a simple first-order equation
- d[As(Ill)] = k S X [As(ll1)] = k * [As(ll1)] dt }eept 1 (6-3)
Integrating the equation we get an expression for the time of reaction
-1n([As(IIl) ]/[As(Ill)]J t= ----~--..;;..... (6-4)
For a 99% reduction in As(III) concentration, the retention time would be about 95
minutes.
In the selenite case, the rate of total Se(IV) transformation is described by
d(Se(lV)T)
dt = - d[Se(lV)]
dt d[>MnSe(lV)]
dt (6-5)
The rates of change of Se(IV) and > MnSe(IV) are given in Equations 5-38 and 5-40,
respectively. Substituting these equations into Equation 6-5 gives
d(Se(lV) ) dt 1"- = ~[>MnSe(lV)] - k.2[>MnSe(Vl)] (6-6)
Figure 5.17 shows that the concentration of > MnSe(VJ) remains very small as
compared to the concentration of > MnSe(IV) over the duration of the experiment
which allows the following approximation to be made:
d(Se(lV)T) = ~[>MnSe(lV)] dt
(6-7)
Figure 5.17 also illustrates that the adsorption-desorption reactions of Se(IV) with
174
the birnessite surface is at equilibrium shortly after the beginning of the experiment.
Therefore, one additional approximation can be made with the equilibrium
relationship to get a simple first-order equation:
[> MnSe(IV)] = ~[Ir][> MnOH][Se(IV)] and
- d(Se(lV)T) = ~Kl[H1[>MnOH][Se(lV)] = kz*[Se(lV)] (6-8) dt
Integrating as before, a similar expression for the time of reaction is obtained. Thus,
assuming the same values as before with pH = 4, ~ = 1(1-\ and ~ = 1.3 x 1O-6sec-1,
the retention time for a 99% reduction in Se(IV) concentration is 200 days. This
retention time is too long for an industrial process, but the clever engineer redesigns
her plans to increase the solid concentration to 50 giL which decreases the retention
time to 2 days.
6.3 Rates of Redox Transformations in Aquatic Systems
A good indicator for comparison of rates of redox transformations is the half-
life of the reaction, the time required for fifty percent reaction. In the following, the
observed half-lives of As(III) oxidation in natural systems and inorganic redox
reactions with manganese dioxides are reviewed and compared.
6.3.1 As(IIl) Oxidation
The results presented in Chapter 5 indicate that As(IIl) has a half-life of
approximately 10-20 minutes in a 0.2 giL suspension of birnessite particles. The
rates of As(III) oxidation in seawater, estuarine water, and lake sediments are
approximately equivalent, with half-lives ranging between 5 and 17 hours (Scudlark
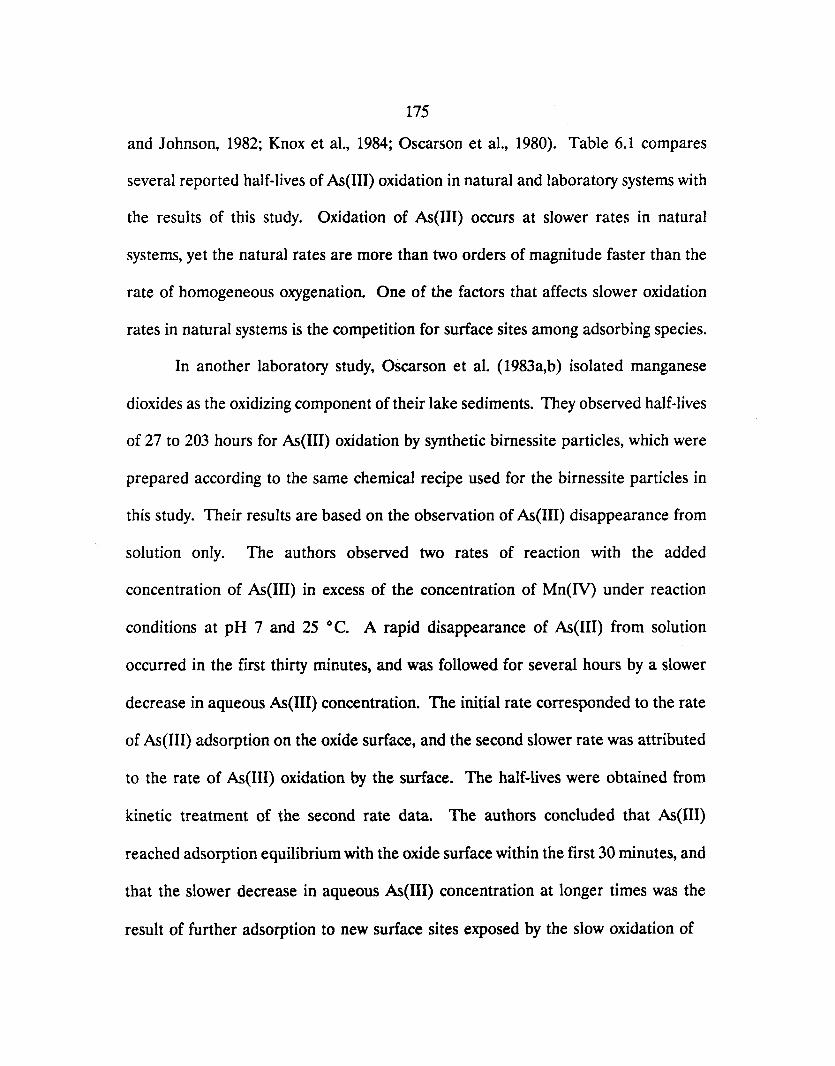
175
and Johnson, 1982; Knox et al., 1984; Oscarson et al., 1980). Table 6.1 compares
several reported half-lives of As(III) oxidation in natural and laboratory systems with
the results of this study. Oxidation of As(III) occurs at slower rates in natural
systems, yet the natural rates are more than two orders of magnitude faster than the
rate of homogeneous oxygenation. One of the factors that affects slower oxidation
rates in natural systems is the competition for surface sites among adsorbing species.
In another laboratory study, Oscarson et al. (1983a,b) isolated manganese
dioxides as the oxidizing component of their lake sediments. They observed half-lives
of 27 to 203 hours for As(III) oxidation by synthetic birnessite particles, which were
prepared according to the same chemical recipe used for the birnessite particles in
this study. Their results are based on the observation of As(III) disappearance from
solution only. The authors observed two rates of reaction with the added
concentration of As(III) in excess of the concentration of Mn(IV) under reaction
conditions at pH 7 and 25 0 C. A rapid disappearance of As(III) from solution
occurred in the first thirty minutes, and was followed for several hours by a slower
decrease in aqueous As(III) concentration. The initial rate corresponded to the rate
of As(III) adsorption on the oxide surface, and the second slower rate was attributed
to the rate of As(III) oxidation by the surface. The half-lives were obtained from
kinetic treatment of the second rate data. The authors concluded that As(III)
reached adsorption equilibrium with the oxide surface within the first 30 minutes, and
that the slower decrease in aqueous As(III) concentration at longer times was the
result of further adsorption to new surface sites exposed by the slow oxidation of
176
Table 6.1: Comparison of As(III) Oxidation Half-Lives
STUDY HALF-LIFE (hr)
Seawater--Microbial Oxidation 8-13 (Scudlark and Johnson, 1982)
Lake Sediments 10-17 (5°C) (Oscarson et al., 1980) 5.1-6.7 (25°C)
Estuary 8.6 (Knox et al., 1984)
Oxygenation 8760 (£ary and Schramke, 1990)
Synthetic Birnessite, pH 7 27-2031
(Oscarson et al., 1983b)
Synthetic Birnessite (This Study) pH 4 0.1~ pH 6.8 0.33 pH 4, 100 ~M Mrf+ 0.35 ~denved from secondary rate data (t > 30 mmutes) 2derived from initial rate data (0 < t < 90 minutes)
adsorbed As(III) and subsequent rapid release of As(V).
The results of the present work suggest a different interpretation of these rate
data. According to the current study, As(lll) is oxidized immediately and produces
Mn(II), and, at pH 7, adsorption/retention of Mn(II) is highly favored on the
birnessite surface. Rather than the slower rate of As(III) depletion being a result of
slow oxidation kinetics, as concluded by Oscarson et al., the slower rate is actually
the result of Mn(I1) occupying the newly generated surface sites, thus blocking the
adsorption and oxidation of As(III). By taking into account the behavior of the
reaction products, a clearer mechanistic picture is possible.
177
6.3.2 Inorganic Redox Reactions with Manganese Dioxides
Until the present study, Cr(IlI) was the only reduced inorganic species whose
kinetics of oxidation by direct reaction with a manganese dioxide surface had been
studied. Cr(IlI) oxidation by pyrolusite O~-Mno,) particles was examined at pH
values between 3.0 and 4.7 (Eary and Rai, 1987). Pyrolusite is a highly crystalline
form of manganese dioxide with a low surface area (5.7 -err/g) and a neutral pI-I.:pc;
(7.3). Now, the Cr(IlI) data can be compared to the results of Ollr As(III) and
Se(IV) work. The observed time required to oxidize fifty percent of the initial
concentration of each of the reduced species is listed in Table 6.2. Also listed in
Table 6.2 are the values of the thermodynamic driving force (aEs) at pH 4 for the
redox reactions. The observed "half-lives" of the redox transformation correlate with
driving force. The Cr(IlI) redox transformation on pyrolusite is the slowest of the
three, the combined result of unfavorable adsorption conditions (Le., positively
charged surface and positively charged aqueous species) and a small thermodynamic
driving force. In addition, transfer of three electrons from Cr(lll) to Mn(IV)
requires the involvement of more than one Mn(IV) per Cr(lll). Eary and Rai (1987)
found the rate of oxidation to be proportional to the surface area of the oxide
particles. This suggests that birnessite may oxidize Cr(IlI) more rapidly as a result
of its larger surface area and acidic pl\pc' Also, the redox potential of birnessite
(E' H = + 1.29 volts) is slightly larger than that of pyrolusite (E' H = + 1.23 volts).
These observations indicate that inorganic redox reactions involving manganese
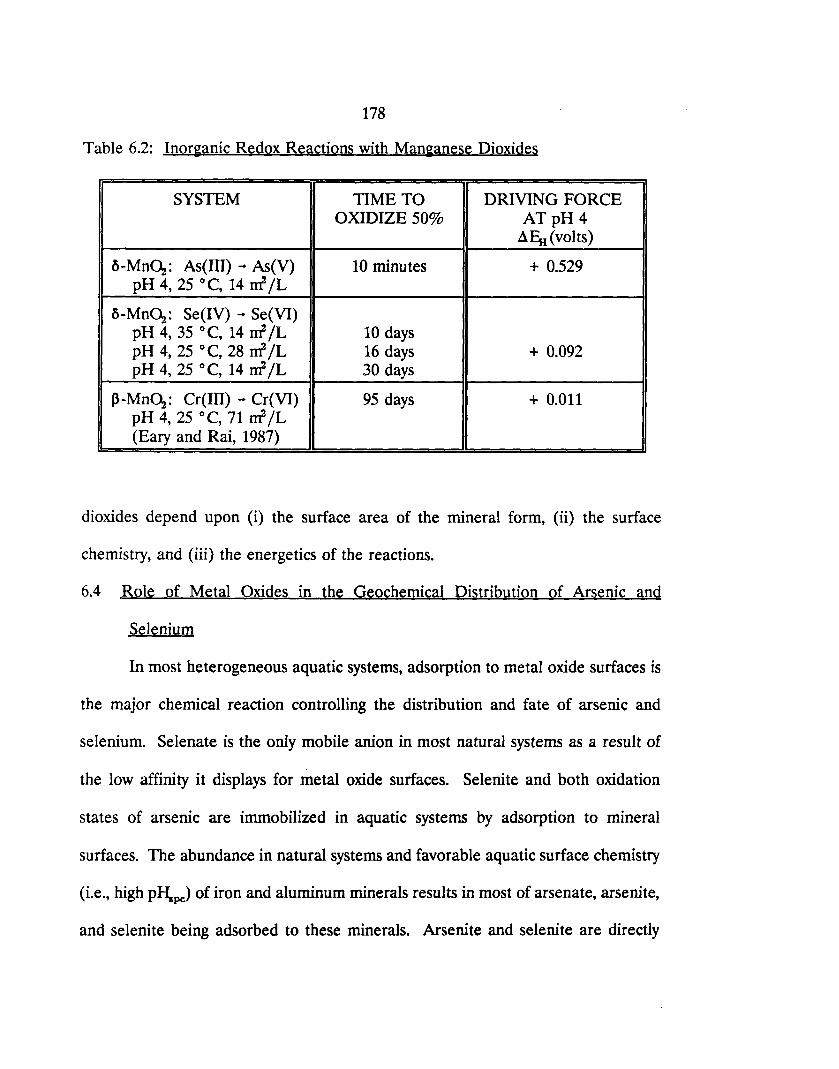
178
Table 6.2: Inorganic Redox Reactions with Manganese Dioxides
SYSTEM TIME TO DRIVING FORCE OXIDIZE 50% ATpH4
4&i (volts)
o-Mn~: As(III) .. As(V) 10 minutes + 0.529 pH 4, 25°C, 14 ref /L
o-Mn~: Se(IV) .. Se(VI) pH 4, 35°C, 14 ref /L 10 days pH 4, 25°C, 28 ref /L 16 days + 0.092 pH 4, 25°C, 14 ref /L 30 days
~ -Mn~: Cr(IIl) .. Cr(VI) 95 days + 0.011 pH 4, 25°C, 71 ref /L (Eary and Rai, 1987)
dioxides depend upon (i) the surface area of the mineral form, (ii) the surface
chemistry, and (iii) the energetics of the reactions.
6.4 Role of Metal Oxides in the Geochemical Distribution of Arsenic and
Selenium
In most heterogeneous aquatic systems, adsorption to metal oxide surfaces is
the major chemical reaction controlling the distribution and fate of arsenic and
selenium. Selenate is the only mobile anion in most natural systems as a result of
the low affinity it displays for metal oxide surfaces. Selenite and both oxidation
states of arsenic are immobilized in aquatic systems by adsorption to mineral
surfaces. The abundance in natural systems and favorable aquatic surface chemistry
(Le., high p~pc) of iron and aluminum minerals results in most of arsenate, arsenite,
and selenite being adsorbed to these minerals. Arsenite and selenite are directly
179
oxidized by manganese dioxides, but the redox transformation is limited by
unfavorable adsorption conditions in most natural environments.
6.S Redox Potential of Man~anese Dioxide Surfaces
Manganese dioxide surfaces have been shown to be oxidants for several
reduced species. A question arises whether the redox potential of the surface/
aqueous redox couple (> MnOhMnOH/MIf+ is the same as the redox potential of
the solid/aqueous couple o-Mn~/Mrr+. The redox potential of Mn(IV) surface
species can be calculated from the experimental data and compared with tabulated
values of the bulk phase.
The kinetic model describes the reaction between As(III) and birnessite
surface species with a set of basic and distinct reactions and provides rate constants
for each forward and reverse reaction. Applying the law of microscopic reversibility,
an equilibrium constant 1\ is defined as
K = ~.t i Ic'.i
(6-9)
The overall equilibrium constant, K, is the product of equilibrium constants of the
reactions that comprise the overall reaction. For the four-step kinetic model, the
overall equilibrium constant is
(6-10a)
or log K = 10gK" + log~ + 10gKs + 10gK. (6-lOb)
If the overall reaction is a redox reaction, then an overall redox potential can
be calculated from
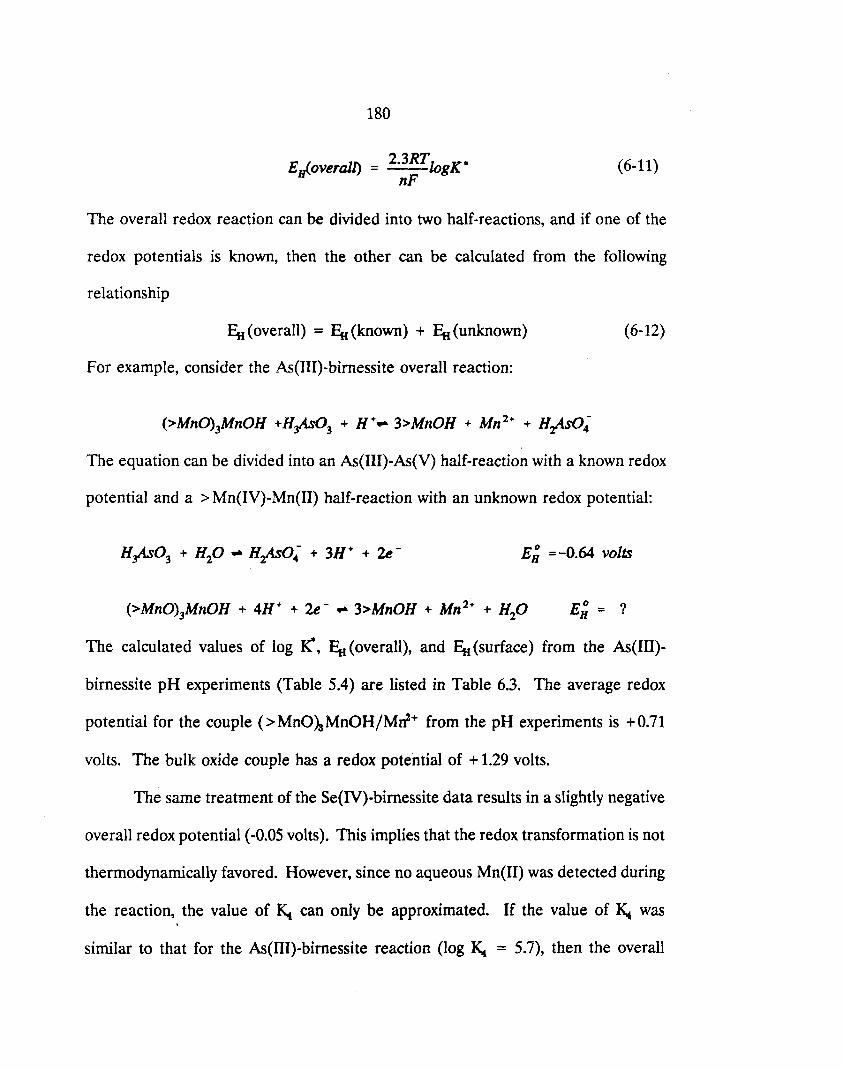
180
E ( --'1) 2.3RT,_ K* H'0VerU4 = wg nF
(6-11)
The overall redox reaction can be divided into two half-reactions, and if one of the
redox potentials is known, then the other can be calculated from the following
relationship
Ffl(overall) = Ffl(known) + Ffl(unknown) (6-12)
For example, consider the As(III)-birnessite overall reaction:
(>MnO)3MnOH +H#03 + H+'" 3>MnOH + Mn 2+ + Hrtr0 4-
The equation can be divided into an As(III)-As(V) half-reaction with a known redox
potential and a > Mn(IV)-Mn(II) half-reaction with an unknown redox potential:
E; =-0.64 volts
The calculated values of log K, Ffl(overall), and Ffl(surface) from the As(IIl)-
birnessite pH experiments (Table 5.4) are listed in Table 6.3. The average redox
potential for the couple (> Mn0>SMnOH/Mrr+ from the pH experiments is + 0.71
volts. The bulk oxide couple has a redox potential of + 1.29 volts.
The same treatment of the Se(N)-birnessite data results in a slightly negative
overall redox potential (-0.05 volts). This implies that the redox transformation is not
thermodynamically favored. However, since no aqueous Mn(Il) was detected during
the reaction, the value of K. can only be approximated. If the value of K. was . similar to that for the As(III)-birnessite reaction (log K. = 5.7), then the overall
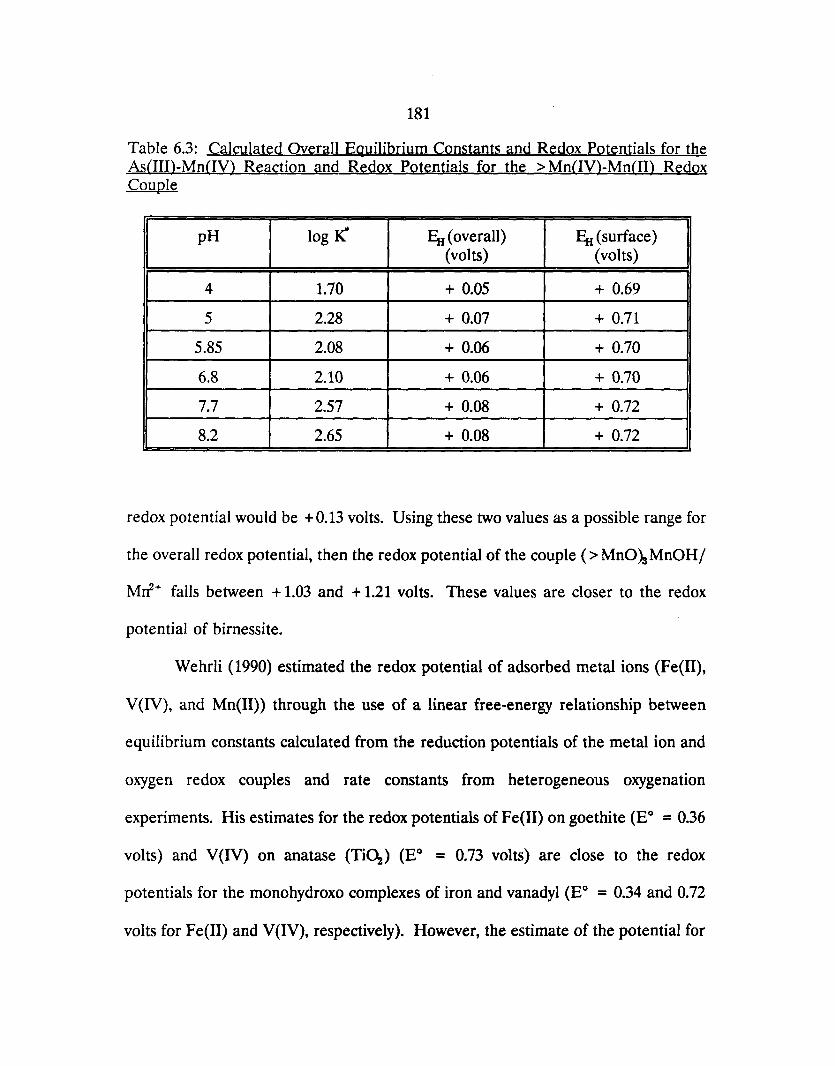
181
Table 6.3: Calculated Overall EQuilibrium Constants and Redox Potentials for the As(IJI)-Mn(lV) Reaction and Redox Potentials for the > Mn(lV)-Mn(IJ) Redox Couple
pH log K &i (overall) &i (surface) (volts) (volts)
4 1.70 + 0.05 + 0.69
5 2.28 + 0.07 + 0.71
5.85 2.08 + 0.06 + 0.70
6.8 2.10 + 0.06 + 0.70
7.7 2.57 + 0.08 + 0.72
8.2 2.65 + 0.08 + 0.72
redox potential would be + 0.13 volts. Using these two values as a possible range for
the overall redox potential, then the redox potential of the couple (> Mn0>SMnOH/
Mrt+ falls between + 1.03 and + 1.21 volts. These values are closer to the redox
potential of birnessite.
Wehrli (1990) estimated the redox potential of adsorbed metal ions (Fe(II),
V(IV), and Mn(II» through the use of a linear free-energy relationship between
equilibrium constants calculated from the reduction potentials of the metal ion and
oxygen redox couples and rate constants from heterogeneous oxygenation
experiments. His estimates for the redox potentials of Fe(II) on goethite (EO = 0.36
volts) and V(IV) on anatase (Ti~) (EO = 0.73 volts) are close to the redox
potentials for the monohydroxo complexes of iron and vanadyl (EO = 0.34 and 0.72
volts for Fe(II) and V(IV), respectively). However, the estimate of the potential for
182
a surface Mn(II) complex on goethite (EO = 0.41 volts) is much smaller than the
value of EO = 0.9 volts for the couple MnOI-f+ /MnOH+. Wehrli suggests that the
large discrepancy for Mn(II) indicates an inner-sphere oxygenation of the Mn(I1)
surface complex. This observation is in agreement with the proposed inner-sphere
mechanism for the reactions between As(III) and Se(IV) with the birnessite surface.
6.6 Thoughts for Future Research
There are several areas, suggested by these results, which need further
research related to the kinetics of adsorption and redox processes on metal oxide
surfaces. Some of these are listed below:
1. The various mineral forms of manganese dioxide have different surface
chemical properties with pH.pc values ranging from 2-3 for birnessite to 7.3 for
pyrolusite. A more thorough investigation of the As(lU) and Se(lV) redox reaction
with other manganese dioxides would clarify the dependence on the surface areas,
surface chemistry, and redox energetics.
2. Examination of adsorption and oxidation reactions in more complex oxide
systems by using actual or simulated groundwater would yield valuable estimates for
environmental reaction rates.
3. The two-site adsorption model presented in Chapter 4 illustrated that the
kinetic adsorption model could be improved by the inclusion of multiple surface sites.
Spectroscopic methods could assist in characterizing the heterogeneities of the
surface in order to alleviate the added uncertainties of a multi-site model.
4. By using radiolabeled Mn, the fate of surface Mn can be followed
183
throughout the reaction to determine the mass balance of Mn in the system.
5. Competitive effects of other redox active species on reaction rates could
be evaluated, for example, by adding As(III) and Se(IV) simultaneously to a particle
suspension.

184
185
REFERENCES
Adams, L. F., and W. C. Ghiorse, 1988. Oxidation state of Mn in the Mn oxide produced by Leptothrix discophora SS-l, Geochim. Cosmochim. Acta. 52, 2073-2076.
Ainsworth, C. c., D. C. Girvin, J. M. Zachara, and S. C. Smith, 1989. Chromate adsorption on goethite: effects of aluminum substitution, Soil Sci. Soc. Am. L, 53, 411-418.
Anderson, M. A., J. F. Ferguson, and J. Gavis, 1976. Arsenate adsorption on amorphous aluminum hydroxide, J. Colloid Interface Sci., 54, 391-399.
Anderson, M. A., T. R. Holm, D. G. Iverson, and R. R. Stanforth, 1978. Mass balance and speciation of arsenic in the Menominee River, Wisconsin. Proj. Rep. 6, USEPA Environ. Res. Lab., Athens, GA
Anderson, M. A., and D. T. Malotky, 1979. The adsorption of protolyable anions on hydrous oxides at the isoelectric pH, J. Colloid Interface Sci., 72, 413-427.
Andreae, M. 0., 1979. Arsenic speciation in seawater and interstitial waters: the influence of biological-chemical interactions on the chemistry of a trace element, Limnol. Oceanogr., 24, 440-552.
Atkinson, R. J., A. M. Posner, and J. P. Quirk, 1967. Adsorption of potentialdetermining ions at the ferric oxide-aqueous electrolyte interface, J. Phys. Chern., 71, 550-558.
Bainbridge, D., V. Wegrzyn, and N. Albasel, 1988. Selenium in California Volume I: History, Chemistry, Biology, Uses, Management. Report no. 88-10-1-WR, California State Water Resources Control Board, Sacramento, CA.
Balistrieri, L. S., and T. T. Chao, 1987. Selenium adsorption by goethite, Soil Sci. Soc. Am. J., 51, 1145-1151.
Banwart, S., S. Davies, and W. Stumm, 1989. The role of oxalate in accelerating the reductive dissolution of hematite (4-F~0s) by ascorbate, Colloid Surfaces, 39, 303-309.
Belzile, N., and A Tessier, 1990. Interactions between arsenic and iron oxyhydroxides in lacustrine sediments, Geochim. Cosmochim. Acta, 54, 103-109.
186
Boehm, P., 1971. Acidic and basic properties of hydroxylated metal oxides surfaces, Discussions Faraday Soc., 52, 264-275.
Cherry, J. A., A. U. Shaikh, D. E. Tallman, and R. V. Nicholson, 1979. Arsenic species as an indicator of redox conditions in groundwater, J. Hydrology. 43, 373-392.
Chukhlantsev, V. G., and G. P. Tomashevsky, 1957. The solubility of the selenites of certain metals, J. Anal. Chern. USSR, 12,303-309.
Cooke, T. D., and K. W. Bruland, 1987. Aquatic chemistry of selenium: evidence of biomethylation, Environ. Sci. Technol., 21, 1214-1219.
Crecelius, E. A., M. H. Bothner, and R. Carpenter, 1975. Geochemistries of arsenic, antimony, mercury, and related elements in sediments of Puget Sound, Environ. Sci. Technol., 9, 325-333.
Crowther, D. L., J. G. Dillard, and J. W. Murray, 1983. The mechanisms of Co(U) oxidation on synthetic birnessite, Geochim. Cosmochim. Acta, 47, 1388-1403.
Cullen, W. R., and K. J. Reimer, 1989. Arsenic speciation in the environment, Chern. Rev., 89, 713-764.
Davies, S. H. R., 1985. Mn(II) oxidation in the presence of metal oxides. Ph.D. Thesis, California Institute of Technology, Pasadena.
Davies, S. H. R., and J. J. Morgan, 1989. Manganese(II) oxidation kinetics on metal oxide surfaces, J. Colloid Interface Sci., 129, 63-77.
Davis, J. A., and J. O. Leckie, 1980. Surface ionization and complexation at the oxide/water interface. 3. Adsorption of anions, J. Colloid Interface ScL, 74, 32-43.
Dzombak, D. A., and F. M. M. Morel, 1987. Adsorption of inorganic pollutants in aquatic systems, J. Hydraulic En~., 113, 430-475.
Dzombak, D. A, and F. M. M. Morel, 1990. Surface Complexation Modeling. Hydrous Ferric Oxide. Wiley-Interscience, New York.
Eary, L. E., and G. D. Rai, 1987. Kinetics of chromium(III) oxidation to chromium(VI) by reaction with manganese dioxide, Environ. Sci. Technol., 21, 1187-1193.
187
Eary, L. E., and J. A. Schramke, 1990. Rates of inorganic oxidation reactions involving dissolved oxygen, in Chemical Modelin~ of Aqueous Systems II, D. C. Melchior and R. L. Bassett, eds., ACS Symp. Ser. 416, 379-396.
Elrashidi, M. A., D. C. Adriano, S. M. Workman, and W. L. Lindsay, 1987. Chemical equilibria of selenium in soils: a theoretical development, Soil Sci., 144, 141-152.
Eltantawy, I. M., and P. W. Arnold, 1973. Reappraisal of ethylene glycol mono-ethyl ether (EGME) method for surface area estimations of clays, J. Soil Science, 24, 232-238.
Faughnan, J., 1981. The SURFEQL/MINEQL Manual. Environmental Engineering Science, California Institute of Technology, Pasadena, CA
Faust, S. D., A. J. Winka, and T. Belton, 1987a. An assessment of chemical and biological significance of arsenical species in the Maurice River drainage basin (N. J.). Part I: Distribution in water and river and lake sediments, J. Environ. Sci. Health, A22, 203-237.
Faust, S. D., A. J. Winka, and T. Belton, 1987b. An assessment of chemical and biological significance of arsenical species in the Maurice River drainage basin (N. J.). Part II: Partitioning of arsenic into bottom sediments, J. Environ. Sci. Health, A22, 239-262.
Faust, S. D., A. J. Winka, and T. Belton, 1987c. An assessment of chemical and biological significance of arsenical species in the Maurice River drainage basin (N. J.). Part III: Transformation in aerobic and anaerobic conditions, J. Environ. Sci. Health, A22, 263-282.
Ferguson, J. F., and J. Gavis, 1972. A review of the arsenic cycle in natural waters, Water Res., 6, 1259-1274.
Ferguson, J. F., and M. A Anderson, 1974. Chemical form of arsenic in water supplies and their removal, In Chemistty of Water Supply. Treatment. and Distribution, Rubin, A J., Ed., Ann Arbor Science: Ann Arbor, MI, 137-158.
Fokkinlc, L. G. J., A de Keizer, and J. Lyklema, 1990. Temperature dependence of cadmium adsorption on oxides: I. Experimental observations and model analysis, J. Colloid Interface Sci., 135, 118-131.
Forsythe, G. E., M. A Malcolm, and C. B. Moler, 1977. Computer Methods for 'Mathematical Computations. Prentice-Hall, Englewood Cliffs, NJ.
188
Frost, R. R., and R. A. Griffin, 1977. Effect of pH on adsorption of arsenic and selenium from landfill leachate by clay minerals, Soil Sci. Soc. Am. J., 41, 53-57.
Fuller, C C, and J. A Davis, 1989. Influence of coupling of sorption and photosynthetic processes on trace element cycles in natural waters, Nature, 340, 52-54.
Gardiner, W. C., 1969. Rates and Mechanisms of Chemical Reactions. Benjamin, Menlo Park, CA
Geering, H. R., E. E. Cary, L. H. P. Jones, and W. H. Allaway, 1968. Solubility and redox criteria for the possible forms of selenium in soils, Proc. Soil Sci. Soc. Am., 32, 35-40.
Ghosh, M. M., and J. R. Yuan, 1987. Adsorption of inorganic arsernc and organoarsenicals on hydrous oxides, Env. Pro~ress, 6, 150-157.
Goldberg, S., 1985. Chemical modeling of anion competition on goethite using constant capacitance model, Soil Sci. Soc. Am. J., 49, 851-856.
Goldberg, S., 1986. Chemical modeling of arsenate adsorption on aluminum and iron oxide minerals, Soil Sci. Soc. Am. J., 50, 1154-1157.
Gulens, J., D. R. Champ, and R. E. Jackson, 1979. Influence of redox environments on the mobility of arsenic in ground water, ACS Symp. Ser. 93, 711-736.
Gupta, S. K., and K. Y. Chen, 1978. Arsenic removal by adsorption, J. Water Poll. Control Fed., 50, 493-506.
Harrison, J. B., and V. E. Berkheiser, 1982. Anion interactions with freshly prepared hydrous iron oxides, Clays Clay Miner., 30, 97-102.
Hayes, K. F., A. L. Roe, G. E. Brown, Jr., K. O. Hodgson, J. O. Leckie, and G. A. Parks, 1987. In situ x-ray absorption study of surface complexes: selenium oxyanions on a-FeOOH, Science, 238, 783-786.
Healy, T. W., A P. Herring, and D. W. Fuerstenau, 1966. The effect of crystal structure on the surface properties of a series of manganese dioxides, 1:. Colloid Interface Sci., 21, 435-444.
Hingston, F. J., 1970. Specific adsorption of anions on goethite and gibbsite. Ph. D. Thesis, Univ. of W. Australia, Nedlands.
189
Hingston, F. J., A. M. Posner, and J. P. Quirk, 1968. Adsorption of selenite by goethite, In Adsorption from aQueous solution, Weber, W. J., and E. Matijeva, Eds., Advances in Chemistry #79, Am. Chern. Soc., Washington, D. C., 82-90.
Hingston, F. J., A M. Posner, and J. P. Quirk, 1971. Competitive adsorption of negatively charged ligands on oxide surfaces, Discussions Faraday Soc., 52, 334-342.
Hingston, F. J., A. M. Posner, and J. P. Quirk, 1972. Anion adsorption by goethite and gibbsite. I. The role of the proton in determining adsorption envelopes, J. Soil Sci., 23, 177-192.
Holm, T. R., M. A. Anderson, D. G. Iverson, and R. S. Stanforth, 1979. Heterogeneous interactions of arsenic in aquatic systems, ACS Symp. Ser. 93, 711-736.
Howard, J. H., 1977. Geochemistry of selenium: formation of ferroselite and selenium behavior in the vicinity of oxidizing sulfide and uranium deposits, Geochim. Cosmochim. Acta. 41, 1665-1678.
Jacobs, L. W., ed., 1989. Selenium in A~culture and the Environment. SSSA Special Publication no. 23, Madison, WI: American Society of Agronomy, Inc. and Soil Science Society of America, Inc., 233 pp.
Johnson, D. L., and M. E. Q. Pilson, 1972. Spectrophotometric determination of arsenite, arsenate, and phosphate in natural waters, Anal. Chim. Acta, 58, 289-299.
Kanungo, S. B., and D. M. Mahapatra, 1989. Interfacial properties of some hydrous manganese dioxides in 1-1 electrolyte solution, J. Colloid Interface Sci., 131, 103-111.
Laha, S., and R. G. Luthy, 1990. Oxidation of aniline and other primary aromatic amines by manganese oxides, Environ. Sci. Technol., 24, 363-373.
LaKind, J. S., 1988. The reductive dissolution of goethite and hematite by phenolic reductants. Ph.D. Thesis, Johns Hopkins University, Baltimore, MD.
Leckie, J., M. Benjamin, K Hayes, G. Kaufman, and S. Altmann, 1980. Adsorptioncoprecipitation of trace elements from water with iron oxyhydroxides, EPRI RS-910-1, Electric Power Research Institute, Palo Alto, CA
190
Lemmo, N., S. Faust, T. Belton, and R. Tucker, 1983. Assessment of the chemical and biological significance of arsenical compounds in a heavily contaminated watershed. Part I: The fate and speciation of arsenical compounds in aquatic environments--a literature review, J, Environ, Sci. Health, A18, 389-411.
Lindberg, R. D. and D. D. Runnells, 1984. Ground water redox reactions: an analysis of equilibrium state applied to Eu measurements and geochemical modeling, Science. 225, 925-927.
Loganathan, P., R. G. Burau, and D. W. Fuerstenau, 1977. Influence of pH on the sorption of cif+ , zrf+ , and of+ by a hydrous manganese oxide, Soil Sci. Soc. Am. J., 41, 57-62.
Lumsdon, D. G., A. R. Fraser, J. D. Russell, and N. T. Livesay, 1984. New infrared band assignments for the arsenate ion adsorbed on synthetic goethite (<<-FeOOH), J. Soil ScL, 35, 381-386.
Machesky, M. L., 1990. Influence of temperature on ion adsorption by hydrous metal oxides, in Chemical Modelin~ of Aqueous Systems II, D. C. Melchior and R. L. Bassett, eds., ACS Symp. Ser. 416, 282-292.
Malotky, D. T., and M. A Anderson, 1976. The adsorption of the potential determining arsenate anion on oxide surfaces, In Colloid and Interface Science, 4, Kerker, M., ed., Academic Press: New York, 281-295.
McBride, M. 8., 1987. Adsorption and oxidation of phenolic compounds by iron and manganese oxides, Soil Sci. Soc. Am. J., 51, 1466-1472.
McKenzie, R. M., 1971. The synthesis of birnessite, crytomelane, and some other oxides and hydroxides of manganese, Mineralo~ical Ma~azine, 38, 493-502.
McKenzie, R. M., 1981. The surface charge on manganese dioxides, Aus!. J. Soil ~, 19, 41-50.
McNeal, J. M., and L. S. Balistrieri, 1989. Geochemistry and occurrence of selenium: an overview, in Selenium in Awculture and the Environment, L. W. Jacobs, ed., SSSA Special Publication no. 23, Soil Science Society of America and American Society of Agronomy, Madison, WI, 1-13.
Mok, W. M., and C. M. Wai, 1989. Distribution and mobilization of arsenic species in the creeks around the Blackbird mining district, Idaho, Water Res., 23, 7-13.
191
Morgan, J. J., and W. Stumm, 1964. Colloid-chemical properties of manganese dioxide, J. Colloid Sci., 19, 347-359.
Murray, J. W., 1974. The surface chemistry of hydrous manganese dioxide, J. Colloid Interface Sci., 46, 357-371.
Murray, J. W., 1975. The interaction of metal ions at the manganese dioxide-solution interface, Geochim. Cosmochim. Acta, 39, 505-510.
National Research Council, Committee on medical and biological effects of environmental pollutants, 1976. Selenium. Washington, D. c.: National Academy of Science, 203 pp.
National Research Council, Committee on medical and biological effects of environmental pollutants, 1977. Arsenic. Washington, D. c.: National Academy of Science, 322 pp.
National Research Council, Committee on irrigation-induced water quality problems, 1989. Irrigation-induced water quality problems: what can be learned from the San Joaquin Valley experience. Washington, D. C.: National Academy of Science, 157 pp.
Neal, R. H., G. Sposito, K. M. Holtzclaw, and S. J. Traina, 1987. Selenite adsorption on alluvial soils. I. Soil composition and pH effects, Soil Sci. Soc. Am. J., 51, 1161-1165.
Oscarson, D. W., P. M. Huang, and W. K. Liaw, 1980. The oxidation of arsenite by aquatic sediment, J. Environ. Qual., 9, 700-703.
Oscarson, D. W., P. M. Huang, and W. K. Liaw, 1981a. The role of manganese in the oxidation of arsenite by freshwater lake sediments, Clays Clay Miner., 29, 219-225.
Oscarson, D. W., P. M. Huang, C. Defosse, and A Herbillon, 1981b. Oxidative power of Mn(lV) and Fe (III) oxides with respect to As(III) in terrestrial and aquatic environments, Nature, 291, 50-51.
Oscarson, D. W., P. M. Huang, U. T. Hammer, and W. K. Liaw, 1983a. Oxidation and sorption of arsenate by manganese dioxide as influenced by surface coatings of iron and aluminum oxides and calcium carbonate, Water. Air. and Soil Poll., 20, 233-244.
192
Oscarson, D. W., P. M. Huang, W. K. Liaw, and U. T. Hammer, 1983b. Kinetics of oxidation of arsenite by various manganese dioxides, Soil Sci. Soc. Am. I., 47, 644-648.
Parfitt, R. L., A. R. Fraser, and V. C. Farmer, 1977. Adsorption on hydrous oxides. III. Fulvic acid and humic acid on goethite, gibbsite, and imogolite, I. Soil Sci., 28, 289-296.
Parida, K. M., S. B. Kanungo, and B. R. Sant, 1981. Studies on MnOz--I. Chemical composition, microstructure and other characteristics of some synthetic MnOz of various crystalline modifications, Electrochim. Acta, 26, 435-443.
Peterson, M. L., and R. Carpenter, 1983. Biogeochemical processes affecting total arsenic and arsenic species distribution in an intermittently anoxic fjord, Marine Chern., 12, 295-321.
Pierce, M. L., and C. B. Moore, 1980. Adsorption of arsenite on amorphous iron hydroxides from dilute aqueous solutions, Environ. Sci. Techno!., 14,214-216.
Pierce, M. L., and C. B. Moore, 1982. Adsorption of arsenite and arsenate on amorphous iron hydroxide, Water Res., 16, 1247-1253.
Presser, T. S., and I. Barnes, 1984. Selenium concentrations in waters tributary to and in the vicinity of Kesterson National Wildlife Refuge, Fresno and Merced counties, California. Water Resources Invest. Rep. 84-4122. U. S. Geo!. Surv., Menlo Park, CA.
Presser, T. S., and I. Barnes, 1985. Dissolved constituents including selenium in waters tributary to and in the vicinity of Kesterson National Wildlife Refuge and the West Grassland, Fresno and Merced counties, California. Water Resources Invest. Rep. 85-4220. U. S. Geol. Surv., Menlo Park, CA
Princeton Applied Research, 1976. Application Brief A-6: Determination of arsenic by differential pulse polarography.
Rajan, S. S. S., 1979. Adsorption of selenite, phosphate, and sulfate on hydrous alumina, I. Soil Sci., 30, 709-718.
Rosenfeld, I., and O. A. Beath, 1964. Selenium. Geobotany. biochemistry. toxicity and nutrition. New York: Academic Press, 411 pp.
Schindler, P. W., and W. Stumm, 1987. The surface chemistry of oxides, hydroxides, and oxide minerals, in Aquatic Surface Chemistry, W. Stumm, ed., WileyInterscience, New York, 83-110.
193
Sigg, L., and W. Stumm, 1980. The interaction of anions and weak acids with the hydrous goethite (a-FeOOH) surface, Colloid Surf., 2, 101-117.
Stone, A. T., 1983. The reduction and dissolution of manganese(III) and (IV) oxides by organics, Ph. D. Thesis, California Institute of Technology, Pasadena, CA.
Stone, A. T., 1986. Adsorption of organic reductants and subsequent electron transfer on metal oxide surfaces, in Geochemical Processes at Mineral Surfaces, J. A Davis and K. F. Hayes, eds., ACS Symp. Ser. 323, 446-461.
Stone, A. T., 1987. Reduction dissolution of manganese(III, IV) oxides by substituted phenols, Environ. Sci. Technol., 21, 979-988.
Stone, A. T., and J. J. Morgan, 1987. Reductive dissolution of metal oxides, in Aquatic Surface Chemistty, W. Stumm, ed., Wiley-Interscience, New York, 221-254.
Stone, A. T., and H. Ulrich, 1989. Kinetics and reaction stoichiometry in the reductive dissolution of manganese (IV) dioxide and Co(III) oxide by hydroquinone, J. Colloid Interface Sci., 132, 509-522.
Stumm, W., and J. J. Morgan, 1981. AQllatic Chemistty. New York: Wiley, 538 pp.
Sung, W., and J. J. Morgan, 1980. Kinetics and product of ferrous ion oxygenation in aqueous systems, Environ. Sci. Technol., 14, 561-567.
Sung, W., and J. J. Morgan, 1981. Oxidative removal of Mn(II) from solution catalyzed by the lepidocrocite surface, Geochim. Cosmochim. ActS!, 45, 2377-2383.
Tallman, D. E., and A U. Shaikh, 1980. Redox stability of inorganic arsenic(III) and arsenic(V) in aqueous solution, Anal. Chern., 52, 196-199.
Thanabalasingam, P., and W. F. Pickering, 1986. Effect of pH on interaction between As(III) or As(V) and manganese(IV) oxide, Water. Air. and Soil Poll., 29, 205-216.
Wehrli, B., 1987. Vanadium in the hydrosphere: surface chemistry and oxidation kinetics, Ph. D. Thesis, ETH, Zurich.
Wehrli, B., 1990. Redox reactions of metal ions at mineral surfaces, in Aquatic Chemical Kinetics, W. Stumm, ed., Wiley-Interscience, New York, 311-336.
194
Welch, A. H., M. S. Lico, and J. L Hughes, 1988. Arsenic in ground water of the western United States, Groundwater, 26, 333-347.
Westall, J. c., 1982. FITEQL: a computer program for determination of chemical equilibrium constants from experimental data, Rep. 82-02, Oregon State University, Corvalis.
Westall, J. c., 1986. Reactions at the oxide-solution interface: chemical and electrostatic models, in Geochemical Processes at Mineral Surfaces. J. A. Davis and K. F. Hayes, eds., ACS Symp. Ser. 323, 54-78.
Westall, J. c., 1987. Adsorption mechanisms in aquatic surface chemistry. in Aquatic Surface Chemistry, W. Stumm, ed .• Wiley-Interscience, New Yark, 3-32.
Westall, J., and H. Hohl, 1980. A comparison of electrostatic models for the oxide/solution interface, Adv. Colloid Interface Sci., 12, 265-294.
Williams, K. T., and H. G. Byers, 1936. Selenium compounds in soils, Ind. Eng. Chern., 28, 912-914.
Yasunga, T., and T. Ikeda, 1987. Adsorption-desorption kinetics at the metal oxidesolution interface studied by relaxation methods, in Geochemical Processes at Mineral Surfaces, J. A Davis and K. F. Hayes, eds., ACS Symp. Ser. 323, 230-253.
Yates, D. E., 1975. The structure of the oxide-aqueous electrolyte interface. Ph.D. Thesis, Vniversity of Melbourne, Australia.
Yoshida, I., H. Kobayashi, and K. Veno, 1976. Selective adsorption of arsenic ions on silica gel impregnated with ferric hydroxide, Anal. Lett., 9, 1125-1133.
Yoshida, I., K. Veno, and H. Kobayashi, 1978. Selective separation of arsenic(III) and (V) ions with ferric complex of chelating ion-exchange resin, Sep. Sci., 13, 173-184.
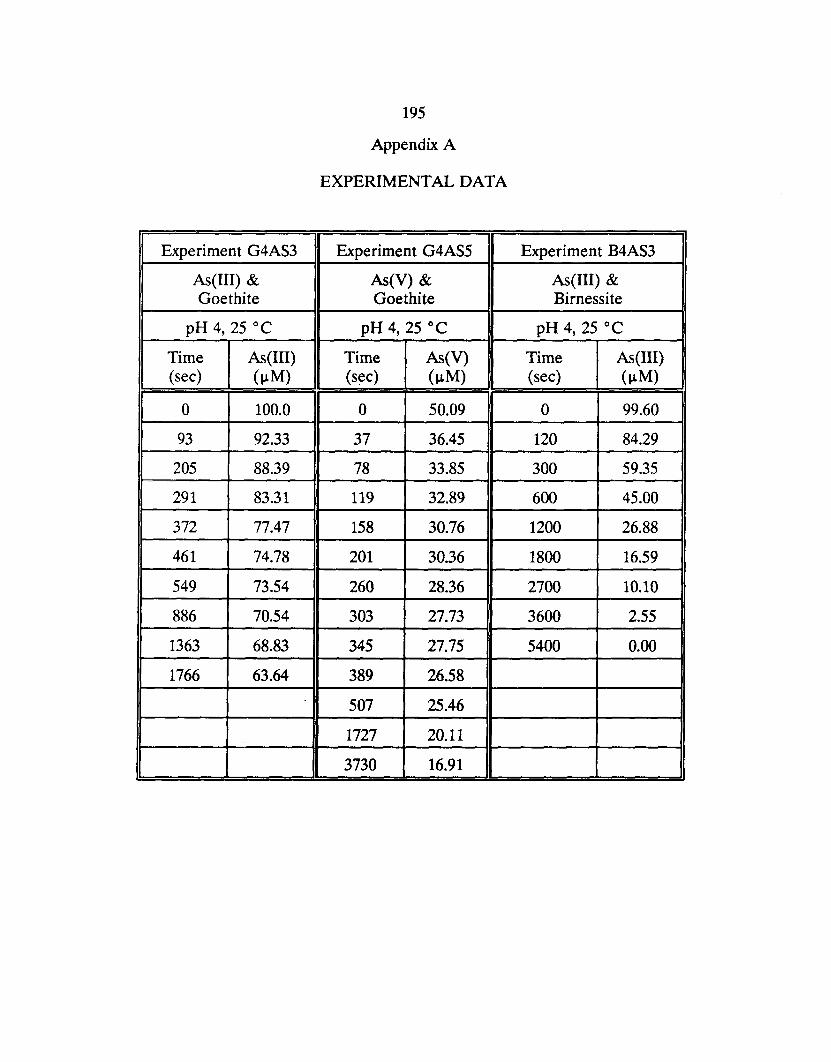
195
Appendix A
EXPERIMENTAL DATA
Experiment G4AS3 Experiment G4AS5 Experiment B4AS3
As(III) & As(V) & As(III) & Goethite Goethite Birnessite
pH 4, 25°C pH 4,25 °C pH 4,25 °C
Time As(III) Time As(V) Time As (III) (sec) (~M) (sec) (~M) (sec) (~M)
0 100.0 0 50.09 0 99.60
93 92.33 37 36.45 120 84.29
205 88.39 78 33.85 300 59.35
291 83.31 119 32.89 600 45.00
372 77.47 158 30.76 1200 26.88
461 74.78 201 30.36 1800 16.59
549 73.54 260 28.36 2700 10.10
886 70.54 303 27.73 3600 2.55
1363 68.83 345 27.75 5400 0.00
1766 63.64 389 26.58
507 25.46
1727 20.11
3730 16.91
196
Experiment B4AS5 Experiment B4MN2 Experiment B6MN2
As(V) & Mn(U) & Mn(II) & Birnessite Birnessite Birnessite
pH 4, 25°C pH 4,25 °C pH 6, 25°C
Time As(V) Time Mn(U) Time Mn(II) (sec) (~M) (sec) (~M) (sec) (~M)
0 100.0 0 98.9 0 98.8
120 100.0 120 78.0 120 45.4
300 100.0 300 75.1 300 25.6
600 100.0 600 72.1 600 17.1
1200 100.0 1200 68.1 1200 11.3
1800 100.0 1800 67.0 1800 8.2
2700 100.0 2700 65.8 2700 4.9
3600 100.0 3600 63.8 3600 5.0
5400 100.0 5400 60.8 5400 3.1
7200 100.0
197
Experiment G4SE4 Experiment B4SE4
SeelY) & SeelY) & Goethite Birnessite
pH 4,25 °C pH 4,25 °C
Time As(III) Time As(V) (sec) (JlM) (sec) (JlM)
0 100.0 0 100.0
120 67.48 120 88.43
240 66.18 240 85.24
360 61.66 360 84.58
480 60.10 480 81.87
600 59.81 900 84.26
900 57.46 1200 81.99
1200 55.96 1800 80.02
1800 52.30 2700 83.28
2700 52.67 3600 79.00
3600 49.43 5400 79.44
5400 48.76 8520 80.34
7500 48.34 86400 78.66
198
Experiment PH4T15 Experiment PH4T25 Experiment PH4T35
As(III) & As(III) & As(III) & Goethite Goethite Goethite
pH 4,15 °C pH 4, 25°C pH 4,35 °C
Time As(III) Time As(III) Time As(III) (sec) (J,LM) (sec) (J,LM) (sec) (J,LM)
0 50.12 0 50.14 0 53.05
63 49.24 78 47.67 75 49.23
130 49.38 155 46.52 152 43.98
196 46.57 235 43.58 217 47.97
260 45.57 306 43.8 284 44.57
322 43.19 372 44.66 348 41.99
393 44.49 435 44.23 409 44.35
457 42.11 503 39.14 550 39.25
515 41.54 569 39.86 676 36.29
580 41.39 634 40.65
654 43.34 706 41.08
199
Experiment PH6T15 Experiment PH6T25 Experiment PH6T35
As(III) & As(III) & As(III) & Goethite Goethite Goethite
pH 6,15 °C pH 6, 25°C pH 6, 35°C
Time As (III) Time As(III) Time As(III) (sec) (~M) (sec) (~M) (sec) (~M)
0 49.86 0 49.98 0 52.74
59 46.32 68 47.49 84 44.28
121 43.57 141 45.95 141 42.34
179 42.30 210 42.80 212 37.30
247 41.33 271 40.45 276 35.50
311 40.07 332 40.77 330 36.00
384 38.43 405 40.93 393 37.94
437 38.73 480 38.02 446 33.91
492 37.61 545 36.97 505 37.73
550 35.75 606 33.49 588 36.10
600 34.48 668 35.52 644 34.56
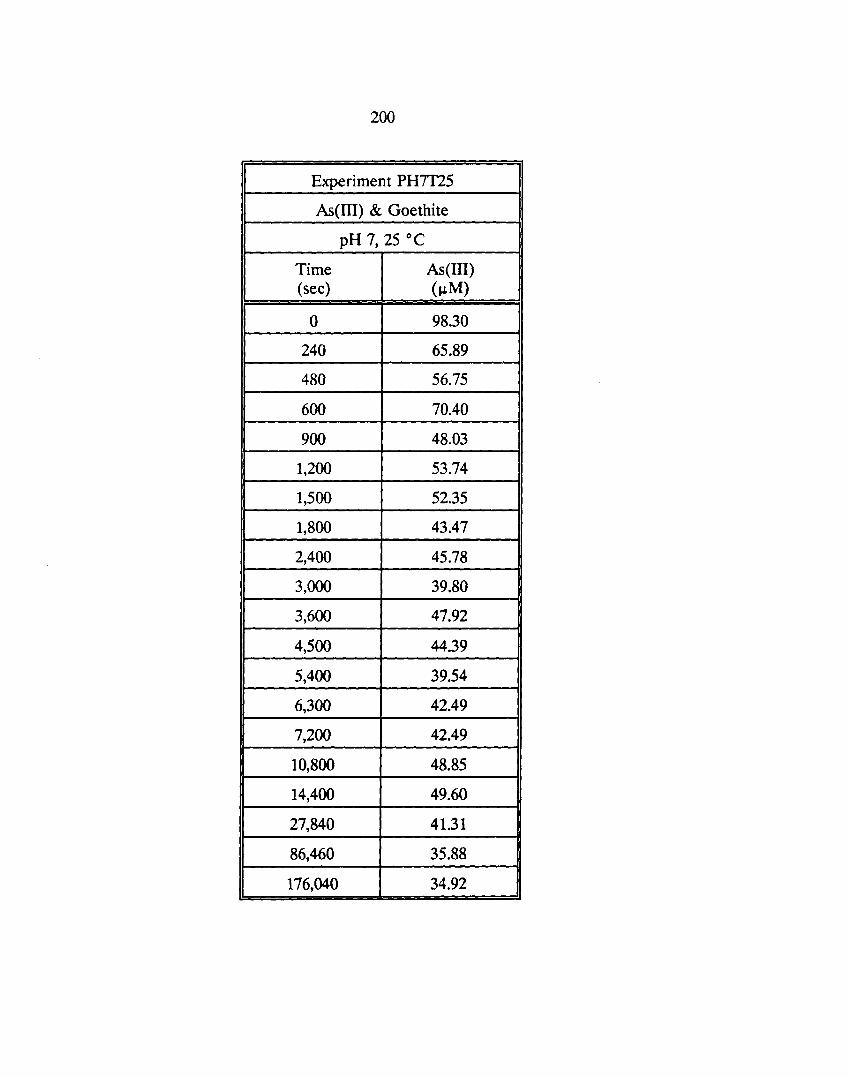
200
Experiment PHTf25
AsCIII) & Goethite
pH 7, 25°C
Time AsCIII) (sec) (~M)
0 98.30
240 65.89
480 56.75
600 70.40
900 48.03
1,200 53.74
1,500 52.35
1,800 43.47
2,400 45.78
3,000 39.80
3,600 47.92
4,500 44.39
5,400 39.54
6,300 42.49
7,200 42.49
10,800 48.85
14,400 49.60
27,840 41.31
86,460 35.88
176,040 34.92
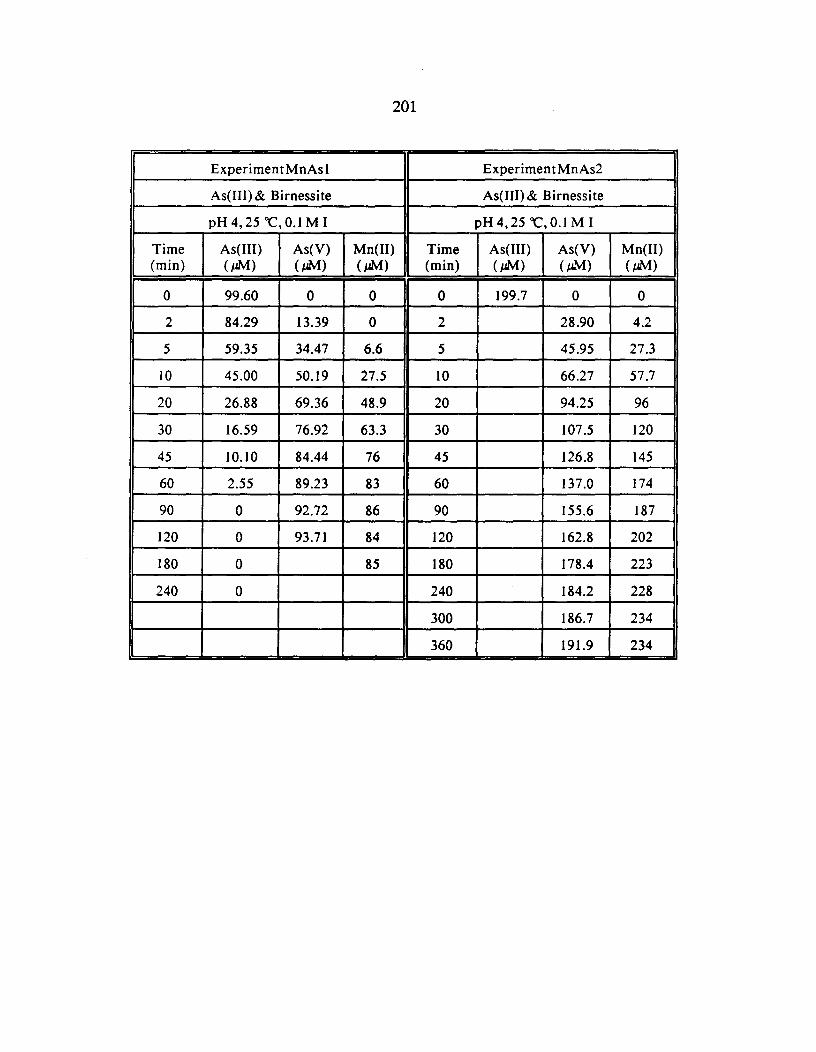
201
ExperimentMnAsl ExperimentMnAs2
As(III) & Birnessite As(III) & Birnessite
pH 4, 25 "C, 0.1 M I pH 4,25 "C, 0.1 M I
Time As(III) As(V) Mn(IJ) Time As(JII) As(V) Mn(II) (min) (1M) (1M) (1M) (min) (1M) (1M) (1M)
0 99.60 0 0 0 199.7 0 0
2 84.29 13.39 0 2 28.90 4.2
5 59.35 34.47 6.6 5 45.95 27.3
10 45.00 50.19 27.5 10 66.27 57.7
20 26.88 69.36 48.9 20 94.25 96
30 16.59 76.92 63.3 30 107.5 120
45 10.10 84.44 76 45 126.8 145
60 2.55 89.23 83 60 137.0 174
90 0 92.72 86 90 155.6 187
120 0 93.71 84 120 162.8 202
180 0 85 180 178.4 223
240 0 240 184.2 228
300 186.7 234
360 191.9 234
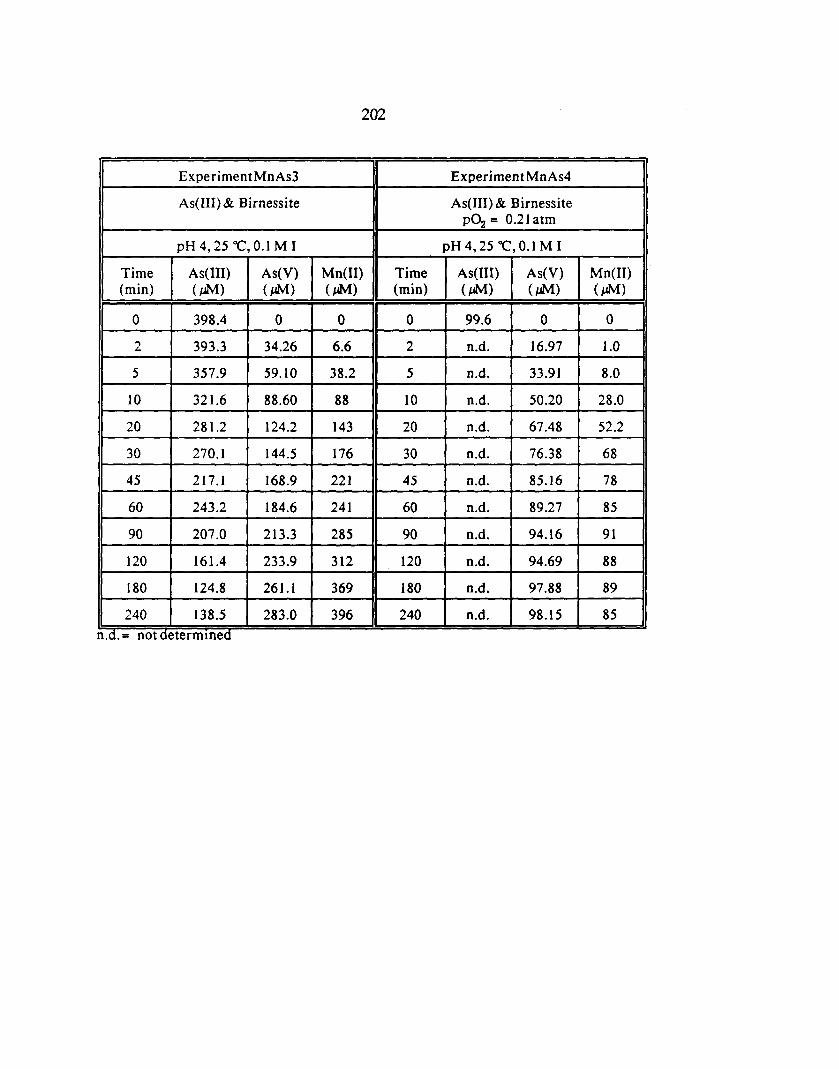
202
ExperimentMnAs3 Experiment MnAs4
As(III) & Birnessite As(IIJ) & Birnessite p02 = 0.21 atm
pH 4, 25 "C, 0.1 M I pH 4,25 "C, 0.1 M I
Time As(lII) As(V) Mn(II) Time As(III) As(V) Mn(II) (min) ( JAM) (JAM) (~) (min) (~) (~) (JM)
0 398.4 0 0 0 99.6 0 0
2 393.3 34.26 6.6 2 n.d. 16.97 1.0
5 357.9 59.10 38.2 5 n.d. 33.91 8.0
10 321.6 88.60 88 10 n.d. 50.20 28.0
20 281.2 124.2 143 20 n.d. 67.48 52.2
30 270.1 144.5 176 30 n.d. 76.38 68
45 217.1 168.9 221 45 n.d. 85.16 78
60 243.2 184.6 241 60 n.d. 89.27 85
90 207.0 213.3 285 90 n.d. 94.16 91
120 161.4 233.9 312 120 n.d. 94.69 88
180 124.8 261.1 369 180 n.d. 97.88 89
240 138.5 283.0 396 240 n.d. 98.15 85 n.d.- not determmea
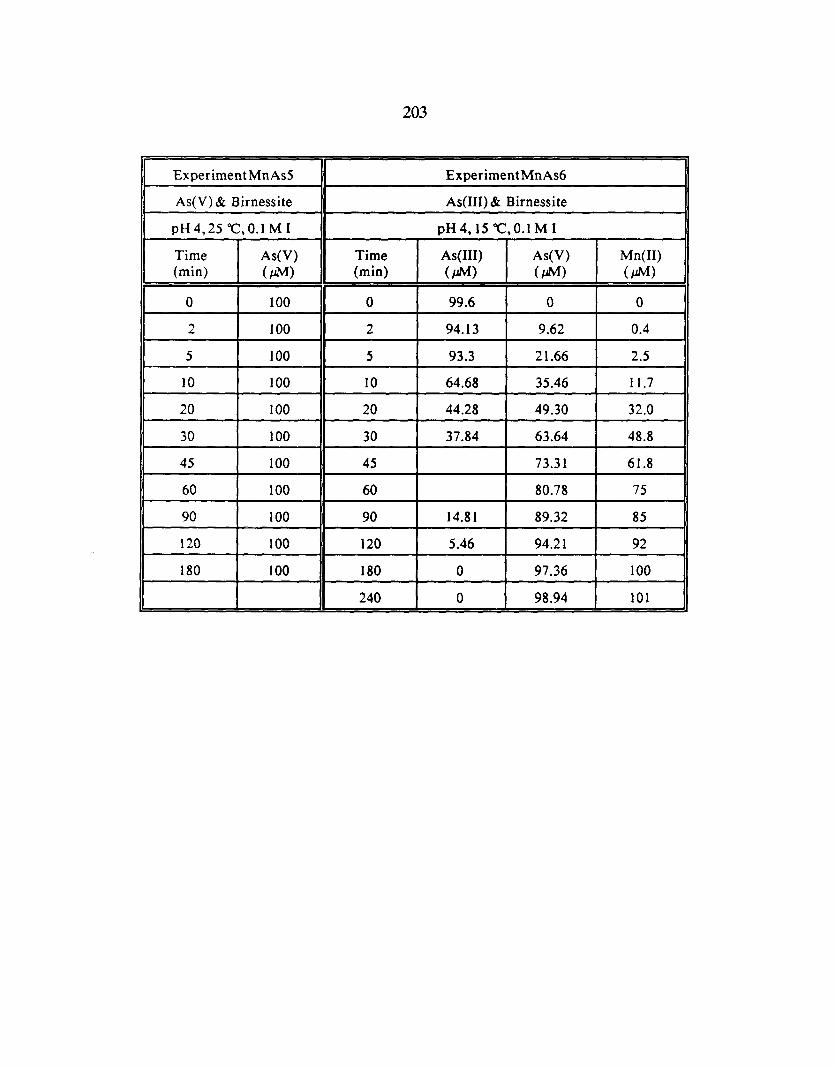
203
ExperimentMnAs5 Experiment MnAs6
As(V) & Birnessite As(III) & Birnessite
pH 4,25 "C,O.I M I pH 4, IS "C, 0.1 M I
Time As(V) Time As(III) As(V) Mn(II) (min) (pM) (min) (pM) (pM) (pM)
0 100 0 99.6 0 0
2 100 2 94.13 9.62 0.4
5 100 5 93.3 21.66 2.5
10 100 10 64.68 35.46 11. 7
20 100 20 44.28 49.30 32.0
30 100 30 37.84 63.64 48.8
45 100 45 73.31 61.8
60 100 60 80.78 75
90 100 90 14.81 89.32 85
120 100 120 5.46 94.21 92
180 100 180 0 97.36 100
240 0 98.94 101
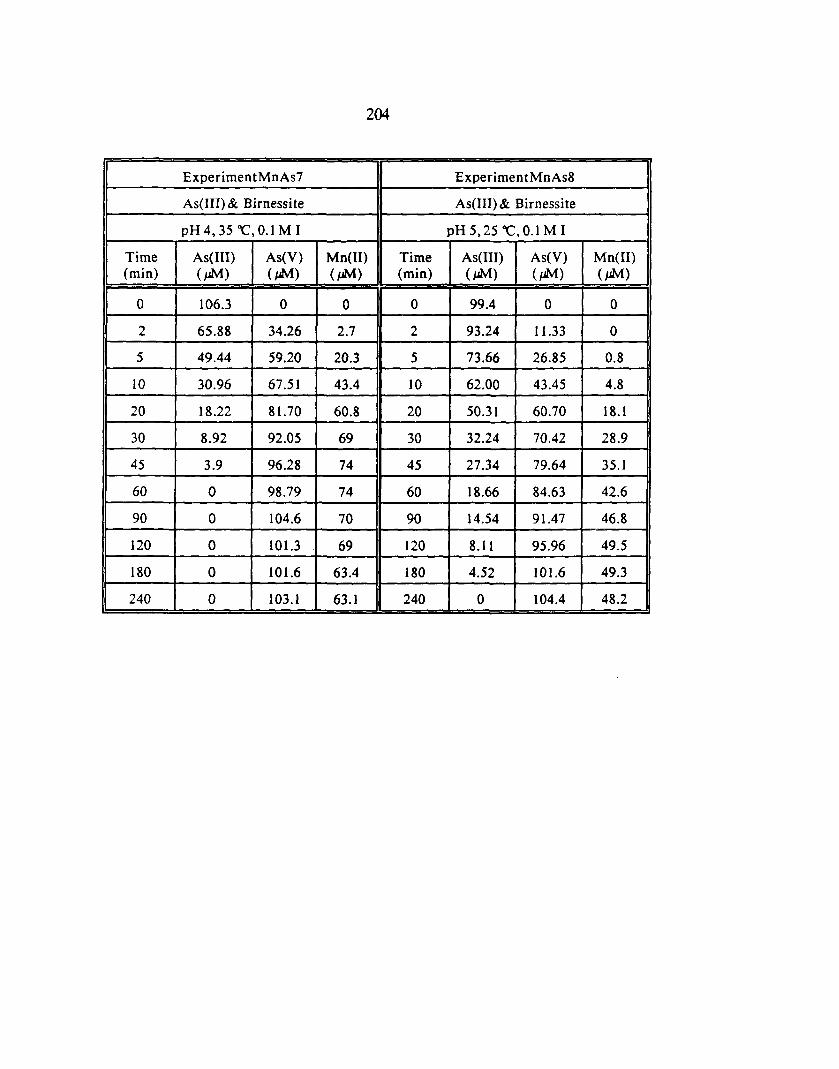
204
ExperimentMnAs7 ExperimentMnAs8
As(III) & Birnessite As(lIJ) & Birnessite
pH 4, 35 "C, 0.1 M I pH 5,25 "C, 0.1 M I
Time As(III) As(V) Mn(II) Time As(I1I) As(V) Mn(II) (min) (JAM) (JAM) (JAM) (min) (JAM) (JAM) (JAM)
0 106.3 0 0 0 99.4 0 0
2 65.88 34.26 2.7 2 93.24 11.33 0
5 49.44 59.20 20.3 5 73.66 26.85 0.8
10 30.96 67.51 43.4 10 62.00 43.45 4.8
20 18.22 81.70 60.8 20 50.31 60.70 18.1
30 8.92 92.05 69 30 32.24 70.42 28.9
45 3.9 96.28 74 45 27.34 79.64 35.1
60 0 98.79 74 60 18.66 84.63 42.6
90 0 104.6 70 90 14.54 91.47 46.8
120 0 101.3 69 120 8.11 95.96 49.5
180 0 101.6 63.4 180 4.52 101.6 49.3
240 0 103.1 63.1 240 0 104.4 48.2
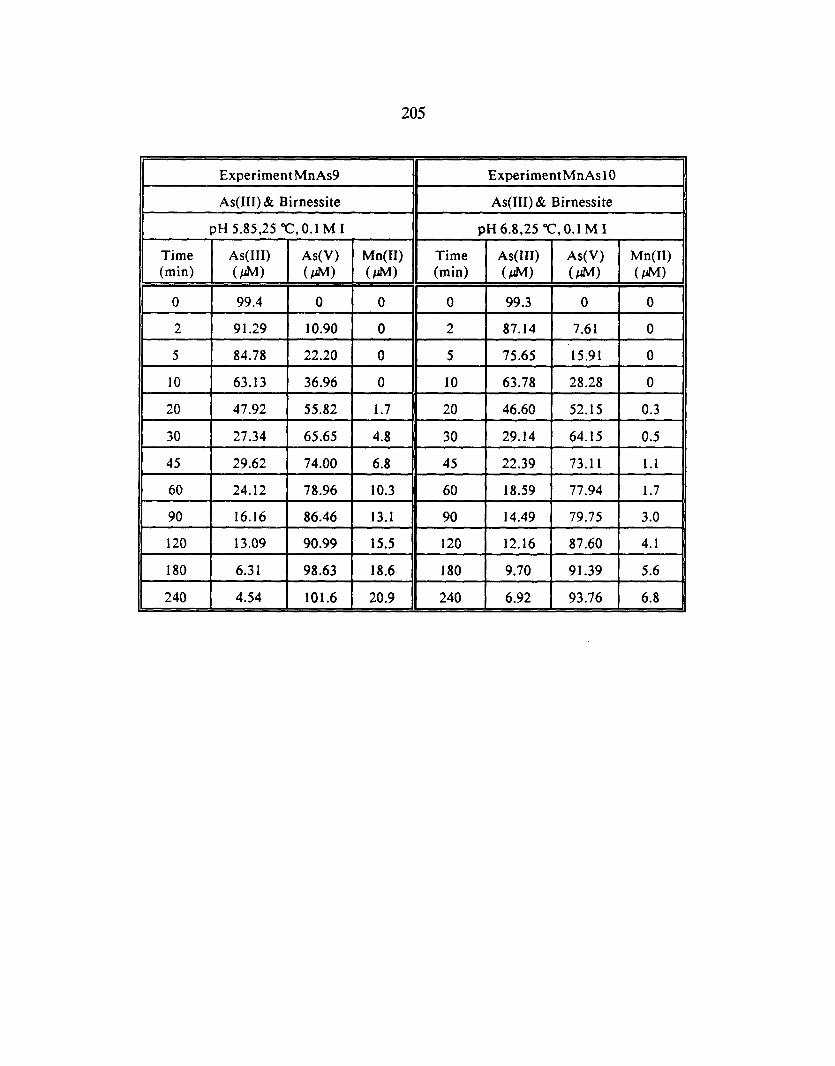
205
ExperimentMnAs9 ExperimentMnAsI0
As(lII) & Birnessite As(III) & Birnessite
pH 5.85,25 "C, 0.1 M I pH 6.8,25 "C, 0.1 M I
Time As(III) As(V) Mn(II) Time As(III) As(V) Mn(II) (min) (JM) (JM) (JM) (min) (JM) (JM) (JM)
0 99.4 0 0 0 99.3 0 0
2 91.29 10.90 0 2 87.14 7.61 0
5 84.78 22.20 0 5 75.65 15.91 0
10 63.13 36.96 0 10 63.78 28.28 0
20 47.92 55.82 1.7 20 46.60 52.15 0.3
30 27.34 65.65 4.8 30 29.14 64.15 0.5
45 29.62 74.00 6.8 45 22.39 73.11 l.l
60 24.12 78.96 10.3 60 18.59 77.94 1.7
90 16.16 86.46 13.1 90 14.49 79.75 3.0
120 13.09 90.99 15.5 120 12.16 87.60 4.1
180 6.31 98.63 18.6 180 9.70 91.39 5.6
240 4.54 101.6 20.9 240 6.92 93.76 6.8
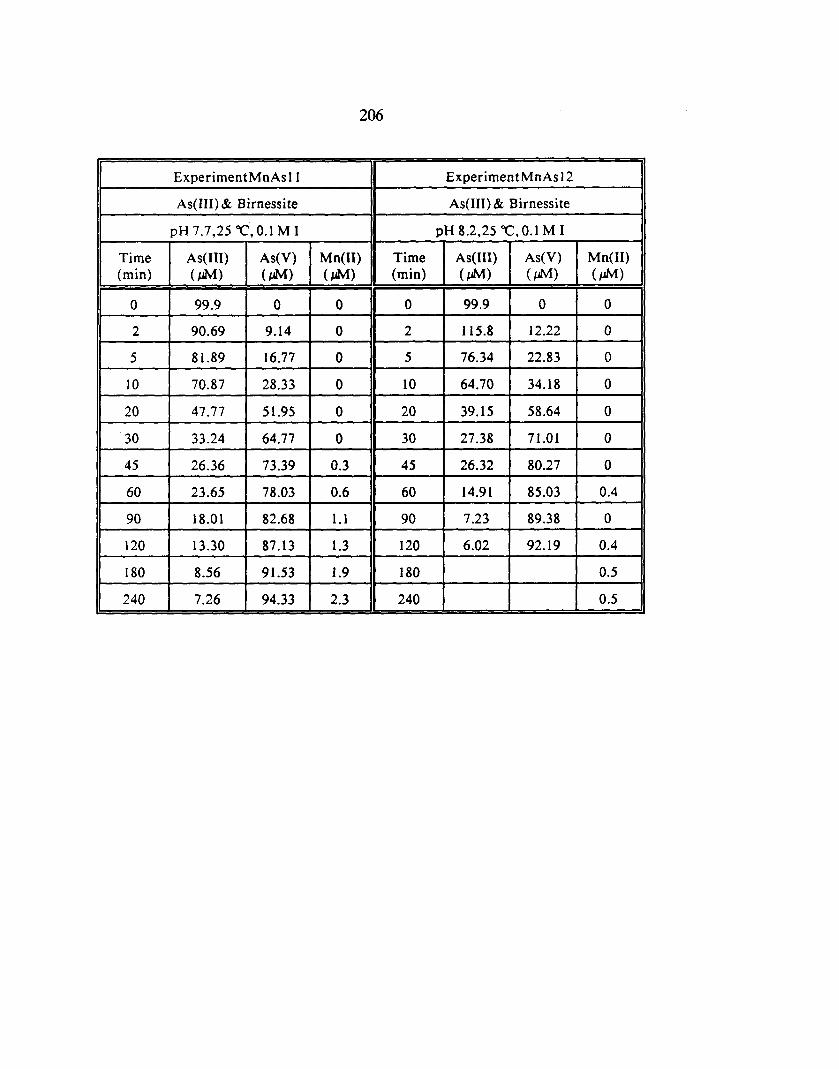
206
ExperimentMnAsl1 ExperimentMnAs 12
As(III) & Birnessite As(III) & Birnessite
pH 7.7,25 "C, 0.1 M I pH 8.2,25 "C, 0.1 M I
Time As(III) As(V) Mn(II) Time As(III) As(V) Mn(II) (min) (JM) (pM) (pM) (min) (pM) (pM) (pM)
0 99.9 0 0 0 99.9 0 0
2 90.69 9.14 0 2 115.8 12.22 0
5 81.89 16.77 0 5 76.34 22.83 0
10 70.87 28.33 0 10 64.70 34.18 0
20 47.77 51.95 0 20 39.15 58.64 0
30 33.24 64.77 0 30 27.38 71.01 0
45 26.36 73.39 0.3 45 26.32 80.27 0
60 23.65 78.03 0.6 60 14.91 85.03 0.4
90 18.01 82.68 1.1 90 7.23 89.38 0
120 13.30 87.13 1.3 120 6.02 92.19 0.4
180 8.56 91.53 1.9 180 0.5
240 7.26 94.33 2.3 240 0.5
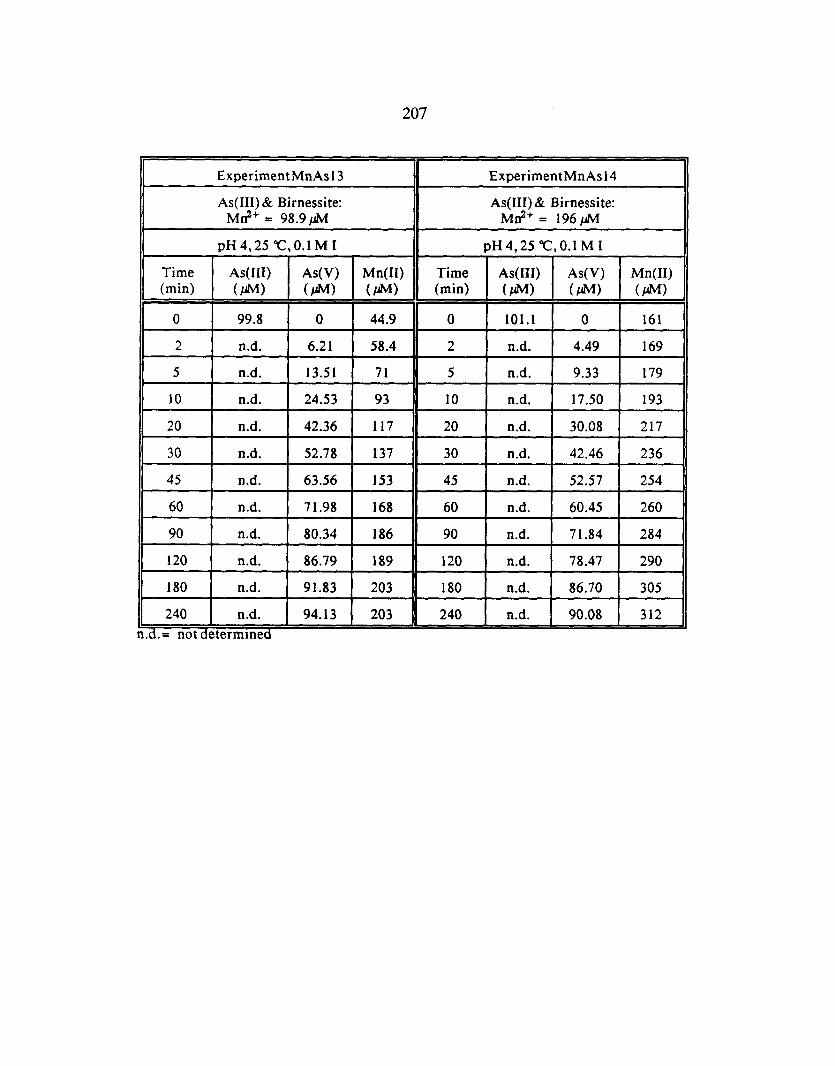
207
ExperimentMnAs 13 ExperimentMnAs 14
As(lII) & Birnessite: As(IIJ) & Birnessite: M~+ = 98.9JM M~+ = 196JM
pH 4,25 "C, 0.1 M I pH 4, 25 "C, 0.1 M I
Time As(III) As(V) Mn(II) Time As(III) As(V) Mn(II) (min) (JM) (JM) (JM) (min) (JM) (JM) (JM)
0 99.8 0 44.9 0 101.1 0 161
2 n.d. 6.21 58.4 2 n.d. 4.49 169
5 n.d. 13.51 71 5 n.d. 9.33 179
10 n.d. 24.53 93 10 n.d. 17.50 193
20 n.d. 42.36 II7 20 n.d. 30.08 217
30 n.d. 52.78 137 30 n.d. 42.46 236
45 n.d. 63.56 153 45 n.d. 52.57 254
60 n.d. 71.98 168 60 n.d. 60.45 260
90 n.d. 80.34 186 90 n.d. 71.84 284
120 n.d. 86.79 189 120 n.d. 78.47 290
180 n.d. 91.83 203 180 n.d. 86.70 305
240 n.d. 94.13 203 240 n.d. 90.08 312 n.d. - not determmed
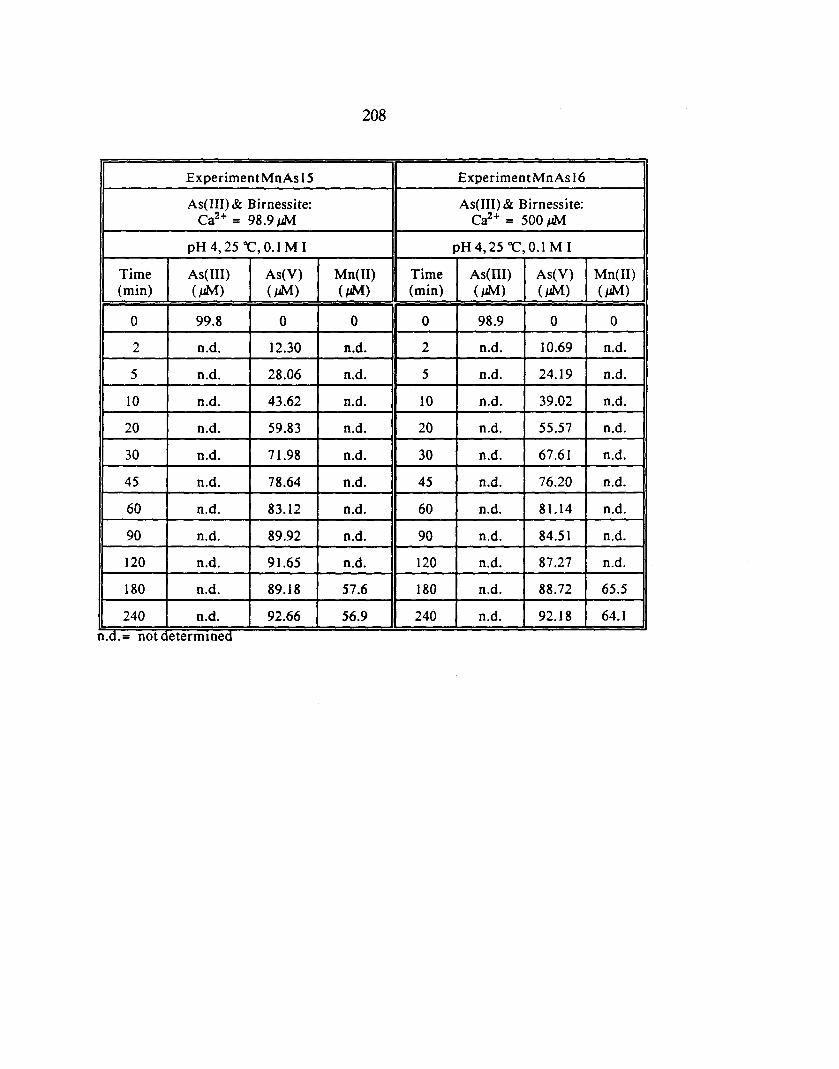
208
ExperimentMnAsl5 ExperimentMnAsl6
As(III) & Birnessite: As(III) & Birnessite: Ca2+ = 98.9 lIM Ca2+ = 500 lIM
pH 4,25 "C, 0.1 M I pH 4,25 "C, 0.1 M I
Time As(III) As(V) Mn(II) Time As(III) As(V) Mn(II) (min) (pM) (lIM) (pM) (min) (1M) (lIM) (1M)
0 99.8 0 0 0 98.9 0 0
2 n.d. 12.30 n.d. 2 n.d. 10.69 n.d.
5 n.d. 28.06 n.d. 5 n.d. 24.19 n.d.
10 n.d. 43.62 n.d. 10 n.d. 39.02 n.d.
20 n.d. 59.83 n.d. 20 n.d. 55.57 n.d.
30 n.d. 71.98 n.d. 30 n.d. 67.61 n.d.
45 n.d. 78.64 n.d. 4S n.d. 76.20 n.d.
60 n.d. 83.12 n.d. 60 n.d. 81.14 n.d.
90 n.d. 89.92 n.d. 90 n.d. 84.51 n.d.
120 n.d. 91.65 n.d. 120 n.d. 87.27 n.d.
180 n.d. 89.18 57.6 180 n.d. 88.72 65.5
240 n.d. 92.66 56.9 240 n.d. 92.18 64.1 n.d.- note etermmed
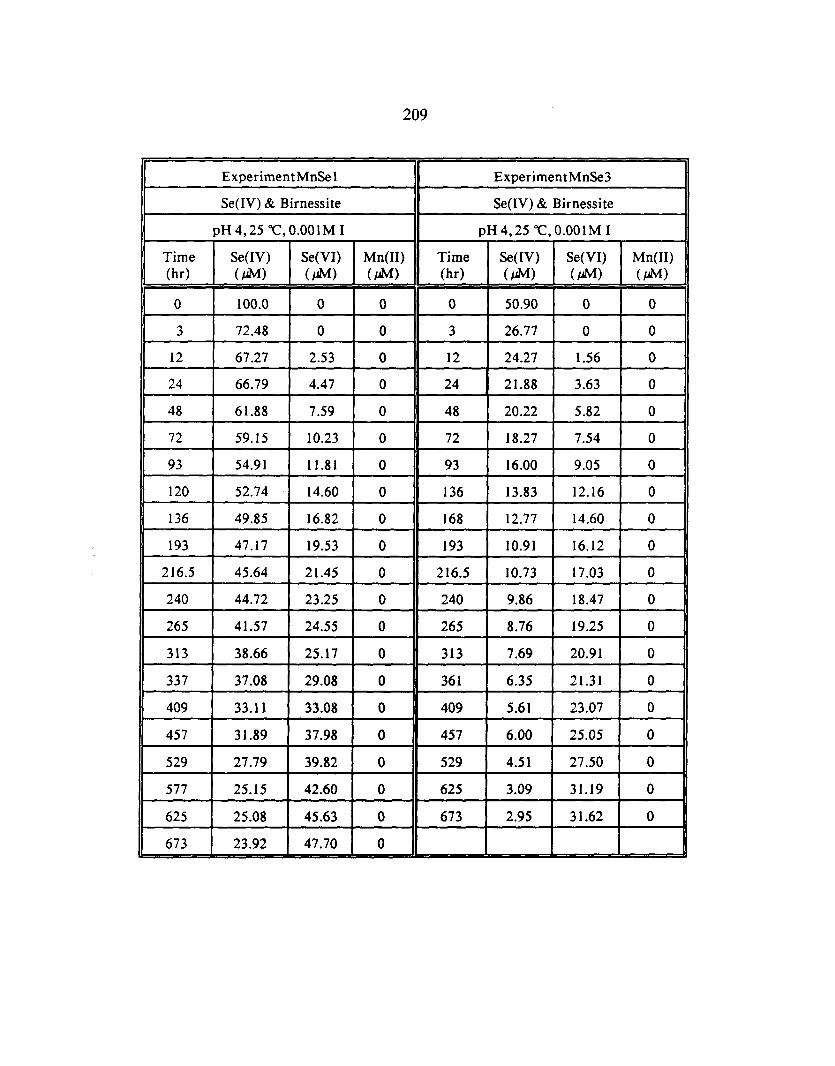
209
Experiment MnSe 1 ExperimentMnSe3
Se(lV) & Birnessite Se(IV) & Birnessite
pH4,25 "C,O.OOIMI pH 4,25 "C, 0.001 M I
Time Se(IV) Se(VI) Mn(IJ) Time Se(IV) Se(VI) Mn(JI) (hr) (1M) (1M) (1M) (hr) (1M) (1M) (1M)
0 100.0 0 0 0 50.90 0 0
3 72.48 0 0 3 26.77 0 0
12 67.27 2.53 0 12 24.27 1.56 0
24 66.79 4.47 0 24 21.88 3.63 0
48 61.88 7.59 0 48 20.22 5.82 0
72 59.15 10.23 0 72 18.27 7.54 0
93 54.91 11.81 0 93 16.00 9.05 0
120 52.74 14.60 0 136 13.83 12.16 0
136 49.85 16.82 0 168 12.77 14.60 0
193 47.17 19.53 0 193 10.91 16.12 0
216.5 45.64 21.45 0 216.5 10.73 17.03 0
240 44.72 23.25 0 240 9.86 18.47 0
265 41.57 24.55 0 265 8.76 19.25 0
313 38.66 25.17 0 313 7.69 20.91 0
337 37.08 29.08 0 361 6.35 21.31 0
409 33.11 33.08 0 409 5.61 23.07 0
457 31.89 37.98 0 457 6.00 25.05 0
529 27.79 39.82 0 529 4.51 27.50 0
577 25.15 42.60 0 625 3.09 31.19 0
625 25.08 45.63 0 673 2.95 31.62 0
673 23.92 47.70 0
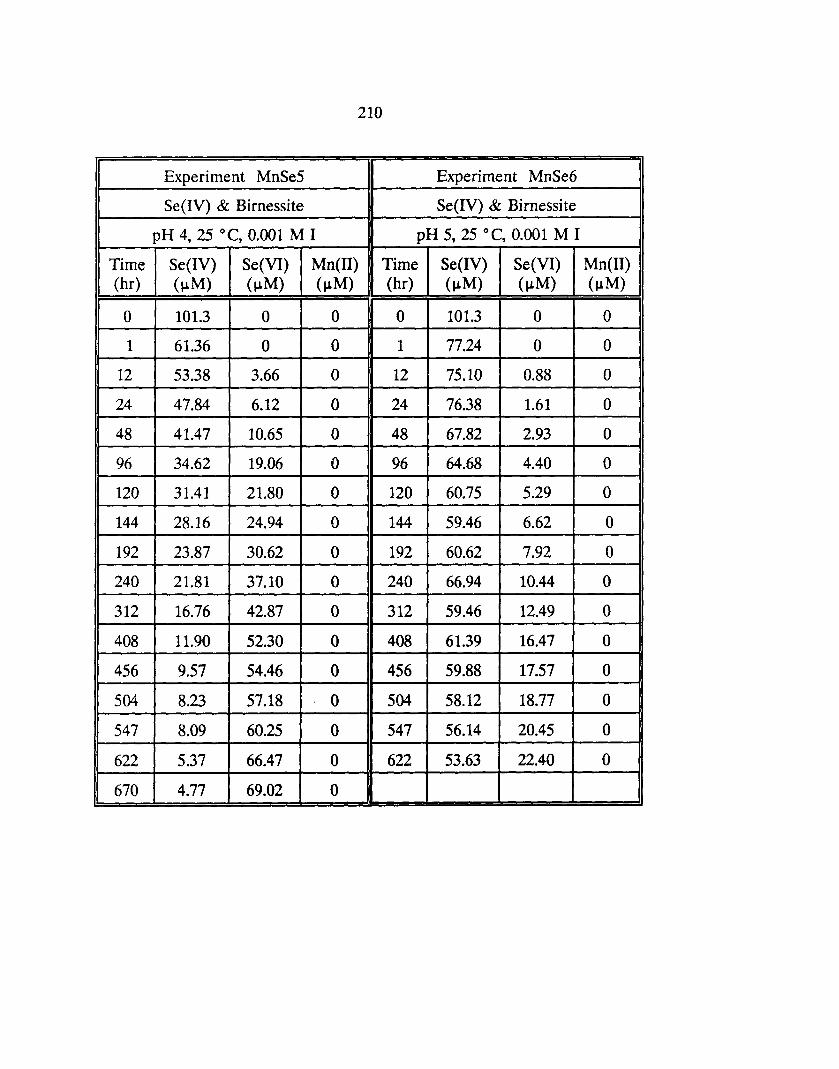
210
Experiment MnSe5 Experiment MnSe6
Se(IV) & Birnessite Se(IV) & Birnessite
pH 4,25 °C, 0.001 M I pH 5, 25°C, 0.001 M I
Time SeelY) Se(VI) Mn(II) Time Se(lV) Se(VI) Mn(II) (hr) (~M) (~M) (~M) (hr) (~M) (~M) (~M)
0 101.3 0 0 0 101.3 0 0
1 61.36 0 0 1 77.24 0 0
12 53.38 3.66 0 12 75.10 0.88 0
24 47.84 6.12 0 24 76.38 1.61 0
48 41.47 10.65 0 48 67.82 2.93 0
96 34.62 19.06 0 96 64.68 4.40 0
120 31.41 21.80 0 120 60.75 5.29 0
144 28.16 24.94 0 144 59.46 6.62 0
192 23.87 30.62 0 192 60.62 7.92 0
240 21.81 37.10 0 240 66.94 10.44 0
312 16.76 42.87 0 312 59.46 12.49 0
408 11.90 52.30 0 408 61.39 16.47 0
456 9.57 54.46 0 456 59.88 17.57 0
504 8.23 57.18 0 504 58.12 18.77 0
547 8.09 60.25 0 547 56.14 20.45 0
622 5.37 66.47 0 622 53.63 22.40 0
670 4.77 69.02 0
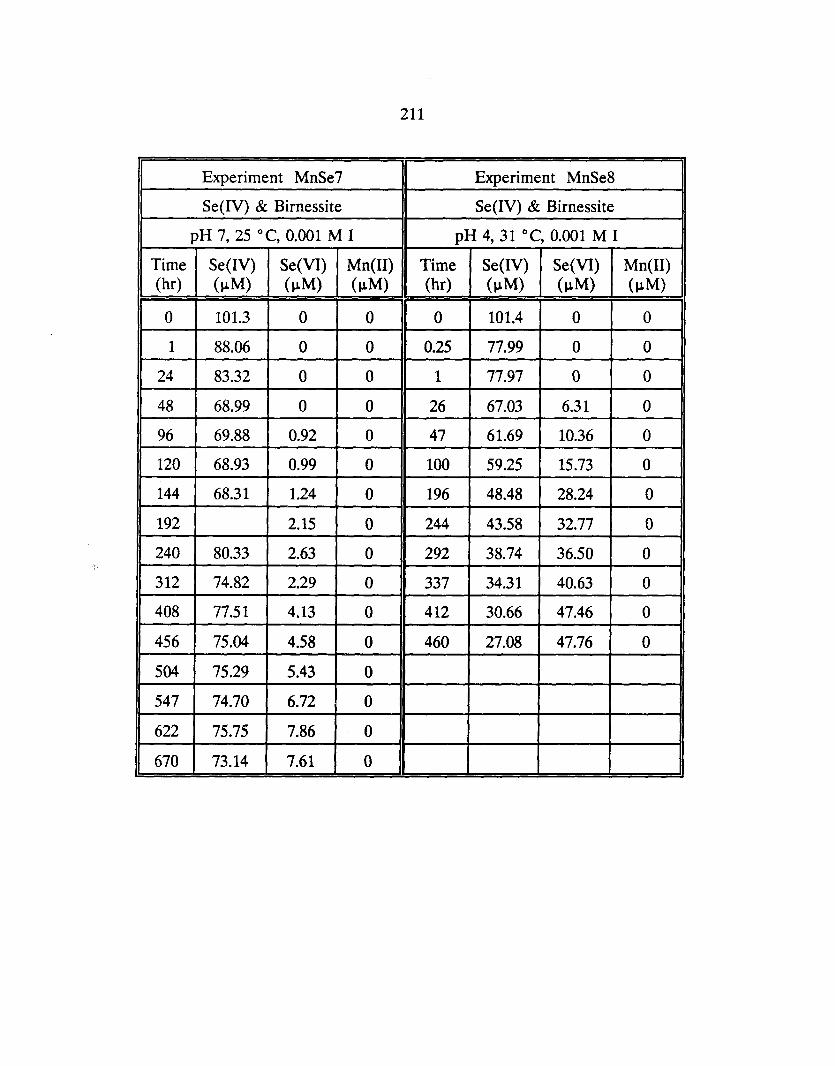
211
Experiment MnSe 7 Experiment MnSe8
Se(IV) & Birnessite Se(IV) & Birnessite
pH 7, 25°C, 0.001 M I pH 4, 31°C, 0.001 M I
Time Se(IV) Se(VI) Mn(II) Time Se(IV) Se(VI) Mn(II) (hr) (~M) (~M) (~M) (hr) (~M) (~M) (~M)
0 101.3 0 0 0 101.4 0 0
1 88.06 0 0 0.25 77.99 0 0
24 83.32 0 0 1 77.97 0 0
48 68.99 0 0 26 67.03 6.31 0
96 69.88 0.92 0 47 61.69 10.36 0
120 68.93 0.99 0 100 59.25 15.73 0
144 68.31 1.24 0 196 48.48 28.24 0
192 2.15 0 244 43.58 32.77 0
240 80.33 2.63 0 292 38.74 36.50 0
312 74.82 2.29 0 337 34.31 40.63 0
408 77.51 4.13 0 412 30.66 47.46 0
456 75.04 4.58 0 460 27.08 47.76 0
504 75.29 5.43 0
547 74.70 6.72 0
622 75.75 7.86 0
670 73.14 7.61 0
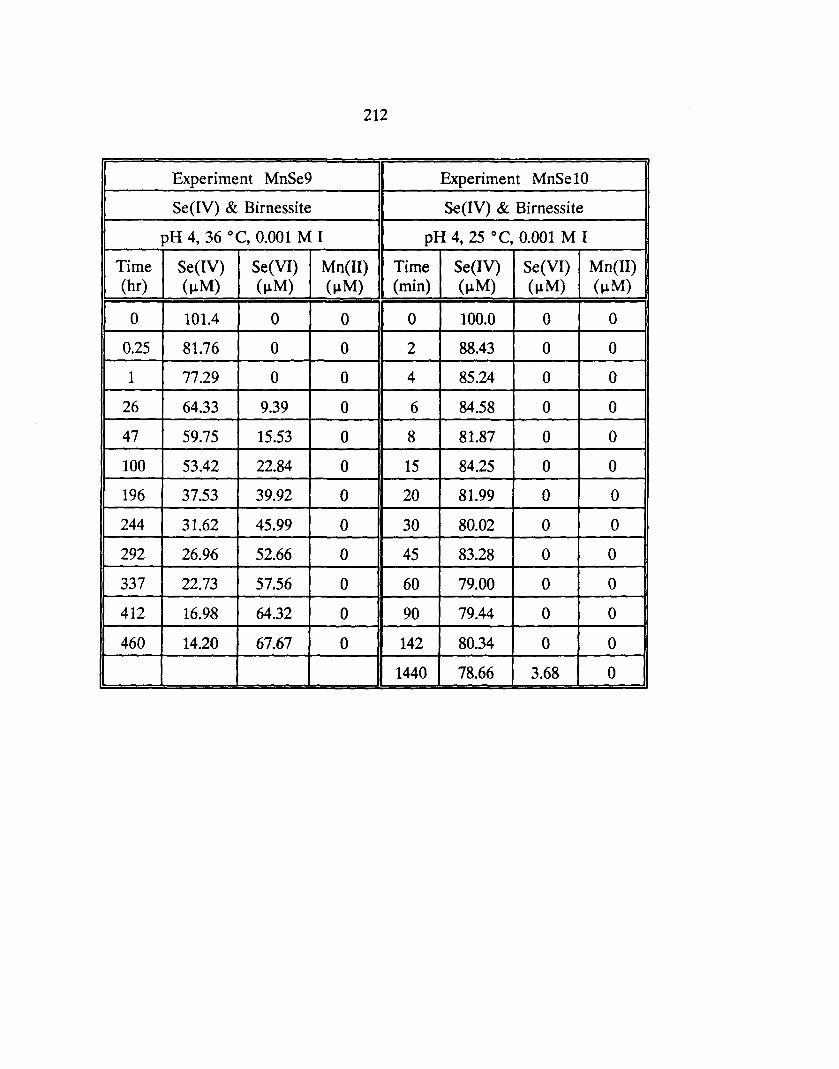
212
Experiment MnSe9 Experiment MnSe 10
Se(IV) & Birnessite SeelY) & Birnessite
pH 4, 36 °C, 0.001 M I pH 4,25 °C, 0.001 M I
Time Se(IV) Se(VJ) Mn(II) Time Se(IV) Se(VJ) Mn(II) (hr) (~M) (~M) (~M) (min) (~M) (~M) (~M)
0 101.4 0 0 0 100.0 0 0
0.25 81.76 0 0 2 88.43 0 0
1 77.29 0 0 4 85.24 0 0
26 64.33 9.39 0 6 84.58 0 0
47 59.75 15.53 0 8 81.87 0 0
100 53.42 22.84 0 15 84.25 0 0
196 37.53 39.92 0 20 81.99 0 0
244 31.62 45.99 0 30 80.02 0 0
292 26.96 52.66 0 45 83.28 0 0
337 22.73 57.56 0 60 79.00 0 0
412 16.98 64.32 0 90 79.44 0 0
460 14.20 67.67 0 142 80.34 0 0
1440 78.66 3.68 0
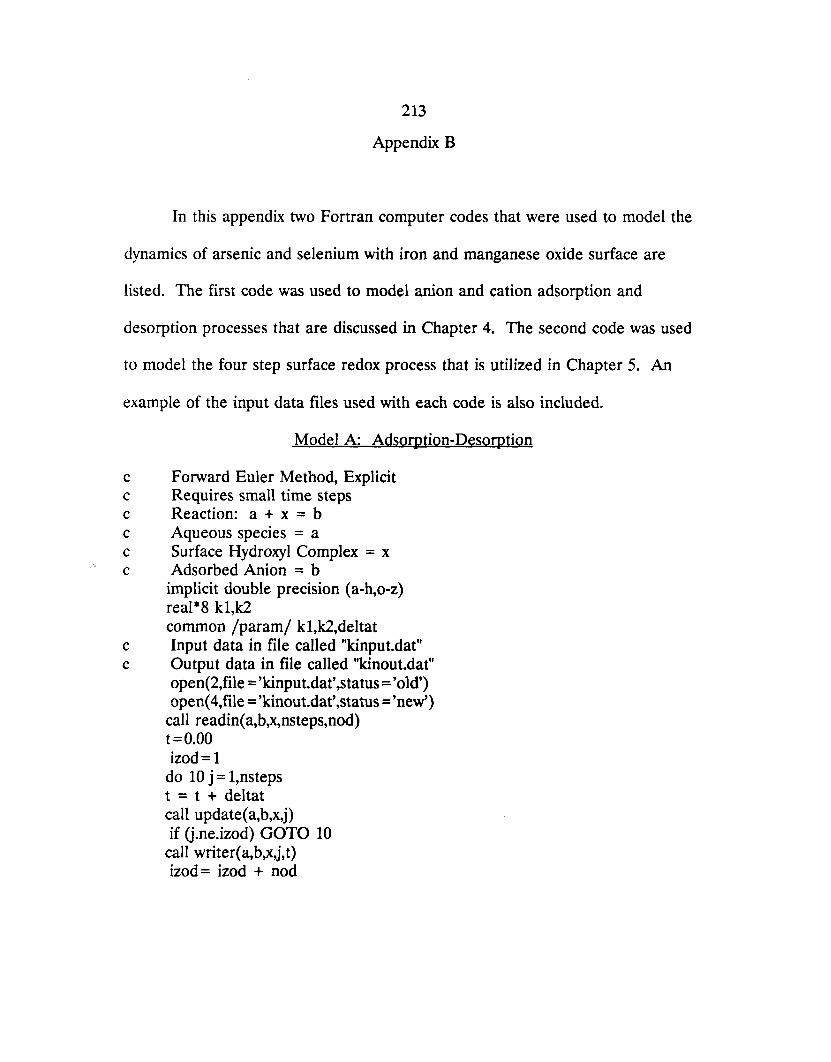
213
Appendix B
In this appendix two Fortran computer codes that were used to model the
dynamics of arsenic and selenium with iron and manganese oxide surface are
listed. The first code was used to model anion and cation adsorption and
desorption processes that are discussed in Chapter 4. The second code was used
to model the four step surface redox process that is utilized in Chapter 5. An
example of the input data files used with each code is also included.
Model A: Adsorption-Desorption
c Forward Euler Method, Explicit c Requires small time steps c Reaction: a + x = b c Aqueous species = a c Surface Hydroxyl Complex = x c Adsorbed Anion = b
implicit double precision (a-h,o-z) real * 8 k 1,k2 common /param/ k1,k2,deltat
c Input data in file called "kinput.dat" c Output data in file called "kinout.dat"
open(2,file = 'kinput.dat' ,status =' old') open( 4,file = 'kinout.dat' ,status:::: 'new')
call readin( a,b,x,nsteps,nod) t=O.OO izod= 1
do 10 j = 1,nsteps t = t + deltat call update( a,b,x,j) if (j.ne.izod) GOTO 10
call writer(a,b,x,j,t) izod = izod + nod
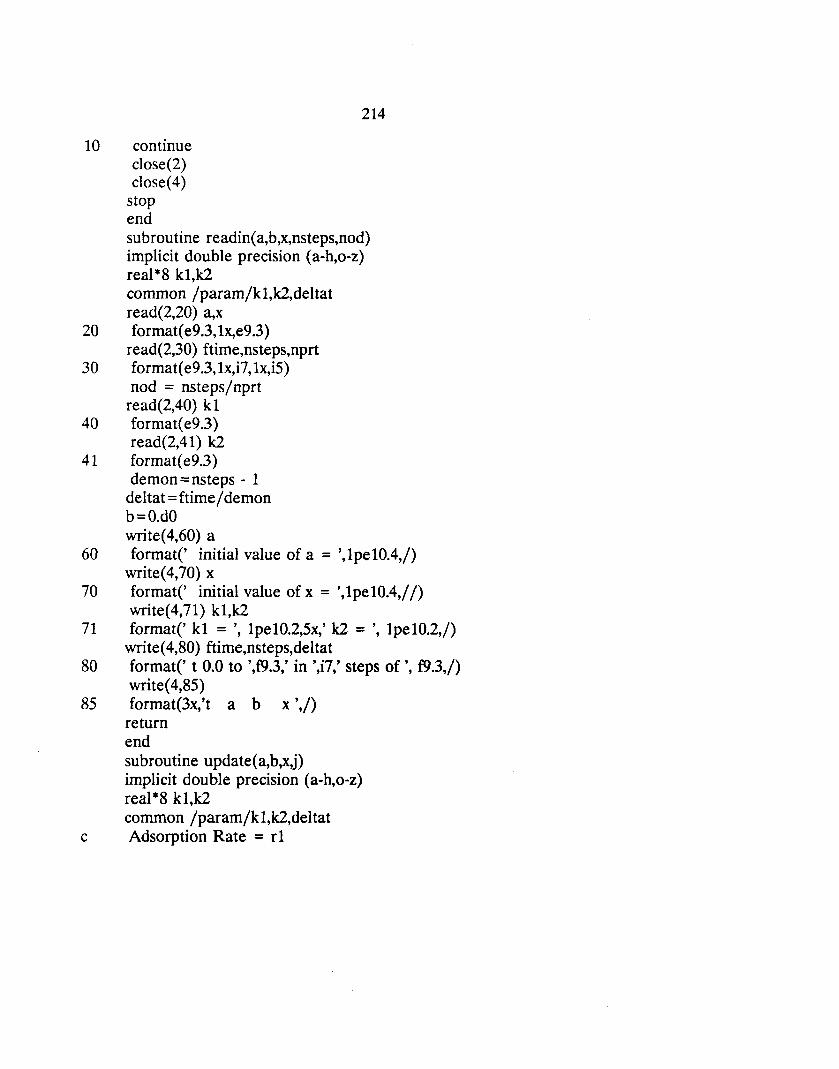
10 continue close(2) close(4)
stop end
214
subrou tine readin( a,b,x,nsteps,nod) implicit double precision (a-h,o-z) real*8 kl,k2 common Iparam/kl,k2,deltat read(2,20) a,x
20 format(e9.3,lx,e9.3) read(2,30) ftime,nsteps,nprt
30 formate e9.3, 1x,i7, lx,i5) nod = nsteps/nprt
read(2,40) kl 40 format(e9.3)
read(2,41) k2 41 format(e9.3)
demon = nsteps - 1 deltat = ftime I demon b=O.dO write ( 4,60) a
60 format(, initial value of a = ',lpelOA,/) write(4,70) x
70 formate' initial value of x = ',lpelOA,1 I) write(4,71) k1,k2
71 formate' kl = " Ipel0.2,5x,' k2 = " 1pelO.2,/) write ( 4,80) ftime,nsteps,deltat
80 format(, t 0.0 to ',f9.3,' in ',i7,' steps of " f9.3,/) write( 4,85)
85 format(3x,'t a b x ',I) return end subroutine update( a,b,x,j) implicit double precision (a-h,o-z) real*8 kl,k2 common Iparam/kl,k2,deltat
c Adsorption Rate = rl
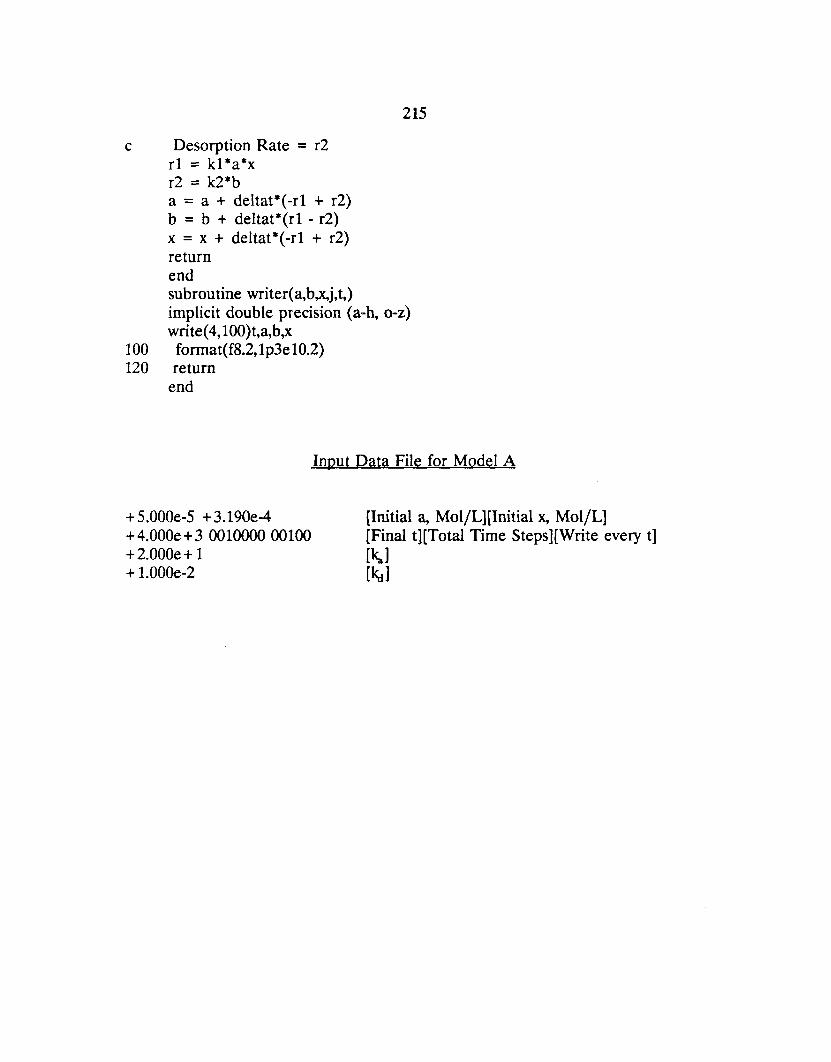
c Desorption Rate = r2 rl = kl*a*x r2 = k2*b a = a + deltat*( -r1 + r2) b = b + deltat*(rl - r2) x = x + deltat*(-rl + r2) return end subroutine writer(a,b,x,j,t,)
215
implicit double precision (a-h, o-z) write( 4, lOO)t,a,b,x
100 format(f8.2, 1p3e 10.2) 120 return
end
+ S.OOOe-S + 3. 190e-4 +4.000e+3 0010000 00100 + 2.000e + 1 + 1.000e-2
Input Data File for Model A
[Initial a, MoljL][Initial x, MoljL] [Final t](Total Time Steps][Write every t] [1<a] [~]
216
Model B: Adsorption-Desorption-Electron Transfer
c forward euler method, explicit, requires small times steps c ReactionA: a + x = b c ReactionB: b = c c ReactionC: c = d + Y c ReactionD: y = e + x c Aqueous reduced anion = a c Surface Hydroxyl Complex = x c Adsorbed Anion = b c Surface Redox Product = c c Aqueous oxidized anion = d c Aqueous reduced metal = e c Surface reduced metal complex = y c Input data in file called "kinput.dat" c Output data in file called "kinout.dat"
implicit double precision (a-h,o-z) real *8 k1,k2,k3,k4,kS,k6,k7,k8 common /param/ k1,k2,k3,k4,kS,k6,k7,k8,deltat open(2,file = 'kinput.dat',status = 'old') open( 4,file = 'kinout.dat' ,status = 'new')
call readin( a,b,c,d,e,y,x,nsteps,nod) t=O.OO izod= 1
do 10 j = 1,nsteps t = t + deltat call update( a,b,c,d,e,y ,x,j) if (j.ne.izod) GOTO 10
call wri ter( a, b,c,d,e,y ,x,j, t) izod = izod + nod
10 continue close(2) close(4)
stop end subrou tine readin( a, b,c,d,e,y ,x,nsteps,nod) implicit double precision (a-h,o-z) real * 8 k1,k2,k3,k4,kS,k6,k7,k8 common /param/k1,k2,k3,k4,kS,k6,k7,k8,deltat read(2,20) a,x
20 format(e9.3,lx,e9.3) read(2,30) ftime,nsteps,nprt
30 format( e9.3, 1x,i7, 1x,i5) nod = nsteps/nprt
read(2,40) k1,k3,k5,k7 40 format(4(e9.3,2x»
read(2,41) k2,k4,k6,k8 41 format(4(e9.3,2x»
demon = nsteps - 1 deltat = ftime 1 demon b=O.dO c=O.dO d=O.dO e=O.dO y=O.dO write ( 4,60) a
217
60 formate initial value of a = ',lpelO.4,/) write ( 4,70) x
70 formate initial value of x = ',lpelO.4,/ /) write(4,71) k1,k2
71 formate k1 = " 1pe10.2,5x,' k2 = " Ipel0.2,/) write( 4, 72) k3,k4
72 formate k3 = " IpelO.2,5x,' k4 = " 1pelO.2,/) write(4,73) k5,k6
73 formate k5 = " IpelO.2,5x,' k6 = " IpelO.2,/) write(4,74) k7,k8
74 formate k7 = " IpelO.2,5x,' k8 = " IpelO.2,1 I) write( 4,80) ftime,nsteps,deltat
80 format(' t 0.0 to ',f9.3,' in ',i7,' steps of " f9.3,/) write ( 4,85)
85 format(3x,'t abc dey x ',I) return end subroutine update( a,b,c,d,e,y ,x,j) implicit double precision (a-h,o-z) real * 8 k1,k2,k3,k4,k5,k6,k7,k8 common Iparam/k 1,k2,k3,k4,k5,k6,k7 ,k8,deltat rl = kl *a*x r2 = k2*b r3 = k3*b r4 = k4*c r5 = k5*c r6 = k6*y*d r7 = k7*y
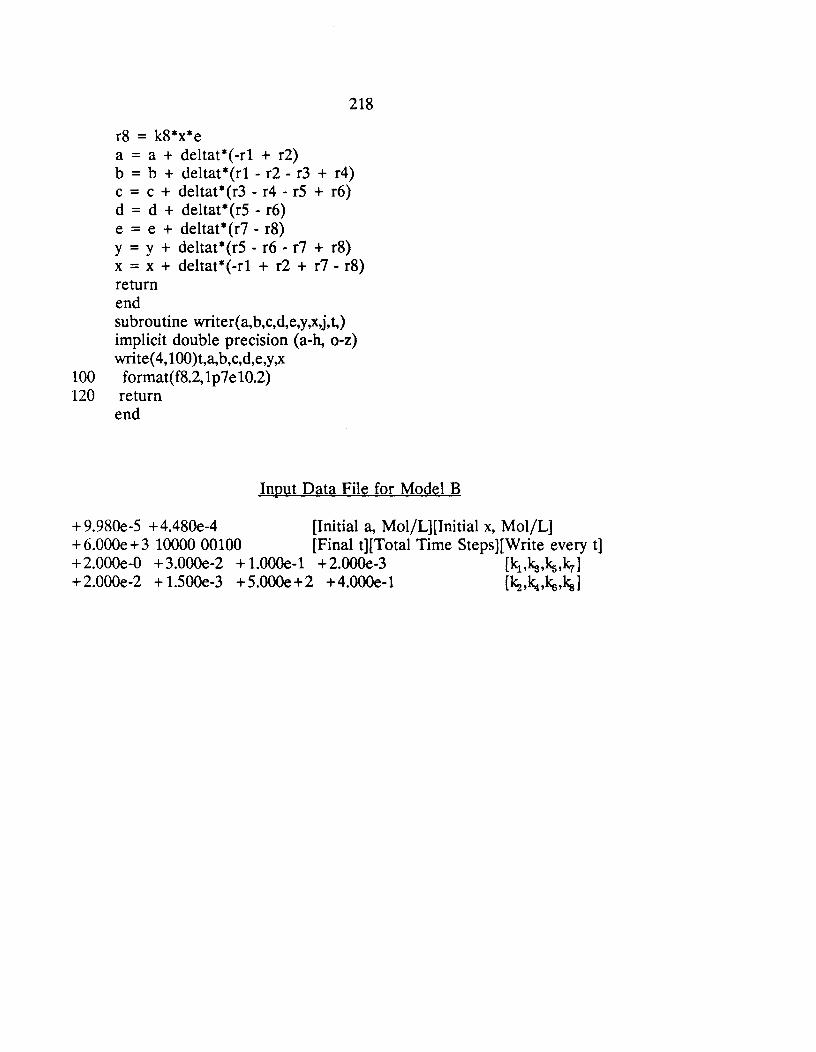
21S
rS = kS*x*e a = a + deltat*( -rl + r2) b = b + deltat*(rl - r2 - r3 + r4) c = c + deltat*(r3 - r4 - rS + r6) d = d + deltat*(rS - r6) e = e + deltat*(r7 - rS) y = y + deltat*(rS - r6 - r7 + rS) x = x + deltat*(-rl + r2 + r7 - rS) return end subroutine writer(a,b,c,d,e,y,x,j,t,) implicit double precision (a-h, o-z) write ( 4,1 OO)t,a,b,c,d,e,y,x
100 format(fS.2,lp7el0.2) 120 return
end
Input Data File for Model B
+ 9.9S0e-S +4.4SOe-4 [Initial a, Mol/L][Initial x, Mol/L] +6.000e+3 1000000100 [Final t][Total Time Steps][Write every t] +2.000e-0 +3.000e-2 +1.000e-1 +2.000e-3 [k1,kg,l\s,krJ +2.000e-2 + l.S00e-3 +S.OOOe+2 +4.000e-1 (~,~,k6,ksJ
219
Appendix C
MODELING PROCEDURES AND SENSITIVITY
In this appendix the procedures used in the kinetic modeling of the
experimental data are presented and discussed with some general modeling rules of
thumb. Also the sensitivity of the kinetic model used to describe the adsorption and
redox processes studied in Chapter S is examined by varying the values of the rate
constants and the equilibrium constants.
C.l Modeling Procedures
1. Create a Lotus 1-2-3 worksheet for each experimental data set.
2. Choose a set of rate constants.
3. Run FORTRAN computer code.
4. Import output file into Lotus 1-2-3 worksheet.
S. Compare model data with experimental data (see Figure C.1):
a. Visually by inspecting the time profiles of each set.
b. Statistically by minimizing the average difference and maximum
difference between the experimental and model data. The average difference is
defined as the average of all the absolute values of the differences between the
measured species concentration and the predicted species concentration at each time
throughout the duration of the experiment. The maximum difference is defined as
the maximum value of all the absolute values of the differences between the
measured and predicted concentrations throughout the duration of each experiment.
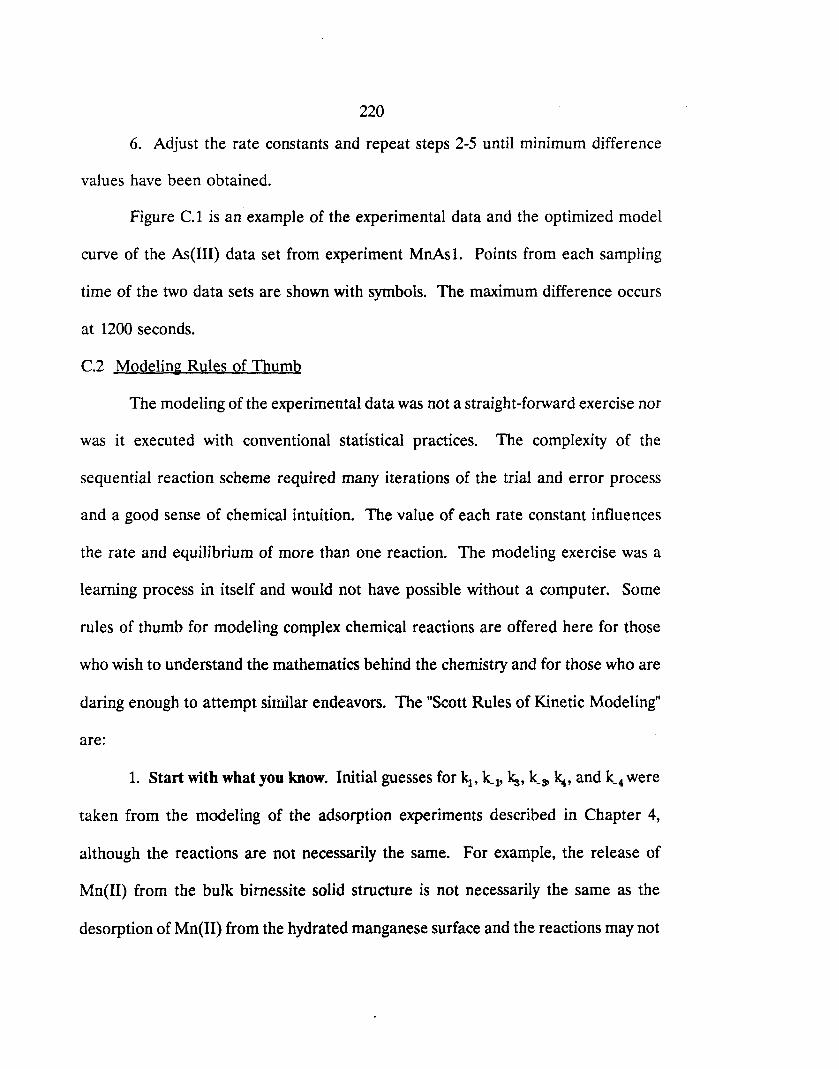
220
6. Adjust the rate constants and repeat steps 2-5 until minimum difference
values have been obtained.
Figure C.1 is an example of the experimental data and the optimized model
curve of the As(III) data set from experiment MnAs 1. Points from each sampling
time of the two data sets are shown with symbols. The maximum difference occurs
at 1200 seconds.
C.2 Modeling Rules of Thumb
The modeling of the experimental data was not a straight-forward exercise nor
was it executed with conventional statistical practices. The complexity of the
sequential reaction scheme required many iterations of the trial and error process
and a good sense of chemical intuition. The value of each rate constant influences
the rate and equilibrium of more than one reaction. The modeling exercise was a
learning process in itself and would not have possible without a computer. Some
rules of thumb for modeling complex chemical reactions are offered here for those
who wish to understand the mathematics behind the chemistry and for those who are
daring enough to attempt similar endeavors. The "Scott Rules of Kinetic Modeling"
are:
1. Start with what you know. Initial guesses for kl' k_l' ks, k3' ~, and k_4 were
taken from the modeling of the adsorption experiments described in Chapter 4,
although the reactions are not necessarily the same. For example, the release of
Mn(II) from the bulk birnessite solid structure is not necessarily the same as the
desorption of Mn(IJ) from the hydrated manganese surface and the reactions may not
221
1.00
0.80 + Experimental Data ..--..
2 ----C Predicted Model Values 0
+--' 0.60 C'iJ L
+--' ~ C.q-(J)I o!:Y C 0 0.40 Average Difference 3.14 uM U =
---- !>Maximun Difference = 6.18 uM (j)
« 0.20
+
o~ __ ~~ __ ~;===~====~~~ o 1200 2400 3600 4800 6000
Time (sec)
Figure C.1: Comparison of experimental data and predicted model curve of As(III) from experiment MnAsl (Table 5.2).
222
proceed at the same rates. However, in order to keep the kinetic model simple, the
reactions were considered similar enough to use the values of the adsorption.
desorption rate constants as initial guesses.
2. Start at the beginning. The modeling exercise was begun by finding a
value for kl that minimized the difference between measured and predicted As(III)
or Se(IV) concentrations. Particular interest was placed on minimizing the difference
for the initial data points. When the best value of kl was obtained, k_I was then
varied. Likewise, the rate constants were optimized in order (kl' kl' ... , ~, k_J
although sometimes it was necessary to readjust a previously optimized rate constant
before continuing through the group of rate constants.
3. Six of one, half dozen or the other: making choices. Minimizing the
differences for initial data points of each data set were given preference over
minimizing the differences for later data points. This was done because the reaction
conditions were generally better known at the beginning of each experiment than at
the end.
4. Remember the value of the rate constant is only as good as the
experimentalist. The value of each rate constant was reported to one or two
significant digits. Only two significant digits were used if, for example, 3.5 was better
than 3 or 4, or, as in the case of the selenium data, the rate constants were optimized
in time units of minutes and then changed to seconds by dividing by 60 (e.g., 10 min- I
= 0.17 sec-I). While it may have been possible to see a difference between rate
223
constants at 3 or 4 significant digits, I did not feel the experimental data was
sufficient to warrant such high precision.
C.3 Sensitivity of the Adsorption-Redox Kinetic Model
The average and maximum differences between the experimental and model
data for the reactions involving arsenite and selenite with birnessite are listed in
Tables C.l and C.2. In the arsenite experiments the rate constants were adjusted to
minimize the differences for the experimental As(III), As(V), and Mn(II) data, while
in the selenite experiments, only data for Se(IV) and Se(VI) were used in the
optimization process. No Mn(II) appeared in solution during the extended selenite
experiments and the rate constants were adjusted so that no Mn(II) would be
predicted to appear in solution. Thus it was enough to visually compare the
difference between the experimental and predicted data sets for Mn(II).
C.3.l Sensitivity Analysis of Experiment MnAsl
The sensitivity of the kinetic model is examined by taking a closer look at the
modeling of experiment MnAsl (Figure 5.4: pH 4, 25 °C, 99.6 ~M As(III), 502 ~M
> MnOH). The final results of the optimization processes are given in Table 5.2.
In Figure C.2, the effect on the average and maximum differences of varying kl is
presented. All other rate constants and reaction variables are held constant (Table
5.2). The figure illustrates the sensitivity of the model. The differences grow rapidly
when the value of kl is either decreased or increased from the optimal value of 5 M
Isec-1• The maximum difference for As(III) is the most sensitive. For this data set,
a value of 5 M" ~ec-l was chosen although the minimum average difference for the
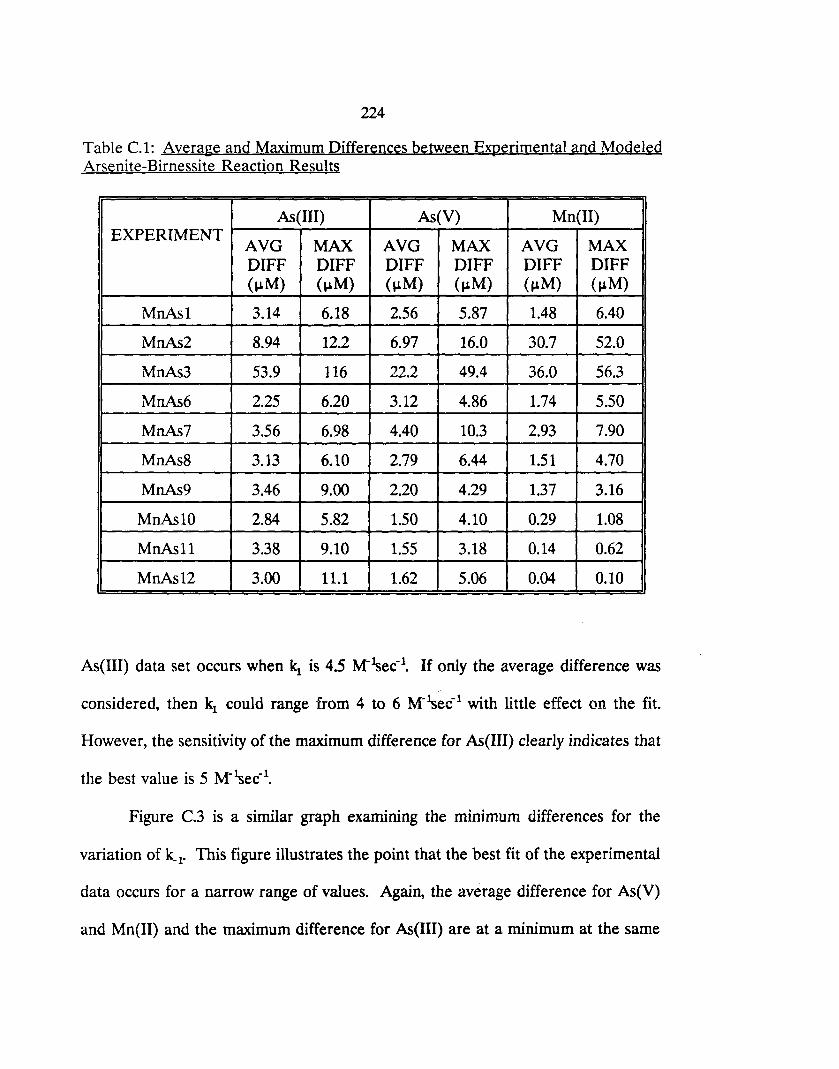
224
Table C.l: Average and Maximum Differences between Experimental and Modeled Arsenite-Birnessite Reaction Results
As(IJI) As(V) Mn(IJ) EXPERIMENT
AVG MAX AVG MAX AVG MAX DIFF DIFF DIFF DIFF DIFF DIFF (~M) (~M) (~M) (~M) (~M) (~M)
MnAs1 3.14 6.18 2.56 5.87 1.48 6.40
MnAs2 8.94 12.2 6.97 16.0 30.7 52.0
MnAs3 53.9 116 22.2 49.4 36.0 56.3
MnAs6 2.25 6.20 3.12 4.86 1.74 5.50
MnAs7 3.56 6.98 4.40 10.3 2.93 7.90
MnAs8 3.13 6.10 2.79 6.44 1.51 4.70
MnAs9 3.46 9.00 2.20 4.29 1.37 3.16
MnAsI0 2.84 5.82 1.50 4.10 0.29 1.08
MnAsl1 3.38 9.10 1.55 3.18 0.14 0.62
MnAs12 3.00 11.1 1.62 5.06 0.04 0.10
As(III) data set occurs when kl is 4.5 M-lsec-1• If only the average difference was
considered, then kl could range from 4 to 6 M-~ec-l with little effect on the fit.
However, the sensitivity of the maximum difference for As(III) clearly indicates that
Figure C.3 is a similar graph examining the minimum differences for the
variation of k_ 1. This figure illustrates the point that the best fit of the experimental
data occurs for a narrow range of values. Again, the average difference for As(V)
and Mn(IJ) and the maximum difference for As(III) are at a minimum at the same
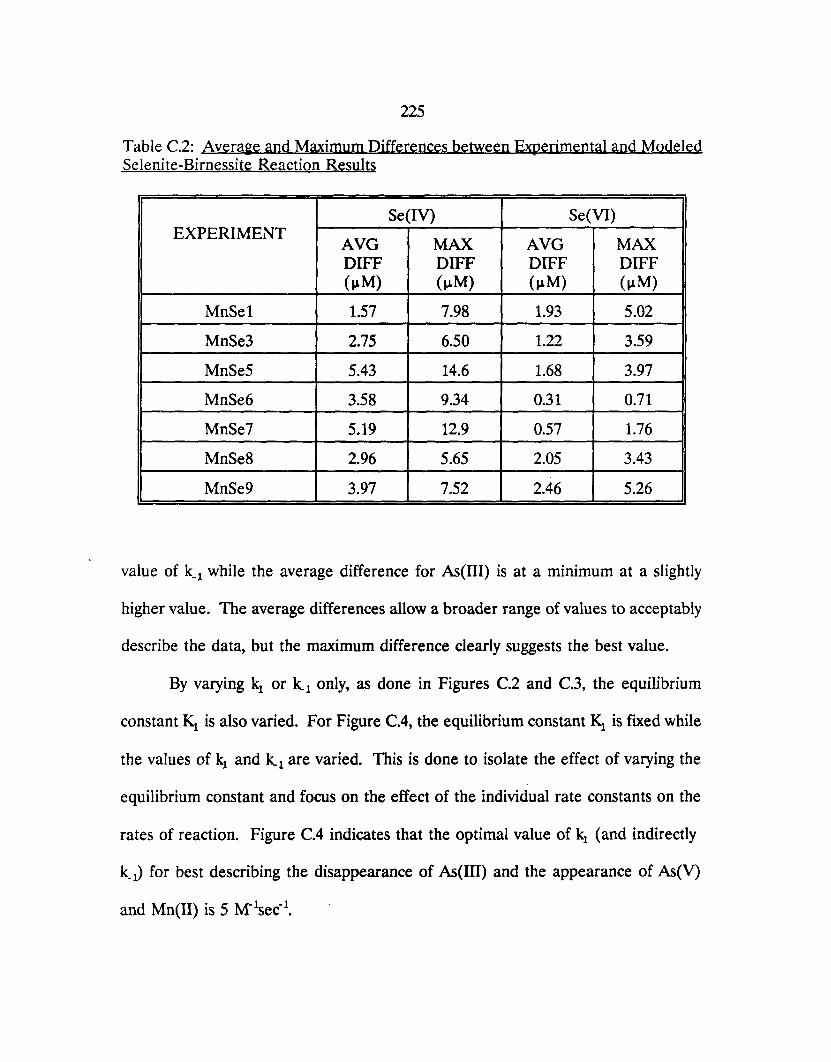
225
Table C.2: Average and Maximum Differences between Experimental and Modeled Selenite-Birnessite Reaction Results
Se(IV) Se(VI) EXPERIMENT
AVG MAX AVG MAX DIFF DIFF DIFF DIFF (~M) (~M) (~M) (~M)
MnSel 1.57 7.98 1.93 5.02
MnSe3 2.75 6.50 1.22 3.59
MnSe5 5.43 14.6 1.68 3.97
MnSe6 3.58 9.34 0.31 0.71
MnSe7 5.19 12.9 0.57 1.76
MnSe8 2.96 5.65 2.05 3.43
MnSe9 3.97 7.52 2.46 5.26
value of kl while the average difference for As(III) is at a minimum at a slightly
higher value. The average differences allow a broader range of values to acceptably
describe the data, but the maximum difference clearly suggests the best value.
By varying kl or kl only, as done in Figures C.2 and C.3, the equilibrium
constant Kl is also varied. For Figure C.4, the equilibrium constant Kl is fixed while
the values of kl and k..l are varied. This is done to isolate the effect of varying the
equilibrium constant and focus on the effect of the individual rate constants on the
rates of reaction. Figure C.4 indicates that the optimal value of kl (and indirectly
k_J for best describing the disappearance of As(III) and the appearance of As(V)
and Mn(U) is 5 M-~ec-l.
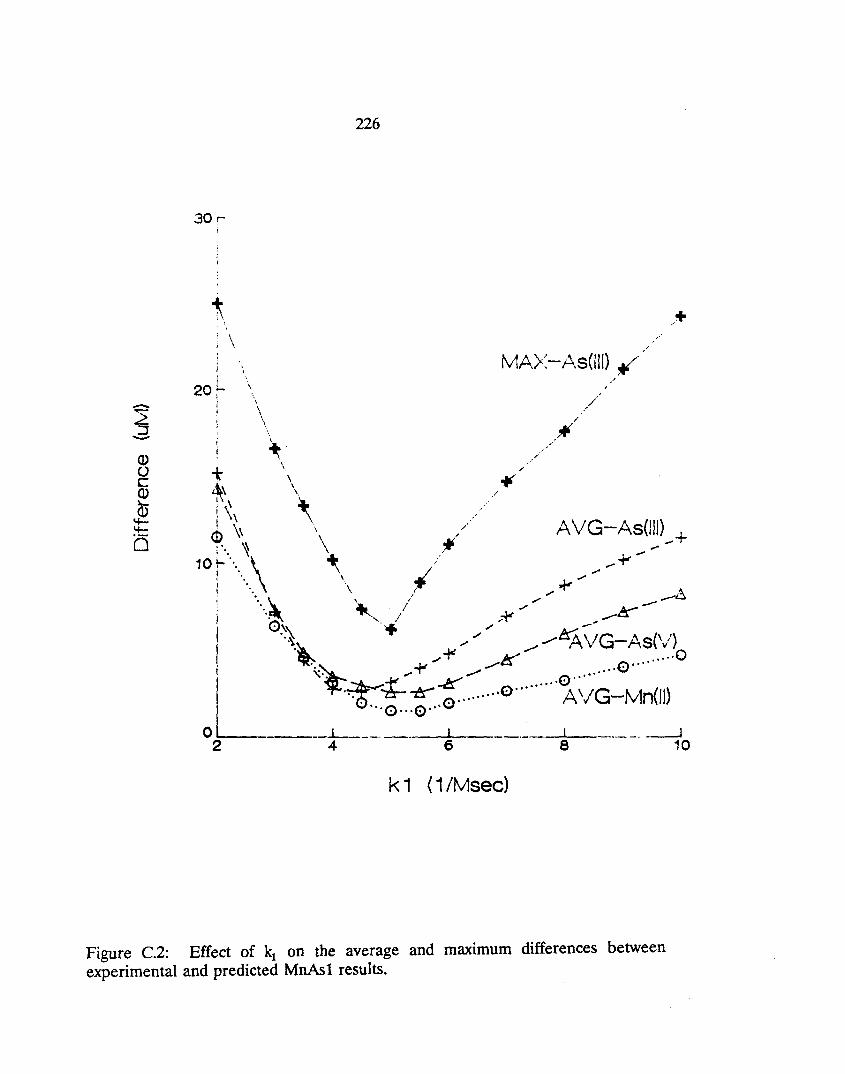
226
30r
,
; \ I i
-~
20L l
I
/
" \. /
-:¥ ./ ~.
k 1 (1 1M sec)
Figure C.2: Effect of kl on the average and maximum differences between experimental and predicted MnAs1 results.
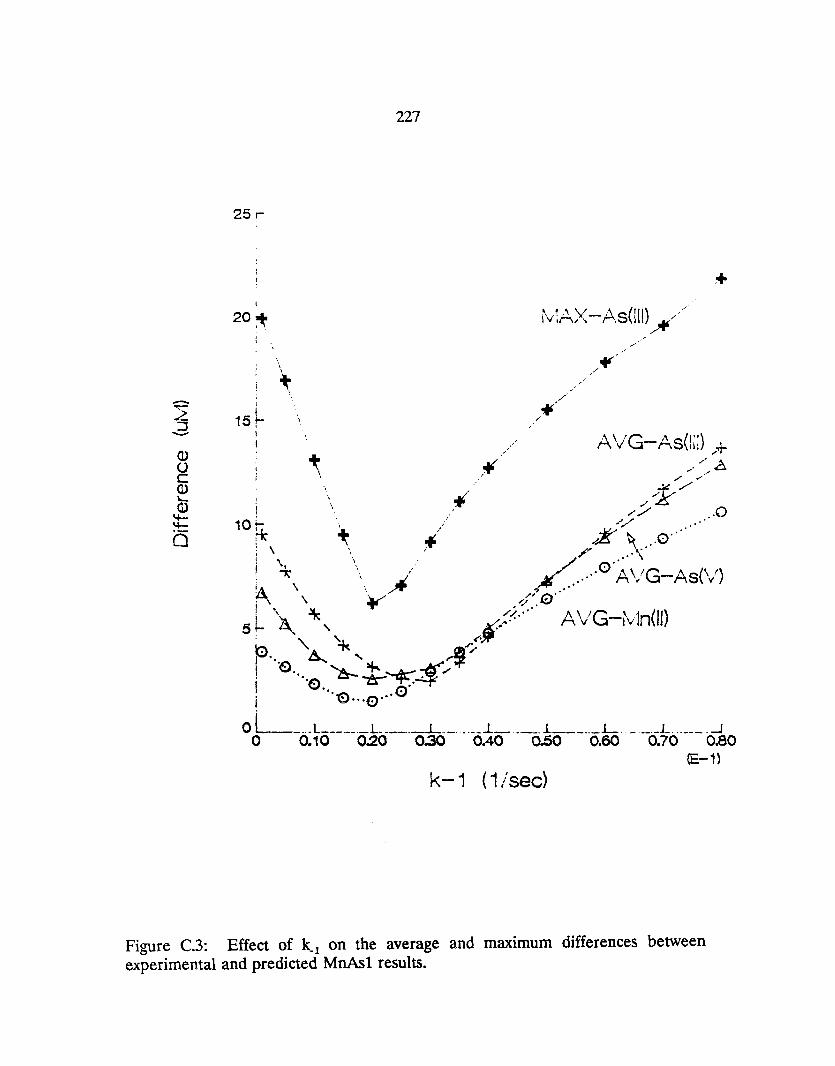
227
25 r
+
20~ ~Vl .. \ V - ,\ S('") /. I ,1"\,,, r. III ~/
I
15 ~ A \/G-AsO;;) .-+
/A ... '" / .;
, ~ /~/ 10
I , // .. 0 * ~' .'l .,' : \ ;1>1 .iE' ~ .. 0···· , ,," ..... ( i \, / 0" !A "" \ \. ~/ .,At .......... A V G-As(\'/) ~ \ ~ ~'e' ! \ ~,. • .
5 ~ ~ , x,:(..... A \'G-rvln(lJ) , ~ <.J1'
~ , ""1"' ...«"", ! "'s A.... '~ ,~;;Y: I '. ·e .. ~~""4S4 . '<, 0 ... 0 I \J''' ••
o L __ ... L _____ ._L ___ .--L ___ . __ ..1. ___ .1. ____ ._1- J I o 0.10 0.20 0.30 0.40 01::.0 0.60 -._-'- _ ... _-_ ....... 0iJ 0.70 0.80
(E-1)
k-1 (1!sec)
Figure C.3: Effect of k_l on the average and maximum differences between experimental and predicted MnAsl results.
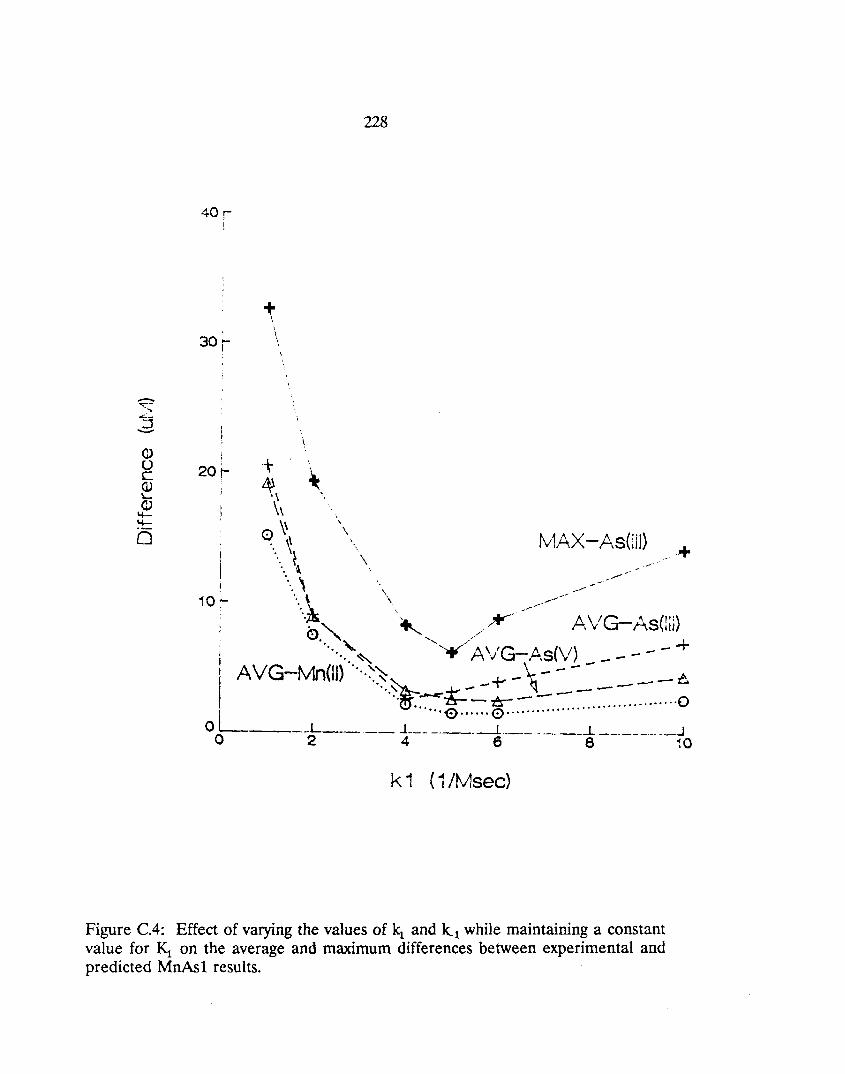
40r !
30 .... I
20 t- 1-4\ . \
\\ o \\ . ,\ .... \~
'. ~
\ \
228
\ rvt~X -AsCi])
\\ - --+
10 :-'. ,\ -
\. ------.... ~, ;.. .,Y- -- .A.VG-As(lil) 0,"", ......... /
I - •• '- ................. .,,~' I _ + I AVG M (~') .... ~ ~ A \; G~AS(Vl_ - - - -I - nIl .... ~.~ __ _ -.:-+-_\:=------e. I "~ ..... ~ tr- ........................ ··0 L ·0 ...... 0···· ....
00 ------t--- -- i--- -----i--- --·----t -------·---~o k 1 (1/Msec)
Figure C.4: Effect of varying the values of kl and kl while maintaining a constant value for Klan the average and maximum differences between experimental and predicted MnAs! results.
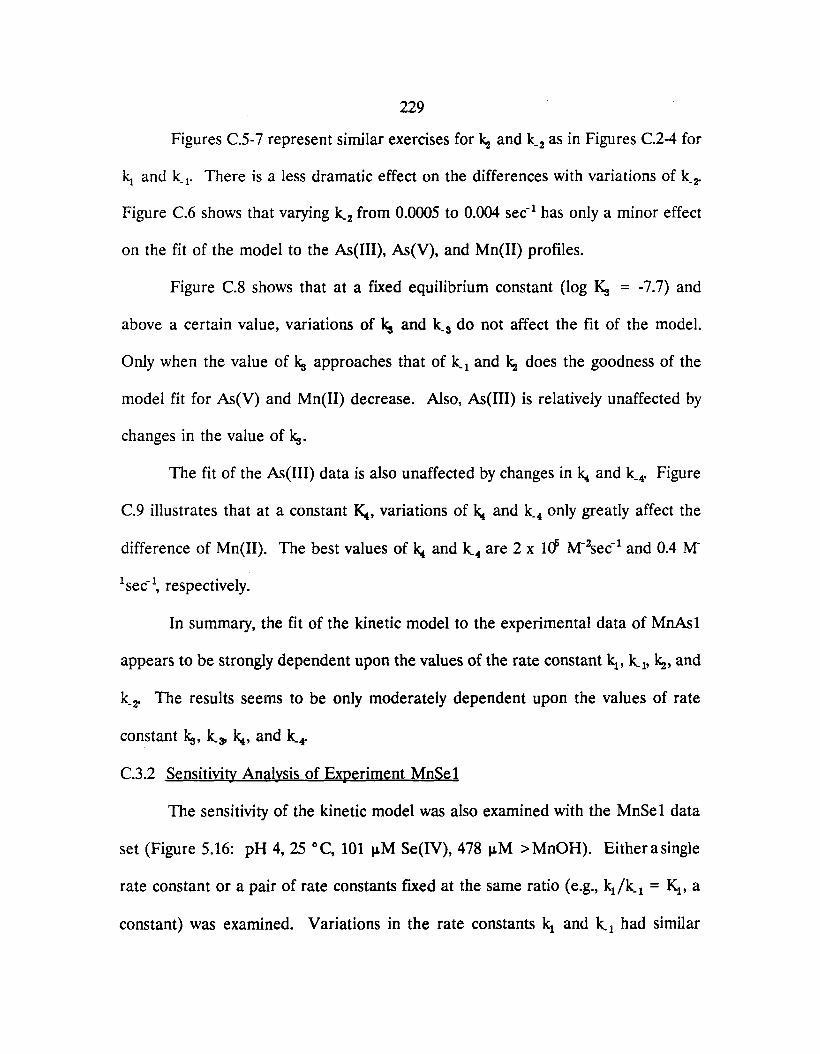
229
Figures e.5-7 represent similar exercises for k2 and k_2 as in Figures e.2-4 for
kl and k_ 1. There is a less dramatic effect on the differences with variations of k2"
Figure e.6 shows that varying k_2 from 0.0005 to 0.004 sec- 1 has only a minor effect
on the fit of the model to the As(III), As(V), and Mn(II) profiles.
Figure e.8 shows that at a fixed equilibrium constant (log Ks = -7.7) and
above a certain value, variations of ks and k_s do not affect the fit of the model.
Only when the value of ks approaches that of kl and k2 does the goodness of the
model fit for As(V) and Mn(II) decrease. Also, As(III) is relatively unaffected by
changes in the value of ks.
The fit of the As(III) data is also unaffected by changes in ~ and k 4. Figure
e.9 illustrates that at a constant K., variations of ~ and k_4 only greatly affect the
difference of Mn(II). The best values of ~ and k_4 are 2 x 1(; M-2sec-1 and 0.4 M
Isec-l, respectively.
In summary, the fit of the kinetic model to the experimental data of MnAs1
appears to be strongly dependent upon the values of the rate constant kl' k_l' k2, and
k2" The results seems to be only moderately dependent upon the values of rate
constant ks, k_3> ~, and k_4'
C.3.2 Sensitivity Analysis of Experiment MnSe 1
The sensitivity of the kinetic model was also examined with the MnSe 1 data
set (Figure 5.16: pH 4, 25°C, 101 ~M Se(IV), 478 ~M > MnOH). Either a single
rate constant or a pair of rate constants fIXed at the same ratio (e.g., kdk_l = K1, a
constant) was examined. Variations in the rate constants kl and k_l had similar
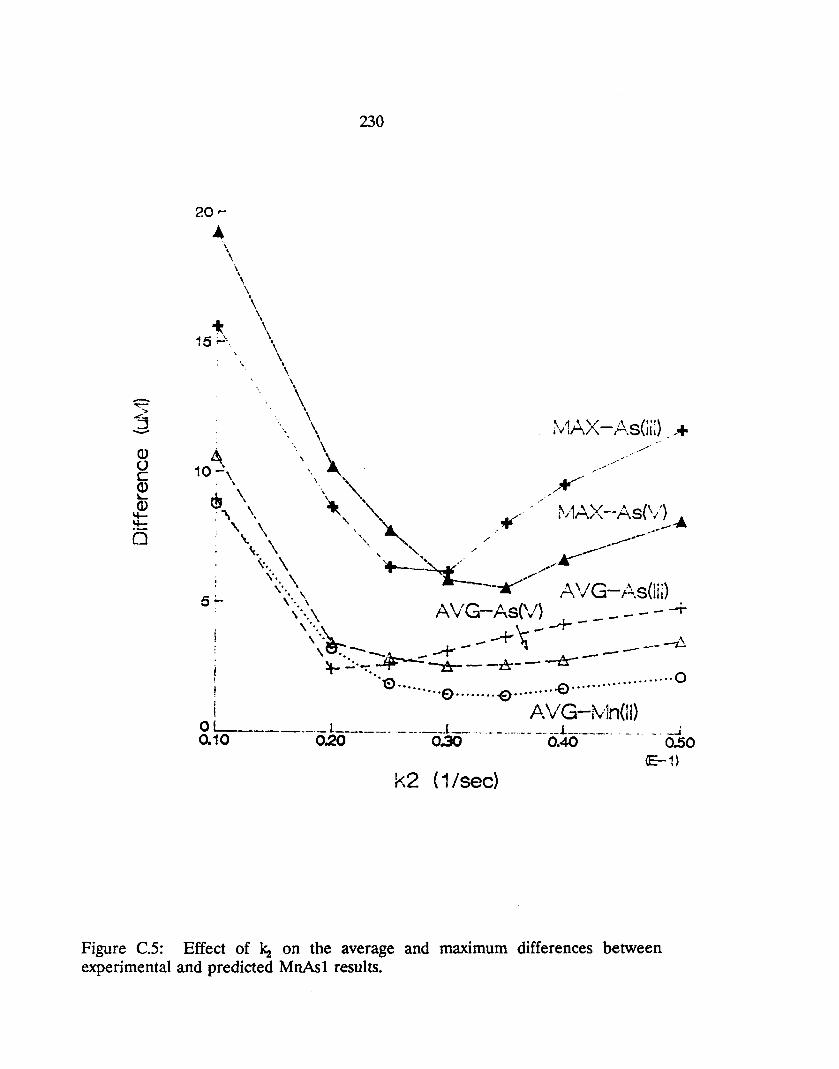
(l) o c (l) ~ (l)
;t: o
20r
\
\
~ 15~'
\ \
\ \ \
\
\ \ ,
\
\ \ \
230
~v1AX -,D..s(i';) ~ \ i\ \
10-\ '., ~ Q, '\ \ ... """ ./ y-: "\ \ ~," ",- ~.l1AX --As(V) ..A
i !
',- \ , ~ -------\ '-", " -- -----~. , '- ~-
\;'. \ if--~~ .. - .--"'-v,. \ .~ ____ \ .... \ --~ A '/G-A.sOiD \' .. \ AVG-As(V) ----+ ,... .-+ - --
\ '.\. - -+ \- - -\ \. e:- _ -'- - 1 _ -- -t..:. '. -J~---' . ~--+ .:;.~ . ....,.. --~ - -tt- - ~
"0 ............. ·0 •••..••.. E> •••••••. ~ •.••.... -E> ••.••.
fl,\/G-l'vln(H) -.-.- t _______ . __ -___ .t_. "' __ .,_ .. ___ .. __ 1 ________ . _. _. _. ~ 0 ..... 1 __
0.10 0.20 0.30 0.40 0.50 (&-1)
k2 (1/sec)
Figure C.S: Effect of k2 on the average and maximum differences between experimental and predicted MnAsl results.
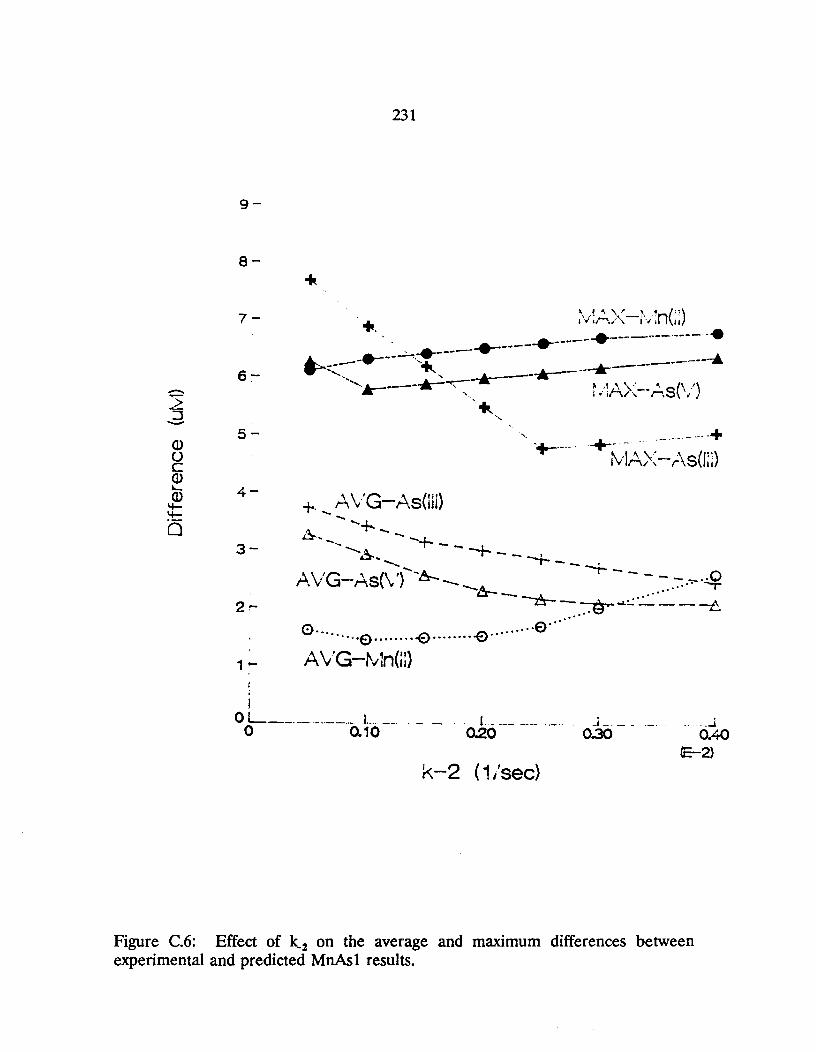
-~ -Q) () c Q) to.... Q) "f"f-a
231
9-
8-
7-
6-
5- ' .. +-_._-+----- .-.--- ----+ !'v'IAX - r\S(J:n
4-+- A \/G-As(lll) ..... -
3-
..... -f.. _ &-. -... --. -+ - - -L. _
-..~ .- - , ... ~ -"";-'- ... ~
.\ \ /G- 'S(\')-'A- -....;-. - - - - - .,.. .. 0 ,....y M -_~ ...... -r L:r- - --..L. • ••• -.
c::s- - .~ .... :.. - - --e. 0 ......... €) •.•..... -e ........ -E> .•••..•.. 9······
1- A 'v' G-~".1nW) ;
I o L _____ .. ________ . L .. __ . ____ .... l.. ____ .___ _____ -1 __ . ____ . o 0.10 Q.2O Q.3O
--. -_.J 0.40
CE-2)
k-2 (1/sec)
Figure C.6: Effect of k_2 on the average and maximum differences between experimental and predicted MnAs 1 results.
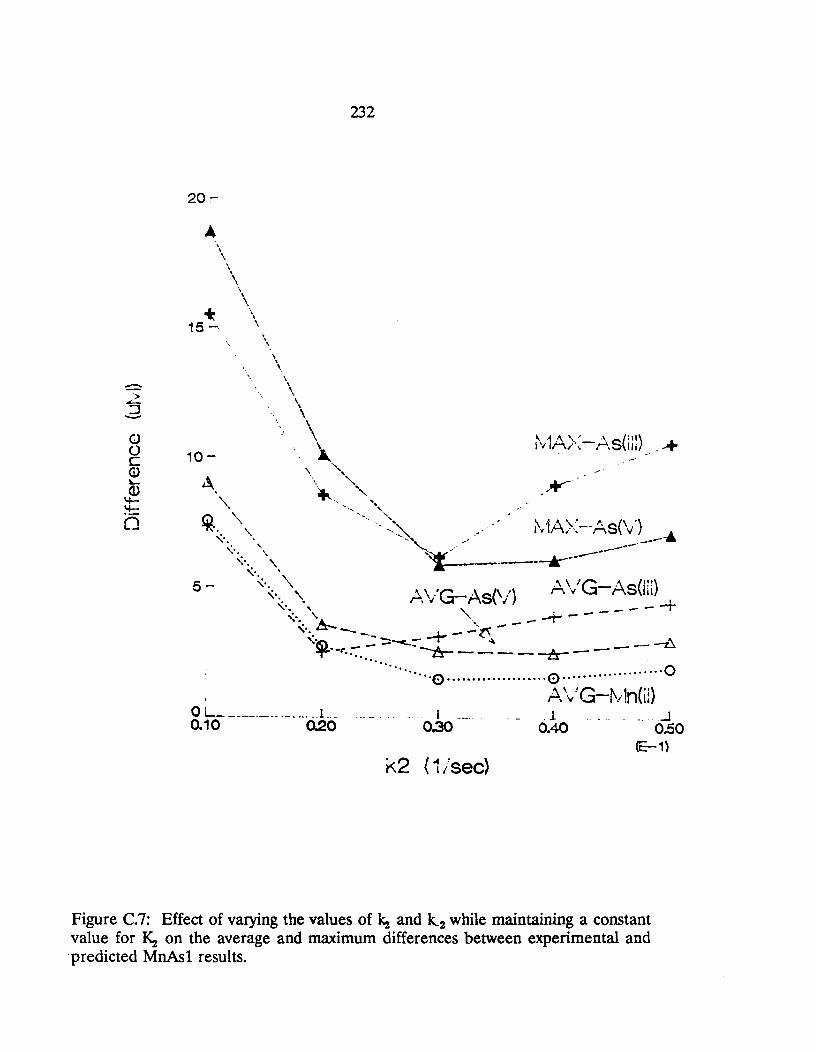
20:-
, ,
-t 15 -
10 -
5-
\
232
, \
\
\ , , , \ , , ,
\ , \
\
\
". , "'. " '..... ,
i'v1A>:-A.sWD _--+
". " A.\/G-As('l) ". " '. - - -+
A\'G-AsWD
':-. " '" ~ -+ - - - -. ~ , ----, .. ~ ---- - -- -- t:\ ':(S} - ::: ......... - -+ ~ -i::. .,..· .. r.:- ~ .. ~-___ --A..---- ------
•••• --z:::::[ '" ". 0 ······0··· .. · .... · .... ·····0···· .. ············ ..
p., \,! G-~i lnO:) o L _______ .. __ .... .1 .. _ . _ - 1 '" _1
0.40 '- ~
0.50 0.10 0.20 0.30 (E-1)
k2 (1/sec)
Figure C.7: Effect of varying the values of ~ and k.2 while maintaining a constant value for ~ on the average and maximum differences between experimental and predicted MnAs 1 results.
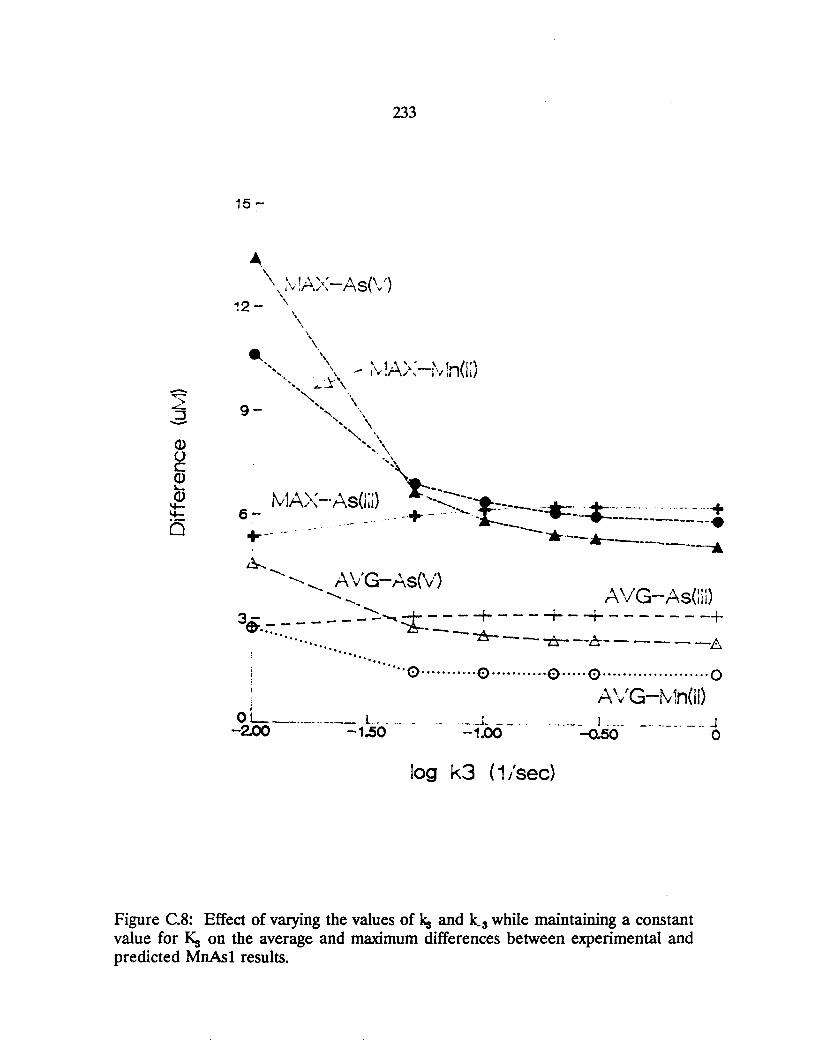
15 .....
\ \ ' 1,\" A (\ ") '\ J\~ Ir,/"\ - S v
12 - \
A....
\ \
233
-- -- A VG-As(V) ----_ AVG-As(:ll)
~-- +., 3 - __ - -'" -+ - - - - - - -r- - --r- - - - - - - --t-$-.:7. - - - "h-- - _ ...... ~---n---C:----- A
1 •••••••••• _.
'" ·'e.
···0···········0······ .. ···0·····0·· .. ·················0 ;
A '/ G--iv 1n(1/) OL __________ L __ _
-200 -1~O ._ .. _J ___ . _ -1.00
J - ____ _ ___________ J -o~o 0
log k3 (1 /sec)
Figure C.B: Effect of varying the values of ks and k.3 while maintaining a constant value for Ks on the average and maximum differences between experimental and predicted MnAsl results.
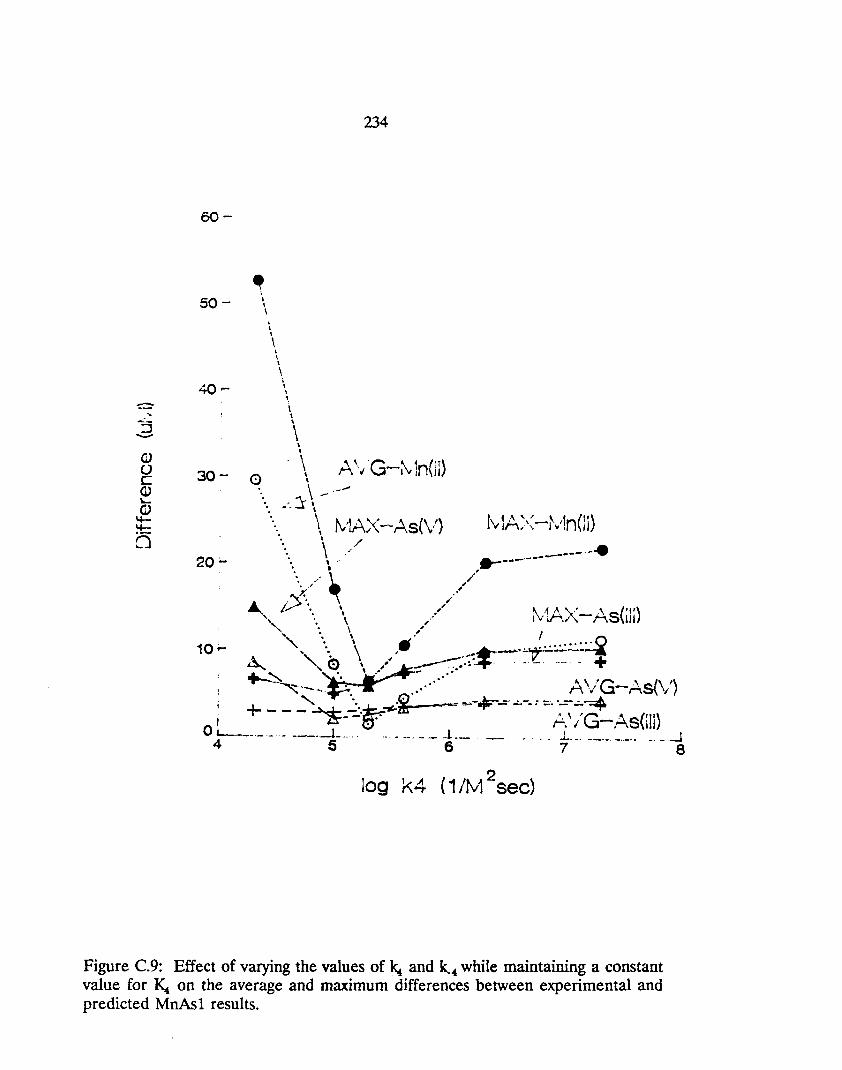
60-
50-
30-
20 ;..
~ \ ,
o
\ \
· • • \ \ \ • \
234
.. \ \, \ \
\ \
, \ • ,
\ \ 'G ,,4 (") r\ "-I -'V In il
\ -.-_' . .'1 \
\ tv1AX - As{V) Iv 1A~< -~ . .'ln(lj) I /
\ " ------.. , ,,' .-------'. ,.~ //
"' i:f"~ '. , .. ,/ ~ '1 " X' - ., S('''} " '. \ , IV.r'V M 111
" '. \,' I
10 ~ '''-_.... \ ,.' --"'---·!.r:,:,:,:,:,:~ A... " (:) '../ -----;-:.!.,+, ,- - --, - + +--.."- ~ \../~ .'
! ~ -- -'=F--~,"""'--- . ....... A \t" G--As(V} ! + - - ~-~.~ ... ~ -- --eF--=-.:--.: ::·;;7<i-.AS(ilj)
o }------ ' .. ---i- --. .. . -- --- ,- -~ -- ' - ' -, -. * ... ---. -.. -- --i 2
log k4 (1 1tv-1 sec)
Figure C.9: Effect of varying the values of ~ and k_. while maintaining a constant value for K. on the average and maximum differences between experimental and predicted MnAs 1 results.
235
effects on the model fit as did the corrresponding adsorption-desorption rate
constants in the MnAs experiments (see Figures C.2-C.4) and optimal values of kl
and kl were chosen on that basis (Table 5.7).
The influence of the equilibrium constant Ka was examined by holding k..z
constant and varying k2 several orders of magnitude. Figure C.10 illustrates that the
model fit is independent of the value of k_2 unless it is near to that of ~ (Le., unless
k_2 is greater than 0.1 • k..z). The maximum difference of Se(IV) was not affected
within the range of variation of log K2. At values of log K2 greater than 1, there was
little change in the average differences of Se(IV) and Se(VI) and the maximum
difference of Se(VI). However, at values of log Ka less than 1, the average and
maximum differences of Se(VI) decreased while the average difference of Se(IV)
increased. Therefore the best value of log Ka was chosen to be 1.
The effect of the rate constant ~ under the condition of constant Ka is
examined in Figure C.11. This rate constant clearly influences the success of the
model. The minimum of each difference occurs for the value of ~ is 1.3 x l(j6sec-l.
Figures C.12-C.14 all indicate that the rate constants kg, ka. k,., and k. have
little or no effect on the fit of the model to the Se(IV) and Se(VI) experimental data.
These figures support the conclusion that the rate determining step of the reaction
process is the electron transfer step. The lack of a unique rate constant for these
reaction steps that follow the rate determining step indicates that they can only be
described as an equilibrium process.
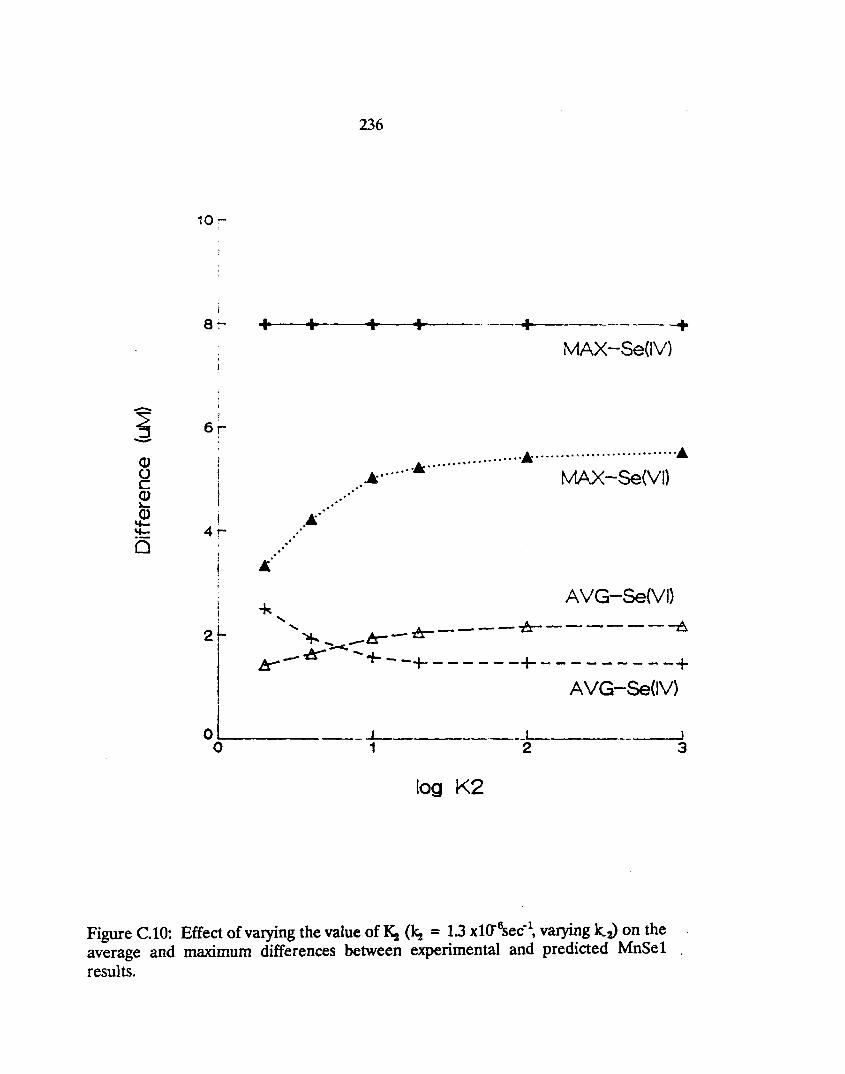
10 :-,
8:-
! 6r
i 4r
236
+ + + + + -----.-- -+ MAX-Se(IV)
............................... ................................. MAX-Se(VI}
.. ' .. If. ....
~.,
-for. AVG-Se(VI}
" " ~----~------~ ~ '"':-<._A- -b:"" - K - + - -+ - - - - - -+ - - - - _ - _ - _ +
AVG-SeOv)
0 ___ 1 __ _-1.-__ _ __L-__ _ o 1 2
log K2
Figure C.lO: Effect of varying the value of ~ (~ = 1.3 xl(T6sec-l, varying k.J on the average and maximum differences between experimental and predicted MnSe 1 results.
3
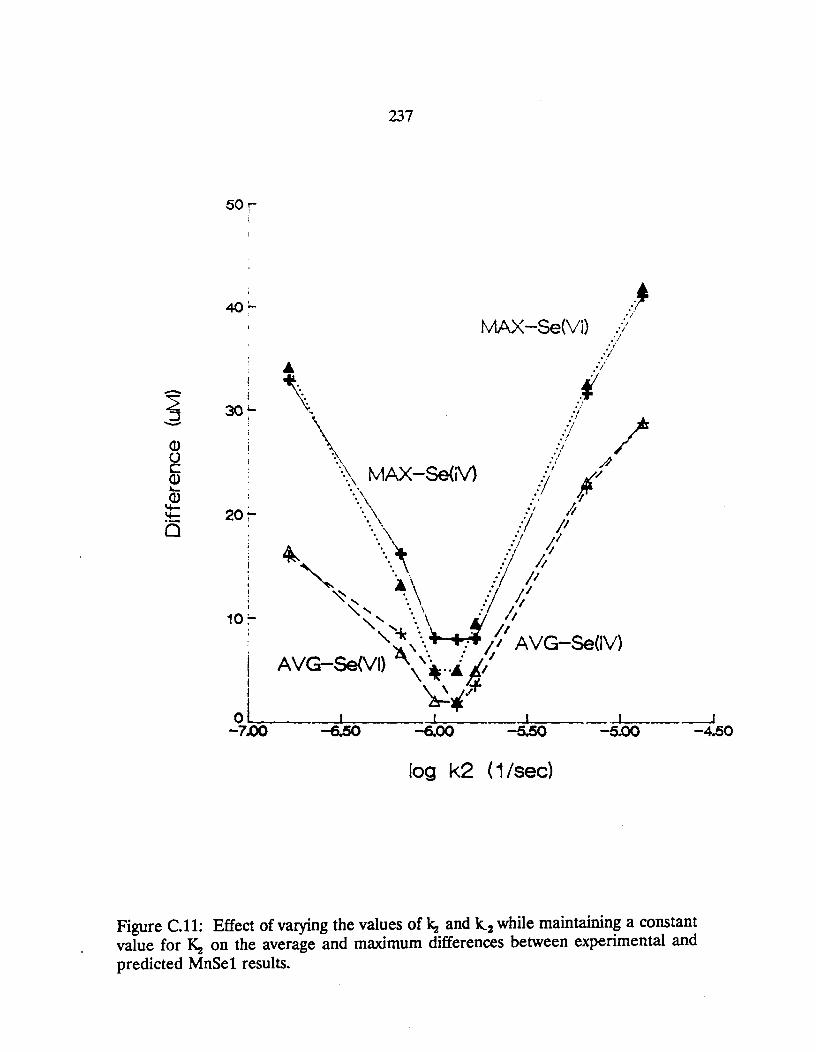
50r
I
30~
20~
10~ ,
237
:1 MAX -Se(Vl} .l
A
.' • i ., :/
i \~ :/'
\ ... ll / ,.>\ MAX-Se(jV) ,:/'1 JC:'
"\ " !fA .... \ :/ p
.... . .. \ /I / "... ..... \ ':1 /; ~ 'A\ :/ /1
~" "\J': // "-" '. \ : II , " ... \ . I' , '-k '. . II "~ , ~" .... It' A VG-Se(IV)
! AVG-Se(V1) \ ~"A il , ~ .. /'.f
ol~ ____ ~~J~ _______ ~I __ __
-7 J:X) -6.50 -6.00 ~_---l
-5.00 -4.50 -5.50
log k2 (1/sec)
Figure C.II: Effect of varying the values of k:z and k.2 while maintaining a constant value for ~ on the average and maximum differences between experimental and predicted MnSe I results.
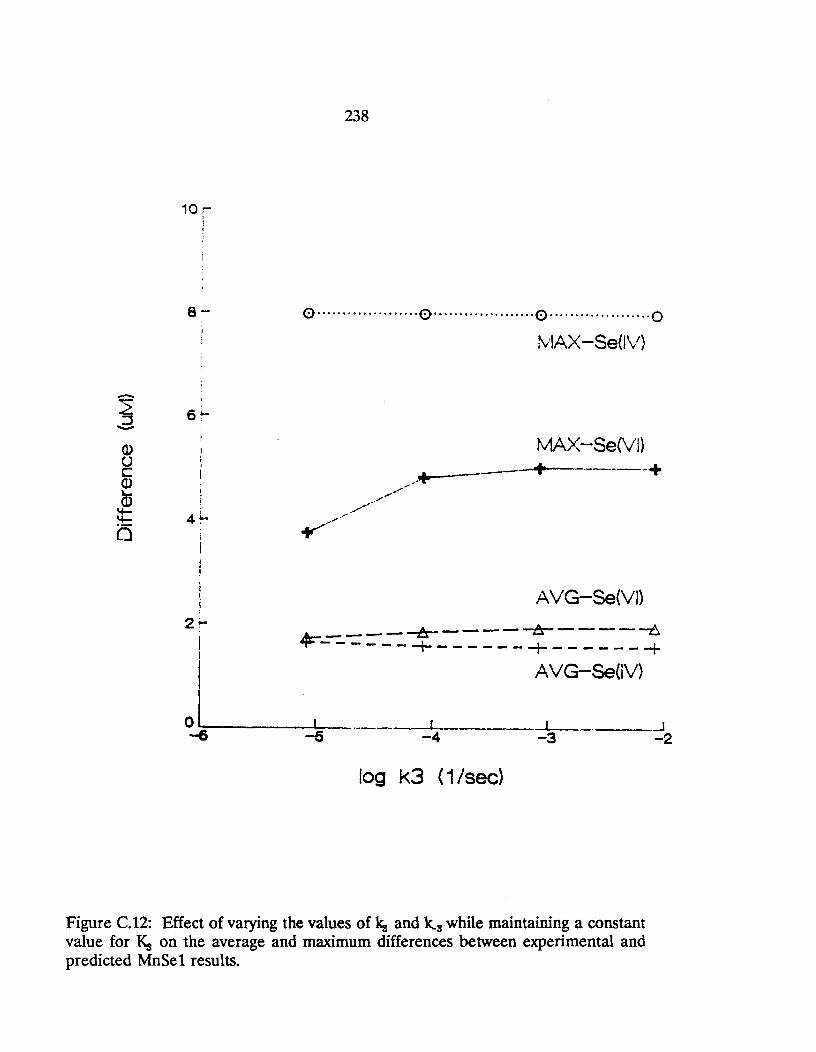
10 r i ,
8-
238
0··· .. ·· .. ··· .. ·· .... 0 ...... · .. ·· .. · .... ··0 .. ·········· .. ··· .. ·0
tv!AX -SeOV)
MAX-Se(VI} + ----+
AVG-Se(VI)
~----~----~----~ - - - - - - + - - - -- - + - - - - - --+ AVG-Se{iV)
-4 -3 ---~2
log k3 (1 /sec)
Figure C.12: Effect of varying the values of ks and k..3 while maintaining a constant value for Ks on the average and maximum differences between experimental and predicted MnSe 1 results.
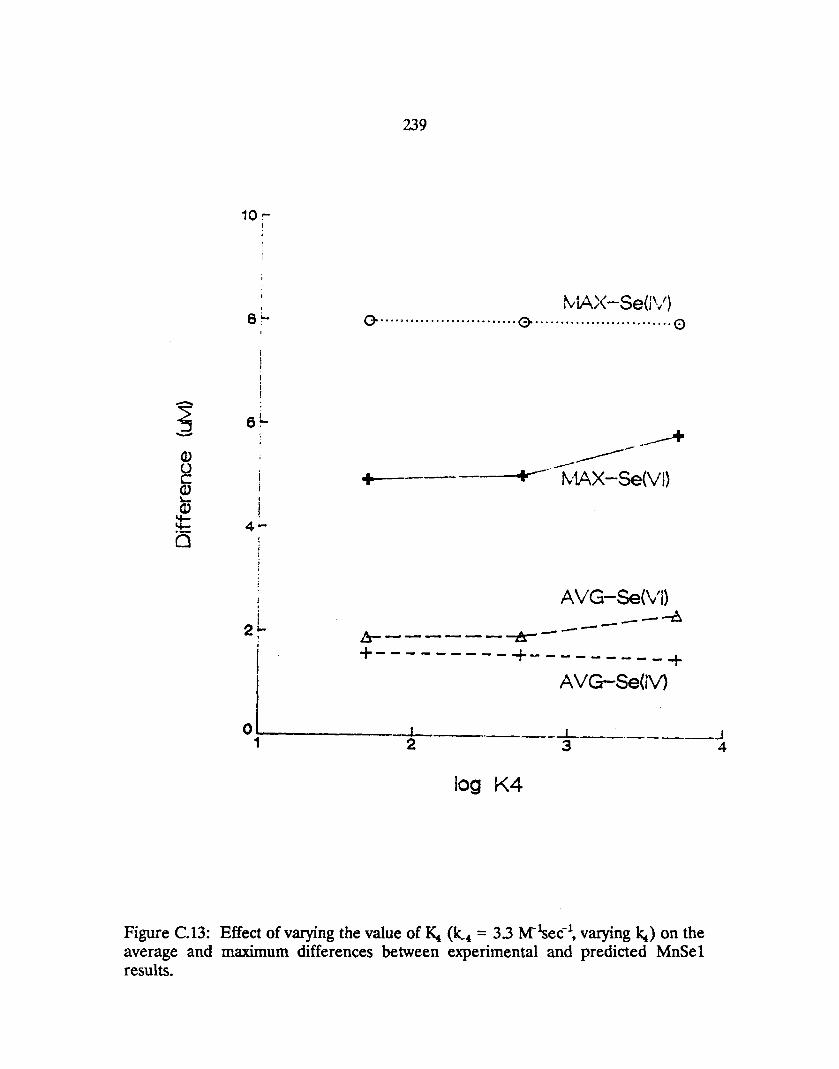
239
10 :-
, ~1A)( -SeOV} 8'- ()···························G····· .. ·· ...... ···· .... ····0
+
---+ -----.. ---- ..... .- t'v1AX-Se(Vl)
AVG-Se(VI} --~ --I!r--------tr---
i +---------+---------+
o 1~1-----_t_ . ___ :v_G-__ s_~~ __ {
log K4
Figure C.13: Effect of varying the value of K. (k.. = 3.3 M-;;ec-\ varying k.) on the average and maximum differences between experimental and predicted MnSe 1 results.
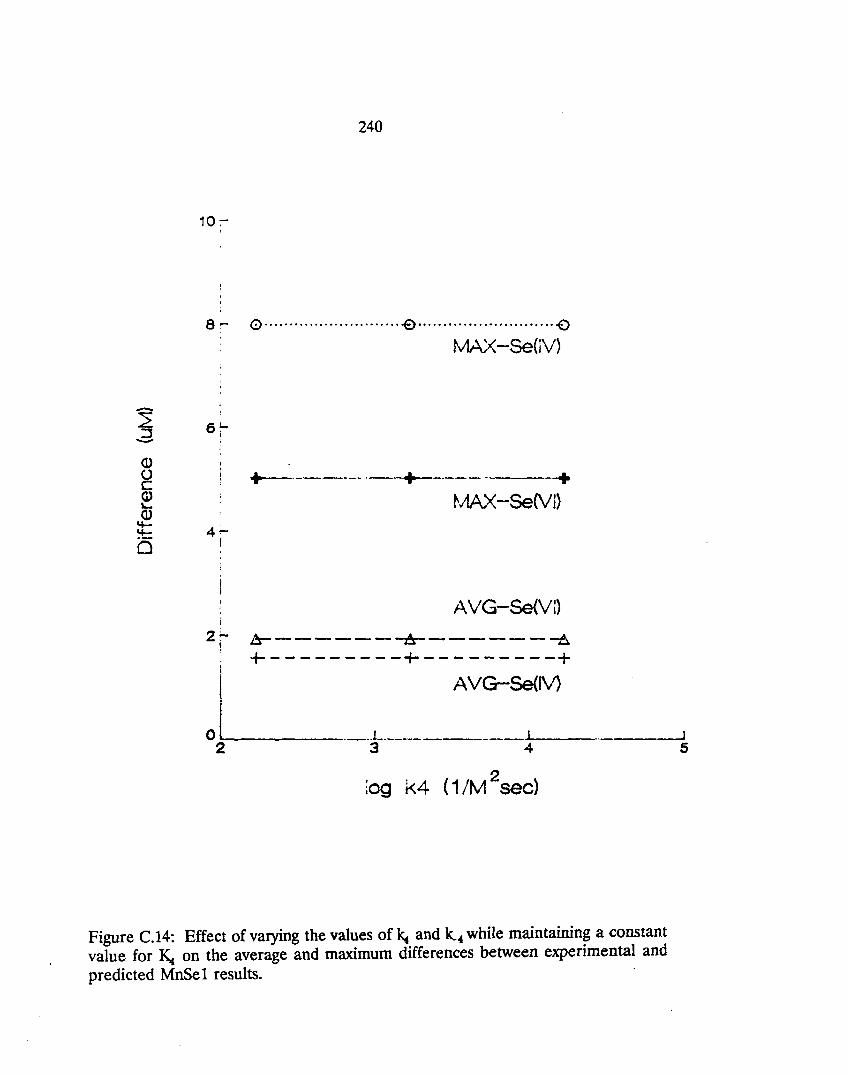
240
10 :-,
8 ~ 0···························-€)··············· .. ····· .. ···-o MAX-Se{lV)
(l) g + ------~ ---+------ - ---+ ~ ~MX -Se(VI) ~ 4 .... (:) I
AVG-Se(Vl) 2 ....
! ~------~------~ ; +---------+---------+ I oL AVG-Se(M
2 ---k------------- 4 ...... 1 ---
. __ --.-.J
Figure C.14: Effect of varying the values of ~ and k.. while maintaining a constant value for K.t on the average and maximum differences between experimental and predicted MnSe 1 results.
5
241
In conclusion, the kinetic modeling of the selenite-birnessite system under the
conditions that were studied appears to be strongly dependent upon the rate
constants kl' kl' and~. The results are only weakly dependent upon the rate
constant k_2> and moderately dependent upon the equilibrium constants K, and K..
