ks verma solan, india - energieautark · agri-silvi-horticulture and agri-horti-silviculture system...
TRANSCRIPT


Introduction� Short Rotation Forest trees in Mountain
agricultural landscapes are major potential sinksand absorb large quantities of carbon ifjudiciously managed together with crops and/oranimals.
� By promoting agroforestry systems with highercarbon contents than the existing plantcommunity, net gains in carbon stocks can berealised.
� The most significant increase in carbon storagecan be achieved by moving from lower biomasslanduse systems to agroforestry systems.
� The potential of agroforestry has not beenadequately exploited as an effective carbon sink.

� Carbon sequestered through agroforestry plantations onfarmers’ own lands is one of the non-monetary output andcan earn financial returns to the farmers in the form ofcarbon credits under CDM.
� Carbon sequestered by agroforestry land use in its multipleplant species and soil is a function of structuralcomposition of the system and management practicesimposed by the farmers to harvest the needed output.
� The current study is an attempt to assess the structuralcomposition and biomass dynamics as total biomassproduced, labile biomass which is harvested to fulfill thefarmers’ needs and net biomass retained in the system,annually.

Expanding Agriculture – Forest Interface – SRF a solution in Indian Himalayas ?

OBJECTIVES
1. Determine net biomass carbon uptake andemissions from agroforestry land use systemsmanaged by the farmers.
2. Establish climate change mitigation and carboncredit production potential of different land usesystems in vogue on farmers’ private lands.
3. Develop green house gas - carbon inventory for thearea of study.

Locality factors of the Kwalkhad watershed the study site in mid himlayanregion of H.P India
Area 1646.00 ha
Latitude 30045’00” to 30054’45” N
Longitude 77003’15” to 77013’35” E
Altitude 900 to 2100 m asl
Climate type Sub-humid sub-tropical
MAT 19.800C
MAP 1150 mm
Soil type Alfisols, mollisols, inceptisols and entisols
Texture loam
Parent material Ferromegnesium shales and dolomitic limestones
Soil pH 5. to 7.2

Structural components and biomass assesment approach
A. Structural Componentsi) Annual crops: Cereals, pulses,
vegetablesii) Perennials/ woody species
- Fodder tree species- Timber tree species- Fruit tree species
iii) Grasses
A B CTotal biomass accumulated (tonnes ha-1)OR
= total carbon uptake/ removal
Biomass of perennials + annuals during the year of measurement.
Removed/ harvested biomass due to farming practices followed (tonnes ha-1)OR= Carbon emitted
Above ground from annuals + foliage + branch wood for fuel + Fruits, etc.
Retained biomass (tonnes ha-1)OR= Carbon mitigated
(A-B)

Agroforestry in a small village of Kwalkhad watershed, mid hiils of Himachal Pradesh, India
Land use system Systems Units (Nos.)
Land area(ha)
Range MeanAgri-silvi-horticulture (ASH) 23 0.08-2.00 0.69
Agri-horti-silviculture (AHS) 12 0.12-1.60 0.79
Agri-silviculture (AS) 05 0.36-0.72 0.49
Agri-horticultutre (AH) 05 0.04-0.80 0.33
Silvi-pasture (SP) 16 0.08-5.60 1.74
Pure agriculture (PA) 04 0.19-0.77 0.46
Pure grassland (PG) 11 0.08-1.60 0.45
Abandoned land (AL) 03 2.40-1.04 1.45
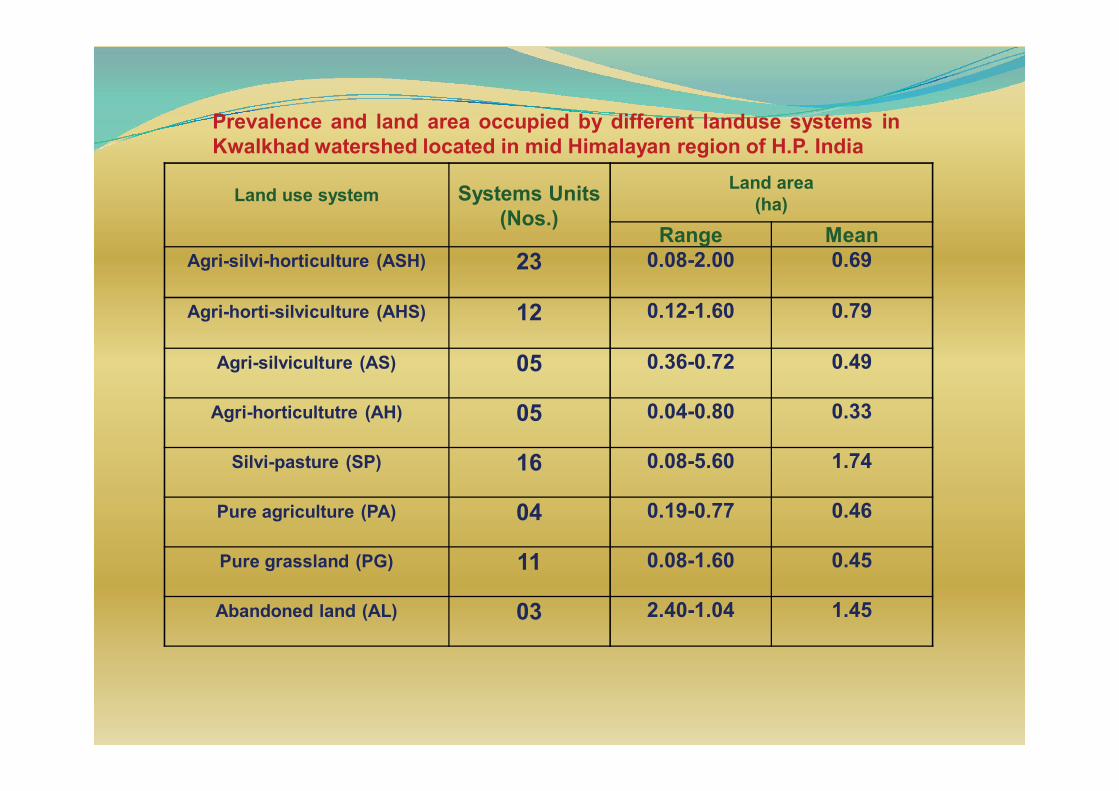
Prevalence and land area occupied by different landuse systems inKwalkhad watershed located in mid Himalayan region of H.P. India

Farmers’ preference for Agroforestry systems
*On the basis of number of system units of a particular systempresent agri-silvi-horticulture followed by silvi-pasture were themost preferred whereas pure agriculture and abandoned landswere least in practice.
ASH (23) > SP (16) > AHS (12) > PG (11)> AH = AS > PA> AL
*On the basis of average land area (ha) occupied per systemunit silvi-pasture system had the highest land area occupiedwhereas the agri-horticulture the minimum.
SP (1.74) > AL (1.45) > AHS (0.79) > ASH (0.69)> AS (0.49) > PA (0.46) > PG (0.45) > AH (0.33)

Preferred tree species and their density (per ha.) in different Agroforestry Systems of Kwalkhad watershed of H.P. India
S.No
AgroforestrySystem
Forestry spp. (Nos.) TotalNo.
Fruit spp.(Nos.)
TotalNo.
G. Total
1. Agri-silvi-horticulture
Acacia catechu (3), Dalbergia sissoo(3), Celtis australis(19), Ficus spp.(9), Grewiaoptiva(17), Q. leucotrichophora(4), Toona ciliata (9)
64 Prunusarmeniaca (10), Punicagranatum(22)
32 96
2. Agri-horti-silviculture
A. chinensis(1), C. australis (16), G.Optiva (9), T. Ciliata(6)
32 P. armeniaca(4), Citrus spp.(5), Pyrus communis(25), Purnussiliciana (6), Punicagranatum(38)
78 110

Preferred tree species and their density (per ha.) in different Agroforestry Systems of Kwalkhad watershed of
H.P. India contd…..
S.No
AgroforestrySystem
Forestry spp. (Nos.) TotalNo.
Fruit spp.(Nos.)
TotalNo.
G. Total
3. Agri-silviculture C. australis(8), Ficusspp.(9), G. optiva(13), Melia azedarach(2), Pyruspashia(2), T. ciliata(2), Ulmus villosa(2)
38 - - 38
4. Agri-horticulture - - Emblicaofficinalis(24),Citrus spp.(24), P. armeniaca(15), P. saliciana(3), Pinicagranatum(3)
69 69
5. Silvi-pasture A. catechu (29), C. australis(1), Pinusroxburghii (49), Pyruspashia(3), Q. leucotrichophora(8),
90 - - 90

Mean accumulated, removed and retainedbiomass (tonnes ha-1) by different land use systems
in Kwalkhad watershed of H.P, India.
Land use system Accumulated Removed Retained
Agri-silvi-horticulture (ASH) 32.85 19.82 13.03Agri-horti-silviculture(AHS) 32.01 20.29 11.81Agri-silviculture (AS) 23.65 15.19 8.46Agri-horticulture (AH) 26.99 20.32 6.67Silvi-pasture (SP) 7.48 4.17 3.31Pure agriculture (PA) 18.31 13.58 4.74Pure grassland (PG) 2.74 2.26 0.48Abandoned land (AL) 3.57 0.00 3.57
F value 27.94 23.50 17.05

Biomass accumulation removal and retention pattern of agroforestry systems revealed the following :-
� Agri-silvi-horticulture and agri-horti-silviculture systemaccumulated the maximum biomass but these systemswere also contributing towards maximum removal of thebiomass to meet the different needs of farmers.
� The above two systems were followed by agri-silviculture and agri-horticulture system.

Different forms of natural Agroforestry Systems
Agri-horticulture system Agri-silviculture
Silvi-pasture SystemAbandoned Lands

020406080100120
ASH(23)
AHS(12)
AS(5)
AH(5)
SP(16)
PA(4)
PG(11)
AL(3)
Land use system (system units)
Coeff
icien
t of v
ariat
ion (%
)
Crop Tree Total
020
4060
80100
ASH(23)
AHS(12)
AS(5)
AH(5)
SP(16)
PA(4)
PG(11)
AL(3)
Land use system (system units)
Coeff
icien
t of v
ariat
ion (%
)Crop Tree Total
Variability in crop, tree and their total biomass levels of different land use systems
Retained biomass
Accumulated biomass

Current biomass carbon (Mg ha-1) sequestration, emission and mitigation by different land use systems in Kwalkhad watershed of H.P, India.
Land use systemsCarbon
(Mg ha-1)Sequestered Emitted Mitigated
Agri-silvi-horticulture (ASH) 14.78 8.92 5.86
Agri-horti-silviculture (AHS) 14.45 9.13 5.32
Agri-silviculture(AS) 10.64 6.84 3.81
Agri-horticulture (AH) 12.15 9.14 3.01
Silvi-pasture (SP) 3.36 1.88 1.49Pure agriculture (PA) 8.24 6.11 2.13
Pure grassland (PG) 1.23 1.02 0.21
Abandoned land (AL) 1.60 0.00 1.60
F value 27.94 23.50 17.05

� Sequestered carbon:ASH>AHS>AH>AS>PA>SP>AL>PG
� Emitted carbon:AH=AHS>ASH>AS>PA>SP>PG>AL
� Mitigated carbon:ASH>AHS>AS>AH>PA>AL>SP>PG
On the basis of mean sequestered, emitted and mitigatedcarbon (Mg ha-1) different landuse systems were placed inthe following order :-

Carbon pool inventory of different land use systems upto 0-20 cm or 0-40 cm soil layers in Kwalkhad watershed of H.P, India.
Land use systemCarbon (Mg ha-1)
0-20 cm 0-40 cmPlant Soil Total Plant Soil Total
Agri-silvi-horticulture (ASH)
5.86 52.14 58.00 5.86 95.46 101.32
Agri-horti-silviculture (AHS) 5.32 46.56 51.88 5.32 84.14 89.46
Agri-silviculture(AS) 3.81 50.58 54.29 3.81 92.65 96.36
Agri-horticulture(AH) 3.01 47.73 50.74 3.01 90.07 93.08
Silvi-pasture (SP) 1.49 63.54 65.03 1.49 115.45 116.94
Pure agriculture(PA) 2.13 35.93 38.06 2.13 65.43 67.56
Pure grassland (PG) 0.21 51.67 51.88 0.21 80.15 80.36
Abandoned land (AL) 1.60 86.73 88.33 1.60 164.41 166.01
Highest carbon pool was in abandoned land followed by silvi-pasture, agri-silvi-horticulture and agri-silviculture lad use systems.

Relative carbon mitigation potential of different landuse systems with respect to Pure agriculture in Kwalkhad watershed of H.P, India.
Land use systemCarbon Mitigation Potential
Upto 20 cm soil layer Upto 40 cm soil layer
Agri-silvi-horticulture (ASH) 1.52 (+ 0.52) 1.50 (+ 0.50)Agri-horti-silviculture(AHS) 1.36 (+ 0.36) 1.32 (+ 0.32)Agri-silviculture(AS) 1.43 (+ 0.43) 1.43 (+ 0.43)Agri-horticulture (AH) 1.33 (+ 0.33) 1. 38 (+ 0.38)Silvi-pasture (SP) 1.71 (+0.71) 1.73 (+ 0.73)Pure agriculture (PA) 1.00 (+ 0.00) 1.00 (+ 0.00)Pure grassland (PG) 1.36 (+0.36) 1.19 (+ 0.19)
Abandoned land (AL) 2.32 (+ 1.32) 2.46 (+ 1.46)

Carbon credit production potential of different agroforestry systems in Kwalkhad watershed, of H.P India.
Land use systemEstimated total area
(ha)
Mitigated carbon
(Mg)
Carbon credits�Value of carbon credits*� ����
Total Ha-1
Agri-silvi-horticulture
(ASH)102.04 598.00 2192 21.49���������������
Agri-horti-silviculture
(AHS)61.11 325.10 1192 19.50���������������
Agri-silviculture
���(AS)����16.22 60.18 221 13.62���������������
�Agri-horticulture
���(AH)����10.66 32.09 �118 11.07��������������
Silvi-pasture
������(SP)������178.72 266.30 ��976 5.46��������������
Total �������������368.75 1281.67 �4699������������������������ ���
* 1 carbon credit = 1 ton CO2 ; ** 1 carbon credit = € 3.00, €***=INR 64

Carbon Mitigation and Carbon credits
• Carbon mitigation potential of abandoned land use was highest(2.46) followed by SP, ASH & AHS with respect to pureagriculture taken as 1 (one).
• Agri-silvi-horticulture (21.49 and Agri-horti-silviculture (19.50)systems yielded maximum number of carbon credits per ha ofland area.
• Silvi-pasture system produced the least (5.46) number of carboncredits per ha under current management due to less treedensity which was 90 trees ha-1.
������������������������� ���������������� ��!�"�!#�$�%��� ��!������&�'� �(#���)�����#�*'+)+,�&��������-��������!�����.����-��&���!�����/0��)��1�(!�(�%���������������&����+���#�+������2#��(��3�����%��4���#�%��3����(��(4��!����!�567���8���(��3���(����!+���
