labor intermediation services (lis) and access to new ... & technology... · labor...
TRANSCRIPT

Labor Intermediation Services (LIS) and Access to New Technologies
Diego F Angel-Urdinola
Washington DC
May, 2013

Content
1. Overview and Conceptual Framework
2. Lessons from OECD
3. LIS in developing countries
4. Country cases
2

What do we mean by Labor Intermediation Services (LIS)?
• LIS are activities undertaken to improve the speed and quality of the match between available jobs, jobseekers, markets, and social/training programs.
• LIS “intermediate” or “match” labor supply and demand (& labor supply and social assistance).
LIS ARE NOT “TEMP” AGENCIES !!

MILES framework, World Bank (2007, 2009)
Conceptual Framework
L.I.S.
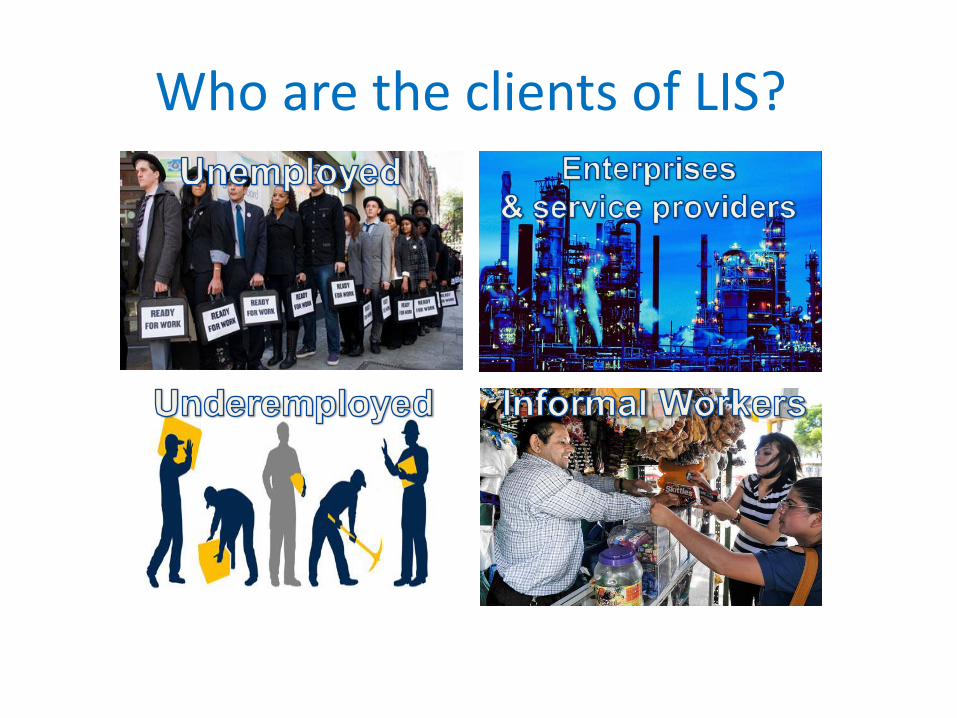
Who are the clients of LIS?

What are the benefits of LIS?
Reduce short-term unemployment
Ease labor mobility
Reduce information asymmetries
Facilitate access to markets
TO INCREASE PRODUCTIVITY

Labor Intermediation Services
SERVICE CATEGORY
TARGET CLIENTS
TYPES OF SERVICES
Job search Services
• Job seekers
• Skills testing or referrals to testing • Profiling of clients to determine services needed • Resume preparation • Job counseling • Phone banks for job search • Job search assistance • Job clubs • Case management
Job Placement & Brokerage
• Employers • Seekers
• National database of job vacancies • Job placement (domestically or abroad) • Vacancy in/take (firms) • Candidate screening (for firms) • Outplacement • Recruitment for select positions (firms)
Job readiness training
• Job seekers • Training providers • Employers
• Assessments of training reeds/requirements • Referral to private and public training providers • Training directly by LIS (limited)
CORE SERVICES

Labor Intermediation Services
SERVICE CATEGORY
TARGET CLIENTS
TYPES OF SERVICES
Specialized services to employers
• Employers
• Human resources assessments • Legal advice on employment • Screening and testing of job applicants • Private sector promoters/liaisons • Staff training guidance
Labor Market Information
• Government • job seekers • Employers • Informal workers • Training institutions
• Provide data and analysis on labor market trends
• Provide information about free-lancing opportunities
• Provide information about market prices
Referrals to other social services
• Job seekers • Workers
• Administration of UI benefits or referral to UI
• Referral or coordination with social services • Referral to self-employment programs • Referral to training services
ADDITIONAL SERVICES

Institutional Arrangements for the Provision of LIS
Public Monopoly
National PEA with private competition
Public-Private Partnerships
Autonomous service with
tri-partite actors
Competition-based network
with public funds
• Tunisia (2013)
• Costa Rica (2003)
• Portugal (1989)
• Syria (2010)
• Finland (1994)
• Austria (1004)
• Egypt
• Panama
• Colombia
• France
• Brazil
• Many OECD
• Colombia
• Morocco
• Turkey
• Lebanon
• Peru
• Chile
• Germany
• Netherlands
• Half of all OECD
countries
• Australia
• UK

Expenditures on LIS
0.00
0.50
1.00
1.50
2.00
2.50
3.00
3.50
4.00
4.50
As
% o
f G
DP
Total LMPs
LIS
Source: Eurostat
Year 2010

Expenditures on LIS
Source: Eurostat
Year 2010
0.0%
5.0%
10.0%
15.0%
20.0%
25.0%
30.0% Expenditures on LIS as % of total expenditures on LMPs

Expenditures on LIS
Source: Eurostat
Year 2010
-
500
1,000
1,500
2,000
2,500
3,000
3,500
4,000
4,500
Expenditure on LIS per job-seeker in 2010 (In US$ constant PPP)

Content
1. Overview and Conceptual Framework
2. Lessons from OECD
3. LIS in developing countries
4. Country cases
13

Lessons Learned from OECD
14
Profiling
Performance Monitoring
Performance Contracts
Activation and Referrals

PROFILING
• Profiling is a system for identifying the characteristics of job seekers and tailoring available labor market programs to job seekers’ needs.
• Is necessary because resources for providing reemployment assistance to the unemployed workers are limited
• Statistical methods are generally used / preferred.
Client Description Orientation
Jobless but Job Ready Placement services only
Jobless at risk for medium term unemployment or underemployment
Placement , plus counseling, and short-term training.
Jobless with high risk for longer term unemployment of underemployment
Individualized training plans, social assistance (individualized follow-up)

16
United States Worker Profiling and Reemployment Services (WPRS)
U.S. was the first country to use targeting on a program-wide basis. Targeting models were introduced in 1994.
WPRS program now operates in all states.
Most states use statistical profiling models and logistic regressions estimation
Models cannot use recipient characteristics related to equal opportunity provisions (e.g., gender, ethnicity, race, disability status, and age).

17
Variables Used Most in Profiling Models
Montana Wisconsin Pennsylvania Hawaii
Tenure with Prior
Employer Yes Yes Yes Yes
Education Yes Yes Yes Yes
County of Residence Yes Yes Yes Yes
Industry Yes Yes Yes Yes
Occupation Yes Yes Yes
Amount of UI/social
Benefits Yes
Number of Prior
Employers Yes

18
How Does Profiling Work?
The statistical profiling mechanism places all profiled workers in an array according to their likelihood of exhausting their UI benefits
Probability of exhausting benefits falls between 0-1
States refer to service/intervention according to the score.

19
0.98 30.95 2
0.92 50.89 6
0.86 20.85 5
0.82 50.79 20.69 3
0.66 50.65 5
0.62 60.59 5
0.58 40.57 40.45 7
0.41 80.39 3
0.35 40.31 5
0.27 50.23 6
TOTAL 100
profile score
# clients
In this case, 10% of clients
have a profiling score
(probability of exhausting
benefits) of .92 or higher.
Example: Selecting top 10%

20
How Does Profiling Work?
Depending on availability of funds, state agencies refer a specified number of claimants to reemployment services each week.
Reemployment services are divided into six categories:
1. Orientation (.1-.2) 4. placement services (.5-.6]
2. Assessment (.2-.4] 5. job search workshop (.6-.7]
3. Counseling (.4-.5] 6. referral to training (.7-1]

PERFORMANCE MONITORING
21
Inputs Activities Outputs Results Long-term
objectives
Program implementation Focus on Results Results-based monitoring
•E- Platforms
•Staff
•Budget
•Training
• Intermediation
•Counseling
•Training plan completed
•Vacancy filled
•People referred
•Human capital increases
•The person finds a job
•Employment quality
• User satisfaction
•Unemployment
decreases
•Productivity
increases
•The standard of
living rises

Performance Monitoring System
• Vacancies filled with active involvement of the PEA.
• User satisfaction.
• Performance indicators 3, 6, 12 months after program completion:
– Job Placement Rate: The share of beneficiaries who complete training in quarter t who are employed in quarter t+1.
– Job Retention Rate: The share of beneficiaries who complete training in quarter t who are employed in both quarter t+2 and t+3.
– Average Earnings: Average earnings in quarters t+2 and t+3 for those employed in quarter t and who retained employment in these quarters.
– Adequacy Rate: The share of individuals who complete training in quarter t who are employed in quarter t+1 in an occupation compatible with the training provided.
– Underemployment Rate: The share of individuals who complete training in quarter t who are employed in quarter t+1 in a work that requires a lower education profile.
22
Data Collection is Fundamental

Performance Monitoring System
• Components necessary to develop a PMS:
Data on Earnings
(SSI)
Data on Services
(Service Providers)
Data on Outcomes
(Administrative data and survey)
• Generally collected for tax
purposes. Data generally
collected quarterly by a public
entity from firms. All firms are
obliged to report.
• Data on training
services. Collected at
registration and by
training service
providers during
training. Data
describes the
beneficiary, the training
program , and
placement outcome.
• Survey of post-training
outcomes used to measure
the performance of service
providers as well as to
evaluate the impact of the
training programs. Surveys
may include the entire
universe of trainees or a
representative sample.

Country Case-Studies (Performance Indicators Collected)
USA Workforce Reinvestment Act • For Adults
– Placement rates – Retention rates – Earnings
• For Youth – Insertion rates – Share of beneficiaties who go back to
school – Share who obtained a diploma – Evolution in cognitive skills
Turkey ISKUR • Beneficiaries
– Placement rates – Retention rates – Average earnings – Share of vacancies filled (out of existing
vacancies)
• Programs and Providers – Program entry – Program exit – Placement rates – Budget allocation vs. actual expenditures – Per-capita training cost – Insertion costs – Average earnings

Performance Contracts
• Contract design with LIS providers can include payments by objectives (i.e. X% job insertion rate).
• Many countries have successfully introduced contracting systems where payments to private providers of LIS are dependent on insertion, placement duration, and relevance.

Country-cases
• Germany: placement vouchers entitle job seeker to use a private agency. If the voucher leads to employment, the agency receives a pre-determined percentage of the payment at insertion and the remaining percentage six months after placement (Schneider 2008).
• UK (Jobs Centre Plus): provides payments to contractors depending on : (i) job outcome (off-flow from unemployment assistance into employment) and (ii) sustainability of jobs (customer still being employed after 13/26 weeks).
• Australia: Service providers are offered incentives through payment for placing jobseekers in work. Payments for the more difficult to place are higher than those for short-term unemployed clients.

Content
1. Overview and Conceptual Framework
2. Lessons from OECD
3. LIS in developing countries
4. Country Cases
27

Developing countries have different contexts
• Regulation bottlenecks still exist
• Public Employment Agencies have limited financing and institutional capacity
• Information about LMs is scarce
• Coordination with the private sector is limited
• Informal employment is prevalent
• Migration is frequent
Number of
registered job seekers, 1000’
Total number of PEA staff
Number of PEA staff in contact with jobseekers and employers
Staff caseload***
Ratio of front-line counselors
to Total PEA staff (%)
Egypt 895.1 1600 1550 577 97
Jordan 28.0 133 63 444 47
Lebanon 12.2* 32 10 1222 31
Morocco 517.0 547 343 1507 63
Syria 1703.8** 397 120 14199 30
Tunisia 280 1200 850 329 71

Policy Orientations for Developing Countries
Promote Results Based PPPs
• Liberalize and ease regulation bottlenecks for the provision of private intermediation services (e.g. Tunisia)
• Sub-contract with private providers using performance based contracts (based on placement rates) for provision of training and intermediation services
• Use ICTs / vouchers to foster intermediation.
Develop Profiling and P.M. systems
• Develop profiling systems (easy to do an inexpensive)
• Adopt PMS systems to monitor performance
• Develop periodic socials audits and user satisfaction surveys;
• Consider giving performance based bonuses to staff
Promote system integration
• Promote one-stops shops for social services, unified registry, program consolidation
• Use LIS as strategies for referring beneficiaries to other training and social programs to
Provide services to informal / migrant
workers
• Provide information about job opportunities for informal workers
• Provide information about markers
• Consider developing programs for migrants (particularly relevant in MENA and LAC)

Content
1. Overview and Conceptual Framework
2. Lessons from OECD
3. LIS in developing countries
4. Case studies
30

SAMASOURCE (INDIA, KENYA) • Samasource’s proprietary technology platform, the SamaHub, breaks
down digital work from large companies into small tasks, or microwork, that can be completed by women and youth with basic English skills and a few weeks of training at our partner centers
• Samasource works with in-country partners to recruit women and youth formerly earning below a local living wage, as determined by the Fair Wage Guide. These recruits receive 2-4 weeks of computer-based training on the SamaHub, including English and soft skills.
• Workers stay in our program for an average of 8-12 months, after which they move on to more advanced employment within their ICT center, another employer, or return to school.
To date, Samasource has connected over
3,000 people to $2 million in living wages
across 9 countries
88% beneficiaries report the ability to find a better
90% report same or better happiness

BABAJOB (INDIA)
• Babajob.com is a web and mobile start-up dedicated to bringing better job opportunities to the workers in the informal sector (cooks, maids, security guards, office helpers, etc.) by appropriately connecting the right employers and job seekers via the web, mobile apps, SMS, the mobile web and voice services.
• 1+ million open positions listed from 70,000 registered employers, including many of the largest low-end employers such as Coffee Day, Yum Brands (Pizza Hut, KFC), Dustbusters (25,000 housekeeping staff).
• 500,000+ job seekers registered to date: 60,000 active / 30,000 new job seekers in Sept 2012.
Hired job seekers earn on average
20.1% more + reduce their commute
times by 14 minutes per day.
1.5 million job alert SMSs and 2.5 million
mobile and web page views per month.

Souktel (Palestinian Territories)
• Created in 2006, Souktel promotes the use of mobile phone to link people with jobs, thus reducing information asymmetries and frictional unemployment in selected communities.
• In the Palestinian Territories, Souktel is serves 10,000 job-seekers and 200 employers daily.
84% of the beneficiaries experienced a
reduction in job-search time from 12 weeks
to less than 1 week
64% report higher monthly incomes as a
result of jobs sourced through the service.
Employers who use Souktel's services
reported a 50% or greater reduction in
hiring costs and time

INFITAH (MORROCO)
• Infitah was launched in 2008 with a focus on international intermediation, seasonal labor provision, and circular migration. Program financing was $4.3 million from January 2008 to February 2010. The majority of beneficiaries were female workers who performed farm labor (such as strawberry picking) in Spain and France.
• Workers have to be between 18 and 40 years of age and in very good physical condition. They must be from rural areas and have young children (up to 14 years old) whom they must leave at home as a guarantee that they will return to Morocco after the employment period is over. Almost all (95 percent) of the women who participated in the program finished their contracts and returned.
In 2009, 85 percent of female
beneficiaries felt more self-assured after
participating in the program
70 percent reported that their income
improved

References Angel-Urdinola, D; Kuddo, A; Semlali, A. (2013) Building Effective Employment Services for
nemployed Youth in the Middle East and North Africa. Directions In Development. World Bank.
European Commission (2009). The Role of the Public Employment Services Related to ‘Flexicurity’ in the European Labour Markets. VC/2007/0927, European Community, Brussels.
Mazza (2003). Labor Intermediation Services: Considerations And Lessons For Latin America And The Caribbean From International Experience. http://idbdocs.iadb.org/wsdocs/getdocument.aspx?docnum=355081
Kuddo, A. (2009). “Employment Services and Active Labor Market Programs in Eastern European and Central Asian Countries.” Social Protection Discussion Paper 0918, World Bank, Washington, DC.
Lippoldt, D., and M. Brodsky. 2004. “Public Provision of Employment Services in Selected OECD Countries: The Job Brokerage Function.” In Labor Exchange Policy in the United States, edited by D. E. Balducchi, R. W. Eberts, and C. J. O’Leary, 211–48. Kalamazoo, MI: W. E. Upjohn Institute. Martín, I. 2010. “Labour Markets Performance

Thank YOU