lake water quality assessments - 2004 · cinder cone containing its own ... water released from...
TRANSCRIPT
NMED/SWQ-06/2
WATER QUALITY ASSESSMENTS FOR SELECTED
NEW MEXICO LAKES
2004
Danny R. Davis
Monitoring and Assessment Section Surface Water Quality Bureau
New Mexico Environment Department 1190 St. Francis Drive - P.O. Box 26110
Santa Fe, New Mexico 87502

This page left intentionally blank.

1
LAKE WATER QUALITY MONITORING, TROPHIC STATE EVALUATION, AND STANDARDS ASSESSMENT FOR:
Caballo Reservoir, Bluewater Reservoir, Zuni Salt Lake and Cone, Upper
Nutria Diversion Lake, Quemado, Ramah, and San Gregorio Lakes
Danny R. Davis
2004
EXECUTIVE SUMMARY Water quality surveys and assessments were completed in fulfillment of work-plan commitments of the FY 2004-2005 Section 106 Work Program for Water Quality Management. This program was partially funded by a grant from the U.S. Environmental Protection Agency. During 2004, the New Mexico Environment Department / Surface Water Quality Bureau (NMED/SWQB) conducted water quality and biological assessment surveys of eight lacustrine systems. Caballo Reservoir and Bluewater Reservoir are large reservoirs, which possess numerous designated uses and have New Mexico State Parks that manage recreational uses. Caballo Reservoir was studied concurrently with the Lower Rio Grande study.
Zuni Salt Lake, a volcanic collapse feature with a small cinder cone containing its own lake, is a very specialized habitat with religious and cultural significance for the Pueblo of Zuni and other native people. Though New Mexico water quality standards are not applicable to this tribal waterbody, an EPA funded 104(b)(3) grant allowed for the cooperative investigation of this closed basin lake. The ultimate goals of this study are to provide the Pueblo of Zuni with
water quality data and assessments based on New Mexico standards in order to assist and support Pueblo goals for standards development. The Upper Nutria Diversion Lake, also located on Zuni Tribal lands, was also included for study. Bluewater Reservoir, Quemado, Ramah, and San Gregorio Lakes were chosen for study due to their locations within the Rio Puerco and Bluewater Creek watersheds that were also intensively sampled during 2004. Including lakes in this way helps to ensure a timely return to the lake system as watersheds are revisited, and also add to the understanding of surface waters within the watershed under investigation. Water quality sampling methods were in accordance
Zuni Salt Lake and interior cinder cone containing inner lake

2
with the Quality Assurance Project Plan for Water Quality Management Programs (NMED/SWQB 2004a). The following assessments provide information pertaining to water quality, biological integrity, trophic state, limiting nutrients, water quality criteria exceedences, and water quality standards specific to designated, existing, or attainable uses in the State of New Mexico Standards for Interstate and Intrastate Surface Waters (NMED 2005). Water chemistry sampling at lake stations include total and dissolved nutrients, total and dissolved metals, major ions including total dissolved solids (TDS), hardness, and alkalinity, radionuclides, organic scans, cyanide, and microbiological collections. Phytoplankton and benthic diatom samples were also collected for analysis. The following assessments do not include all data results, except for those specifically related to general physical nature, trophic state, limiting nutrient, or criteria exceedences and consequent standards violations. All data are available upon request.

3
TABLE OF CONTENTS
LAKE SURVEYS
page Executive Summary 1 Davis, D.R. 2006. Water quality and biological assessment survey of 4 Caballo Reservoir, Sierra County, New Mexico, April 13, July 27, and October 19, 2004. Davis, D.R. 2006. Water quality and biological assessment survey of 8 Bluewater Reservoir, Cibola County, New Mexico, April 20, July 14, and October 5, 2004. Davis, D.R. 2006. Water quality and biological assessment survey of 14 Zuni Salt Lake and Zuni Cone Lake, Catron County, New Mexico, June 26, 2004. Davis, D.R. 2006. Water quality and biological assessment survey of 20 Upper Nutria Diversion Reservoir, McKinley County, New Mexico, October 14, 2004. Davis, D.R. 2006. Water quality and biological assessment survey of 25 Quemado Lake, Catron County, New Mexico, June 25, 2004. Davis, D.R. 2006. Water quality and biological assessment survey of 30 Ramah Lake, McKinley and Cibola County's, New Mexico, June 25, 2004. Davis, D.R. 2006. Water quality and biological assessment survey of 36 San Gregorio Lake, Sandoval County, New Mexico, June 25, 2004. References 40
4
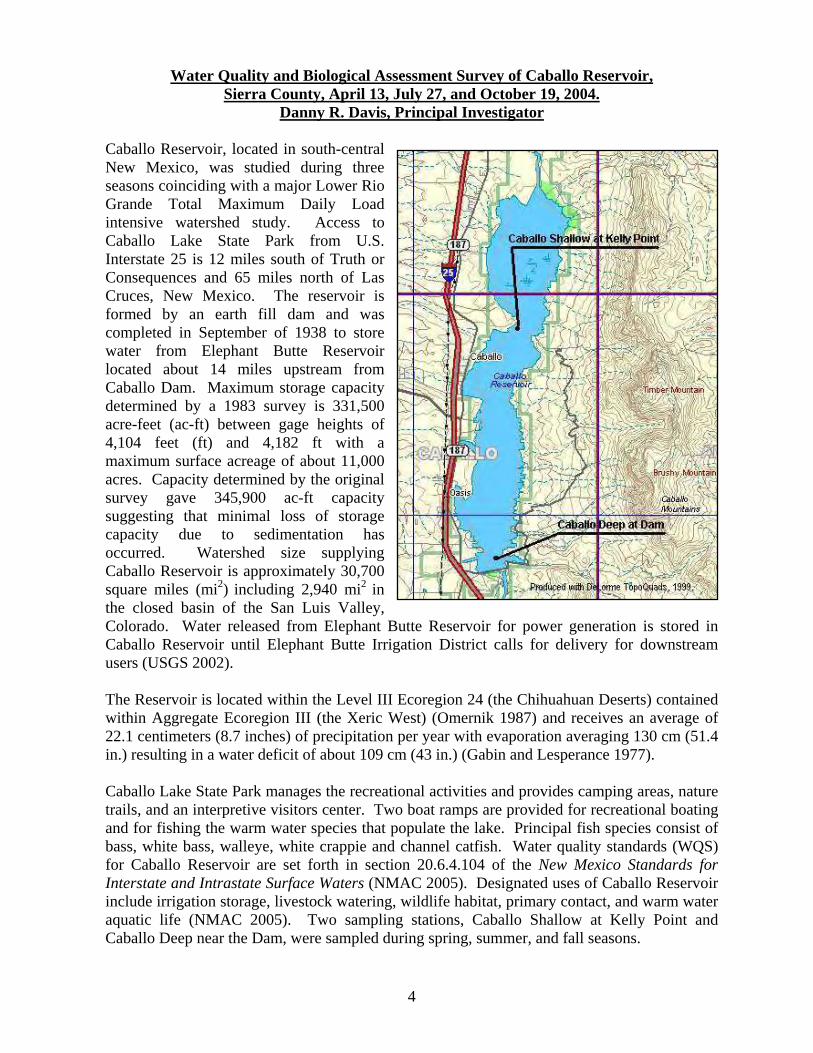
Water Quality and Biological Assessment Survey of Caballo Reservoir, Sierra County, April 13, July 27, and October 19, 2004.
Danny R. Davis, Principal Investigator
Caballo Reservoir, located in south-central New Mexico, was studied during three seasons coinciding with a major Lower Rio Grande Total Maximum Daily Load intensive watershed study. Access to Caballo Lake State Park from U.S. Interstate 25 is 12 miles south of Truth or Consequences and 65 miles north of Las Cruces, New Mexico. The reservoir is formed by an earth fill dam and was completed in September of 1938 to store water from Elephant Butte Reservoir located about 14 miles upstream from Caballo Dam. Maximum storage capacity determined by a 1983 survey is 331,500 acre-feet (ac-ft) between gage heights of 4,104 feet (ft) and 4,182 ft with a maximum surface acreage of about 11,000 acres. Capacity determined by the original survey gave 345,900 ac-ft capacity suggesting that minimal loss of storage capacity due to sedimentation has occurred. Watershed size supplying Caballo Reservoir is approximately 30,700 square miles (mi2) including 2,940 mi2 in the closed basin of the San Luis Valley, Colorado. Water released from Elephant Butte Reservoir for power generation is stored in Caballo Reservoir until Elephant Butte Irrigation District calls for delivery for downstream users (USGS 2002). The Reservoir is located within the Level III Ecoregion 24 (the Chihuahuan Deserts) contained within Aggregate Ecoregion III (the Xeric West) (Omernik 1987) and receives an average of 22.1 centimeters (8.7 inches) of precipitation per year with evaporation averaging 130 cm (51.4 in.) resulting in a water deficit of about 109 cm (43 in.) (Gabin and Lesperance 1977). Caballo Lake State Park manages the recreational activities and provides camping areas, nature trails, and an interpretive visitors center. Two boat ramps are provided for recreational boating and for fishing the warm water species that populate the lake. Principal fish species consist of bass, white bass, walleye, white crappie and channel catfish. Water quality standards (WQS) for Caballo Reservoir are set forth in section 20.6.4.104 of the New Mexico Standards for Interstate and Intrastate Surface Waters (NMAC 2005). Designated uses of Caballo Reservoir include irrigation storage, livestock watering, wildlife habitat, primary contact, and warm water aquatic life (NMAC 2005). Two sampling stations, Caballo Shallow at Kelly Point and Caballo Deep near the Dam, were sampled during spring, summer, and fall seasons.
5
Table 1. Physical Characteristics for Caballo Reservoir, 2004. Physical Characteristics Deep Station Shallow Station
Sp 0.40 Sp 0.40 Su 0.25 Su 0.25 Secchi (m)
Fall 0.20 Fall 0.20 Sp 14 Sp 14 Su 15 Su 14 Forel Ule Color
Fall 14 Fall 14 Sp 6.1 Sp 2.7 Su 7.4 Su 2.9 Maximum Depth (m)
Fall 5.7 Fall 1.3 Sp 1.4 Sp 1.4 Su 1.0 Su 1.0 Euphotic Zone (m)
Fall 0.75 Fall 0.70 Sp 3,864 Sp 3,864 Su 1,930 Su 1,930 Surface Area (Acres)
Fall 2,079 Fall 2,079 Sp 47,904 Sp 47,904 Su 15,573 Su 15,573 Storage Capacity (Ac. Ft.)
Fall 18,253 Fall 18,253
Physical Characteristics Deep Station Shallow Station Sp No Sp No Su No Su No Anoxic Hypolimnion (Y/N)
Fall No Fall No Sp No Sp No Su No Su No Stratified (Y/N) @ depth (m)
Fall No Fall No Sp 7.9 Sp 8.3 Su 8.0 Su 8.1 PH (SUs)
Fall 6.8 Fall 7.4 Sp 1008 Sp 973 Su 822 Su 810 Conductivity (μS)
Fall 905 Fall 981 Sp 30.4 Sp 30.8 Su 33.6 Su 239 Turbidity (NTUs)
Fall 84.5 Fall 459 Sp 2.0 Sp 2.0 Su 6.0 Su 2.0 Integrated Sample surface to (m)
Fall 4.0 Fall 1.0 Sp 6.13 Sp 6.68 Su 5.01 Su 7.51 Dissolved Oxygen Surface (mg/L)
Fall 6.42 Fall 6.78

6
Table 1. con’t. Sp 5.88 Sp 6.30 Su 3.82 Su 6.07 Dissolved Oxygen Bottom (mg/L)
Fall 6.11 Fall 6.74 Sp 15.3 Sp 17.5 Su 24.9 Su 23.9 Temperature Surface (°C)
Fall 15.3 Fall 6.8 Sp 13.7 Sp 16.5 Su 24.3 Su 22.6 Temperature Bottom (°C)
Fall 14.9 Fall 17.2 Sp 1.34 Sp 2.40 Su 2.06 Su 14.77 Chlorophyll a (μg/L)
Fall 4.10 Fall 34.58 MDP = missing data point; (Q) = questionable result. Table 2.
Trophic State (Carlson 1977) Deep Station Shallow StationSp HyperEutro Sp HyperEutro Su HyperEutro Su HyperEutro Secchi depth
Fall Dystrophy Fall Dystrophy Sp OligoMeso Sp OligoMeso Su OligoMeso Su Eutrophic Chlorophyll a
Fall Mesotrophic Fall Eutrophic Sp OligoMeso Sp OligoMeso Su OligoMeso Su OligoMeso Total Phosphorus
Fall Mesotrophic Fall Eutrophic
Table 3.
Nitrogen/Phosphorus Ratio Deep Station Shallow Station Sp N Sp N Su N Su N Limiting Nutrient
Fall N Fall N Table 4.
Designated or Attainable Use Criteria Exceedence Attainment Status Primary Contact None Fully Supporting Irrigation Storage None Fully Supporting
Warmwater Aquatic Life Fish Tissue Mercury Not Supporting Wildlife Habitat None Fully Supporting
Livestock Watering None Fully Supporting
Overall Trophic Condition Mesotrophic
7
Water Quality Assessment
Physical characteristics of Caballo Reservoir were measured and are listed in Table 1. Table 2 shows the trophic state variation observed both seasonally and between stations for secchi depth, chlorophyll a, and total phosphorus. The overall trophic condition of Caballo Reservoir in 2004, according to Carlson Indices (1977) and Likens (1975), is mesotrophic with nitrogen being the limiting nutrient at all stations and during all seasons (Tables 2 and 3). Phytoplankton and diatom community composition are lacking at this time and are therefore unavailable to evaluate overall trophic condition. Excessive algal or macrophyte blooms were not evident during sampling visits, however, suspended sediment especially in the upper lake at the shallow station was very high adding to the elevated turbidity readings at this station. Caballo Reservoir is a shallow waterbody subject to high winds and consequent agitation causing re-suspension of sediments. Caballo Reservoir chemistry sampling consisted of total, dissolved, and calculated nutrients, anions and cations, total and dissolved heavy metals, synthetic organics, radionuclides, and cyanide, which cover all criteria pertinent to the protection of all designated uses. These data are available upon request, though any criteria exceedences are listed in Table 4 and discussed below. Table 4 indicates that all designated uses were fully supported except for the warmwater aquatic life use specifically relating to mercury in fish tissue. Past analyses for mercury in fish tissue collected from Caballo Reservoir resulted in non-support for this designated use. Consequently, fish consumption advisories have been issued specific to this reservoir. Until sources are identified and measures taken to reduce levels in fish tissue, the use of aquatic life, specifically the fishery use, will remain unsupported. One exceedence in eight dissolved aluminum samples was confirmed during the Caballo study. The assessment protocol followed when determining use attainment states that for any one pollutant, no more than one exceedence of the criterion constitutes full support. For this reason, the one exceedence for dissolved aluminum did not result in a non-support designation.
Caballo Reservoir at Boat Ramp
8
Water Quality and Biological Assessment Survey of Bluewater Reservoir, Cibola County, April 20, July 14 and October 5, 2004.
Danny R. Davis, Principal Investigator
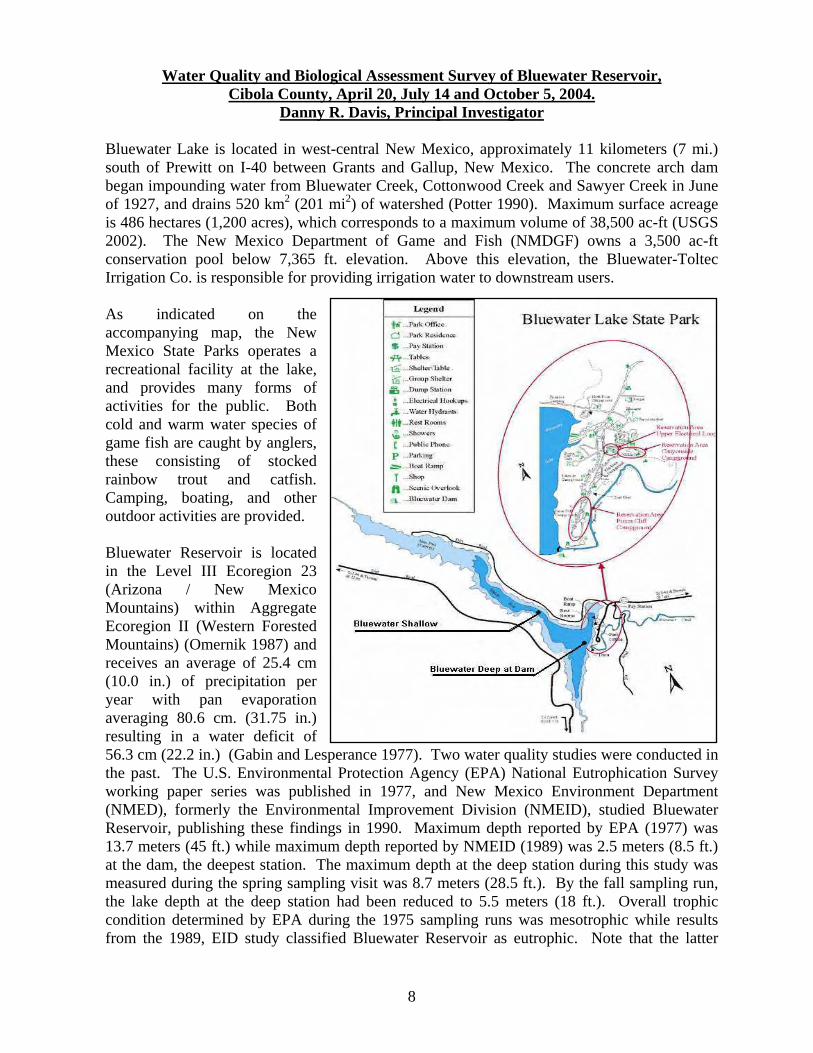
Bluewater Lake is located in west-central New Mexico, approximately 11 kilometers (7 mi.) south of Prewitt on I-40 between Grants and Gallup, New Mexico. The concrete arch dam began impounding water from Bluewater Creek, Cottonwood Creek and Sawyer Creek in June of 1927, and drains 520 km2 (201 mi2) of watershed (Potter 1990). Maximum surface acreage is 486 hectares (1,200 acres), which corresponds to a maximum volume of 38,500 ac-ft (USGS 2002). The New Mexico Department of Game and Fish (NMDGF) owns a 3,500 ac-ft conservation pool below 7,365 ft. elevation. Above this elevation, the Bluewater-Toltec Irrigation Co. is responsible for providing irrigation water to downstream users. As indicated on the accompanying map, the New Mexico State Parks operates a recreational facility at the lake, and provides many forms of activities for the public. Both cold and warm water species of game fish are caught by anglers, these consisting of stocked rainbow trout and catfish. Camping, boating, and other outdoor activities are provided. Bluewater Reservoir is located in the Level III Ecoregion 23 (Arizona / New Mexico Mountains) within Aggregate Ecoregion II (Western Forested Mountains) (Omernik 1987) and receives an average of 25.4 cm (10.0 in.) of precipitation per year with pan evaporation averaging 80.6 cm. (31.75 in.) resulting in a water deficit of 56.3 cm (22.2 in.) (Gabin and Lesperance 1977). Two water quality studies were conducted in the past. The U.S. Environmental Protection Agency (EPA) National Eutrophication Survey working paper series was published in 1977, and New Mexico Environment Department (NMED), formerly the Environmental Improvement Division (NMEID), studied Bluewater Reservoir, publishing these findings in 1990. Maximum depth reported by EPA (1977) was 13.7 meters (45 ft.) while maximum depth reported by NMEID (1989) was 2.5 meters (8.5 ft.) at the dam, the deepest station. The maximum depth at the deep station during this study was measured during the spring sampling visit was 8.7 meters (28.5 ft.). By the fall sampling run, the lake depth at the deep station had been reduced to 5.5 meters (18 ft.). Overall trophic condition determined by EPA during the 1975 sampling runs was mesotrophic while results from the 1989, EID study classified Bluewater Reservoir as eutrophic. Note that the latter
9
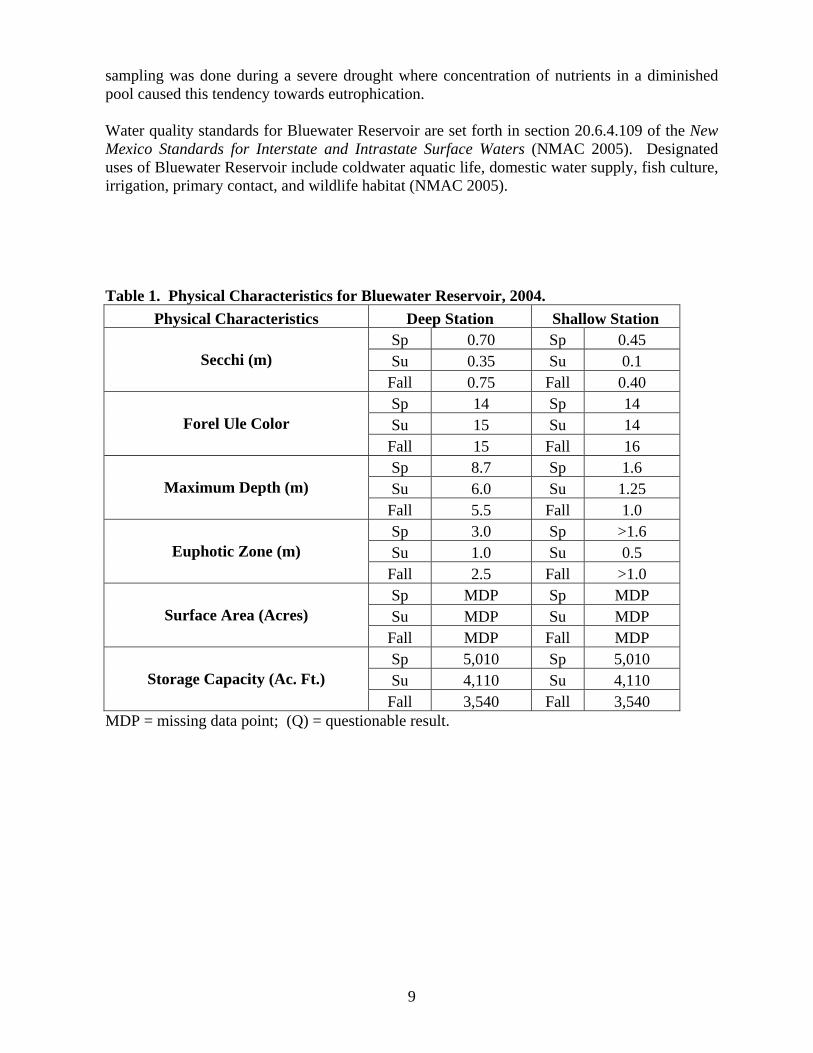
sampling was done during a severe drought where concentration of nutrients in a diminished pool caused this tendency towards eutrophication. Water quality standards for Bluewater Reservoir are set forth in section 20.6.4.109 of the New Mexico Standards for Interstate and Intrastate Surface Waters (NMAC 2005). Designated uses of Bluewater Reservoir include coldwater aquatic life, domestic water supply, fish culture, irrigation, primary contact, and wildlife habitat (NMAC 2005). Table 1. Physical Characteristics for Bluewater Reservoir, 2004.
Physical Characteristics Deep Station Shallow Station Sp 0.70 Sp 0.45 Su 0.35 Su 0.1 Secchi (m)
Fall 0.75 Fall 0.40 Sp 14 Sp 14 Su 15 Su 14 Forel Ule Color
Fall 15 Fall 16 Sp 8.7 Sp 1.6 Su 6.0 Su 1.25 Maximum Depth (m)
Fall 5.5 Fall 1.0 Sp 3.0 Sp >1.6 Su 1.0 Su 0.5 Euphotic Zone (m)
Fall 2.5 Fall >1.0 Sp MDP Sp MDP Su MDP Su MDP Surface Area (Acres)
Fall MDP Fall MDP Sp 5,010 Sp 5,010 Su 4,110 Su 4,110 Storage Capacity (Ac. Ft.)
Fall 3,540 Fall 3,540 MDP = missing data point; (Q) = questionable result.

10
Table 1. con’t. Physical Characteristics Deep Station Shallow Station
Sp No Sp No Su No Su No Anoxic Hypolimnion (Y/N)
Fall No Fall No Sp No Sp No Su Yes @ 2 meters Su Yes @ 1 meter Stratified (Y/N) @ depth (m)
Fall No Fall No Sp 7.81 Sp 8.14 Su 7.76 Su 8.01 PH (SUs) Surface
Fall 6.60 Fall 7.50 Sp 833 Sp 776 Su 941 Su 943 Conductance (μS) Surface
Fall 1045 Fall 1048 Sp 14.3 Sp 27.4 Su 70.1 Su 104 Turbidity (NTUs)
Fall 11.6 Fall 24.0 Sp 3.0 Sp 0.5 Su 5.0 Su 1.0 Integrated Sample surface to (m)
Fall 5.0 Fall 0.5 Sp 8.19 Sp 7.58 Su 5.95 Su 5.46 Dissolved Oxygen Surface (mg/L)
Fall 7.73 Fall 8.25 Sp 7.32 Sp 5.82 Su 3.93 Su 4.42 Dissolved Oxygen Bottom (mg/L)
Fall 6.56 Fall 8.09 Sp 9.94 Sp 10.29 Su 25.16 Su 25.42 Temperature Surface (°C)
Fall 13.87 Fall 14.46 Sp 9.85 Sp 10.24 Su 17.74 Su 21.24 Temperature Bottom (°C)
Fall 13.68 Fall 14.42 Sp 9.97 Sp 10.09 Su 28.41 Su 31.37 Chlorophyll a (μg/L)
Fall 3.14 Fall 3.46 MDP = missing data point; (Q) = questionable result.
11
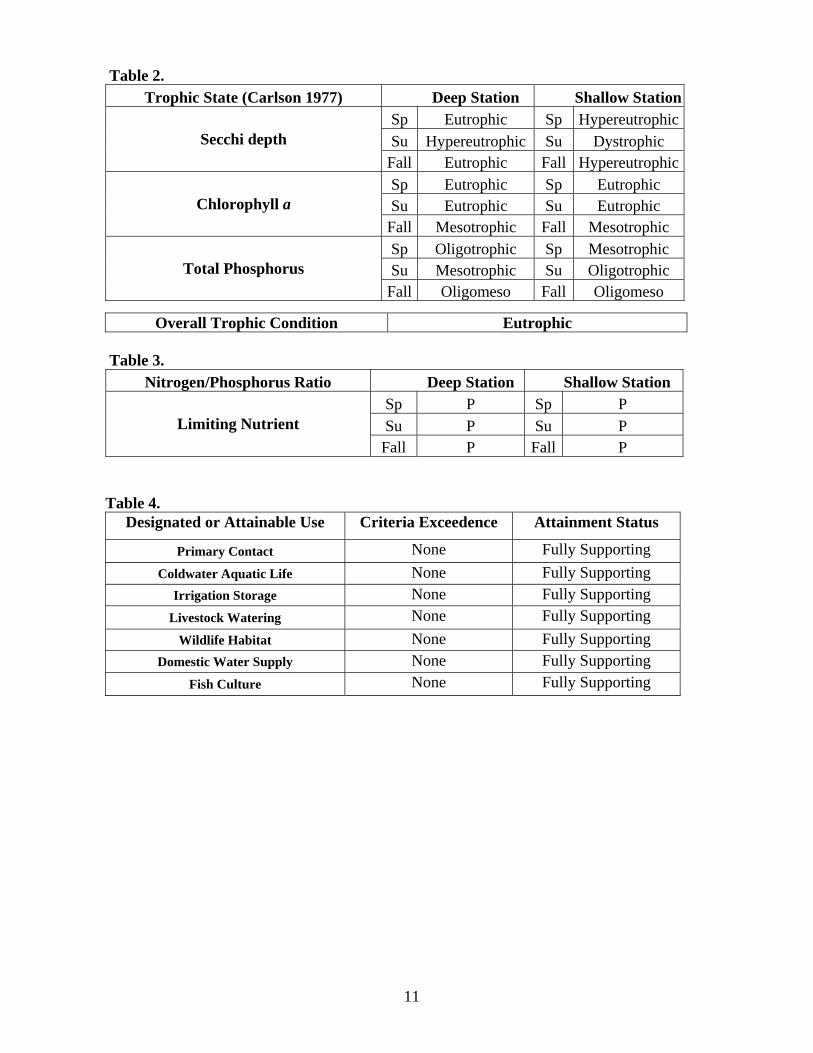
Table 2. Trophic State (Carlson 1977) Deep Station Shallow Station
Sp Eutrophic Sp HypereutrophicSu Hypereutrophic Su Dystrophic Secchi depth
Fall Eutrophic Fall HypereutrophicSp Eutrophic Sp Eutrophic Su Eutrophic Su Eutrophic Chlorophyll a
Fall Mesotrophic Fall Mesotrophic Sp Oligotrophic Sp Mesotrophic Su Mesotrophic Su Oligotrophic Total Phosphorus
Fall Oligomeso Fall Oligomeso
Table 3.
Nitrogen/Phosphorus Ratio Deep Station Shallow Station Sp P Sp P Su P Su P Limiting Nutrient
Fall P Fall P Table 4.
Designated or Attainable Use Criteria Exceedence Attainment Status
Primary Contact None Fully Supporting Coldwater Aquatic Life None Fully Supporting
Irrigation Storage None Fully Supporting Livestock Watering None Fully Supporting
Wildlife Habitat None Fully Supporting Domestic Water Supply None Fully Supporting
Fish Culture None Fully Supporting
Overall Trophic Condition Eutrophic

12
Water Quality Assessment
Physical characteristics of Bluewater Reservoir were measured and are listed in Table 1. Table 2 shows the trophic state variation observed both seasonally and between stations for secchi depth, chlorophyll a, and total phosphorus. The overall trophic condition of Bluewater Reservoir in 2004, according to Carlson’s (1977) indices and algal community composition (Likens 1975), is eutrophic with phosphorus being the limiting nutrient at all stations and
during all seasons (Tables 2 and 3). During the 1977 EPA National Eutrophication Study, Bluewater Reservoir was classified as mesotrophic while the 1989 study conducted by the Surface Water Quality Bureau resulted in a eutrophic determination. A prolonged and severe drought plaguing the desert southwest caused low water levels in many impoundments and consequently higher concentrations of nutrients, which produced more eutrophic conditions. This may account for some of the conditions observed during the study.
Phytoplankton community composition consisted primarily of two members of the Cyanophyta, specifically Aphanizomenon and Anabaena species (99 %) and one Chrysophyta or diatom of the genus Cyclotella representing the balance of the phytoplankton community. Multiple substrate periphyton scrapes for diatom analyses were collected, but are unavailable at this time. Lake chemistry sampling consisted of total, dissolved, and calculated nutrients, anions and cations, total and dissolved heavy metals, synthetic organics, radionuclides, and cyanide, which cover all criteria pertinent to the protection of all designated uses. These data are available upon request, though any criteria exceedences are listed in Table 4 and discussed below. Bluewater Reservoir was not stratified during either the spring or fall sampling runs, however a pronounced thermocline was present at both the deep and shallow stations during the summer visit. During the summer sampling run, criteria exceedences for temperature were measured at both the deep and shallow stations. However, according to SWQB’s temperature assessment protocol, the values measured did not exceed the criteria by greater than 4 degrees C, and to our knowledge, did not exceed for more than six hours over a three day period. A second
Bluewater Reservoir at Dam
Bluewater Lake and Bluewater Creek inlet
13
exceedence occurred for dissolved oxygen during the fall sampling visit. This exceedence occurred one out of six times, which according to current assessment guidelines, does not result in a non-support determination for any designated use. The final parameter exceedence occurred for total phosphorus from the shallow station during the summer visit. The criteria of 0.1 mg/L as (P) was exceeded by 0.064 mg/L, but this constituted less than 15 percent of sample results and therefore, it was determined that the designated uses were fully supported. All other chemical analyses for nutrients, heavy metals, and organics were well below criteria, including human health criteria, or were not detected by the analytical laboratory. Results indicate that all designated uses were fully supported during the study (Table 4). The exceedences mentioned did not occur in the amounts or length of time to result in use impairment determinations. However, if the drought that has plagued New Mexico for over eight years continues, materials associate with land uses within the watershed will increasingly threaten the water quality of this beautiful mountain reservoir.

14
Water Quality and Biological Assessment Survey of Zuni Salt Lake and Zuni Salt Lake Cone, Catron County, June 23, 2004.
Danny R. Davis, Principal Investigator
Zuni Salt Lake is located in west-central New Mexico, approximately 32 km (20 mi.) northwest of Quemado and approximately 97 km (60 mi.) south of the Pueblo of Zuni. Zuni Salt Lake consists of a large volcanic maar crater and contains two younger cinder cones, one of which holds a deep depression and contains a small lake. The roughly 300 hectare (750 acres) crater contains a hypersaline lake of about 60 hectares (150 acres). A small, 800 m2 (0.2 acre) lake sets within the interior volcanic cone. Though also saline by nature, this isolated pool
exhibits different characteristics from that of the main salt lake. The maar and surrounding area is of historic, religious, and cultural significance to the people of Zuni Pueblo and no less than five other Native American tribes including the Navajo, Hopi, Acoma, Apache, and Laguna people (LaDuke 2002). This study was undertaken for a number of reasons. SWQB received federal funding under a USEPA 104(b)(3) grant to study the Rio Puerco, Bluewater, and San Jose watersheds and waters located on, or around, the Pueblo of Zuni. Lentic waterbodies were chosen to monitor within the study area, which included the Zuni Salt Lake, the Zuni Cinder Cone Lake, and the Upper Nutria Diversion Reservoir, all of which will be discussed separately. Past investigations of closed-basin waterbodies, generally referred to as playa lakes, have been conducted by the SWQB. This particular study adds to the understanding of the diversity of closed-basin lake types in New Mexico emphasizing the more saline members of this waterbody type. Another goal of this study is to provide the Pueblo of Zuni with physical, chemical, and biological data that may further support the goals of establishing criteria that protect these unique surface water features and surrounding lands. Recent attempts to establish coal strip mining in the immediate vicinity, with associated rail delivery systems to a power station in St. Johns, Arizona have been halted, and in 1999, the
Zuni Salt Lake

15
National Park Service recognized the 185,000 acres surrounding the lake as eligible for listing on the National Register of Historic Places. Hopefully, these data will serve to increase understanding of these unique waters and associated lands adding understanding of the diverse habitats, biological components, and associated water quality, and hopefully aid in the adoption of specific protective water quality criteria by the Pueblo of Zuni. The State of New Mexico has no authority, in any way, over these waters, but for illustrative purposes designated uses that would be recognized by the State of New Mexico were applied. Zuni Salt Lake is a closed basin, spring-fed depression, located at an elevation of 1,896 meters (6,220 ft.) and is located within the Level III Ecoregion 22 (Arizona/New Mexico Plateau) contained within Aggregate Ecoregion III (the Xeric West) (Omernik 1987). Annual precipitation from station Salt Lake 4NE was 24.1 centimeters (9.50 in.) (Gabin and Lesperance 1977). Pan evaporation was not available for this station, however, a station located at the Reserve Ranger Station, within the same county and roughly the same elevation, averaged greater than 86 centimeters (34 in.) suggesting a substantial yearly water deficit. At this time, water quality standards for Zuni Salt Lake are not established. Uses that exist at
Zuni Salt Lake include wildlife habitat, special warm water aquatic life, and secondary contact. It is also reasonable to assume that primary contact would be considered a designated use if total emersion in the lakes is practiced. Though New Mexico Water Quality Standards are not applicable to these tribal waters, it is hoped that this study can help the Pueblo of Zuni establish appropriate criteria for the existing uses described above in order to protect these unique surface water features. Zuni Cinder Cone Lake
Zuni Salt Lake

16
Table 1. Physical Characteristics for Zuni Salt Lake and Zuni Cinder Cone Lake Physical Characteristics Zuni Salt Lake Zuni Cinder Cone Lake
Secchi Depth (m) est. 4 5.25 Forel Ule Color MDP 8
Maximum Depth (m) est. 4 5.8 Euphotic Zone (m) Bottom Bottom
Surface Area (Acres) est. 150 0.2
Anoxic Hypolimnion (Y/N) No NO
Stratified (Y/N) @ (m) No No
Ph units (SUs) Surface 7.31 8.06
Total Dissolved Solids (TDS) 280,000 142,000
Turbidity (NTUs)
est. 5 est. 2
Integrated sample surface to (m) surface 5.0
Dissolved Oxygen Surface (mg/L) 2.12 3.2
Dissolved Oxygen Bottom (mg/L) 2.12 3.4
Temperature Surface (°C) 34.8 20.69
Temperature Bottom (°C) 34.8 20.07
Chlorophyll a (µg/L) 9.70 1.14 Table 2. Trophic State (Carlson 1977)
Trophic State Indices Zuni Salt Lake Zuni Cinder Cone
Su Mesotrophic Oligomesotrophic Secchi depth
Su Eutrophic Oligomesotrophic Chlorophyll a
Su Oligotrophic Oligotrophic Total Phosphorus / Total Nitrogen
Overall Trophic Condition Mesotrophic Oligomesotrophic

17
Table 3.
Nitrogen/Phosphorus Ratio Zuni Salt Lake Zuni Cinder Cone
Nitrogen Nitrogen Limiting Nutrient
Table 4. Use Attainment, applying New Mexico Water Quality Standards if they were applicable to uses in Zuni Tribal Waters. Zuni Salt Lake
Designated or Attainable Use Criteria Exceedence Attainment Status Warmwater Aquatic Life None Fully Supporting
Wildlife Habitat None Fully Supporting Primary and Secondary Contact None Fully Supporting
Zuni Cinder Cone Lake
Designated or Attainable Use Criteria Exceedence Attainment Status Warmwater Aquatic Life None Fully Supporting
Wildlife Habitat None Fully Supporting Primary and Secondary Contact None Fully Supporting

18
Water Quality Assessment
Physical characteristics of Zuni Salt Lake and Zuni Cinder Cone Lake were measured and are listed in Table 1. Table 2 shows the trophic state variation observed during the single summer visit for secchi depth, chlorophyll a, and total phosphorus. The overall trophic condition of Zuni Lake and Zuni Cinder Cone Lake, according to Carlson’s (1977) indices, is mesotrophic and oligomesotrophic, respectively, with nitrogen being the limiting nutrient for both waterbodies on the day of sampling (Tables 2 and 3). The nature of the hypersaline lakes rendered some analyses unreliable or impractical to perform. Phytoplankton community composition was unsuccessful due to the abundance of salt crystals in the sample, and radionuclide analyses for Gross alpha, beta, and radium 226 + 228 could not be performed due to the extreme total dissolved solids of 280,000 mg/L and 142,000 mg/L in Zuni Salt Lake and Zuni Cinder Cone Lake respectively. All other analyses and measurements were successfully performed. Benthic macroinvertebrate samples were collected from both waterbodies on June 23, 2004. Three taxa were identified from the cinder cone. Artemia salina (brine shrimp) and Ephydra sp. (brine fly) were both common and abundant. One larval representative of the Dipteran family Syrphidae (moth flies) was also identified. Four taxa of Odonata (two anisoptera and two zygoptera) were observed within the cinder cone, but were probably from a nearby spring. The macroinvertebrate community, though low in species richness, had very high numbers of individuals within the cinder cone. The main lake was sampled from the east shore on the same day. With the exception of a few spiders, no invertebrates were observed, probably due to the muddy substrate (Hopkins, pers. comm.). Lake chemistry sampling for the Zuni Salt Lake study consisted of total and dissolved nutrients, anions and cations, total and dissolved heavy metals, synthetic organics, radionuclides, and cyanide, which covers all criteria pertinent to the protection of all designated uses. Diatom and chlorophyll analyses were also performed. These data are available upon request, though any criteria exceedences are listed in Table 4 and discussed below.
Different water quality expectations must apply to hypersaline environments such as Zuni Salt Lake Maar and Zuni Cinder Cone Lake. High water temperatures, lower dissolved oxygen, and contracted biological communities should be expected. Within these physical and chemical constraints remains a very unique and vibrant aquatic system containing its specialized community of plant and animal species. In this instance, historic religious and cultural significance exist that further emphasize the importance of this
Zuni Salt Lake and Cinder Cone
19
system. All water quality criteria, including heavy metals, synthetic organics, cyanide and physical parameters were well within acceptable limits. The Zuni Salt Lake Crater is totally within and protected by the Pueblo of Zuni. Special permission was granted to allow for this investigation where personnel from the Zuni Tribe’s Department of Natural Resources Conservation Program accompanied and assisted the SWQB survey crew. New Mexico Water Quality Standards are not applicable to these waterbodies because they lie completely within the boundaries of the Zuni Pueblo. However, the observed and attainable uses of warm water aquatic life, wildlife habitat, primary contact, and secondary contact would be fully supported by the current, applicable NM Water Quality Standards. The SWQB extends its appreciation to the Pueblo of Zuni for their assistance during this study.

20
Water Quality and Biological Assessment Survey of Upper Nutria Diversion Reservoir, Pueblo of Zuni, McKinley County, October 14, 2004.
Danny R. Davis, Principal Investigator
Upper Nutria Diversion Reservoir is located, in west-central New Mexico approximately 32 km (20 mi.) northeast of the Pueblo of Zuni and about 40 km (25 mi.) southeast of Gallup, New Mexico. As with the previous Zuni Salt Lake Maar, the Upper Nutria Reservoir is within the Pueblo of Zuni Tribal lands and was constructed to impound the Rio Nutria for the primary purpose of irrigation. This lake was sampled in cooperation with the Pueblo of Zuni, and was partially funded under a USEPA 104(b)(3) grant. Study findings for this lake and other waters within Zuni Pueblo lands will be provided to the Pueblo for possible support of water quality standards development and other uses. Another purpose of this study was to collect and provide extensive physical, chemical, and biological data to the Pueblo of Zuni as an enhancement and update of their water quality database. The State of New Mexico has no authority, in any way, over these waters, but for illustrative purposes observed and attainable uses that would be recognized by the State of New Mexico were applied.
Nutria Diversion Reservoir sits at an elevation of 2,082 meters (6,830 ft.) above sea level. The lake has a surface acreage of 7.8 hectares (19 ac) with a maximum depth, located in front of the dam, of 2.25 meters (7.4 ft.). The reservoir is located in the Level III Ecoregion 23 (Arizona / New Mexico Mountains) within Aggregate Ecoregion II (Western Forested Mountains) (Omernik 1987) and receives approximately 34.2 cm/yr (13.5 in/yr), on average, with pan evaporation averaging about 87 cm/yr (34.2 in.) resulting in a water deficit of 57 cm/yr
(22.4 in/yr) (Gabin and Lesperance 1977). As stated previously, New Mexico Water Quality Standards are not applicable to waterbodies located entirely on pueblo lands, however designated uses of the Upper Nutria Diversion Reservoir would likely consist of marginal coldwater aquatic life, warmwater aquatic life, irrigation, livestock watering, primary contact, and wildlife habitat (NMAC 2005).
Rio Nutria above Nutria Diversion Reservoir

21
Table 1. Physical characteristics for Upper Nutria Diversion Reservoir Physical Characteristics Nutria Diversion Reservoir
Secchi Depth (m) 0.50
Forel Ule Color 18
Maximum Depth (m) 2.5
Euphotic Zone (m) 2.0
Surface Area (Acres) 19
Anoxic Hypolimnion (Y/N) N
Stratified (Y/N) @ (m) Y @ 2 m
Ph units (SUs) Surface 7.12
Conductivity (μS) (Surface)
446
Turbidity (NTUs)
14.7
Integrated sample surface to (m) 2.0
Dissolved Oxygen Surface (mg/L) 5.58
Dissolved Oxygen Bottom (mg/L) 5.20
Temperature Surface (°C) 9.30
Temperature Bottom (°C) 7.84
Chlorophyll a (µg/L) 21.67

22
Table 2. Trophic State (Carlson 1977)
Table 3. Nitrogen/Phosphorus Ratio
Deep Station
N Limiting Nutrient
Table 4. Use Attainment
Designated or Attainable Use Criteria Exceedence Attainment Status Marginal Coldwater Aquatic Life 4/4 Diss. Oxygen Not Supported
Warmwater Aquatic Life None Fully Supporting Irrigation None Fully Supporting
Livestock watering None Fully Supporting Primary Contact None Fully Supporting Wildlife Habitat None Fully Supporting
Trophic State Indices Deep Station @ Dam
Fall Eutrophic Secchi depth
Fall Eutrophic Chlorophyll a
Fall Oligotrophic/Eutrophic Total Phosphorus / Total Nitrogen
Overall Trophic Condition Eutrophic

23
Water Quality Assessment Physical characteristics of Upper Nutria Diversion Reservoir were measured and are listed in Table 1. Table 2 shows the trophic state variation observed during the single October visit for secchi depth, chlorophyll a, and total phosphorus. The overall trophic condition of Upper Nutria Diversion Reservoir, according to Carlson’s (1977) indices, is eutrophic, with nitrogen being the limiting nutrient on the day of sampling (Tables 2 and 3). During the May stream sampling visit, the SWQB crew reported that the reservoir was at capacity and spilling from the dam. This condition rapidly changed as the season progressed. By October, when the formal lake sampling event took place, the reservoir was very low, resulting in a maximum depth of 2.5 meters near the dam. This resulted in a concentration of nutrients and supported extensive algal and macrophyte growth indicative of eutrophic waterbodies. One factor that contributes to the nutrient enrichment of these types of lakes is the huge watershed to lake size, which in this case, rough calculations resulted in a watershed that is 1,500 times larger than the lake surface area. This condition is common to arid southwest reservoirs and, in the absence of known nutrient sources, will still exhibit rapid tendencies toward eutrophication. One bacterial sample for E. coli was collected, and resulted in 3 coliform units per 100 milliliters, well below any level of concern. Phytoplankton, diatom, and chlorophyll analyses were also performed. These data are available upon request, though any potential criteria exceedences are listed in Table 4 and discussed below. Lake chemistry sampling consisted of total and dissolved nutrients, anions and cations, total and dissolved heavy metals, and cyanide, which covers criteria pertinent to the protection of both observed and attainable uses, except for synthetic organics and radionuclide analyses. These analyses were not performed during this study. In addition to the lake samples collected during the date of this survey, an SWQB stream survey crew conducting lake-shore sampling, also in cooperation with the Pueblo of Zuni, on eight consecutive monthly visits. As a result of these lake-shore efforts, physical parameters were collected and recorded for eight consecutive months and water quality samples from the water’s edge were analyzed for major cations and anions plus total nutrients. In addition, an Ekman Dredge was used to collect two lake sediment samples. One sample was collected from the station located by the dam and the other was grabbed from the upper inlet canal where heavier sediments will likely fall out of suspension. These samples were analyzed for heavy metals. The results showed mercury, selenium, cadmium, and copper to be below detection. Some measurable amounts of aluminum, chromium, lead, and other metals were detected.
Upper Nutria Diversion Reservoir from boat ramp.

24
Fish tissue samples were collected by the Pueblo of Zuni and submitted for mercury analyses by the SWQB. These fish were collected from Ojo Caliente Reservoir, which is located southwest of the village of Zuni and consisted of trout, bass, and catfish. In all cases, mercury levels were either below detection limits, or very low, and posed no risk to consumers based upon current action levels. The highest mercury value measured was 0.16 micrograms per gram (ppm) from a catfish measuring 308 millimeters and weighing 200 grams. Tissue samples and analyses for Polychlorinated Biphenyl's (PCB's) were not conducted due to cost constraints, though it is suggested that the Pueblo of Zuni consider including these analyses in future monitoring plans. The collection of sediment and fish was of particular interest to the Zuni Department of Natural Resources due to their concern of possible aerial deposition, or fallout, from a coal-fired power plant in Arizona. As earlier stated, New Mexico water quality criteria do not apply to these waters, however, if the uses shown in Table 4 were adopted, all but the marginal coldwater aquatic life use would be fully supported. In fact, with adequate water supply, the Upper Nutria Diversion Reservoir could support a seasonal trout fishery, but this would have to be limited to the cooler months of the year. Data results show that the warmwater aquatic life use would be fully supported at all times should adequate water be available. The uses of irrigation, livestock watering, primary contact, and wildlife habitat would also be fully supported based on data results. It was a privilege to work with the Pueblo of Zuni Department of Natural Resources. We hope that this effort will aid and assist the Pueblo of Zuni with their efforts to protect water quality and habitat within their lands.
Water Quality and Biological Assessment Survey of Quemado Lake, Catron County, July 7, 2004.
Danny R. Davis, Principal Investigator

25
Quemado Lake is located in west-central New Mexico, approximately 29 kilometers (18 mi.) south of Quemado via State Highway 32. The reservoir has a mean surface area of 53 hectares (130 ac.) with a corresponding elevation of 2,326 meters (7,630 ft.). Maximum depth on the day of sampling was 8 meters (26 ft), which was the same for the 1995 study conducted by Davis (1997). Potter (1983) reported a maximum depth of 12 meters (39 ft) during a study conducted in 1982. The dam at Quemado Lake was constructed in 1971 to impound Largo and El Caso Creeks, which are both ephemeral streams. The New Mexico Department of Game and Fish own the water rights and the lake and maintain the recreational fishery.
The basin is located in Level III Ecoregion 23 (Arizona / New Mexico Mountains) within Aggregate Ecoregion II (Western Forested Mountains) (Omernik 1987) and averages 25.1 cm/yr (9.87 in/yr) of precipitation according to the Quemado Ranger District (Gabin and Lesperance 1977). Pan evaporation averages 79 centimeters (31 in.) resulting in a yearly deficit of 54.5 centimeters (21.48 in.). The purpose of this study was to
reexamine Quemado Lake and determine if overall water quality conditions were improved and uses supported. Historically, the lake has experienced nuisance algal blooms, fish kills, and more recently huge population of domestic gold fish, which are most probably the result of releasing a family pet to the wild. In 1983, Potter made recommendations for watershed improvements, and in 1995, Davis reported that efforts had been made to exclude cattle from the lake by the construction of a fence that completely surrounds the lake and aids in the protection of shore vegetation. Grazing allotments within the watershed appear to be monitored closely by the Apache National Forest, and specifically the Quemado Ranger District who oversees grazing permittees within forest boundaries. Though water supply to the lake from the ephemeral streams cannot be controlled, the presence of preserved wetlands associated with the inflow can offer some filtering of nutrient load from the watershed. The

26
resulting lake to watershed ratio of 1/114, suggesting substantial nutrient load to the lake without accounting for probable cultural or human influences. Quemado Lake watershed has been logged, although riparian areas were supposedly avoided during these operations. The recreating public heavily uses Quemado Lake and the associated watershed. The Forest Service estimates that over 50,000 visitors frequent the area annually to camp, boat, fish, and picnic at facilities adjacent to the lake. Historically, the New Mexico Department of Game and Fish has maintained a rainbow trout fishery. However, this has become threatened due to a goldfish population explosion in the lake caused by people inappropriately releasing their “pets” into the lake’s waters. Major efforts to remove the unwanted exotics have included netting huge quantities of goldfish, and recently, the introduction of Tiger musky, a cross between Esox lucius and Esox masquinongy. This predatory fish will hopefully feed on the remaining goldfish. Quemado Lake is not classified, , however criteria associated with attainable or existing uses must be protected under section 20.6.4.900 of the New Mexico Standards for Interstate and Intrastate Surface Waters (NMAC 2005). Existing uses of Quemado Lake include marginal coldwater aquatic life, livestock watering, secondary contact, and wildlife habitat. Section 20.6.4.99 of the Water Quality Standards is designed to capture those perennial waters that are not classified. Table 1. Physical Characteristics of Quemado Lake

27
Physical Characteristics Quemado Lake Secchi Depth (m)
1.0
Forel Ule Color 14
Maximum Depth (m) 8.95
Euphotic Zone (m) 3.5
Surface Area (Acres) est. 130
Anoxic Hypolimnion (Y/N) Yes
Stratified (Y/N) @ (m) Yes @ 2 meters
Ph units (SUs) Surface 8.30
Conductivity (μS) (Surface)
388
Turbidity (NTUs)
6.41
Integrated sample surface to (m) 7.0
Dissolved Oxygen Surface (mg/L) 7.22
Dissolved Oxygen Bottom (mg/L) 0.13
Temperature Surface (°C) 19.12
Temperature Bottom (°C) 14.45
Chlorophyll a (µg/L) 20.19

28
Table 2. Trophic State (Carlson 1977)
Table 3. Nitrogen/Phosphorus Ratio
Deep Station
P Limiting Nutrient
Table 4. Use Attainment
Designated or Attainable Use Criteria Exceedence Attainment Status Coldwater Aquatic Life None Fully Supporting
Secondary Contact None Fully Supporting Wildlife Habitat None Fully Supporting
Livestock Watering None Fully Supporting Warmwater Aquatic Life None Fully Supporting
Trophic State Indices Deep Station
Su Eutrophic Secchi depth
Su Eutrophic Chlorophyll a
Su Oligotrophic Total Phosphorus / Total Nitrogen
Overall Trophic Condition Eutrophic

Water Quality Assessment Physical characteristics of Quemado Lake were measured and are listed in Table 1. Table 2 shows the trophic state variation observed during the single summer visit for secchi depth, chlorophyll a, and total phosphorus. The overall trophic condition of Quemado Lake, according to Carlson’s (1977) indices and algal community composition (Likens 1975), is eutrophic, with nitrogen being the limiting nutrient on the day of sampling (Tables 2 and 3). Of the ten phytoplankton genera identified from the sample, 64 percent were members of the Chlorophyta and 26 percent Cyanophyta or blue-green algae. The remaining taxa identified were representatives of the Euglenophyta, Cryptophyta, and 8 percent were diatoms. The dominance of green and blue-green algae, representing about 90 percent of the algal community, support the eutrophic determination. A benthic diatom sample was collected, however results from this sample have not been forthcoming. These data will be available in the near future. Lake chemistry sampling consisted of total and dissolved nutrients, anions and cations, total and dissolved heavy metals, synthetic organics, and radionuclides, which covers all criteria pertinent to the protection of all designated uses. These data are available upon request, though any criteria exceedences are listed in Table 4 and discussed below.
At the time of this writing, a prolonged drought continued to stress surface waters of New Mexico. This has been especially true for reservoirs where the normal arid southwest climate often causes water quantity and quality concerns. However, it is evident that remedial actions applied to lentic waterbodies and their watersheds do show positive results. In the case of Quemado Lake, the fence now protecting
the perimeter of the lake from cattle may allow for the development of stabilizing and filtering vegetation. In any event, overall water quality was good even though the lake is enriched from a huge watershed. Unlike the results of the 1995 study, where the coldwater aquatic life use was not supported, data collected during this study indicate that this use is supported, even with lake levels low and nutrient concentrations and productivity measurably high. All designated uses were fully supported during this study (Table 4).
Water Quality and Biological Assessment Survey of Ramah Lake, McKinley County, June 22, 2004.
Danny R. Davis, Principal Investigator
Quemado Lake and Dam
Quemado Lake
30
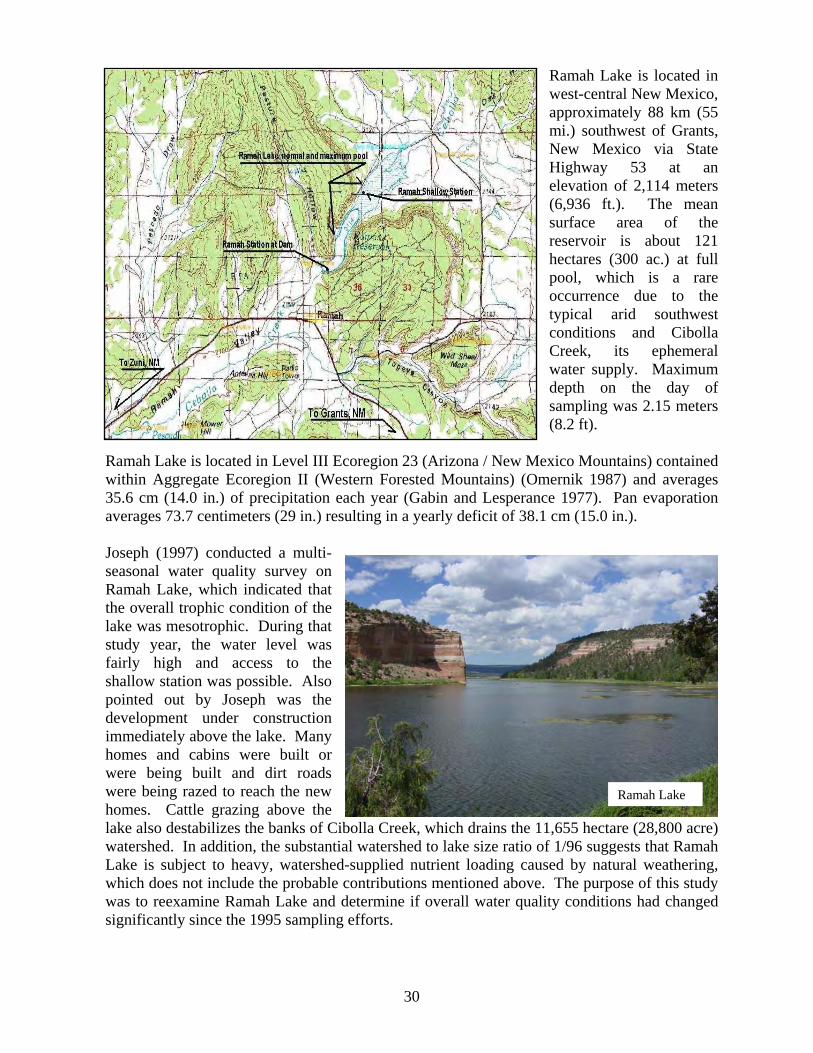
Ramah Lake is located in west-central New Mexico, approximately 88 km (55 mi.) southwest of Grants, New Mexico via State Highway 53 at an elevation of 2,114 meters (6,936 ft.). The mean surface area of the reservoir is about 121 hectares (300 ac.) at full pool, which is a rare occurrence due to the typical arid southwest conditions and Cibolla Creek, its ephemeral water supply. Maximum depth on the day of sampling was 2.15 meters (8.2 ft).
Ramah Lake is located in Level III Ecoregion 23 (Arizona / New Mexico Mountains) contained within Aggregate Ecoregion II (Western Forested Mountains) (Omernik 1987) and averages 35.6 cm (14.0 in.) of precipitation each year (Gabin and Lesperance 1977). Pan evaporation averages 73.7 centimeters (29 in.) resulting in a yearly deficit of 38.1 cm (15.0 in.). Joseph (1997) conducted a multi-seasonal water quality survey on Ramah Lake, which indicated that the overall trophic condition of the lake was mesotrophic. During that study year, the water level was fairly high and access to the shallow station was possible. Also pointed out by Joseph was the development under construction immediately above the lake. Many homes and cabins were built or were being built and dirt roads were being razed to reach the new homes. Cattle grazing above the lake also destabilizes the banks of Cibolla Creek, which drains the 11,655 hectare (28,800 acre) watershed. In addition, the substantial watershed to lake size ratio of 1/96 suggests that Ramah Lake is subject to heavy, watershed-supplied nutrient loading caused by natural weathering, which does not include the probable contributions mentioned above. The purpose of this study was to reexamine Ramah Lake and determine if overall water quality conditions had changed significantly since the 1995 sampling efforts.
Ramah Lake

31
Ramah Lake is unclassified, however, criteria associated with attainable or existing uses must be protected under section 20.6.4.900 of the New Mexico Standards for Interstate and Intrastate Surface Waters (NMAC 2005). Existing uses of Ramah Lake include coldwater aquatic life, livestock watering, primary contact, and wildlife habitat. Section 20.6.4.99 of the Water Quality Standards is designed to capture those perennial waters that are not classified, however, criteria associated with this section are not protective of the coldwater aquatic life use due to the high temperature criterion specified in this section. Table 1. Physical Characteristics of Ramah Lake
32
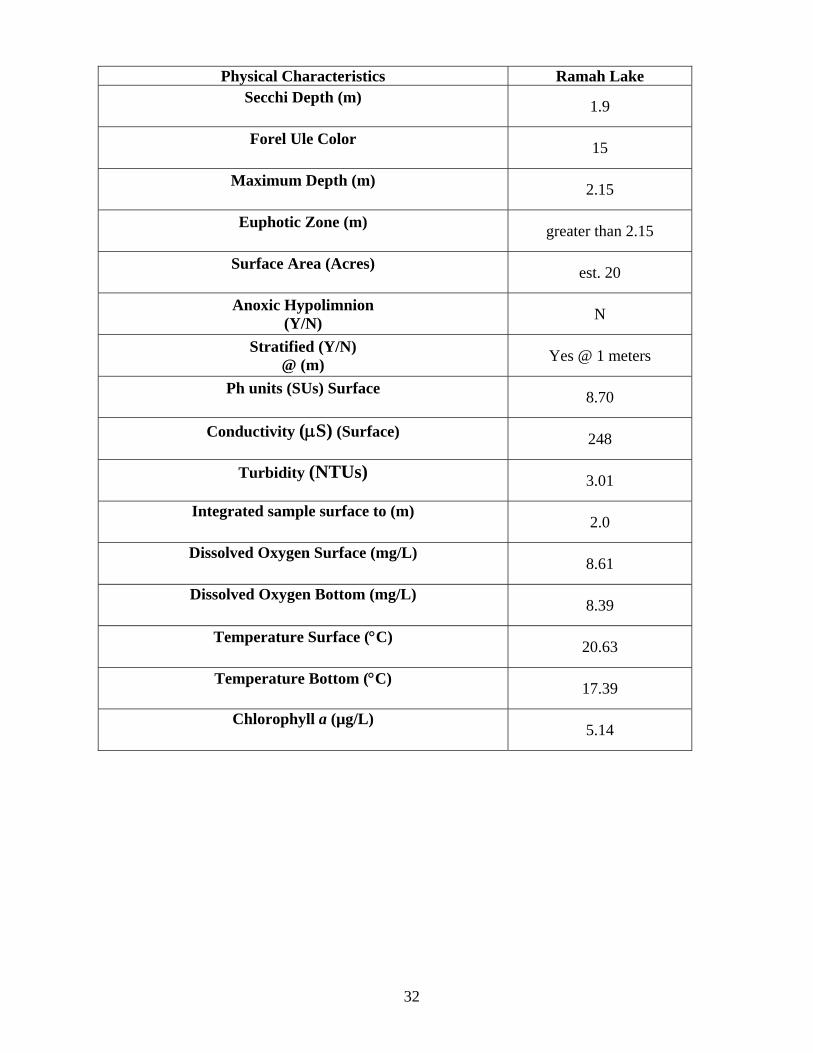
Physical Characteristics Ramah Lake Secchi Depth (m)
1.9
Forel Ule Color 15
Maximum Depth (m) 2.15
Euphotic Zone (m) greater than 2.15
Surface Area (Acres) est. 20
Anoxic Hypolimnion (Y/N) N
Stratified (Y/N) @ (m) Yes @ 1 meters
Ph units (SUs) Surface 8.70
Conductivity (μS) (Surface)
248
Turbidity (NTUs)
3.01
Integrated sample surface to (m) 2.0
Dissolved Oxygen Surface (mg/L) 8.61
Dissolved Oxygen Bottom (mg/L) 8.39
Temperature Surface (°C) 20.63
Temperature Bottom (°C) 17.39
Chlorophyll a (µg/L) 5.14
33
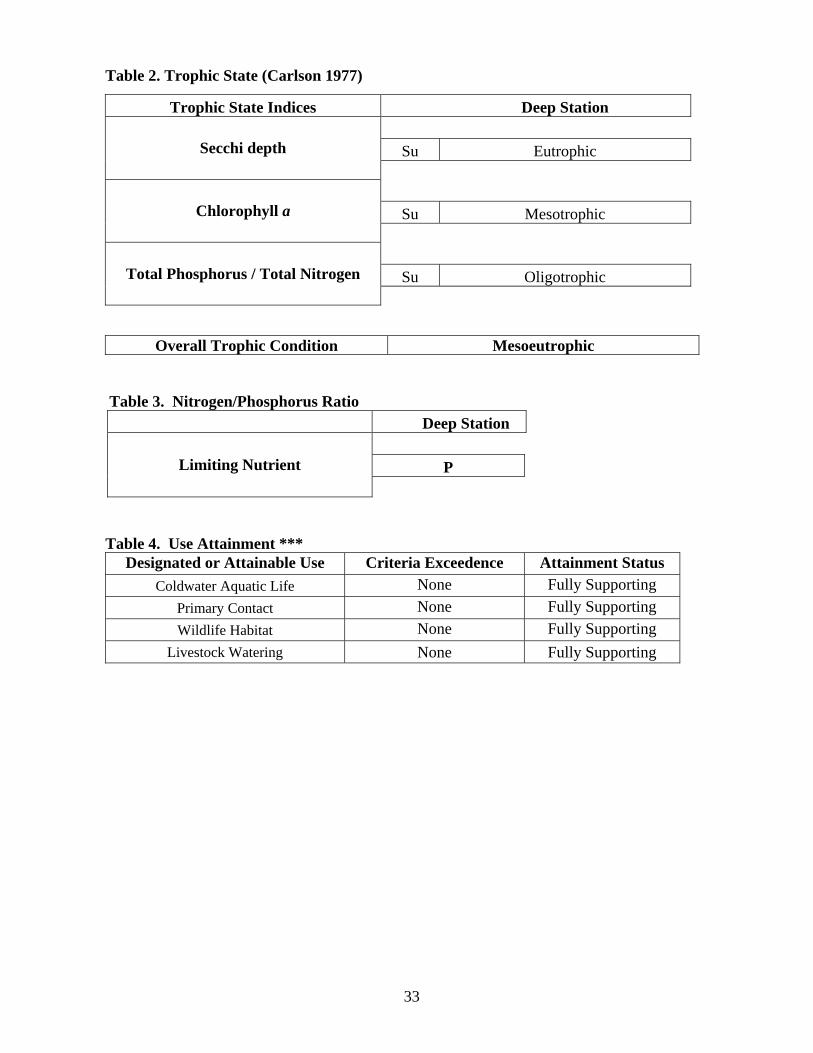
Table 2. Trophic State (Carlson 1977)
Table 3. Nitrogen/Phosphorus Ratio
Deep Station
P Limiting Nutrient
Table 4. Use Attainment ***
Designated or Attainable Use Criteria Exceedence Attainment Status Coldwater Aquatic Life None Fully Supporting
Primary Contact None Fully Supporting Wildlife Habitat None Fully Supporting
Livestock Watering None Fully Supporting
Trophic State Indices Deep Station
Su Eutrophic Secchi depth
Su Mesotrophic Chlorophyll a
Su Oligotrophic Total Phosphorus / Total Nitrogen
Overall Trophic Condition Mesoeutrophic

34
Water Quality Assessment Physical characteristics of Ramah Lake were measured and are listed in Table 1. Table 2
shows the trophic state variation observed during the single summer visit for secchi depth, chlorophyll a, and total phosphorus. The overall trophic condition of Ramah Lake during the survey, according to Carlson's (1977) indices and algal community composition (Likens 1975), was mesoeutrophic with phosphorus being the limiting
nutrient on the day of sampling (Tables 2 and 3). During the previous multi-season, multi-station SWQB survey in 1995, mesoeutrophic conditions were also observed (Joseph 1997). Cyanophyta, or blue-green algae, represented 68 percent of the algal community and a single genus of the Division Cryptophyta made up 30 percent of the algal community. Green algae, or Chlorophyta, represented the balance of the community members. Likens (1975) lists the blue-green algae as indicative of nutrient-rich conditions, which were evident during the survey visit. A benthic diatom sample was collected, however, results from this sample have not been forthcoming. These data will be available in the near future. Lake chemistry sampling consisted of total and dissolved nutrients, anions and cations, total and dissolved heavy metals, synthetic organics, and radionuclides, which covers all criteria pertinent to the protection of all designated uses. These data are available upon request, though any criteria exceedences are listed in Table 4 and discussed below. Ramah Lake is unclassified, however, existing uses have been recognized and prove to be attainable. The New Mexico Department of Game and Fish stock rainbow trout regularly and also list bass as a fishable resident. The coldwater aquatic life use appears to be supported even though the reservoir level remains low due to a severe drought. The coldwater fishery designation also protects for the warmwater fishery use. Based on sampling team observations, swimming may occur to some extent suggesting that the use of primary contact may exist though this is not confirmed. However, criteria specific to primary contact were within acceptable limits. Wildlife habitat and livestock watering uses were also fully supported (Table 4).
Family of Coots negotiating heavy macrophyte bloom, Ramah Lake.
Anglers enjoying Ramah Lake

35
The cultural sources of eutrophication, specifically cattle grazing at the upper lake shore and the continued development above the lake, are likely contributors to the nutrient load supplied by the watershed. Efforts to control these inputs may slow the eutrophication process and should be actively pursued by management agencies and concerned citizens.

36
Water Quality and Biological Assessment Survey of San Gregorio Lake, Sandoval County, July 21, 2004.
Danny R. Davis, Principal Investigator
San Gregorio Lake is located in north-central New Mexico, approximately 22.5 kilometers (14 mi.) east of Cuba, New Mexico via State Highway 126 and Forest Road 267. The reservoir is located within the San Pedro Park Wilderness of the Santa Fe National Forest and consists of a 14.2 hectare (35 ac.) lake formed by an earthen dam. Upon reaching the Nacimiento Campground, a short, 1/2 mile hike along a maintained trail is required to access the lake. San Gregorio Reservoir receives water from Clear Creek, a small stream that is reported to contain rainbow trout and Rio Grande cutthroat trout (Oncorhynchus clarki virginalis). The watershed size supplying the reservoir is approximately 700 hectares (1,732 ac), which results in a lake size to watershed ratio of 1/50. The lake is located at an elevation of 2,868 meters (9,410 ft.) and annual precipitation data from the National Resource Conservation Service "SNOTEL" website indicates an average of 71 cm (28 in.) of precipitation per year from the Senorita Divide and Quemazon sites. These monitoring sites have similar elevations as San Gregorio Reservoir and are relatively close to the lake. Maximum depth at the deepest station in front of the dam was 2.4 meters (7.8 ft). The lake is located in Level III Ecoregion 21 (the Southern Rockies) contained within Aggregate Ecoregion II (Western Forested Mountains) (Omernik 1987).
The purpose of this study was to assemble baseline water quality data and to support two concurrent SWQB watershed studys in the Jemez and Rio Puerco basins. Supporting information recently published by the Santa Fe National Forest describes conditions of major drainages within the Jemez Ranger district, including this study area, and discusses probable causes of water quality and habitat impairment (USDA, Forest Service 2004).

37
The State of New Mexico 2004-2006 Clean Water Act Integrated §303(D)/§305(B) List of Assessed Waters (NMED/SWQB 2004b) comments that San Gregorio Lake, "…has a head gate on one end of the dam that is the beginning of Nacimiento Creek (Rio Puerco Watershed). The dam also has a spillway that empties into Clear Creek, which is in the Jemez watershed." This creates a problem during assessment because assessment units for the Rio Puerco do not protect the existing uses of San Gregorio Lake, which naturally falls into water quality segment 20.6.4.108 (NMAC 2005). Section 20.6.4.108 is described as, “Perennial reaches of the Jemez river and all its tributaries above Soda dam near the town of Jemez Springs, except Sulphur creek above its confluence with Redondo creek, and perennial reaches of the Guadalupe river and all its tributaries.” Designated uses of section 20.6.4.108 include domestic water supply, fish culture, high quality coldwater aquatic life, irrigation, livestock watering, wildlife habitat, and secondary contact. (NMAC 2005). Before San Gregorio Lake was constructed and the water of Clear Creek diverted into the Rio Puerco watershed, these waters existed entirely within the aforementioned segment, which has the criteria necessary to protect designated and existing uses. Though San Gregorio Lake naturally falls within segment 20.6.4.108, as an impoundment of Clear Creek, it does have characteristics specific to lentic waterbodies, and so, some uses may be inappropriate. Domestic water supply is diverted from the lake to the city of Cuba, New Mexico, and the other uses do or can be supported if water quality conditions are protected. It is questionable, however, if fish culture is a use that has any purpose within this segment.

38
Table 1. Major Physical Characteristics of San Gregorio Lake. Physical Characteristics San Gregorio Lake
Secchi Depth (m) 0.65
Forel Ule Color 15
Maximum Depth (m) 2.4
Euphotic Zone (m) 2.1
Surface Area (Acres) est. 35
Anoxic Hypolimnion (Y/N) N
Stratified (Y/N) @ (m) Yes @ 2 meters
Ph units (SUs) Surface 8.66
Conductivity (μS) (Surface)
61
Turbidity (NTUs)
9.69
Integrated sample surface to (m) 2.0
Dissolved Oxygen Surface (mg/L) 7.19
Dissolved Oxygen Bottom (mg/L) 6.63
Temperature Surface (°C) 19.74
Temperature Bottom (°C) 16.05
Chlorophyll a (µg/L) 29.77
39
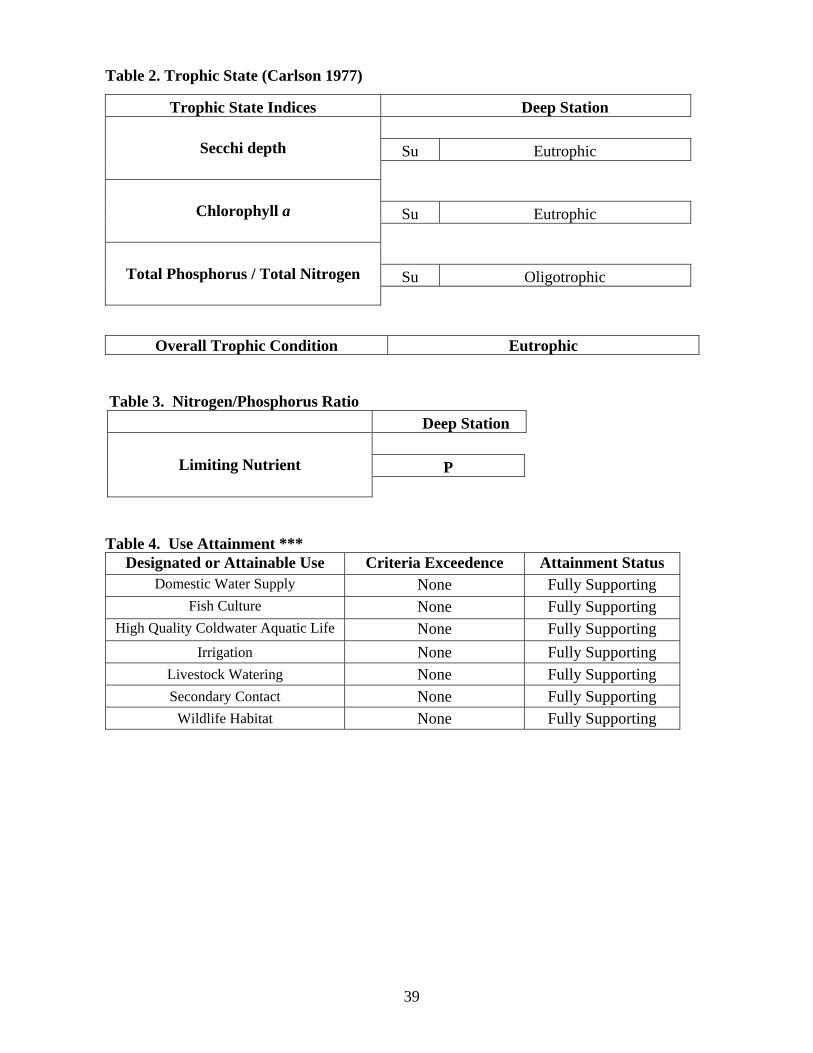
Table 2. Trophic State (Carlson 1977)
Table 3. Nitrogen/Phosphorus Ratio
Deep Station
P Limiting Nutrient
Table 4. Use Attainment ***
Designated or Attainable Use Criteria Exceedence Attainment Status Domestic Water Supply None Fully Supporting
Fish Culture None Fully Supporting High Quality Coldwater Aquatic Life None Fully Supporting
Irrigation None Fully Supporting Livestock Watering None Fully Supporting Secondary Contact None Fully Supporting
Wildlife Habitat None Fully Supporting
Trophic State Indices Deep Station
Su Eutrophic Secchi depth
Su Eutrophic Chlorophyll a
Su Oligotrophic Total Phosphorus / Total Nitrogen
Overall Trophic Condition Eutrophic

39
Water Quality Assessment Major physical characteristics of San Gregorio Lake were measured and are listed in Table 1. Table 2 shows the trophic state variation observed during the single summer visit for secchi depth, chlorophyll a, and total phosphorus. The overall trophic condition of San Gregorio Lake during the survey, according to Carlson's (1977) indices and algal community composition (Likens 1975), was eutrophic (Table 2). Total phosphorus was determined to be the limiting nutrient on the day of sampling (Table 3). Three genera of the Cyanophyta or blue-green algae comprised 72 percent of the total algal community, with the remaining five genera of the Chlorophyta making up the remaining portion of the algal community. Likens (1975) lists the blue-green algae as indicative of nutrient-rich conditions, which were evident during the survey visit. Secchi depth, water color, and visual presence of heavy macrophyte growth and floating algae were present as a result of the nutrient conditions. Benthic diatom samples were collected, however, results from these samples have not been forthcoming. This data should be available in the near future. Lake chemistry sampling consisted of total and dissolved nutrients, anions and cations, total and dissolved heavy metals, synthetic organics, and radionuclides, which covers all criteria pertinent to the protection of all designated uses. These data are available upon request, though any criteria exceedences are listed in Table 4. San Gregorio Lake had not been sampled by SWQB prior to this study, however, information from past studies conducted by the U.S. Forest Service (Scott Hopkins, pers. comm.) suggests that conditions at San Gregorio Lake have improved significantly in recent years. In the late 1980's, cattle grazed for the majority of the year and little attention was given to numbers, duration, and proximity to Clear Creek and San Gregorio Lake. At present, grazing is closely monitored with specified numbers of animal units allowed for much shorter periods of time and cattle are rotated to reduce the impact to any one area. Descriptions of the lake before increased Forest Service oversight described a very green, nutrient impacted lake. Current conditions are much improved from past conditions suggesting that Clear Creek and San Gregorio Lake are recovering as a result of improved management practices by the U.S. Forest Service. These improvements are evident even during a severe and prolonged drought suggesting that during periods of increased water supply, when flushing may occur, water quality conditions may show greater signs of recovery.
San Gregorio Lake from west end of dam

40
REFERENCES Carlson, R.E. 1977. A Trophic Index for Lakes. Limnol. Oceanogr. 22: 361-369.
Carlson, R.E. 1980. More Complications in the Chlorophyll-Secchi Disk Relationship. Limnol.
Oceanogr. 25(2):379-382. Davis, D.R. 1997. Water Quality and Biological Assessment Survey of Quemado Lake, Catron
County, New Mexico, September 6, 19956. In Lake Water Quality Assessment Surveys for Selected New Mexico Lakes, 1995. NMED/SWQ-97/3. 32 p.
Gabin, V.L., and L.E. Lesperance. 1977. New Mexico Climatological Data: Precipitation, Temperature, Evaporation, and Wind. Monthly and Annual Mean 1850-1975. W.K. Summers and Associates. Hopkins, J. S. 2004. New Mexico Environment Department, Surface Water Quality Bureau. Pers.
Comm. Joseph, S.J. Water Quality and Biological Assessment Survey of Ramah Lake, McKinley County,
New Mexico, May 5, July 7, and October 10, 1995. In Lake Water Quality Assessment Surveys for Selected New Mexico Lakes, 1995. NMED/SWQ-97/3. 32 p.
LaDuke, Winona. 2002. The Salt Woman and the Coal Mine In Sierra Magazine, December 2002. Likens, G. 1975. Primary Production of Inland Aquatic Ecosystems. In Primary Productivity of the
Biosphere. Leath, H., and R.H. Whittaker [eds]. New Mexico Administrative Code (NMAC). 2005. State of New Mexico Standards for Interstate
and Intrastate Streams. 20.6.4. New Mexico Water Quality Control Commission. As amended through July 17, 2005. (20.6.4 NMAC)
New Mexico Environment Department/Surface Water Quality Bureau (NMED/SWQB). 2004a.
Quality Assurance Project Plan for Water Quality Management Programs. Surface Water Quality Bureau. Santa Fe, NM.
NMED/SWQB. 2004b. State of New Mexico 2004-2006 Clean Water Act Integrated §303(D)/
§305(B)List of Assessed Waters. December. Santa Fe, NM. Omernik, J.M., and Griffith, G. 2005. Level III & IV Ecoregions of New Mexico. U.S. EPA National Health and Environmental Effects Laboratory, Corvallis, Or.
Potter, D.U. 1983. Classification Study of Quemado Lake. In New Mexico Clean Lakes
Program Classification Phase II: Restoration and Management Recommendations for Selected Priority Lakes, Final Report. EID/WPC-83/9. 120 p. plus appendix.
National Resource Conservation Service. SNOTEL precipitation data at:
http://www.wcc.nrcs.usda.gov/snotel/New_Mexico/new_mexico.html U.S.D.A. Forest Service. 2004. San Pedro Parks Wilderness , Fisheries, Arizona Willow and
Water Quality Monitoring. Santa Fe, New Mexico. p. 85.