landsat—a global land-imaging mission - usgs
TRANSCRIPT

U.S. Department of the InteriorU.S. Geological Survey
Fact Sheet 2012–3072Revised May 2013
Landsat—A Global Land-Imaging MissionSince 1972, Landsat satellites have continuously acquired
space-based images of the Earth’s land surface, coastal shal-lows, and coral reefs. The Landsat Program, a joint effort of the U.S. Geological Survey (USGS) and the National Aeronautics and Space Administration (NASA), was established to routinely gather land imagery from space. NASA develops the remote-sensing instruments and spacecraft, then launches and validates the performance of the instruments and satellites. The USGS then assumes ownership and operation of the satellites, in addi-tion to managing all ground reception, data archiving, product generation, and distribution. The result of this program is a long-term record of natural and human-induced changes on the global landscape (table 1).
History of the Landsat ProgramIn the mid-1960s, stimulated by U.S. successes in plan-
etary exploration using unmanned remote-sensing satellites, the Department of the Interior, NASA, and the Department of Agriculture embarked on an ambitious effort to develop and launch the first civilian Earth observation satellite. Their goal was achieved on July 23, 1972, with the launch of Landsat 1, originally named “ERTS” for Earth Resources Technology
Satellite. Landsat satellites have since provided worldwide sci-ence and resource-management communities with an archive of space-based land remotely sensed data—a valuable resource for people who work in agriculture, geology, forestry, education, regional planning, mapping, and global change research.
Figure 1. Landsat 8 satellite.

The Landsat Data Continuity Mission (LDCM, renamed Landsat 8) (fig. 1), launched on February 11, 2013, joins Landsat 7 (fig. 2) in capturing hundreds of images of the Earth’s surface each day to ensure continuity of data acquisitions to add to the Landsat archive.
The USGS also co-leads the Landsat Science Team that provides technical and scientific input to USGS and NASA to help ensure the success of the Landsat program while providing science support on issues including data acquisition, product access and format, and science and applications opportunities.
Characteristics of the Landsat SystemLandsat satellites image the Earth’s surface along the satel-
lite’s ground track in a 185-kilometer-wide (115-mile-wide) swath as the satellite moves in a descending orbit (moving from north to south) over the sunlit side of the Earth.
Landsat 7 and Landsat 8 orbit the Earth at 705 kilometers (438 miles) altitude. They each make a complete orbit every 99 minutes, complete about 14 full orbits each day, and cross every point on Earth once every 16 days. Although each satellite has a 16-day full-Earth-coverage cycle, their orbits are offset to allow 8-day repeat coverage of any Landsat scene area on the globe. Landsat 4 and 5 also followed this orbit. Landsats 1, 2, and 3 orbited at an altitude of 920 kilometers (572 miles), circling the Earth every 103 minutes yielding repeat coverage every 18 days.
The primary sensor onboard Landsats 1, 2, and 3 was the Multispectral Scanner (MSS), with an image resolution of approximately 80 meters in four spectral bands ranging from the visible green to the near-infrared (IR) wavelengths (table 2).
The improved Thematic Mapper (TM) sensors onboard Landsats 4 and 5 were designed with several additional bands in the shortwave infrared (SWIR) part of the spectrum; improved spatial resolution of 30 meters for the visible, near-IR, and SWIR bands; and the addition of a 120-meter thermal-IR band. Landsat 7 carries the Enhanced Thematic Mapper Plus (ETM+), with 30-meter visible, near-IR, and SWIR bands, a 60-meter thermal band, and a 15-meter panchromatic band (table 3).
Improved Data from Landsat 8Landsat 8 (fig. 1) ensures the continued acquisition and
availability of Landsat data, which will be consistent with cur-rent standard Landsat data products. About 400 scenes will be acquired each day. All scenes are processed to data products and are available for download within 24 hours of reception and archiving.
Landsat 8 carries two push-broom sensors: the Operational Land Imager (OLI) and Thermal Infrared Sensor (TIRS), both of which provide improved signal to noise ratio and 12-bit radiometric quantization of the data.
Figure 3. Landsat 8 Operational Land Imager (OLI) relative spectral response functions.
1.0
0.9
0.7
0.5
0.6
0.4
0.3
0.2
0.1
0.2 0.4 0.6 0.8 1.0 1.2 1.4 1.6 1.8 2.0 2.2 2.40
0.8
0Wavelength, in microns
Refle
ctan
ce
1 2 3 48 5 9 6 7Bands
Figure 2. Landsat 7 satellite.
Table 1. Landsat mission dates.
Satellite Launch Decommissioned SensorsLandsat 1 July 23, 1972 January 6, 1978 MSS/RBVLandsat 2 January 22, 1975 July 27, 1983 MSS/RBVLandsat 3 March 5, 1978 September 7, 1983 MSS/RBVLandsat 4 July 16, 1982 June 15, 2001 MSS/TMLandsat 5 March 1, 1984 2013 MSS/TMLandsat 6 October 5, 1993 Did not achieve orbit ETMLandsat 7 April 15, 1999 Operational ETM+Landsat 8 February 11, 2013 Operational OLI/TIRS
Table 2. MSS band designations.Landsats 1,2,3spectral bands
Landsats 4,5 spectral bands
Wavelength (micrometers)
Resolution (meters)
Use
Band 4–green Band 1–green 0.5–0.6 80 Emphasizes sediment-laden water and delineates areas of shallow water.Band 5–red Band 2–red 0.6–0.7 80 Emphasizes cultural features.Band 6–near IR Band 3–near IR 0.7–0.8 80 Emphasizes vegetation boundary between land and water, and landforms.Band 7–near IR Band 4–near IR 0.8–1.1 80 Penetrates atmosphere haze best; emphasizes vegetation, boundary between land
and water, and landforms.Instrument-specific relative spectral response functions may be viewed and compared using the Spectral Viewer tool: http://landsat.usgs.gov/tools_spectralViewer.php.
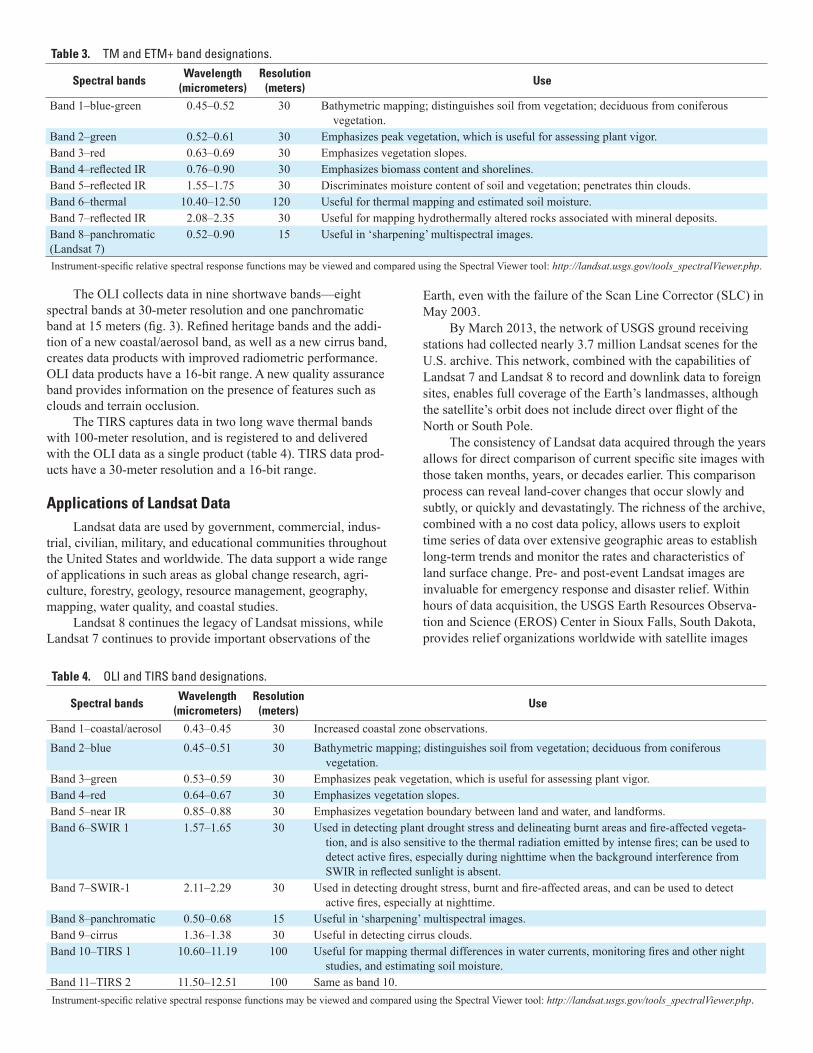
The OLI collects data in nine shortwave bands—eight spectral bands at 30-meter resolution and one panchromatic band at 15 meters (fig. 3). Refined heritage bands and the addi-tion of a new coastal/aerosol band, as well as a new cirrus band, creates data products with improved radiometric performance. OLI data products have a 16-bit range. A new quality assurance band provides information on the presence of features such as clouds and terrain occlusion.
The TIRS captures data in two long wave thermal bands with 100-meter resolution, and is registered to and delivered with the OLI data as a single product (table 4). TIRS data prod-ucts have a 30-meter resolution and a 16-bit range.
Applications of Landsat DataLandsat data are used by government, commercial, indus-
trial, civilian, military, and educational communities throughout the United States and worldwide. The data support a wide range of applications in such areas as global change research, agri-culture, forestry, geology, resource management, geography, mapping, water quality, and coastal studies.
Landsat 8 continues the legacy of Landsat missions, while Landsat 7 continues to provide important observations of the
Earth, even with the failure of the Scan Line Corrector (SLC) in May 2003.
By March 2013, the network of USGS ground receiving stations had collected nearly 3.7 million Landsat scenes for the U.S. archive. This network, combined with the capabilities of Landsat 7 and Landsat 8 to record and downlink data to foreign sites, enables full coverage of the Earth’s landmasses, although the satellite’s orbit does not include direct over flight of the North or South Pole.
The consistency of Landsat data acquired through the years allows for direct comparison of current specific site images with those taken months, years, or decades earlier. This comparison process can reveal land-cover changes that occur slowly and subtly, or quickly and devastatingly. The richness of the archive, combined with a no cost data policy, allows users to exploit time series of data over extensive geographic areas to establish long-term trends and monitor the rates and characteristics of land surface change. Pre- and post-event Landsat images are invaluable for emergency response and disaster relief. Within hours of data acquisition, the USGS Earth Resources Observa-tion and Science (EROS) Center in Sioux Falls, South Dakota, provides relief organizations worldwide with satellite images
Table 3. TM and ETM+ band designations.
Spectral bandsWavelength
(micrometers)Resolution
(meters)Use
Band 1–blue-green 0.45–0.52 30 Bathymetric mapping; distinguishes soil from vegetation; deciduous from coniferous vegetation.
Band 2–green 0.52–0.61 30 Emphasizes peak vegetation, which is useful for assessing plant vigor.Band 3–red 0.63–0.69 30 Emphasizes vegetation slopes.Band 4–reflected IR 0.76–0.90 30 Emphasizes biomass content and shorelines.Band 5–reflected IR 1.55–1.75 30 Discriminates moisture content of soil and vegetation; penetrates thin clouds.Band 6–thermal 10.40–12.50 120 Useful for thermal mapping and estimated soil moisture.Band 7–reflected IR 2.08–2.35 30 Useful for mapping hydrothermally altered rocks associated with mineral deposits.Band 8–panchromatic (Landsat 7)
0.52–0.90 15 Useful in ‘sharpening’ multispectral images.
Instrument-specific relative spectral response functions may be viewed and compared using the Spectral Viewer tool: http://landsat.usgs.gov/tools_spectralViewer.php.
Table 4. OLI and TIRS band designations.
Spectral bandsWavelength
(micrometers)Resolution
(meters)Use
Band 1–coastal/aerosol 0.43–0.45 30 Increased coastal zone observations.Band 2–blue 0.45–0.51 30 Bathymetric mapping; distinguishes soil from vegetation; deciduous from coniferous
vegetation.Band 3–green 0.53–0.59 30 Emphasizes peak vegetation, which is useful for assessing plant vigor.Band 4–red 0.64–0.67 30 Emphasizes vegetation slopes.Band 5–near IR 0.85–0.88 30 Emphasizes vegetation boundary between land and water, and landforms.Band 6–SWIR 1 1.57–1.65 30 Used in detecting plant drought stress and delineating burnt areas and fire-affected vegeta-
tion, and is also sensitive to the thermal radiation emitted by intense fires; can be used to detect active fires, especially during nighttime when the background interference from SWIR in reflected sunlight is absent.
Band 7–SWIR-1 2.11–2.29 30 Used in detecting drought stress, burnt and fire-affected areas, and can be used to detect active fires, especially at nighttime.
Band 8–panchromatic 0.50–0.68 15 Useful in ‘sharpening’ multispectral images.Band 9–cirrus 1.36–1.38 30 Useful in detecting cirrus clouds.Band 10–TIRS 1 10.60–11.19 100 Useful for mapping thermal differences in water currents, monitoring fires and other night
studies, and estimating soil moisture.Band 11–TIRS 2 11.50–12.51 100 Same as band 10.Instrument-specific relative spectral response functions may be viewed and compared using the Spectral Viewer tool: http://landsat.usgs.gov/tools_spectralViewer.php.

for disaster response, as well as image-derived products that incorporate information on population density, elevation, and other environmental factors.
Landsat 7 ETM+ —Scan Line Corrector FailureOn May 31, 2003, unusual artifacts began to appear within
the data collected by the ETM+ instrument onboard Landsat 7. The problem was caused by failure of the Scan Line Corrector (SLC), which compensates for the forward motion of the satel-lite to align forward and reverse scans necessary to create an image. Efforts to recover the SLC were unsuccessful. Without an operating SLC, the line of sight traces a zigzag pattern along the satellite ground track with resulting data gaps that form alternating wedges that increase in width from the center of the image to the edge. Landsat 7 is still capable of acquiring highly geometrically and radiometrically accurate data worldwide. The USGS has provided the user community with methods to fill gaps in a Landsat 7 scene. Whether or not they choose to fill the gaps, many users continue to find Landsat 7 data useful.
InformationAll Landsat data held in the USGS archives are available
for download at no charge and with no user restrictions from EarthExplorer http://earthexplorer.usgs.gov or GloVis http://glovis.usgs.gov. For information about Landsat operations, technology, and product specifications, visit http://landsat.usgs.gov, or contact:
USGS EROS Landsat Customer ServiceMundt Federal BuildingSioux Falls, SD 57198Telephone: 605–594–6151 Fax: 605–594–6589Email: [email protected]
For information about the USGS Land Remote Sensing Program, visit http://remotesensing.usgs.gov.
For additional information about the USGS, visit http://www.usgs.gov or http://ask.usgs.gov.
The Great Salt Lake in Utah. Each image was created by mosaicking four Landsat scenes. The left image represents the area in August 1985; the right image in September 2010.
Dam construction and progression of deforestation in Rondônia, Brazil. The image on the left was acquired on June 24, 1984; the right image on August 6, 2011.