latinos in lowell
TRANSCRIPT

University of Massachusetts BostonScholarWorks at UMass Boston
Gastón Institute Publications Gastón Institute for Latino CommunityDevelopment and Public Policy Publications
1-1-1992
Latinos in LowellGaston Institute, University of Massachusetts Boston
Follow this and additional works at: http://scholarworks.umb.edu/gaston_pubsPart of the Demography, Population, and Ecology Commons, and the Race and Ethnicity
Commons
This Research Report is brought to you for free and open access by the Gastón Institute for Latino Community Development and Public PolicyPublications at ScholarWorks at UMass Boston. It has been accepted for inclusion in Gastón Institute Publications by an authorized administrator ofScholarWorks at UMass Boston. For more information, please contact [email protected].
Recommended CitationGaston Institute, University of Massachusetts Boston, "Latinos in Lowell" (1992). Gastón Institute Publications. Paper 13.http://scholarworks.umb.edu/gaston_pubs/13
Latinos in Lowell Part of a Series of Profiles of Latinos in Massachusetts Completed with Support from the Boston Foundation.
The Mauricio Gaston Institute for Latino Community Development and Public Policy
T he Mauricio Gaston Institute for Latino Community Development and Public Policy was established at the University of Massachusetts at Boston in December of 1989. The creation of the Gaston Institute responds
to the need for better understanding of the experience and conditions of life of Latinos in the Commonwealth! Its purpose is to conduct research about the Latino population in Massachusetts and to develop the kind of information and analysis necessary for the development of sound public policy and for the effective participation of the Latino population in public policy development in the Commonwealth. In an effort to facilitate access to vital information about Latinos to various audiences, and with support from the Boston Foundation, the Gaston Institute has produced a series of basic demographic profiles for selected cities in the Commonwealth based on the 1990 United States Census. These profiles are but one part of the Gaston Institute's broader initiative to disseminate the 1990 United States Census and to address other relevant aspects of the social and economic situation of Latinos in the Commonwealth.
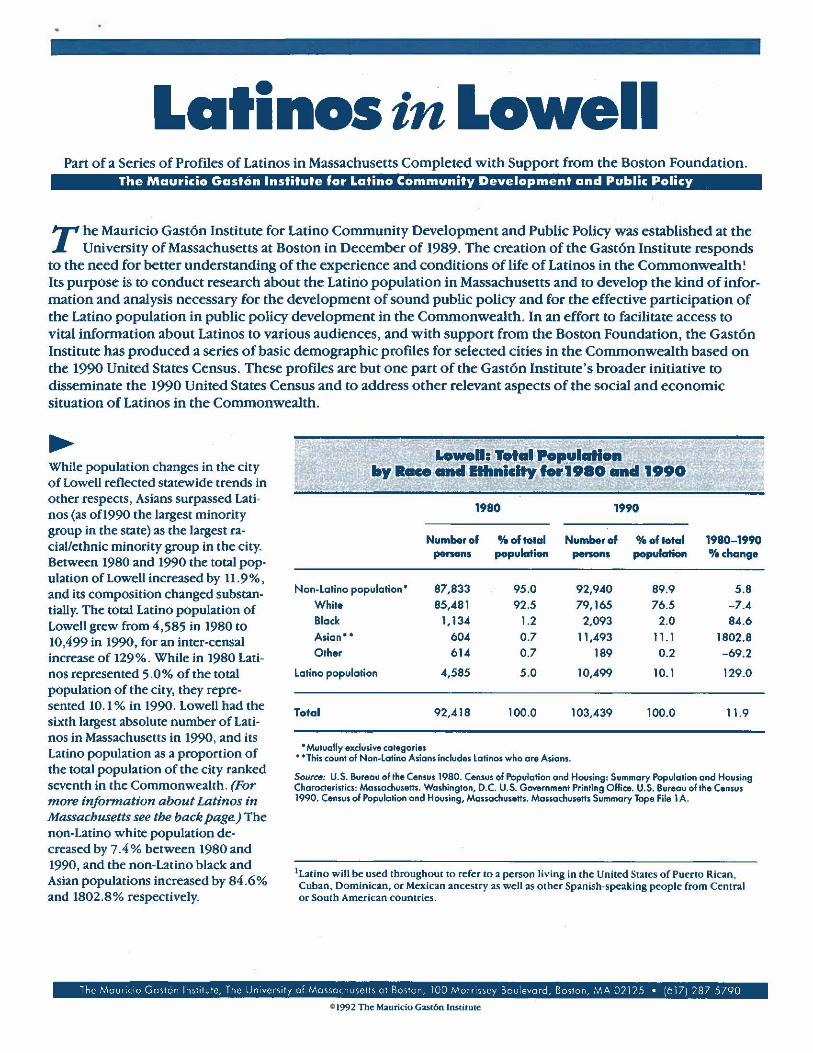
While population changes in the city of Lowell reflected statewide trends in other respects, Asians surpassed Lati· nos (as of1990 the largest minority group in the state) as the largest racial/ethnic minority group in the city_ Between 1980 and 1990 the total population of Lowell increased by 11.9 %, and its composition changed substantially. The total Latino population of Lowell grew from 4,585 in 1980 to 10,499 in 1990, for an inter-censal increase of 129%. While in 1980 Latinos represented 5.0 % ofthe total population of the city, they represented 10.1 % in 1990. Lowell had the sixth largest absolute number of Latinos in Massachusetts in 1990, and its Latino population as a proportion of the total population of the city ranked seventh in the Commonwealth. (For more information about Latinos in Massachusetts see the back page.) The non-Latino white population decreased by 7.4 % between 1980 and 1990, and the non-Latino black and Asian populations increased by 84.6% and 1802.8% respectively.
1980
Number of % of tolal persons population
Non-Latino population· 87,833 95.0 White 85,-481 92.5 Black 1,134 1.2 Asian" 604 0.7 Other 614 0.7
latino population 4,585 5.0
Total 92,418 100.0
• Mutually exclusive categories
1990
Number 01 % 01 lotal penons popu~n
92,940 89.9 79,165 76.5
2,093 2.0 11,493 11.1
189 0.2
10,499 10.1
103,-439 100.0
• -This count of Non-Latino Asians includes Latinos who ore Asians.
1980-1990 0/0 change
5.8 -7.4 84.6
1802.8 -69.2
129.0
11.9
Source: U.S. Bureau afthe Census 1980. Census of Population and Housing: Summary Population and Housing Characteristics: Mouochusetts. Washington, D.C. U.S. Government Printing Office. U.S. Bureau of the Census 1990. Census of Population and Housing, Mossachusetts. Mossachusetts Summary Tape File lA.
lLatino will be used throughom to refer to a person living in the United States of Puerto Rican . Cuban, Dominican, or Mexican ancestry as well as other Spanish-speaking people from Central or South American countries.
The MaUrICIO Gaston Inst itute, The Univers ity of Massachusetts at Boston, 100 MOrrissey Boulevard, Boston, MA 02125 • (6 17) 287 5790
Cl992 The Mauricio Gast6n Institute

~n: c._posltlo. 0 ........ Popul ..... ,.
Puerto Ricans and " Other" Latinos were the major Latino subgroups in Lowell . Making up this " Other" category are Latinos from the Dominican Republic, Central and South America, While the absolute number of both Puerto Ricans and "Other" Latinos more than doubled between 1980 and 1990, their proportion in relation to the total Latino population remained almost the same. The share of "Other" Latinos increased from 18.5% in 1980 to 23.9% in 1990.
by N ...... I 0""" for 1980 _II 1990
Under 16 years old 16- 24 25-34 35- 44 45- 54 55-64 0 .... r65
Total
Median age
1980 1990 N ........ r % Number %
Mexican 117 2.6 153 1.5 Puerto Rican 3,528 76.9 7,732 73.6 Cuban 91 2.0 100 1.0 Other 849 18.5 2,514 23 .9
Total 4,585 100.0 10,499 100.0
Source: U.S. Bureau of ,h. Census 1980 and 1990.
90%
SO
70
60 50
AO
30
20
10
Mexican
, , ~~I LiItIno ~ul""n"y Onlln
(Percent of totalla~no. in 1980-1990) ,
.'
Puerto Rican Cuban
0.i9i", • 1980 D 1990
~I: Latino Population "y Ago' for 1980 _II 1990
1980 Number % Nu .......
1,989 43.4 4,067 958 20.9 1,888 720 15.7 2,058 429 9.4 1, 162 233 5.1 692 135 2.9 342 121 2.6 290
4,585 100.0 10,499
18.6 21.6
1990 0/,
38.7 18.0 19.6 11.1 6.6 3.3 2.8
100.0
1980-1990 %cha ...
104.5 97.1
185.8 170.9 197.0 153.3 139.7
129.0
1980-1990 %chang8
Other
30.8 119.2
9.9 196.1
129.0
• .
Source .. U.S. Bureau of ,h. C.nSU$ 1980 and 1990.
The Latino population in the City of Lowell, while remaining relatively young, became older in general. Latino median age increased from 18.6 years in 198010 21 .6 years in 1990. While Latinos 24 years of age or younger represented 64. 3 % of the to tal Latino population in 1980, they represented 56.7 % in 1990. Conversely, for the same period, the percentage of Latinos between 25 and 54 years of age increased from 30.2 % 10 37.3%, and the percentage of Latinos 55 years of age and older increased slightly from 5.5% to 6 .1 %.
50%
Under 16 years old
~Ih LatIno ............. y Ago (Percent of totalla~no. in 1980-1990)
16- 24 25-34 35-44 45-54 55-64
Age: .1980 D 1990
Over 65
211 Is not possible to disaggregate the " Other" L:nino category so as 10 differentiate the share of [hose individuals from the Dominican Republic, South and Ccncral American countries. Still unpublished 1990 u.s. Census dau by nativity would further permit some degree o f differenti2tion.

&.owelli: Composition of Male LatIno Pop.aatl_ by ,... for 1980 and 1990
1980 1990 Nu ....... % Number %
1980-1990 'lachang.
U nde, 16 years old 1,258 56.5 2,027 39.9 61.1 16-24 211 9.5 888 17.5 320.9 25-34 331 14.9 999 19.7 201.8 35-44 200 9.0 546 10.8 173.0 45-54 104 4.7 345 6.8 231.7 55-64 70 3.1 146 2.9 108.6 Ove,65 54 2.4 123 2.4 127.8
Total 2,228 100.0 5,074 100.0 127.7
Median age 17.8 21.2
Saure. : U.S. Bureau ofth. Census 1980 and 1990.
~: c._poslti_ of F ....... LatIn. Popel""n by Ago for 1980 _d 1990
1980 1990 Number % Number %
1980-1990 %chang8
Under 16 years old 731 31.0 2,040 37.6 179. 1 16-24 747 31.7 1,000 18.4 33.9 25-34 389 16.5 1,059 19.5 172.2 35- 44 229 9.7 616 11.4 169.0 45- 54 129 5.5 347 6.4 169.0 55- 64 65 2.8 196 3.6 201.5 Ove,65 67 2.8 167 3.1 149.3
Total 2,357 100.0 5,425 100.0 130.2
Madianoge 19.4 22.1
Scurce: U.S. BureouoftheC4fflsus 198001'1d 1990.
[n general , the median age of both Latino males and females increased in Lowell, although Latino females continued to be relatively older than Latino males. Median age for Latino males increased from 17.8 years in [980 to 21.2 years in 1990, and the median age for Latino females increased from 19.4 years to 22.1 years.
~ Low.11: Latino Population by The composition of Lowell 's Latino H.us.hold Typ. for 1980 and 1990 population by household did change, although not dramatically. Among 1980 1990 the most evident changes were a de-
1980-1990 cline in the share of married-couple Nu ....... % Number % households with and without related
%chang8
children, an increase in the share of male-headed households, and an Married-couple family 382 30.2 787 25.4 106.0
increase in the share of householders with related children
Married-couple family, 149 11.8 310 10.0 108. 1 living alone or with other unrelated no related children individuals . Contrary to commonly Mole hou~holder. 70 5.5 198 6.4 182.9 held views, the percentage of female- no wife present, with or
headed households with and without without related children
related children did not increase dra- Femal. householder, 390 30.8 1,039 33 .5 166.4
matically during thiS period. no husband present, with related children
Female householder, 36 2.8 110 3.5 205 .6 no husband present, no related children
Householder living olone 188 14.8 522 16.8 177.7 Householder not living alone 51 4.0 137 4.4 168.6
Total 1,266 100.0 3,103 100.0 145.1
Source: U.S. Bureau of the Census 1980 and 1990.

Latinos in Massachusetts The following charts correspond directly to those on the previous pages and offer a quick reference to the population, age and household status of Latinos in Massachusetts. [n brief: • The total population of Massachusetts increased from
5,737,037 in 1980 to 6,016,425, with Latinos growing in absolute number more than any other racial/ethnic group, becoming the largest minority group in the Commonwealth.
• Puerto Ricans and "Other" Latinos were the largest Latino subgroups in the state, accounting respectively for 2.5% and 1.9% of the total population. (Latinos in the "Other" category are from the Dominican Republic, Central and South America.)
• The Latino population, while remaining relatively young, became older in general, with the Latino median age increasing from 21.2 years in 1980 to 23.7 years in 1990.
• The median age of both Latino males and females increased between 1980 and 1990, with the median age for Latino males increasing from 20.3 years in 1980 to 23.1 years in 1990, and Latino females' median age increasing from 22.2 years to 24.3 years.
M ........ u_. C ... p ............... Populllll_ loy ..... JItIuoIc Group .......... Populatloa loy
NaIl ..... 0fttIIII for 19 ....... 199.
1980 1990
Number % Number % 1980-1990 %cha_
Non-Lotino - white 5,305,963 92.5 5,280,292 87.8 - 0.5 Non-Latino - black 212,608 3.7 274,464 A.6 29.1 Non-latino - Asian 49,501 0.9 143,392 2.40 189.7 lotino origin 141,043 2.5 287,549 A.8 103.9
Mexican 7,385 0.1 12,703 0.2 72.0 Puerto Ricon 76,450 1.3 151,193 2.5 97.8 Cuban 6,617 0.1 8,106 0.1 22.5 Other 50,591 , 0.9 115,547 1.9 128.4
Total Populotion 5,737,037 100.0' 6,016,425 100.0< 4.9
o This coun' of Non-Latino Asians includes latinos who are Asians. In 1980, 892lolinos (0 6% of olilalinos) identified their race as Asian in MO$Sochuselh.
b Th. 198010101 population include' 27,922 perwns who (lr. of other races ond not of Latino origin.
( Th. 1990 lotal population includes 30,728 persons who are of other races and not of Latino origin.
Source; U.S. Bureau of th. Census 1980. Census of PopulCltion ond Housing' SummClry Populotion one! Housing Choraderistics: M05SochuseHs. Woshington, D.C. U.S. Government Printing Office. U.S. BUnlou of the Census 1990. Census of Population and Housing, MO$SClchusetts. MossochuseHs Summory Tope File lAo
Married-couple family with related children
Morried-couple family, no related children
Male householder, no wife present, with or without related children
Female householder, no husband present, with related children
Female householder, no husband present, no related children
Householder living alone-
Householder not living alone
Total Source: U.S. Bu~u ofthe Census 1980 ond 1990. "In 1980, this category includes non_family householders (living alone or nOI)
Ma ....... .... LaII_ PopuIatl ... 1oy ... .... 19 ....... 199.
1980 1990
Number % Number % 1980-1990 %""'-
Under 16 years old 53,503 37.9 97,135 33.8 181.6 16-24 28,477 20.2 55,042 19.1 193.3 25-34 24,655 17.5 59,333 20.6 140.7 35-4A 14,531 10.3 35,774 12.4 146.2 45-5A 8,809 6.2 19,081 6.6 116.6 55-64 5,915 4.2 10,731 3.7 81.4 Over 65 5,153 3.7 10,453 3.6 102.9 Tofol 141,043 100.0 287,549 100.0 103.9
Median age 21.2 23.7 Sourctt: U.S. Bureau of the Census 1980 ond 1990.
MauacIou_ •• Compoalll ... " Mal. LaII_ Populatl ... 1oy Age for 19 ....... 199.
1980 1990
Number % Number % 1980-1990 % change
Under 16 years o ld 27,378 40.0 49,663 34.9 81.4 16- 2A 13,801 20.2 27,685 19.4 100.6 25-34 11,610 17.0 29,633 20.8 155.2 35-A4 6,687 9.8 17,460 12.3 161.1 45-5A 4,117 6.0 9,000 6.3 118.6 55-6A 2,660 3.9 4,885 3.4 83.6 Over 65 2,133 3.1 4,137 2.9 94.0
Totol 68,386 100.0 142,463 100.0 108.3
Median age 20.3 23.1 Soumt: U.S. Bureau of the Census 1980 and 1990.
..... ~ ...... ,C ............. ...... LaII~ •• p.I*!' .... 1oy ... for 19 ....... 1990
1980 1990
Number % Number % 1980-1990 % change
Under 16 years aid 26,125 36.0 47,472 32.7 81.7 16-2A 14,676 20.2 27,357 18.9 86.4 25- 3A 13,045 18.0 29,700 20.5 127.7 35- 44 7,844 10.8 18,314 12.6 133.5 45-54 4.692 6.5 10,081 6.9 114.9 55-6A 3,255 4.5 5.846 4.0 79.6 Over 65 3,020 4.2 6,316 4.A 109.1
Tofol 72,657 100.0 145,086 100.0 99.7
Median age 22.2 24.3 Sourc.: U.S. Bureou of the Census 1980 and 1990.
1980 1990
Number % Nu ........ % 1980-1990 %cha_
12,648 31.5 20,371 24.9 70.2 5,995 14.9 10,201 12.5 222.9 1.600 4.0 5,166 6.3 145.0 9,449 23.6 23,150 28.4 115.9 1,725 4.3 3,725 4.6 53.4 8,689 21.7 13,330 16.3 53.4
5,706 7.0
40,106 100.0 81,649 100.0 103.6
The Maur ICIO Gaston 1r),l ltute, The Un verS Ify of Mo"ochuselfs 01 Boston, 100 Morr ls,ey Bou levord, Boslor), MA 02125 • (617) 287 5790