leadership. execution. results
TRANSCRIPT

Leadership. Execution. Results.2012 Annual Report
08 09 10 11 12
120
%
26
5%
97%
68
%
118
%
08 09 10 11 12
4.7
1
2.4
6
2.5
0
3.9
6 4.3
8
$6
,111
$4
,62
4
$5
,06
4
$6
,12
6 $6
,579
08 09 10 11 12
$3
46
$18
0 $2
11
$3
33 $
36
9
08 09 10 11 12 08 09 10 11 12
120
%
26
5%
97%
68
%
118
%
08 09 10 11 12
4.7
1
2.4
6
2.5
0
3.9
6 4.3
8
$6
,111
$4
,62
4
$5
,06
4
$6
,12
6 $6
,579
08 09 10 11 12
$3
46
$18
0 $2
11
$3
33 $
36
9
08 09 10 11 12
Net Sales (in millions)
Free Cash Flow 1 (as a percent of net income)
Diluted EPS 1Income from Operations (EBIT)1 (in millions)
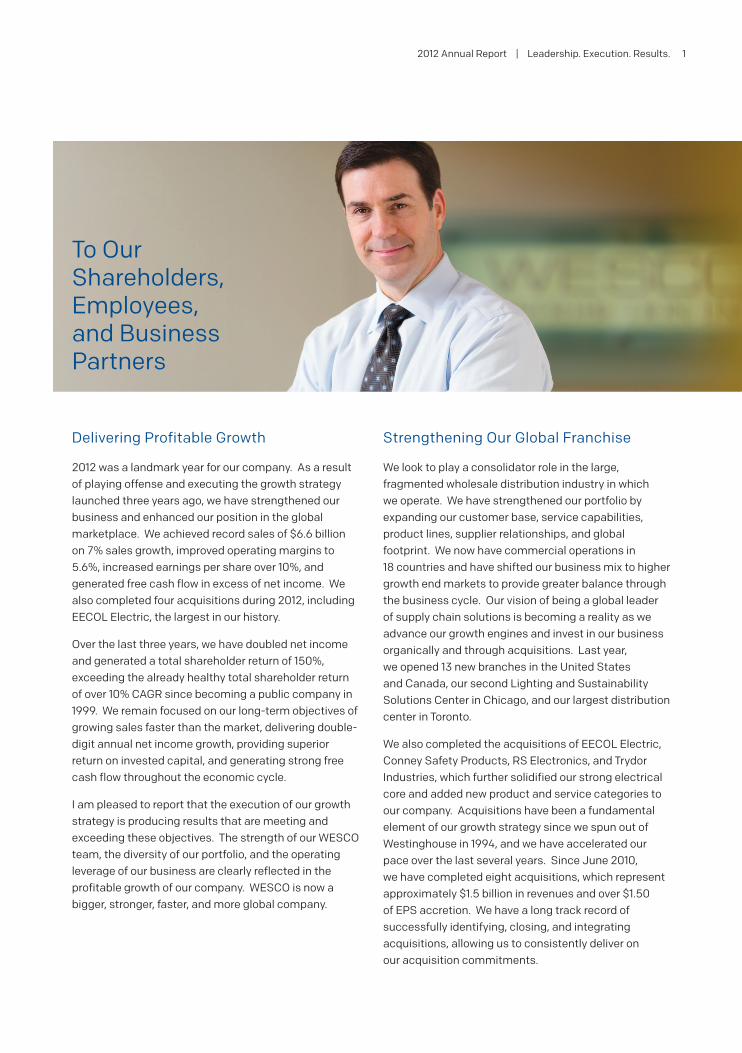
COMPARISON OF 5 YEAR CUMULATIVE TOTAL RETURN
25
50
75
100
125
150
175
2007 2008 2009 2010 2011 2012
WESCO
Performance Peer Group 2
Russell 2000 Index
16.3
27.21 YEAR
12.2
35.63 YEAR
3.5
11.2
5 YEAR
9.7
28.510 YEAR
WESCORussell 2000 Index
Year Ended December 31 2008 2009 2010 2011 2012 (in millions except for Diluted EPS and ROIC)
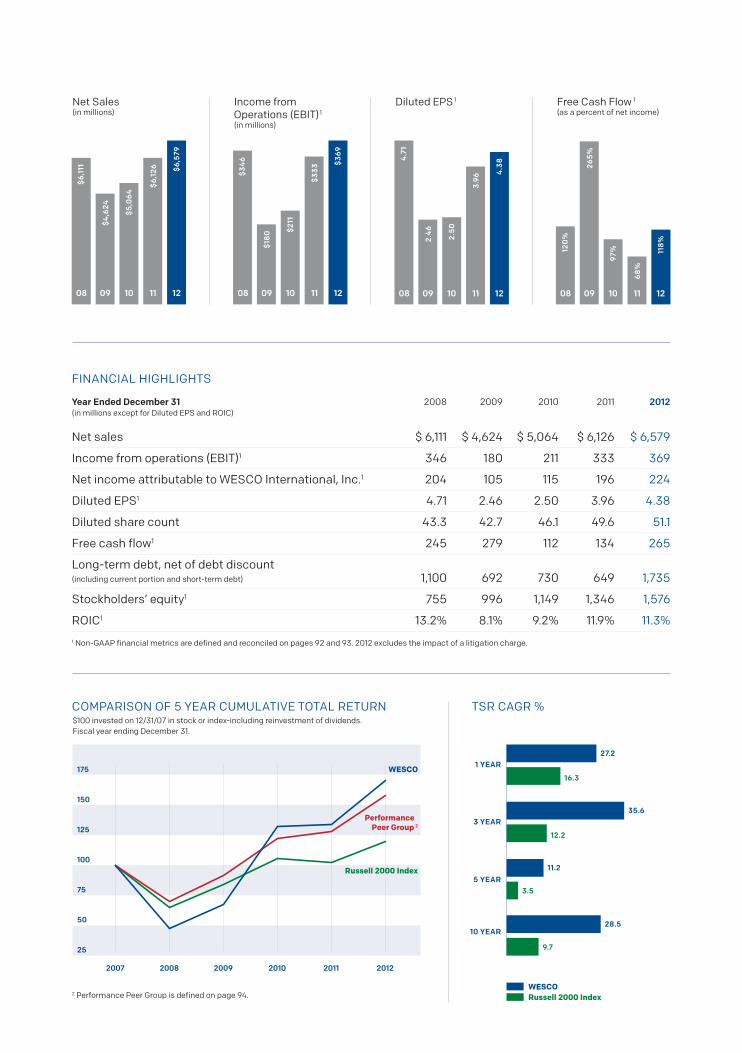
Net sales $ 6,111 $ 4,624 $ 5,064 $ 6,126 $ 6,579
Income from operations (EBIT)1 346 180 211 333 369
Net income attributable to WESCO International, Inc.1 204 105 115 196 224
Diluted EPS1 4.71 2.46 2.50 3.96 4.38
Diluted share count 43.3 42.7 46.1 49.6 51.1
Free cash flow1 245 279 112 134 265
Long-term debt, net of debt discount (including current portion and short-term debt) 1,100 692 730 649 1,735
Stockholders’ equity1 755 996 1,149 1,346 1,576
ROIC1 13.2% 8.1% 9.2% 11.9% 11.3%
1 Non-GAAP financial metrics are defined and reconciled on pages 92 and 93. 2012 excludes the impact of a litigation charge.
2 Performance Peer Group is defined on page 94.
FINANCIAL HIGHLIGHTS
$100 invested on 12/31/07 in stock or index-including reinvestment of dividends. Fiscal year ending December 31.
TSR CAGR %
25
50
75
100
125
150
175
2007 2008 2009 2010 2011 2012
WESCO
Performance Peer Group 2
Russell 2000 Index
16.3
27.21 YEAR
12.2
35.63 YEAR
3.5
11.2
5 YEAR
9.7
28.510 YEAR
WESCORussell 2000 Index
Delivering Profitable Growth
2012 was a landmark year for our company. As a result of playing offense and executing the growth strategy launched three years ago, we have strengthened our business and enhanced our position in the global marketplace. We achieved record sales of $6.6 billion on 7% sales growth, improved operating margins to 5.6%, increased earnings per share over 10%, and generated free cash flow in excess of net income. We also completed four acquisitions during 2012, including EECOL Electric, the largest in our history.
Over the last three years, we have doubled net income and generated a total shareholder return of 150%, exceeding the already healthy total shareholder return of over 10% CAGR since becoming a public company in 1999. We remain focused on our long-term objectives of growing sales faster than the market, delivering double-digit annual net income growth, providing superior return on invested capital, and generating strong free cash flow throughout the economic cycle.
I am pleased to report that the execution of our growth strategy is producing results that are meeting and exceeding these objectives. The strength of our WESCO team, the diversity of our portfolio, and the operating leverage of our business are clearly reflected in the profitable growth of our company. WESCO is now a bigger, stronger, faster, and more global company.
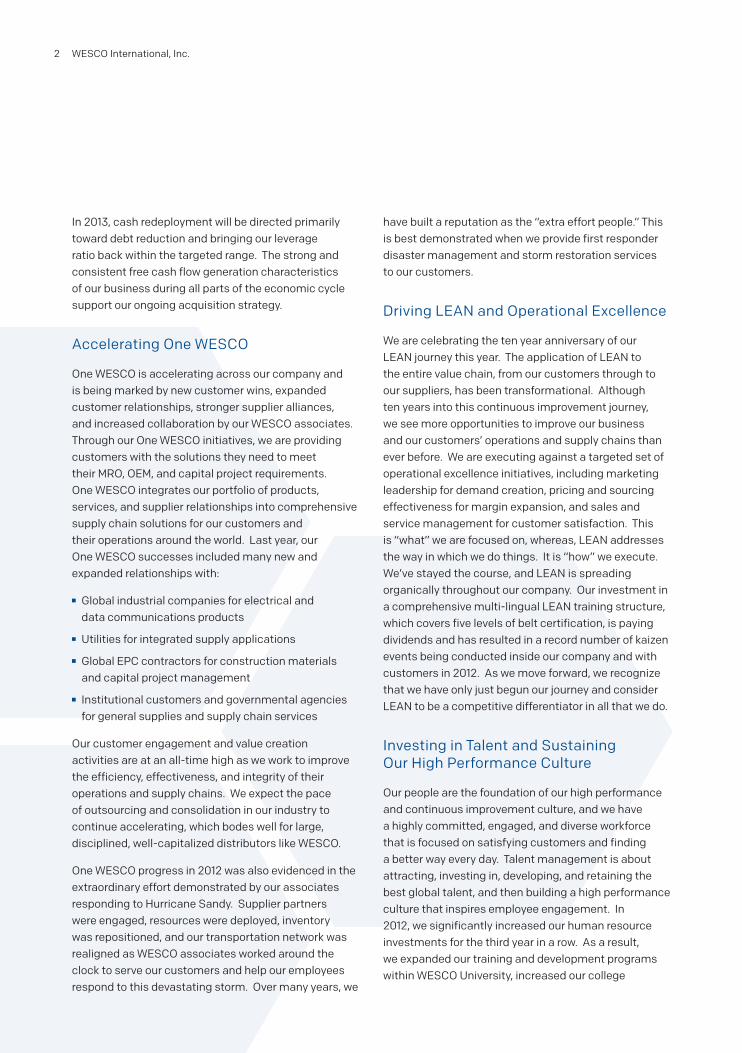
To Our Shareholders, Employees, and Business Partners
Strengthening Our Global Franchise
We look to play a consolidator role in the large, fragmented wholesale distribution industry in which we operate. We have strengthened our portfolio by expanding our customer base, service capabilities, product lines, supplier relationships, and global footprint. We now have commercial operations in 18 countries and have shifted our business mix to higher growth end markets to provide greater balance through the business cycle. Our vision of being a global leader of supply chain solutions is becoming a reality as we advance our growth engines and invest in our business organically and through acquisitions. Last year, we opened 13 new branches in the United States and Canada, our second Lighting and Sustainability Solutions Center in Chicago, and our largest distribution center in Toronto.
We also completed the acquisitions of EECOL Electric, Conney Safety Products, RS Electronics, and Trydor Industries, which further solidified our strong electrical core and added new product and service categories to our company. Acquisitions have been a fundamental element of our growth strategy since we spun out of Westinghouse in 1994, and we have accelerated our pace over the last several years. Since June 2010, we have completed eight acquisitions, which represent approximately $1.5 billion in revenues and over $1.50 of EPS accretion. We have a long track record of successfully identifying, closing, and integrating acquisitions, allowing us to consistently deliver on our acquisition commitments.
2012 Annual Report | Leadership. Execution. Results. 1
In 2013, cash redeployment will be directed primarily toward debt reduction and bringing our leverage ratio back within the targeted range. The strong and consistent free cash flow generation characteristics of our business during all parts of the economic cycle support our ongoing acquisition strategy.
Accelerating One WESCO
One WESCO is accelerating across our company and is being marked by new customer wins, expanded customer relationships, stronger supplier alliances, and increased collaboration by our WESCO associates. Through our One WESCO initiatives, we are providing customers with the solutions they need to meet their MRO, OEM, and capital project requirements. One WESCO integrates our portfolio of products, services, and supplier relationships into comprehensive supply chain solutions for our customers and their operations around the world. Last year, our One WESCO successes included many new and expanded relationships with:
n Global industrial companies for electrical and data communications products
n Utilities for integrated supply applications
n Global EPC contractors for construction materials and capital project management
n Institutional customers and governmental agencies for general supplies and supply chain services
Our customer engagement and value creation activities are at an all-time high as we work to improve the efficiency, effectiveness, and integrity of their operations and supply chains. We expect the pace of outsourcing and consolidation in our industry to continue accelerating, which bodes well for large, disciplined, well-capitalized distributors like WESCO.
One WESCO progress in 2012 was also evidenced in the extraordinary effort demonstrated by our associates responding to Hurricane Sandy. Supplier partners were engaged, resources were deployed, inventory was repositioned, and our transportation network was realigned as WESCO associates worked around the clock to serve our customers and help our employees respond to this devastating storm. Over many years, we
have built a reputation as the “extra effort people.” This is best demonstrated when we provide first responder disaster management and storm restoration services to our customers.
Driving LEAN and Operational Excellence
We are celebrating the ten year anniversary of our LEAN journey this year. The application of LEAN to the entire value chain, from our customers through to our suppliers, has been transformational. Although ten years into this continuous improvement journey, we see more opportunities to improve our business and our customers’ operations and supply chains than ever before. We are executing against a targeted set of operational excellence initiatives, including marketing leadership for demand creation, pricing and sourcing effectiveness for margin expansion, and sales and service management for customer satisfaction. This is “what” we are focused on, whereas, LEAN addresses the way in which we do things. It is “how” we execute. We’ve stayed the course, and LEAN is spreading organically throughout our company. Our investment in a comprehensive multi-lingual LEAN training structure, which covers five levels of belt certification, is paying dividends and has resulted in a record number of kaizen events being conducted inside our company and with customers in 2012. As we move forward, we recognize that we have only just begun our journey and consider LEAN to be a competitive differentiator in all that we do.
Investing in Talent and Sustaining Our High Performance Culture
Our people are the foundation of our high performance and continuous improvement culture, and we have a highly committed, engaged, and diverse workforce that is focused on satisfying customers and finding a better way every day. Talent management is about attracting, investing in, developing, and retaining the best global talent, and then building a high performance culture that inspires employee engagement. In 2012, we significantly increased our human resource investments for the third year in a row. As a result, we expanded our training and development programs within WESCO University, increased our college
WESCO International, Inc.2
recruiting efforts, expanded our mentoring program, and improved our employee reward and recognition programs.
We also conducted our second global employee engagement survey, which reflected a significant increase in the overall engagement score and improvement in all categories measured. We are pleased with these engagement survey results and are making good progress on our goal of being recognized as the employer of choice in the industries we serve.
It is also encouraging to be recognized for our diversity efforts. In 2012, we received the highest designation from 2020 Women on Boards for having at least 20% of our Board of Directors being comprised of women. In addition, the 2012 Catalyst Census of Fortune 500 Women Executive Officers and Top Earners recognized us for having at least 25% women executive officers. We are confident that the investments we are making in our people provide us with the required capacity to continue to grow and strengthen our market position. All of our talent management efforts are based on the belief that our people are our sustainable competitive advantage.
Outlook and Commitments
Our financial objectives are unchanged and remain focused on shareholder value creation. We also recognize that our consistent focus on sustainability, in the products and solutions we deliver to our customers and utilize in our own operations, creates shareholder value. In 2013, we will issue our first Sustainability Report outlining key programs, progress to date, and our plan for further reducing our environmental footprint and helping our customers do the same.
We are a bigger, stronger, faster, and more global Fortune 500 electrical and industrial wholesale distribution company, with a strong business portfolio and a high performance continuous improvement culture. We are playing offense and delivering strong results by taking advantage of the growth opportunities that exist in our large, fragmented industry. While we remain in a time of increased volatility and uncertainty, we continue to be laser focused on what we can control, that is our strategy, our investments, and our execution.
To our customers, thank you for your business and the opportunity to serve you. You have our commitment that we will listen, understand your needs and expectations, and do all that we can to provide you with superior value while we engage in improving the efficiency and effectiveness of your operations and supply chains.
To our employees, thank you for your continued dedication and One WESCO teamwork. You have our pledge to continue to provide a safe work environment where you can grow and succeed and be part of a winning One WESCO team.
To our suppliers, thank you for your partnership and support. Together, we will continue to combine our efforts and resources to provide industry-leading solutions for our customers.
To our shareholders, thank you for your vote of confidence through your investments in WESCO. We’re in the best shape we’ve ever been, and we are committed to consistently generating growth in shareholder value. As always, you will get our very best efforts.
John J. Engel
Chairman, President and Chief Executive Officer
2012 Annual Report | Leadership. Execution. Results. 3

One WESCO integrates
our portfolio of products,
services, and supplier
relationships into
comprehensive supply
chain management
solutions for our
customers and their
operations around
the world.
Operational Excellence Initiatives
Growth Engines
Talent Management
Pricing Effectiveness
Service Excellence
Marketing Leadership
Sourcing Effectiveness
Sales Management
Construction
Utility
Global Accounts & Integrated Supply
Lighting & Sustainability
Acquisitions
International
Government
Communications& Security
WESCO International, Inc.4
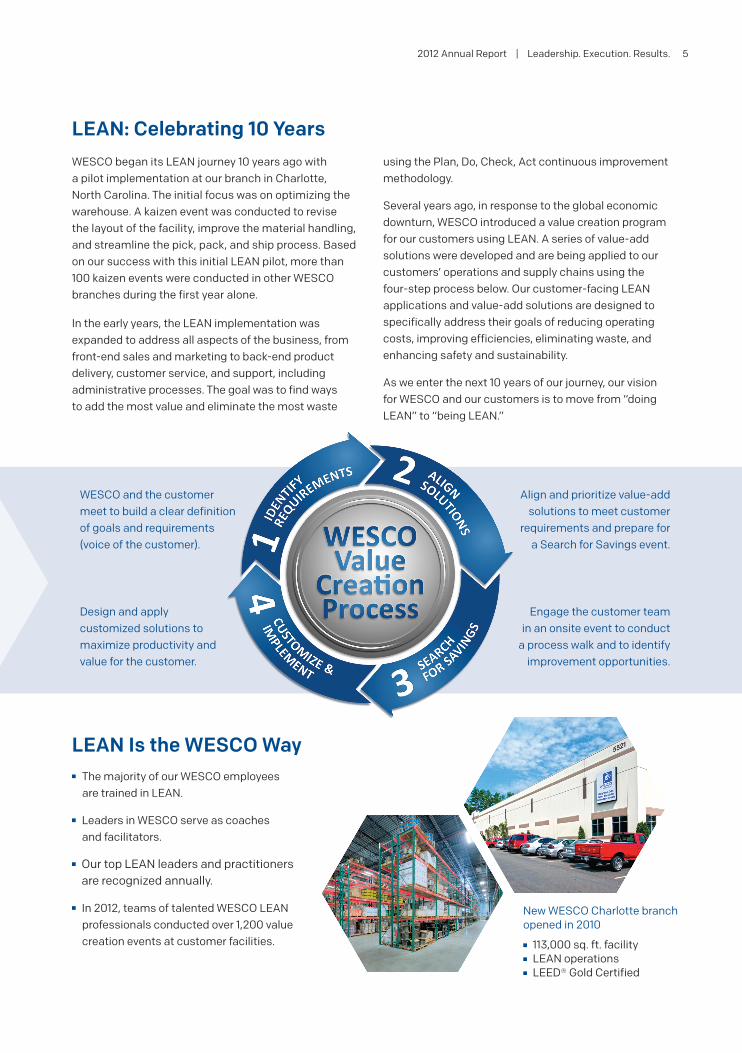
WESCO began its LEAN journey 10 years ago with a pilot implementation at our branch in Charlotte, North Carolina. The initial focus was on optimizing the warehouse. A kaizen event was conducted to revise the layout of the facility, improve the material handling, and streamline the pick, pack, and ship process. Based on our success with this initial LEAN pilot, more than 100 kaizen events were conducted in other WESCO branches during the first year alone.
In the early years, the LEAN implementation was expanded to address all aspects of the business, from front-end sales and marketing to back-end product delivery, customer service, and support, including administrative processes. The goal was to find ways to add the most value and eliminate the most waste
LEAN: Celebrating 10 Years
New WESCO Charlotte branch opened in 2010
n 113,000 sq. ft. facility n LEAN operations n LEED® Gold Certified
LEAN Is the WESCO Wayn The majority of our WESCO employees
are trained in LEAN.
n Leaders in WESCO serve as coaches and facilitators.
n Our top LEAN leaders and practitioners are recognized annually.
n In 2012, teams of talented WESCO LEAN professionals conducted over 1,200 value creation events at customer facilities.
using the Plan, Do, Check, Act continuous improvement methodology.
Several years ago, in response to the global economic downturn, WESCO introduced a value creation program for our customers using LEAN. A series of value-add solutions were developed and are being applied to our customers’ operations and supply chains using the four-step process below. Our customer-facing LEAN applications and value-add solutions are designed to specifically address their goals of reducing operating costs, improving efficiencies, eliminating waste, and enhancing safety and sustainability.
As we enter the next 10 years of our journey, our vision for WESCO and our customers is to move from “doing LEAN” to “being LEAN.”
WESCO and the customer meet to build a clear definition of goals and requirements (voice of the customer).
Design and apply customized solutions to maximize productivity and value for the customer.
Align and prioritize value-add solutions to meet customer
requirements and prepare for a Search for Savings event.
Engage the customer team in an onsite event to conduct
a process walk and to identify improvement opportunities.
2012 Annual Report | Leadership. Execution. Results. 5
CANADA
U.S.A.
MEXICO
ECUADOR
PERU
CHILE
ARGENTINA
BRAZIL ANGOLA
SPAIN
ENGLAND
SCOTLAND
POLAND
UAE
BELGIUM
CHINA
SINGAPORE
AUSTRALIA
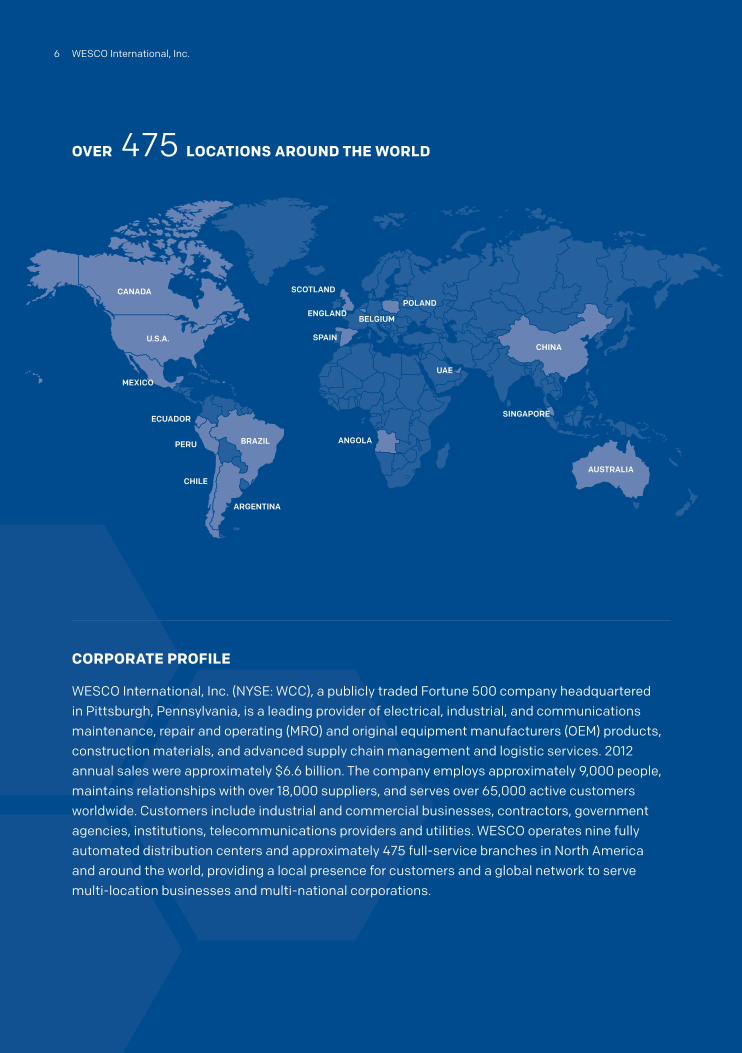
OVER 475 LOCATIONS AROUND THE WORLD
CORPORATE PROFILE
WESCO International, Inc. (NYSE: WCC), a publicly traded Fortune 500 company headquartered in Pittsburgh, Pennsylvania, is a leading provider of electrical, industrial, and communications maintenance, repair and operating (MRO) and original equipment manufacturers (OEM) products, construction materials, and advanced supply chain management and logistic services. 2012 annual sales were approximately $6.6 billion. The company employs approximately 9,000 people, maintains relationships with over 18,000 suppliers, and serves over 65,000 active customers worldwide. Customers include industrial and commercial businesses, contractors, government agencies, institutions, telecommunications providers and utilities. WESCO operates nine fully automated distribution centers and approximately 475 full-service branches in North America and around the world, providing a local presence for customers and a global network to serve multi-location businesses and multi-national corporations.
6 WESCO International, Inc.
2012 Annual Report 7
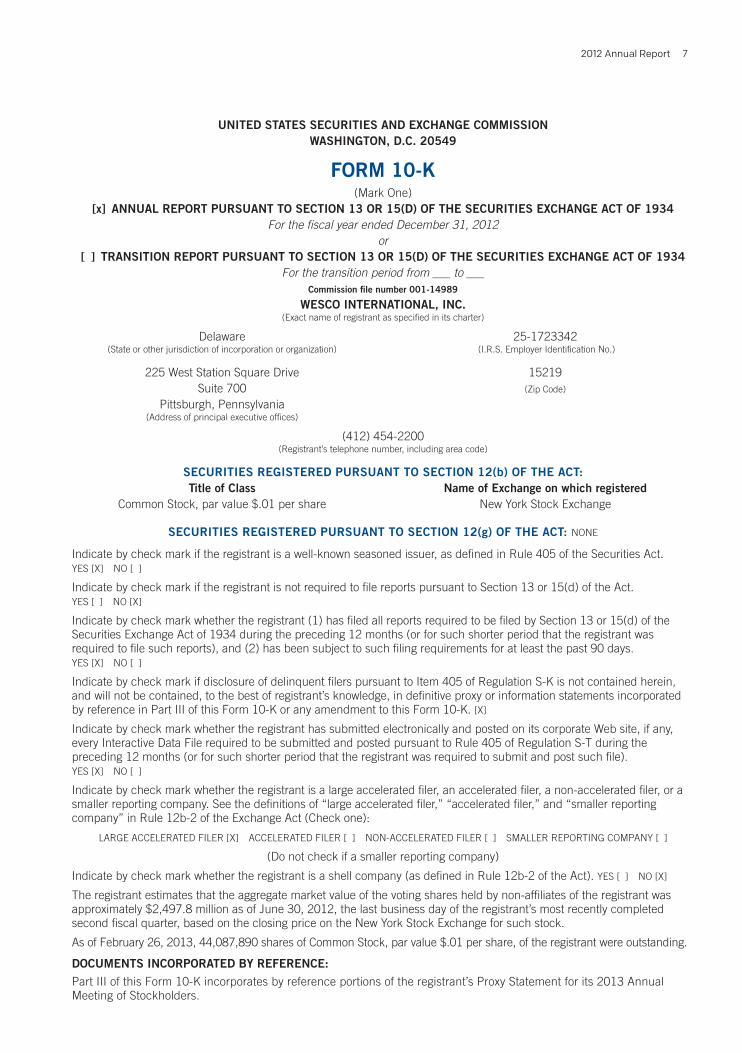
UNITED STATES SECURITIES AND EXCHANGE COMMISSION WASHINGTON, D.C. 20549
FORM 10-K(Mark One)
[x] ANNUAL REPORT PURSUANT TO SECTION 13 OR 15(D) OF THE SECURITIES EXCHANGE ACT OF 1934For the fiscal year ended December 31, 2012
or[ ] TRANSITION REPORT PURSUANT TO SECTION 13 OR 15(D) OF THE SECURITIES EXCHANGE ACT OF 1934
For the transition period from ___ to ___Commission file number 001-14989
WESCO INTERNATIONAL, INC. (Exact name of registrant as specified in its charter)
Delaware 25-1723342 (State or other jurisdiction of incorporation or organization) (I.R.S. Employer Identification No.)
225 West Station Square Drive 15219 Suite 700 (Zip Code)
Pittsburgh, Pennsylvania (Address of principal executive offices)
(412) 454-2200 (Registrant’s telephone number, including area code)
SECURITIES REGISTERED PURSUANT TO SECTION 12(b) OF THE ACT: Title of Class Name of Exchange on which registered Common Stock, par value $.01 per share New York Stock Exchange
SECURITIES REGISTERED PURSUANT TO SECTION 12(g) OF THE ACT: NONE
Indicate by check mark if the registrant is a well-known seasoned issuer, as defined in Rule 405 of the Securities Act. YES [X] NO [ ]
Indicate by check mark if the registrant is not required to file reports pursuant to Section 13 or 15(d) of the Act. YES [ ] NO [X]
Indicate by check mark whether the registrant (1) has filed all reports required to be filed by Section 13 or 15(d) of the Securities Exchange Act of 1934 during the preceding 12 months (or for such shorter period that the registrant was required to file such reports), and (2) has been subject to such filing requirements for at least the past 90 days. YES [X] NO [ ]
Indicate by check mark if disclosure of delinquent filers pursuant to Item 405 of Regulation S-K is not contained herein, and will not be contained, to the best of registrant’s knowledge, in definitive proxy or information statements incorporated by reference in Part III of this Form 10-K or any amendment to this Form 10-K. [X]
Indicate by check mark whether the registrant has submitted electronically and posted on its corporate Web site, if any, every Interactive Data File required to be submitted and posted pursuant to Rule 405 of Regulation S-T during the preceding 12 months (or for such shorter period that the registrant was required to submit and post such file). YES [X] NO [ ]
Indicate by check mark whether the registrant is a large accelerated filer, an accelerated filer, a non-accelerated filer, or a smaller reporting company. See the definitions of “large accelerated filer,” “accelerated filer,” and “smaller reporting company” in Rule 12b-2 of the Exchange Act (Check one):
LARGE ACCELERATED FILER [X] ACCELERATED FILER [ ] NON-ACCELERATED FILER [ ] SMALLER REPORTING COMPANY [ ]
(Do not check if a smaller reporting company)
Indicate by check mark whether the registrant is a shell company (as defined in Rule 12b-2 of the Act). YES [ ] NO [X]
The registrant estimates that the aggregate market value of the voting shares held by non-affiliates of the registrant was approximately $2,497.8 million as of June 30, 2012, the last business day of the registrant’s most recently completed second fiscal quarter, based on the closing price on the New York Stock Exchange for such stock.
As of February 26, 2013, 44,087,890 shares of Common Stock, par value $.01 per share, of the registrant were outstanding.
DOCUMENTS INCORPORATED BY REFERENCE:Part III of this Form 10-K incorporates by reference portions of the registrant’s Proxy Statement for its 2013 Annual Meeting of Stockholders.
WESCO International, Inc.8
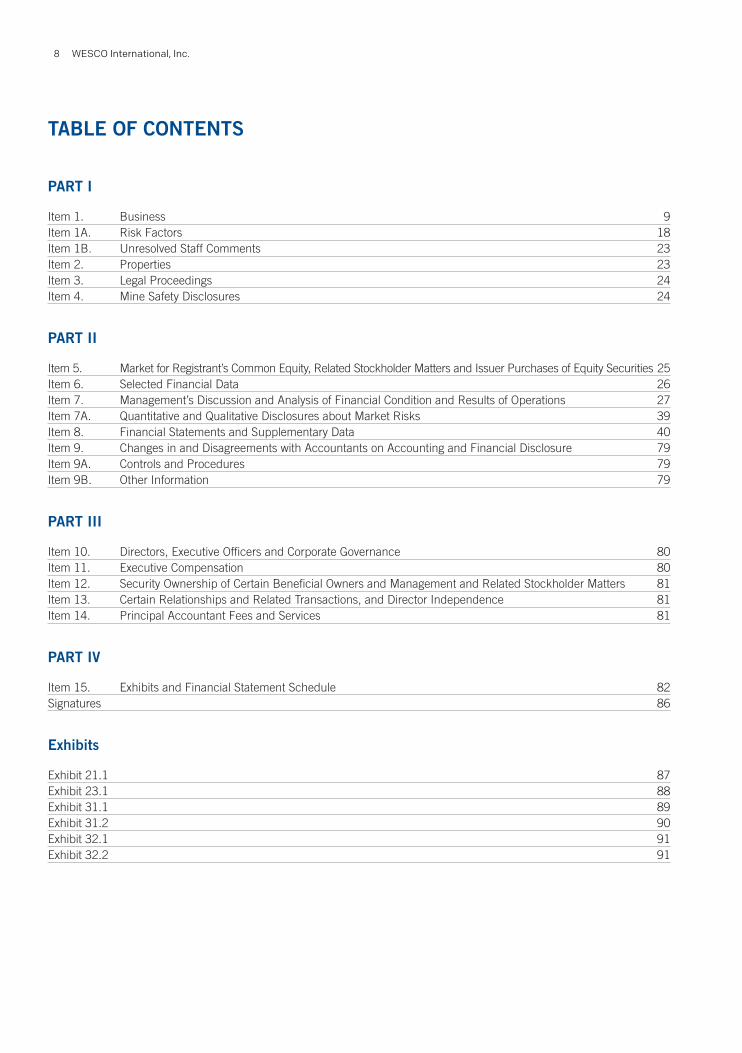
TABLE OF CONTENTS
PART I
Item 1. Business 9Item 1A. Risk Factors 18Item 1B. Unresolved Staff Comments 23Item 2. Properties 23Item 3. Legal Proceedings 24Item 4. Mine Safety Disclosures 24
PART II
Item 5. Market for Registrant’s Common Equity, Related Stockholder Matters and Issuer Purchases of Equity Securities 25Item 6. Selected Financial Data 26Item 7. Management’s Discussion and Analysis of Financial Condition and Results of Operations 27Item 7A. Quantitative and Qualitative Disclosures about Market Risks 39Item 8. Financial Statements and Supplementary Data 40Item 9. Changes in and Disagreements with Accountants on Accounting and Financial Disclosure 79Item 9A. Controls and Procedures 79Item 9B. Other Information 79
PART III
Item 10. Directors, Executive Officers and Corporate Governance 80Item 11. Executive Compensation 80Item 12. Security Ownership of Certain Beneficial Owners and Management and Related Stockholder Matters 81Item 13. Certain Relationships and Related Transactions, and Director Independence 81Item 14. Principal Accountant Fees and Services 81
PART IV
Item 15. Exhibits and Financial Statement Schedule 82Signatures 86
Exhibits
Exhibit 21.1 87Exhibit 23.1 88Exhibit 31.1 89Exhibit 31.2 90Exhibit 32.1 91Exhibit 32.2 91

2012 Annual Report 9
PART I
Item 1. Business.
In this Annual Report on Form 10-K, “WESCO” refers to WESCO International, Inc., and its subsidiaries and its predecessors unless the context otherwise requires. References to “we,” “us,” “our” and the “Company” refer to WESCO and its subsidiaries.
THE COMPANY
WESCO International, Inc. (“WESCO International”), incorporated in 1993 and effectively formed in February 1994 upon acquiring a distribution business from Westinghouse Electric Corporation, is a leading North American based distributor of products and provider of advanced supply chain management and logistics services used primarily in industrial, construction, utility and commercial, institutional and government (“CIG”) markets. We are a leading provider of electrical, industrial, and communications maintenance, repair and operating (“MRO”) and original equipment manufacturers (“OEM”) products, construction materials, and advanced supply chain management and logistics services. Our primary product categories include general electrical and industrial supplies, wire, cable and conduit, data and broadband communications, power distribution equipment, lighting and lighting control systems, control and automation, motors, and safety.
We serve over 65,000 active customers globally through approximately 475 full service branches and nine distribution centers located in the United States, Canada, and Mexico with offices in 15 additional countries. At the end of 2012, we had approximately 9,000 employees worldwide. We distribute over 1,000,000 products, grouped into six categories, from more than 18,000 suppliers utilizing a highly automated, proprietary electronic procurement and inventory replenishment system.
In addition, we offer a comprehensive portfolio of value-added capabilities, which includes supply chain management, logistics and transportation, procurement, warehousing and inventory management, as well as kitting, limited assembly of products and system installation. Our value-added capabilities, extensive geographic reach, experienced workforce and broad product and supply chain solutions have enabled us to grow our business and establish a leading position in North America.
In December 2012, we completed the acquisition of EECOL Electric Corporation (“EECOL”) with approximately $0.9 billion in annual sales, 57 locations across Canada and 20 in South America, and more than 20,000 customers.
INDUSTRY OVERVIEW
We operate in highly fragmented markets that include thousands of small regional and locally based, privately owned competitors. According to one industry publication, in 2011, the latest year for which market share data is available, the five largest North American electrical distributors, including WESCO, accounted for only approximately 30% of all industry sales in North America. Our global account, integrated supply and OEM programs provide customers with regional, national, North American and global supply chain consolidation opportunities. The demand for these programs has grown in recent years, driven primarily by the desire of companies to reduce operating expenses by outsourcing operational and administrative functions associated with the procurement, management and utilization of MRO supplies and OEM components. We believe that significant opportunities exist for further expansion of these programs. The total potential in the United States for purchases of MRO and OEM supplies and services across all industrial distribution market segments and channels is currently estimated to be greater than $500 billion per an industry publication.
According to management estimates, electrical distribution industry sales have grown at an approximately 5% compound annual rate over the past 20 years. This expansion has been driven by general economic growth, increased price levels for key commodities, increased use of electrical products in businesses and industries, new products and technologies, the proliferation of enhanced building and safety codes, and use of the internet. Wholesale distributors have also grown as a result of a long-term shift in procurement preferences that favor the use of distributors over direct relationships with manufacturers. It is estimated that approximately 75% of electrical products manufactured in the United States are delivered to the end user through the distribution channel.
WESCO International, Inc.10
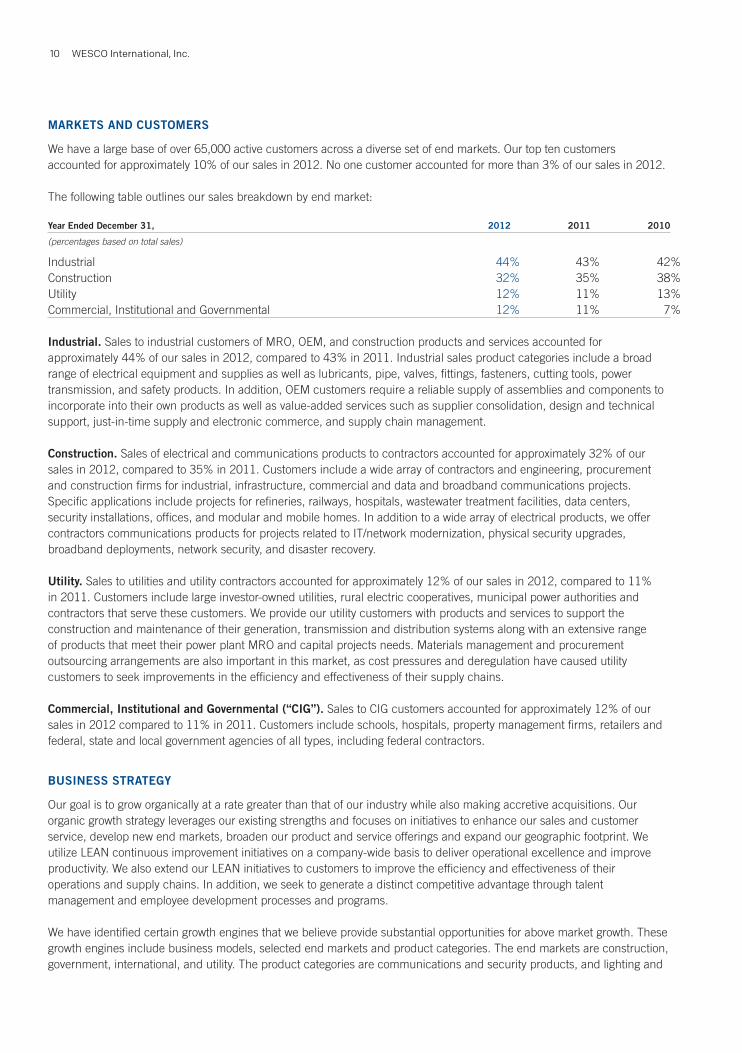
MARKETS AND CUSTOMERS
We have a large base of over 65,000 active customers across a diverse set of end markets. Our top ten customers accounted for approximately 10% of our sales in 2012. No one customer accounted for more than 3% of our sales in 2012.
The following table outlines our sales breakdown by end market:
Year Ended December 31, 2012 2011 2010
(percentages based on total sales)
Industrial 44% 43% 42%Construction 32% 35% 38%Utility 12% 11% 13%Commercial, Institutional and Governmental 12% 11% 7%
Industrial. Sales to industrial customers of MRO, OEM, and construction products and services accounted for approximately 44% of our sales in 2012, compared to 43% in 2011. Industrial sales product categories include a broad range of electrical equipment and supplies as well as lubricants, pipe, valves, fittings, fasteners, cutting tools, power transmission, and safety products. In addition, OEM customers require a reliable supply of assemblies and components to incorporate into their own products as well as value-added services such as supplier consolidation, design and technical support, just-in-time supply and electronic commerce, and supply chain management.
Construction. Sales of electrical and communications products to contractors accounted for approximately 32% of our sales in 2012, compared to 35% in 2011. Customers include a wide array of contractors and engineering, procurement and construction firms for industrial, infrastructure, commercial and data and broadband communications projects. Specific applications include projects for refineries, railways, hospitals, wastewater treatment facilities, data centers, security installations, offices, and modular and mobile homes. In addition to a wide array of electrical products, we offer contractors communications products for projects related to IT/network modernization, physical security upgrades, broadband deployments, network security, and disaster recovery.
Utility. Sales to utilities and utility contractors accounted for approximately 12% of our sales in 2012, compared to 11% in 2011. Customers include large investor-owned utilities, rural electric cooperatives, municipal power authorities and contractors that serve these customers. We provide our utility customers with products and services to support the construction and maintenance of their generation, transmission and distribution systems along with an extensive range of products that meet their power plant MRO and capital projects needs. Materials management and procurement outsourcing arrangements are also important in this market, as cost pressures and deregulation have caused utility customers to seek improvements in the efficiency and effectiveness of their supply chains.
Commercial, Institutional and Governmental (“CIG”). Sales to CIG customers accounted for approximately 12% of our sales in 2012 compared to 11% in 2011. Customers include schools, hospitals, property management firms, retailers and federal, state and local government agencies of all types, including federal contractors.
BUSINESS STRATEGY
Our goal is to grow organically at a rate greater than that of our industry while also making accretive acquisitions. Our organic growth strategy leverages our existing strengths and focuses on initiatives to enhance our sales and customer service, develop new end markets, broaden our product and service offerings and expand our geographic footprint. We utilize LEAN continuous improvement initiatives on a company-wide basis to deliver operational excellence and improve productivity. We also extend our LEAN initiatives to customers to improve the efficiency and effectiveness of their operations and supply chains. In addition, we seek to generate a distinct competitive advantage through talent management and employee development processes and programs.
We have identified certain growth engines that we believe provide substantial opportunities for above market growth. These growth engines include business models, selected end markets and product categories. The end markets are construction, government, international, and utility. The product categories are communications and security products, and lighting and
2012 Annual Report 11
sustainability. We believe our business models of global accounts and integrated supply programs also provide significant growth opportunities and are applicable to any of our served end markets. We have focused our growth efforts on these end markets, product categories, and business models as discussed below.
Grow Our Global Account Customer Relationships and Base. Our typical global account customer is a Fortune 1000 industrial or commercial company, a large utility, a major contractor, or a governmental or institutional customer, in each case with multiple locations. Our global account program is designed to provide customers with supply chain management services and cost reductions by coordinating and standardizing activity for MRO materials and OEM direct materials across their multiple locations utilizing our broad geographic footprint and our largely integrated information technology platform. Comprehensive implementation plans are managed at the local, national and international levels to prioritize activities, identify key performance measures, and track progress against objectives. We involve our preferred suppliers early in the implementation process, where they can contribute expertise and product knowledge to accelerate program implementation and achievement of cost savings and process improvements.
Over the past ten years, growth from our global account programs has been a material component of our organic growth strategy. Our objective is to continue to increase revenue from our global account programs by expanding our product and service offerings to existing global account customers and expanding our reach to serve additional customer locations. We also plan on expanding our customer base by capitalizing on our industry expertise and supply chain optimization capabilities.
Extend Our Leadership Position in Integrated Supply Programs. Our integrated supply programs are focused on customers in the industrial, utility, construction and CIG markets. We combine our personnel, product and distribution expertise, electronic commerce technologies, and service capabilities with the customer’s own internal resources to meet particular service requirements. Each integrated supply program is configured to reduce the number of suppliers, total procurement costs, and administrative expenses as well as improve operating controls. Our integrated supply programs focus on supply chain optimization and replace the traditional multi-vendor, resource-intensive procurement process with a single, outsourced, automated process. Our services range from timely product delivery to an outsourced procurement function. We believe that large customers will increasingly seek to utilize such services to consolidate and manage their MRO and OEM supply chains. We plan to expand our position as an integrated supply services leader in North America by building upon established relationships within our large customer base and premier supplier network, and extending our services to additional customers and locations around the world.
Expand Our Relationships with Construction Contractors. Our construction sales are focused on contractors, particularly those involved with healthcare, government facilities, enterprise data communications, telecommunication and energy and government infrastructure-related projects. We believe that significant cross selling opportunities exist for electrical and communications products and we intend to use our global account and integrated supply programs, LEAN initiatives and project management expertise to capitalize on construction business opportunities.
Expand Products and Services for Utilities. Our utility customers continue to focus on improving grid reliability as well as improving their operating efficiency and reducing costs. As a result, we anticipate an increase in distribution grid improvement and transmission expansion projects as well as the adoption of integrated supply programs. Accordingly, we are focused on expanding our logistical and project services, integrated supply services and project management programs to increase our scope of supply on distribution grid, generation and other energy projects, including alternative energy projects.
Expand International Operations. We seek to capitalize on existing and emerging international market opportunities through local business development and the expansion of our global product and service platforms while taking advantage of acquisitions that expand our global footprint. We target large, growing markets where we can leverage our value proposition and relationships with key customers and suppliers. We believe this strategy of working with well-developed customer and supplier relationships significantly reduces risk and provides the opportunity to establish profitable business.

WESCO International, Inc.12
Our priorities are focused on global vertical markets including energy, mining and metals, manufacturing, and infrastructure, as well as key product categories such as communications and security. Additionally, we are extending our procurement outsourcing and integrated supply programs following large, existing customers into international markets.
Grow Our Communications Products Position. Over the last several years, there has been a convergence of electrical and data communications contractors. Our ability to provide both electrical and communications products and services lines as well as automation, electromechanical, non-electrical MRO, physical security and utility products has presented cross selling opportunities across WESCO. Communications products have continued to be in demand due to networking upgrades, low voltage security investments, data center upgrades and increasing broadband and telecommunications utilization.
Grow Lighting System and Sustainability Sales. Lighting applications are undergoing significant innovation driven by energy efficiency and sustainability trends. We expanded our sales team and marketing initiatives and will continue to add resources in this product category and in product and service offerings to provide overall energy solutions. We opened our second Lighting & Sustainability Solutions Center to increase the customer’s knowledge in lighting technology and solutions that contribute to an environmentally responsible future.
Pursue Strategic Acquisitions. In 2012, we acquired four businesses: RS Electronics (“RS”), Trydor Industries (Canada) Ltd. (“Trydor”), Conney Safety Products, LLC (“Conney”), and EECOL. We believe that the highly fragmented nature of the electrical and industrial distribution industry will continue to provide acquisition opportunities. We expect that any future acquisitions will be financed with internally generated funds, additional debt and/or the issuance of equity securities.
Drive Operational Excellence. LEAN continuous improvement is a set of company-wide strategic initiatives to increase efficiency and effectiveness across the entire business enterprise, including sales, operations and administrative processes. The basic principles behind LEAN are to systematically identify and implement improvements through simplification, elimination of waste and reduction in errors. We apply LEAN in our distribution environment, and develop and deploy numerous initiatives through the Kaizen approach targeting improvements in sales, margin, warehouse operations, transportation, purchasing, inventory, accounts receivable, accounts payable, and administrative processes. Our objective is to continue to implement LEAN initiatives across our business enterprise and to extend LEAN services to our customers and suppliers.
Talent Management. Our strategy is to develop a distinct competitive advantage through talent management and employee engagement and development. We believe our ability to attract, develop and retain diverse human capital is imperative to ongoing business success. We improve workforce capability through various programs and processes that identify, recruit, develop and promote our talent base. Significant enhancements in these programs have been made over the last several years, and we expect to continue to refine and enhance these programs in the future.
2012 Annual Report 13
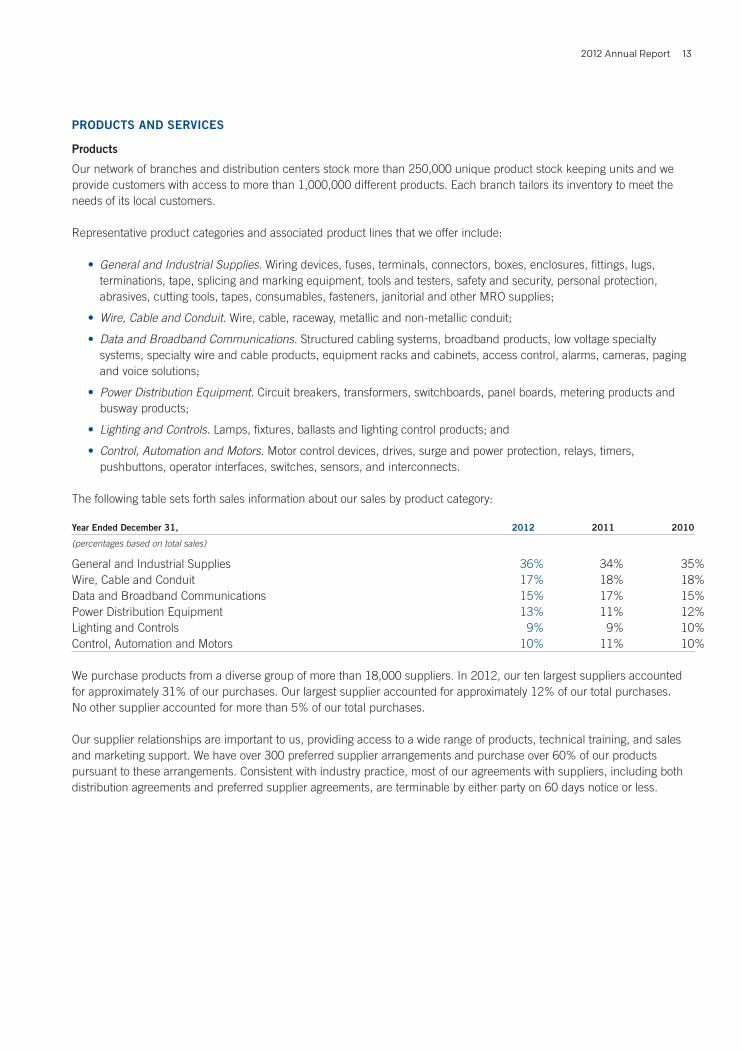
PRODUCTS AND SERVICES
Products
Our network of branches and distribution centers stock more than 250,000 unique product stock keeping units and we provide customers with access to more than 1,000,000 different products. Each branch tailors its inventory to meet the needs of its local customers.
Representative product categories and associated product lines that we offer include:
• General and Industrial Supplies. Wiring devices, fuses, terminals, connectors, boxes, enclosures, fittings, lugs, terminations, tape, splicing and marking equipment, tools and testers, safety and security, personal protection, abrasives, cutting tools, tapes, consumables, fasteners, janitorial and other MRO supplies;
• Wire, Cable and Conduit. Wire, cable, raceway, metallic and non-metallic conduit;
• Data and Broadband Communications. Structured cabling systems, broadband products, low voltage specialty systems, specialty wire and cable products, equipment racks and cabinets, access control, alarms, cameras, paging and voice solutions;
• Power Distribution Equipment. Circuit breakers, transformers, switchboards, panel boards, metering products and busway products;
• Lighting and Controls. Lamps, fixtures, ballasts and lighting control products; and
• Control, Automation and Motors. Motor control devices, drives, surge and power protection, relays, timers, pushbuttons, operator interfaces, switches, sensors, and interconnects.
The following table sets forth sales information about our sales by product category:
Year Ended December 31, 2012 2011 2010
(percentages based on total sales)
General and Industrial Supplies 36% 34% 35%Wire, Cable and Conduit 17% 18% 18%Data and Broadband Communications 15% 17% 15%Power Distribution Equipment 13% 11% 12%Lighting and Controls 9% 9% 10%Control, Automation and Motors 10% 11% 10%
We purchase products from a diverse group of more than 18,000 suppliers. In 2012, our ten largest suppliers accounted for approximately 31% of our purchases. Our largest supplier accounted for approximately 12% of our total purchases. No other supplier accounted for more than 5% of our total purchases.
Our supplier relationships are important to us, providing access to a wide range of products, technical training, and sales and marketing support. We have over 300 preferred supplier arrangements and purchase over 60% of our products pursuant to these arrangements. Consistent with industry practice, most of our agreements with suppliers, including both distribution agreements and preferred supplier agreements, are terminable by either party on 60 days notice or less.
WESCO International, Inc.14
Services
As part of our overall offering, we provide customers a comprehensive portfolio of value added services which includes more than 50 value add solutions in 11 categories including construction, e-business, energy, engineering services, green and sustainability, production support, safety and security, supply chain optimization, training, and working capital. These solutions are designed to address our customer’s business needs through:
• Providing technical support for manufacturing process improvements;
• Implementing inventory optimization programs, including just-in-time delivery and vendor managed inventory;
• Participating in joint cost savings teams;
• Assigning our employees as on-site support personnel;
• Consulting and recommending energy-efficient product upgrades; and
• Offering safety and product training for customer employees.
COMPETITIVE STRENGTHS
We compete directly with global, national, regional and local distributors of electrical and other industrial supplies. Competition is primarily focused on the local service area, and is generally based on product line breadth, product availability, service capabilities and price. We also compete with buying groups formed by smaller distributors to increase purchasing power and provide some cooperative marketing capability. While increased buying power may improve the competitive position of buying groups locally, we believe it is difficult to coordinate a diverse ownership group to provide consistent quality products and services across multiple geographic regions. Although certain Internet-based procurement service companies, auction businesses and trade exchanges remain in the marketplace, the impact on our business from these competitors has not been significant to date.
Market Leadership. Our ability to manage complex global supply chains, multi-site facility maintenance programs and construction projects that require special sourcing, technical advice, logistical support and locally based service has enabled us to establish a strong presence in our served markets. We have utilized these skills to generate significant revenues in a broad range of industries with intensive use of electrical and industrial products.
Broad Product Offering and Value-added Services. We provide a wide range of products, services and procurement solutions, which draw on our product knowledge, supply and logistics expertise, system capabilities and supplier relationships to enable our customers to maximize productivity, minimize waste, improve efficiencies, reduce costs and enhance safety. Our broad product offering and stable source of supply enables us to consistently meet virtually all of a customer’s capital project, product, MRO and OEM requirements.
Extensive Distribution Network. We operate approximately 475 geographically dispersed branch locations and nine distribution centers (five in the United States and four in Canada). Our distribution centers add value for our customers, suppliers, and branches through the combination of a broad and deep selection of inventory, online ordering, next-day shipment and central order handling and fulfillment. Our distribution center network reduces the lead-time and cost of supply chain activities through automated replenishment and warehouse management systems and economies of scale in purchasing, inventory management, administration and transportation. This extensive network, which would be difficult and expensive to duplicate, provides us with a distinct competitive advantage and allows us to:
• Enhance localized customer service, technical support and sales coverage;
• Tailor individual branch products and services to local customer needs; and
• Offer multi-site distribution capabilities to large customers and global accounts.
Low Cost Operator. Our competitiveness has been enhanced by our consistent favorable operating cost position, which is based on use of LEAN, strategically-located distribution centers, and purchasing economies of scale. As a result of these factors and others, our operating cost as a percentage of sales is one of the lowest in our industry. Our selling, general and administrative expenses as a percentage of revenues for 2012 were 14.6%.
2012 Annual Report 15
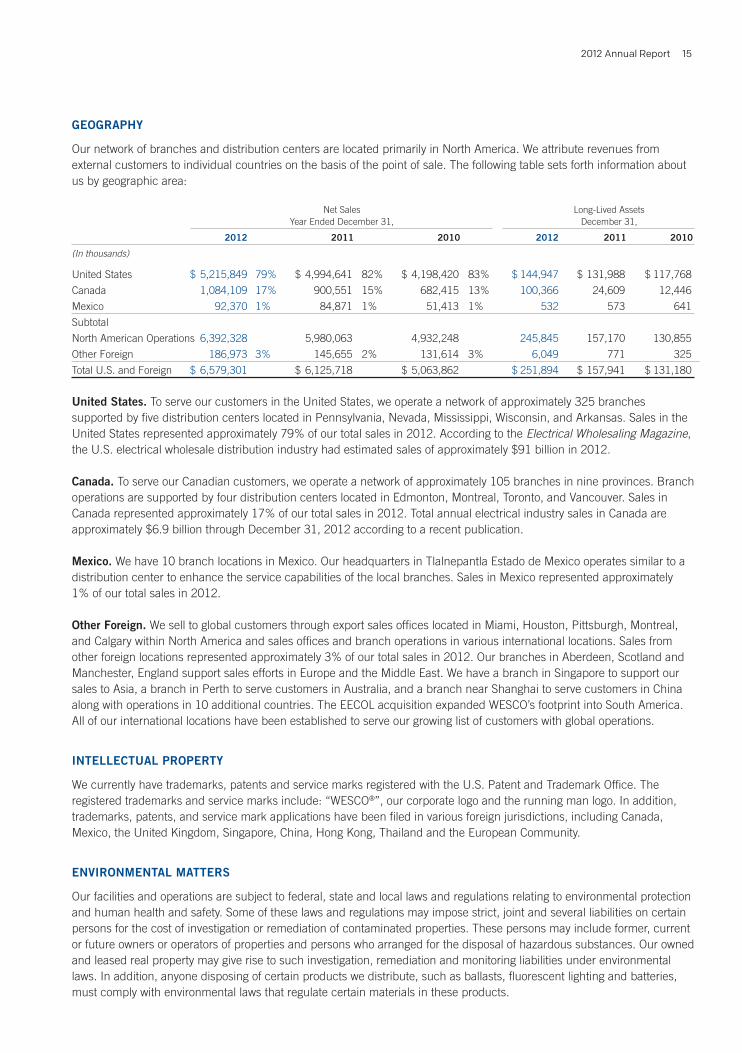
GEOGRAPHY
Our network of branches and distribution centers are located primarily in North America. We attribute revenues from external customers to individual countries on the basis of the point of sale. The following table sets forth information about us by geographic area:
Net Sales Long-Lived Assets Year Ended December 31, December 31,
2012 2011 2010 2012 2011 2010
(In thousands)
United States $ 5,215,849 79% $ 4,994,641 82% $ 4,198,420 83% $ 144,947 $ 131,988 $ 117,768
Canada 1,084,109 17% 900,551 15% 682,415 13% 100,366 24,609 12,446
Mexico 92,370 1% 84,871 1% 51,413 1% 532 573 641
Subtotal
North American Operations 6,392,328 5,980,063 4,932,248 245,845 157,170 130,855
Other Foreign 186,973 3% 145,655 2% 131,614 3% 6,049 771 325
Total U.S. and Foreign $ 6,579,301 $ 6,125,718 $ 5,063,862 $ 251,894 $ 157,941 $ 131,180
United States. To serve our customers in the United States, we operate a network of approximately 325 branches supported by five distribution centers located in Pennsylvania, Nevada, Mississippi, Wisconsin, and Arkansas. Sales in the United States represented approximately 79% of our total sales in 2012. According to the Electrical Wholesaling Magazine, the U.S. electrical wholesale distribution industry had estimated sales of approximately $91 billion in 2012.
Canada. To serve our Canadian customers, we operate a network of approximately 105 branches in nine provinces. Branch operations are supported by four distribution centers located in Edmonton, Montreal, Toronto, and Vancouver. Sales in Canada represented approximately 17% of our total sales in 2012. Total annual electrical industry sales in Canada are approximately $6.9 billion through December 31, 2012 according to a recent publication.
Mexico. We have 10 branch locations in Mexico. Our headquarters in Tlalnepantla Estado de Mexico operates similar to a distribution center to enhance the service capabilities of the local branches. Sales in Mexico represented approximately 1% of our total sales in 2012.
Other Foreign. We sell to global customers through export sales offices located in Miami, Houston, Pittsburgh, Montreal, and Calgary within North America and sales offices and branch operations in various international locations. Sales from other foreign locations represented approximately 3% of our total sales in 2012. Our branches in Aberdeen, Scotland and Manchester, England support sales efforts in Europe and the Middle East. We have a branch in Singapore to support our sales to Asia, a branch in Perth to serve customers in Australia, and a branch near Shanghai to serve customers in China along with operations in 10 additional countries. The EECOL acquisition expanded WESCO’s footprint into South America. All of our international locations have been established to serve our growing list of customers with global operations.
INTELLECTUAL PROPERTY
We currently have trademarks, patents and service marks registered with the U.S. Patent and Trademark Office. The registered trademarks and service marks include: “WESCO®”, our corporate logo and the running man logo. In addition, trademarks, patents, and service mark applications have been filed in various foreign jurisdictions, including Canada, Mexico, the United Kingdom, Singapore, China, Hong Kong, Thailand and the European Community.
ENVIRONMENTAL MATTERS
Our facilities and operations are subject to federal, state and local laws and regulations relating to environmental protection and human health and safety. Some of these laws and regulations may impose strict, joint and several liabilities on certain persons for the cost of investigation or remediation of contaminated properties. These persons may include former, current or future owners or operators of properties and persons who arranged for the disposal of hazardous substances. Our owned and leased real property may give rise to such investigation, remediation and monitoring liabilities under environmental laws. In addition, anyone disposing of certain products we distribute, such as ballasts, fluorescent lighting and batteries, must comply with environmental laws that regulate certain materials in these products.
WESCO International, Inc.16
We believe that we are in compliance, in all material respects, with applicable environmental laws. As a result, we do not anticipate making significant capital expenditures for environmental control matters either in the current year or in the near future.
SEASONALITY
Our operating results are not significantly affected by seasonal factors. Sales during the first and fourth quarters are generally 1-3% below the sales of the second and third quarters, due to a reduced level of activity during the winter months of November through February. Sales typically increase beginning in March, with slight fluctuations per month through October. During periods of economic expansion or contraction our sales by quarter have varied significantly from this seasonal pattern.
WEBSITE ACCESS
Our Internet address is www.wesco.com. Information contained on our website is not part of, and should not be construed as being incorporated by reference into, this Annual Report on Form 10-K. We make available free of charge under the “Investors” heading on our website our annual reports on Form 10-K, quarterly reports on Form 10-Q, current reports on Form 8-K and amendments to those reports filed or furnished pursuant to Section 13(a) or 15(d) of the Securities Exchange Act of 1934, as amended (the “Exchange Act”), as well as our Proxy Statements, as soon as reasonably practicable after such documents are electronically filed or furnished, as applicable, with the Securities and Exchange Commission (the “SEC”). You also may read and copy any materials we file with the SEC at the SEC’s Public Reference Room at 100 F Street, NE, Washington, DC 20549-0213. You may obtain information on the operation of the Public Reference Room by calling the SEC at 1-800-SEC-0330. The SEC maintains an Internet site at www.sec.gov that contains reports, proxy and information statements and other information regarding issuers like us who file electronically with the SEC.
In addition, our charters for our Executive Committee, Nominating and Governance Committee, Audit Committee and Compensation Committee, as well as our Independence Standards, our Governance Guidelines and our Code of Business Ethics and Conduct for our Directors, officers and employees, are all available on our website in the “Corporate Governance” link under the “Investors” heading.
FORWARD-LOOKING INFORMATION
This Annual Report on Form 10-K contains various “forward-looking statements” within the meaning of the Private Securities Litigation Reform Act of 1995. These statements involve certain unknown risks and uncertainties, including, among others, those contained in Item 1, “Business,” Item 1A, “Risk Factors,” and Item 7, “Management’s Discussion and Analysis of Financial Condition and Results of Operations.” When used in this Annual Report on Form 10-K, the words “anticipates,” “plans,” “believes,” “estimates,” “intends,” “expects,” “projects,” “will” and similar expressions may identify forward-looking statements, although not all forward-looking statements contain such words. Such statements, including, but not limited to, our statements regarding business strategy, growth strategy, competitive strengths, productivity and profitability enhancement, competition, new product and service introductions and liquidity and capital resources are based on management’s beliefs, as well as on assumptions made by and information currently available to, management, and involve various risks and uncertainties, some of which are beyond our control. Our actual results could differ materially from those expressed in any forward-looking statement made by us or on our behalf. In light of these risks and uncertainties, there can be no assurance that the forward-looking information will in fact prove to be accurate. We have undertaken no obligation to publicly update or revise any forward-looking statements, whether as a result of new information, future events or otherwise.
2012 Annual Report 17
EXECUTIVE OFFICERS
Our executive officers and their respective ages and positions as of February 28, 2013, are set forth below.
Name Age PositionJohn J. Engel 51 Chairman, President and Chief Executive OfficerStephen A. Van Oss 58 Senior Vice President and Chief Operating OfficerDaniel A. Brailer 55 Vice President, Investor Relations and Corporate AffairsAllan A. Duganier 57 Director of Internal AuditTimothy A. Hibbard 56 Vice President and Corporate ControllerDiane E. Lazzaris 46 Vice President, Legal AffairsKenneth S. Parks 49 Vice President and Chief Financial OfficerKimberly G. Windrow 55 Vice President, Human Resources
Set forth below is biographical information for our executive officers listed above.
John J. Engel was appointed Chairman of the Board in May 2011 and has served as President and Chief Executive Officer since September 2009. Previously, Mr. Engel served as our Senior Vice President and Chief Operating Officer from 2004 to September 2009. From 2003 to 2004, Mr. Engel served as Senior Vice President and General Manager of Gateway, Inc. From 1999 to 2002, Mr. Engel served as an Executive Vice President and Senior Vice President of Perkin Elmer, Inc. From 1994 to 1999, Mr. Engel served as a Vice President and General Manager of Allied Signal, Inc. and held various engineering, manufacturing and general management positions at General Electric Company from 1985 to 1994. Mr. Engel is also a director of United States Steel Corporation, an integrated steel producer.
Stephen A. Van Oss has served as Senior Vice President and Chief Operating Officer since September 2009. From February 2012 to June 2012, he also served as the Company’s Chief Financial Officer on an interim basis. Previously, Mr. Van Oss served as our Senior Vice President and Chief Financial and Administrative Officer from 2004 to September 2009. From 2000 to 2004, he served as our Vice President and Chief Financial Officer. From 1997 to 2000, Mr. Van Oss served as our Director, Information Technology and, in 1997, as our Director, Acquisition Management. From 1995 to 1996, Mr. Van Oss served as Chief Operating Officer and Chief Financial Officer of Paper Back Recycling of America, Inc. Mr. Van Oss serves as a director of Cooper-Standard Holdings Inc. and as the chairman of its audit committee. He also serves as a trustee of Robert Morris University and is chairman of its finance committee and is a member of its government committee.
Daniel A. Brailer has served as our Vice President, Investor Relations and Corporate Affairs since February 2012. From February 2011 to February 2012, he served as our Vice President, Treasurer, Investor Relations and Corporate Affairs. From 2006 to February 2011, he served as our Vice President, Treasurer and Investor Relations. From 1999 to 2006, he served as our Treasurer and Director of Investor Relations. Prior to joining the Company, Mr. Brailer served in various positions at Mellon Financial Corporation, most recently as Senior Vice President.
Allan A. Duganier has served as our Director of Internal Audit since 2006. From 2001 to 2006, Mr. Duganier served as our Corporate Operations Controller and, from 2000 to 2001, as our Industrial/Construction Group Controller.
Timothy A. Hibbard was appointed as our Vice President and Corporate Controller in February 2012. From 2006 to February 2012, he served as our Corporate Controller. From 2002 to 2006, he served as Corporate Controller at Kennametal Inc. From 2000 to 2002, Mr. Hibbard served as Director of Finance of Kennametal’s Advanced Materials Solutions Group, and, from 1998 to 2000, he served as Controller of Greenfield Industries, Inc., a subsidiary of Kennametal Inc.
Diane E. Lazzaris has served as our Vice President, Legal Affairs since February 2010. From February 2008 to February 2010, Ms. Lazzaris served as Senior Vice President – Legal, General Counsel and Corporate Secretary of Dick’s Sporting Goods, Inc. From 1994 to February 2008, she held various corporate counsel positions at Alcoa Inc., most recently as Group Counsel to a group of global businesses.
WESCO International, Inc.18
Kenneth S. Parks has served as our Vice President and Chief Financial Officer since June 2012. From April 2008 to February 2012, he served as Vice President of Finance of United Technologies Corporation for their global Fire and Security business. From 2005 to April 2008, he served as Director of Investor Relations of United Technologies Corporation. He began his career in public accounting with Coopers & Lybrand.
Kimberly G. Windrow has served as our Vice President, Human Resources since August 2010. From 2004 until July 2010, Ms. Windrow served as Senior Vice President of Human Resources for The McGraw Hill Companies in the Education segment. From 2000 until 2004, she served as Senior Vice President of Human Resources for The MONY Group, and from 1988 until 1999, she served in various Human Resource positions at Willis, Inc.
Item 1A. Risk Factors.
The following factors, among others, could cause our actual results to differ materially from the forward-looking statements we make. All forward-looking statements attributable to us or persons working on our behalf are expressly qualified by the following factors. This information should be read in conjunction with Item 7, Management’s Discussion and Analysis of Financial Condition and Results of Operations, Item 7A, Quantitative and Qualitative Disclosures about Market Risks and the consolidated financial statements and related notes included in this Form 10-K.
Adverse conditions in the global economy and disruptions of financial markets could negatively impact our results of operations.
Our results of operations are affected by the level of business activity of our customers, which in turn is affected by global economic conditions and market factors impacting the industries and markets that they serve. Certain global economies and markets continue to experience significant uncertainty and volatility. Adverse economic conditions or lack of liquidity in various markets, particularly in North America, may adversely affect our revenues and operating results. Economic and financial market conditions also affect the availability of financing for projects and for our customers’ capital or other expenditures, which can result in project delays or cancellations and thus affect demand for our products. There can be no assurance that any governmental responses to economic conditions or disruptions in the financial markets ultimately will stabilize the markets or increase our customers’ liquidity or the availability of credit to our customers. Should one or more of our larger customers declare bankruptcy, it could adversely affect the collectability of our accounts receivable, bad debt reserves and net income. In addition, our ability to access the capital markets may be restricted at a time when we would like, or need, to do so. The global economic and financial environment also may affect our business and financial condition in ways that we currently cannot predict, and there can be no assurance that global economic and market conditions will not adversely affect our results of operations, cash flow or financial position in the future.
Downgrades of the U.S. sovereign credit rating could affect the strength of the U.S. dollar and since a majority of our sales are denominated in U.S. dollars, fluctuations of the U.S. dollar relative to other currencies could negatively affect our business, financial results and liquidity.
An increase in competition could decrease sales or earnings.
We operate in a highly competitive industry and compete directly with global, national, regional and local providers of our products and services. Some of our existing competitors have, and new market entrants may have, greater resources than us. Competition is primarily focused in the local service area and is generally based on product line breadth, product availability, service capabilities and price. Other sources of competition are buying groups formed by smaller distributors to increase purchasing power and provide some cooperative marketing capability as well as e-commerce companies.
Existing or future competitors may seek to gain or retain market share by reducing prices, and we may be required to lower our prices or may lose business, which could adversely affect our financial results. Also, to the extent that we do not meet changing customer preferences or demands or to the extent that one or more of our competitors becomes more successful with private label products or otherwise, our ability to attract and retain customers could be materially adversely affected.

2012 Annual Report 19
Existing or future competitors also may seek to compete with us for acquisitions, which could have the effect of increasing the price and reducing the number of suitable acquisitions. In addition, it is possible that competitive pressures resulting from industry consolidation could affect our growth and profit margins.
Certain events or conditions could lead to interruptions in our operations, which may materially adversely affect our business, financial condition or results of operations.
We operate a number of facilities and we coordinate company activities, including information technology systems and administrative services and the like, through our headquarters operations. Our operations depend on our ability to maintain existing systems and implement new technology, which includes allocating sufficient resources to periodically upgrade our information technology systems, and to protect our equipment and the information stored in our databases against both manmade and natural disasters, as well as power losses, computer and telecommunications failures, technological breakdowns, unauthorized intrusions, cyber attacks, and other events. Conversions to new information technology systems may result in cost overruns, delays or business interruptions. If our information technology systems are disrupted, become obsolete or do not adequately support our strategic, operational or compliance needs, it could result in competitive disadvantage and adversely affect our financial results and business operations, including our ability to process orders, receive and ship products, maintain inventories, collect accounts receivable and pay expenses.
Because we rely heavily on information technology both in serving our customers and in our enterprise infrastructure in order to achieve our objectives, we may be vulnerable to damage or intrusion from a variety of cyber-attacks including computer viruses, worms or other malicious software programs that access our systems. Despite the precautions we take to mitigate the risks of such events, an attack on our enterprise information technology system could result in theft or disclosure of our proprietary or confidential information or a breach of confidential customer or employee information. Such events could have an adverse impact on revenue, harm our reputation, and cause us to incur legal liability and costs, which could be significant, to address and remediate such events and related security concerns.
We also depend on accessible office facilities, distribution centers and information technology data centers for our operations to function properly. An interruption of operations at any of our distribution centers could have a material adverse effect on the operations of branches served by the affected distribution center. Such disaster related risks and effects are not predictable with certainty and, although they typically can be mitigated, they cannot be eliminated. We seek to mitigate our exposures to disaster events in a number of ways. For example, where feasible, we design the configuration of our facilities to reduce the consequences of disasters. We also maintain insurance for our facilities against casualties and we evaluate our risks and develop contingency plans for dealing with them. Although we have reviewed and analyzed a broad range of risks applicable to our business, the ones that actually affect us may not be those we have concluded most likely to occur. Furthermore, although our reviews have led to more systematic contingency planning, our plans are in varying stages of development and execution, such that they may not be adequate at the time of occurrence for the magnitude of any particular disaster event that befalls us.
With the acquisition of EECOL Electric Corporation, our risk profile may differ materially from prior years as a result of increased levels of international operations, which could materially change our results of operations.
On December 14, 2012 we completed our largest acquisition to date when we acquired EECOL Electric Corporation for approximately $1.1 billion. EECOL is headquartered in Calgary, Alberta with 57 locations throughout Western Canada and 20 locations in South America. While there are risks associated with acquisitions generally, including integration risks, there are additional risks more specifically associated with owning and operating businesses internationally, including those arising from import and export controls, exchange rate fluctuations, material developments in political, regulatory or economic conditions impacting those operations and various environmental and climatic conditions in particular areas of the world. With this acquisition, a greater percentage of our revenues and expenses will arise from international sources that may be subject to these risks from time to time.

WESCO International, Inc.20
Expansion into new business activities, industries, product lines or geographic areas could subject the company to increased costs and risks and may not achieve the intended results.
Engaging in or significantly expanding business activities in product sourcing, sales and services could subject the company to unexpected costs and risks. Such activities could subject us to increased operating costs, product liability, regulatory requirements and reputational risks. Our expansion into new and existing markets, including manufacturing related or regulated businesses, may present competitive, distribution and regulatory challenges that differ from current ones. We may be less familiar with the target customers and may face different or additional risks, as well as increased or unexpected costs, compared to existing operations. Growth into new markets may also bring us into direct competition with companies with whom we have little or no past experience as competitors. To the extent we are reliant upon expansion into new geographic, industry and product markets for growth and do not meet the new challenges posed by such expansion, our future sales growth could be negatively impacted, our operating costs could increase, and our business operations and financial results could be negatively affected.
Loss of key suppliers, product cost fluctuations, lack of product availability or inefficient supply chain operations could decrease sales and earnings.
Most of our agreements with suppliers are terminable by either party on 60 days’ notice or less. Our ten largest suppliers in 2012 accounted for approximately 31% of our purchases for the period. Our largest supplier in 2012 was Eaton Corporation, accounting for approximately 12% of our purchases. The loss of, or a substantial decrease in the availability of, products from any of these suppliers, a supplier’s change in sales strategy to rely less on distribution channels, or the loss of key preferred supplier agreements, could have a material adverse effect on our business. Supply interruptions could arise from shortages of raw materials, effects of economic or financial market conditions on a supplier’s operations, labor disputes or weather conditions affecting products or shipments, transportation disruptions, or other reasons beyond our control. In addition, certain of our products, such as wire and conduit, are commodity-price-based products and may be subject to significant price fluctuations which are beyond our control. Furthermore, we cannot be certain that particular products or product lines will be available to us, or available in quantities sufficient to meet customer demand. Such limited product access could cause us to be at a competitive disadvantage. The profitability of our business is also dependent upon the efficiency of our supply chain. An inefficient or ineffective supply chain strategy or operations could increase operational costs, reduce profit margins and adversely affect our business.
Acquisitions that we may undertake would involve a number of inherent risks, any of which could cause us not to realize the benefits anticipated to result.
We have expanded our operations through organic growth and selected acquisitions of businesses and assets and may seek to do so in the future. Acquisitions involve various inherent risks, including: problems that could arise from the integration of the acquired business; uncertainties in assessing the value, strengths, weaknesses, contingent and other liabilities and potential profitability of acquisition candidates; the potential loss of key employees of an acquired business; the ability to achieve identified operating and financial synergies anticipated to result from an acquisition or other transaction; unanticipated changes in business, industry or general economic conditions that affect the assumptions underlying the acquisition or other transaction rationale; and expansion into new countries or geographic markets where we may be less familiar with operating requirements, target customers and regulatory compliance. Any one or more of these factors could increase our costs or cause us not to realize the benefits anticipated to result from the acquisition of business or assets.
We are subject to costs and risks associated with laws and regulations affecting our business.
The complex legal and regulatory environment exposes us to compliance costs and risks, as well as litigation and other legal proceedings, that could materially affect our operations and financial results. These laws and regulations may change, sometimes significantly, as a result of political or economic events. They include tax laws and regulations, import and export laws and regulations, government contracting laws and regulations, labor and employment laws and regulations, product safety, occupational safety and health laws and regulations, securities and exchange laws and regulations (and other laws applicable to publicly-traded companies such as the Foreign Corrupt Practices Act), and environmental laws and regulations. In addition, proposed laws and regulations in these and other areas, such as healthcare, employment, or legal matters could affect the cost of our business operations. From time to time we are involved in legal proceedings which may relate to, for example, product liability, labor and employment (including wage and hour), tax, import and export compliance, worker health and safety, general commercial and securities matters. While we believe that the outcome of
2012 Annual Report 21
any pending matter is unlikely to have a material adverse effect on our financial condition or liquidity, additional legal proceedings may arise in the future and the outcome of any legal proceedings and other contingencies could require us to take actions which could adversely affect our operations or could require us to pay substantial amounts of money.
Because we conduct business in many countries, we are subject to income taxes as well as non-income based taxes in both the United States and various foreign jurisdictions. As a result, we are required to interpret the income tax laws and rulings in each jurisdiction in which we operate and are subject to ongoing tax audits in various jurisdictions. Due to ambiguity of tax laws in certain of these jurisdictions and the subjective nature of factual determinations, the respective taxing authorities may disagree with certain positions we have taken and assess additional taxes. While we regularly evaluate the likely outcomes of these audits in order to determine the appropriateness of our tax provision, there can be no assurance that we will accurately predict the outcomes of these audits, and the actual outcomes could adversely affect our results of operations.
Our outstanding indebtedness requires debt service commitments that could adversely affect our ability to fulfill our obligations and could limit our growth and impose restrictions on our business.
As of December 31, 2012, we had $1,918.8 million of consolidated indebtedness (excludes debt discount), including $850.0 million in aggregate principal amount of term loans due 2019 (the “Term Loans”) and $344.9 million in aggregate principal amount of 6.0% Convertible Senior Debentures due 2029 (the “2029 Debentures”). Our consolidated indebtedness also includes our mortgage facility, our revolving credit facility (the “Revolving Credit Facility”), which has an aggregate borrowing capacity of $600.0 million, and our accounts receivable securitization facility (the “Receivables Facility”), through which we sell up to $475.0 million of our accounts receivable to a third-party conduit. We and our subsidiaries may undertake additional borrowings in the future, subject to certain limitations contained in the instruments governing our indebtedness.
Our debt service obligations have important consequences, including: our payments of principal and interest reduce the funds available to us for operations, future business opportunities and acquisitions and other purposes; they increase our vulnerability to adverse economic, financial market and industry conditions; our ability to obtain additional financing may be limited; they may hinder our ability to adjust rapidly to changing market conditions; we may be required to incur additional interest due to the contingent interest features of the 2029 Debentures, which are embedded derivatives; and our financial results are affected by increased interest costs. Our ability to make scheduled payments of principal and interest on our debt, refinance our indebtedness, make scheduled payments on our operating leases, fund planned capital expenditures or to finance acquisitions will depend on our future performance, which, to a certain extent, is subject to economic, financial, competitive and other factors beyond our control. There can be no assurance that our business will continue to generate sufficient cash flow from operations in the future to service our debt, make necessary capital expenditures or meet other cash needs. If unable to do so, we may be required to refinance all or a portion of our existing debt, to sell assets or to obtain additional financing. Our Receivables Facility is subject to renewal in August 2014, and our Revolving Credit Facility is subject to renewal in August 2016. There can be no assurance that available funding or any sale of additional receivables or additional financing will be possible at the times of renewal in amounts or terms favorable to us, if at all.
Over the next three years, we will be required to repay approximately $529.8 million of our currently outstanding indebtedness, of which $445.0 million is related to our Receivables Facility expiration, $30.1 million is related to our international lines of credit, $26.4 million is related to our mortgage credit facility (including a balloon payment of all outstanding amounts due in the first quarter of 2013), and $25.5 million is related to our Term Loans.
We must attract, retain and motivate key employees, and the failure to do so may adversely affect our business and results of operations.
Our success depends on hiring, retaining and motivating key employees, including executive, managerial, sales, technical, marketing and support personnel. We may have difficulty locating and hiring qualified personnel. In addition, we may have difficulty retaining such personnel once hired, and key people may leave and compete against us. The loss of key personnel or our failure to attract and retain other qualified and experienced personnel could disrupt or adversely affect our
WESCO International, Inc.22
business, its sales and results of operations. In addition, our operating results could be adversely affected by increased costs due to increased competition for employees, higher employee turnover, which may also result in loss of significant customer business, or increased employee benefit costs.
Our debt agreements contain restrictions that may limit our ability to operate our business.
Our credit facilities also require us to maintain specific earnings to fixed expenses and to meet minimum net worth requirements in certain circumstances. Our Term Loan and credit facilities contain, and any of our future debt agreements may contain, certain covenant restrictions that limit our ability to operate our business, including restrictions on our ability to: incur additional debt or issue guarantees; create liens; make certain investments; enter into transactions with our affiliates; sell certain assets; make capital expenditures; redeem capital stock or make other restricted payments; declare or pay dividends or make other distributions to stockholders; and merge or consolidate with any person. Our Term Loan and credit facilities contain additional affirmative and negative covenants, and our ability to comply with these covenants is dependent on our future performance, which will be subject to many factors, some of which are beyond our control, including prevailing economic conditions.
As a result of these covenants, our ability to respond to changes in business and economic conditions and to obtain additional financing, if needed, may be significantly restricted, and we may be prevented from engaging in transactions that might otherwise be beneficial to us. In addition, our failure to comply with these covenants could result in a default under the 2029 Debentures, the credit facilities, the Term Loan, and our other debt, which could permit the holders to accelerate such debt. If any of our debt is accelerated, we may not have sufficient funds available to repay such debt.
Goodwill and indefinite life intangible assets recorded as a result of our acquisitions could become impaired.
As of December 31, 2012, our combined goodwill and indefinite life intangible assets amounted to $1,882.9 million. To the extent we do not generate sufficient cash flows to recover the net amount of any investments in goodwill and other indefinite life intangible assets recorded, the investment could be considered impaired and subject to write-off. We expect to record further goodwill and other indefinite life intangible assets as a result of future acquisitions we may complete. Future amortization of such assets or impairments, if any, of goodwill or indefinite life intangible assets would adversely affect our results of operations in any given period.
There is a risk that the market value of our common stock may decline.
Stock markets have experienced significant price and trading volume fluctuations, and the market prices of companies in our industry have been volatile. In recent years, volatility and disruption reached unprecedented levels. For some issuers, the markets have exerted downward pressure on stock prices and credit capacity. It is impossible to predict whether the price of our common stock will rise or fall. Trading prices of our common stock will be influenced by our operating results and prospects and by global economic, financial and other factors.
Future sales of our common stock in the public market or issuance of securities senior to our common stock could adversely affect the trading price of our common stock and the value of the 2029 Debentures.
Future sales of substantial amounts of our common stock or equity-related securities in the public market, or the perception that such sales could occur, could adversely affect prevailing trading prices of our common stock and the value of the 2029 Debentures and could impair our ability to raise capital through future offerings of equity or equity-related securities. No prediction can be made as to the effect, if any, that future sales of shares of common stock or the availability of shares of common stock for future sale will have on the trading price of our common stock or the value of the 2029 Debentures.
There may be future dilution of our common stock.
To the extent options to purchase common stock under our stock option plans are exercised, holders of our common stock will incur dilution. Additionally, our 2029 Debentures include contingent conversion price provisions and options for settlement in shares. Based on our current stock price, the 2029 Debentures may be converted into common stock which would increase dilution to our stockholders.
2012 Annual Report 23
Item 1B. Unresolved Staff Comments.
None.
Item 2. Properties.
We have approximately 475 branches, of which approximately 325 are located in the United States, approximately 105 are located in Canada and the remainder are in other locations including Chile, Mexico, the United Kingdom, Singapore, China, and Australia. Approximately 20% of our branches are owned facilities, and the remainder are leased.
The following table summarizes our distribution centers:
Location Square Feet Leased/OwnedWarrendale, PA 194,000 OwnedSparks, NV 131,000 LeasedByhalia, MS 148,000 OwnedLittle Rock, AR 100,000 LeasedMadison, WI 136,000 LeasedDorval, QE 90,000 LeasedBurnaby, BC 65,000 OwnedEdmonton, AB 101,000 LeasedMississauga, ON 246,000 Leased
We also lease our 69,000 square-foot headquarters in Pittsburgh, Pennsylvania. We do not regard the real property associated with any single branch location as material to our operations. We believe our facilities are in good operating condition and are adequate for their respective uses.
WESCO International, Inc.24
Item 3. Legal Proceedings.
From time to time, a number of lawsuits and claims have been or may be asserted against us relating to the conduct of our business, including routine litigation relating to commercial and employment matters. The outcome of any litigation cannot be predicted with certainty, and some lawsuits may be determined adversely to us. However, management does not believe, based on information presently available, that the ultimate outcome of any such pending matters is likely to have a material adverse effect on our financial condition or liquidity, although the resolution in any quarter of one or more of these matters may have a material adverse effect on our results of operations for that period.
As initially reported in our 2008 Annual Report on Form 10-K, WESCO International, Inc. (the “Company”), through its wholly owned subsidiary, WESCO Distribution, Inc., is a defendant in a lawsuit filed in a state court in Indiana in which a customer, ArcelorMittal Indiana Harbor, Inc. (“AIH”), alleges that the Company sold defective products to AIH in 2004 that were supplied to the Company by others. The lawsuit sought monetary damages in the amount of approximately $50 million. On February 14, 2013, the jury returned a verdict in favor of AIH and awarded damages in the amount of approximately $36 million. Judgment was entered on the jury’s verdict on February 14, 2013. The Company disputes this outcome and intends to appeal the judgment. The judgment amount may increase or decrease based on the outcome of various post-trial proceedings, which cannot be predicted with certainty. The Company has also submitted the claims to its insurance carriers.
Information relating to legal proceedings is included in Note 14, Commitments and Contingencies of the Notes to Consolidated Financial Statements and is incorporated herein by reference.
Item 4. Mine Safety Disclosures.
Not applicable.
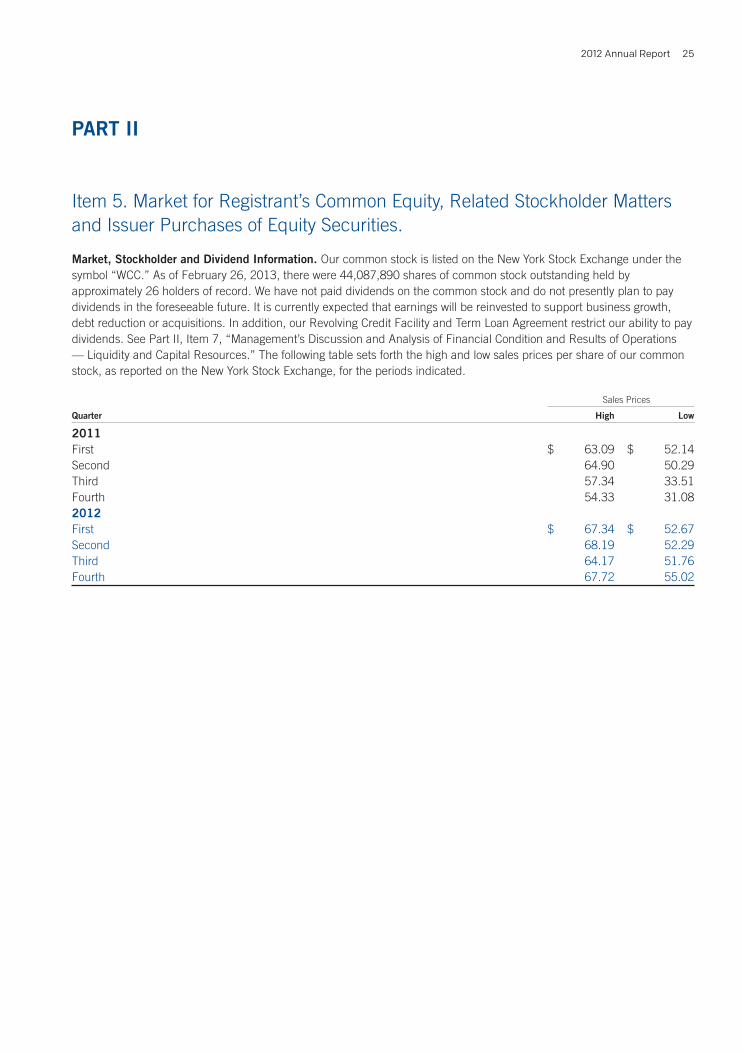
2012 Annual Report 25
PART II
Item 5. Market for Registrant’s Common Equity, Related Stockholder Matters and Issuer Purchases of Equity Securities.
Market, Stockholder and Dividend Information. Our common stock is listed on the New York Stock Exchange under the symbol “WCC.” As of February 26, 2013, there were 44,087,890 shares of common stock outstanding held by approximately 26 holders of record. We have not paid dividends on the common stock and do not presently plan to pay dividends in the foreseeable future. It is currently expected that earnings will be reinvested to support business growth, debt reduction or acquisitions. In addition, our Revolving Credit Facility and Term Loan Agreement restrict our ability to pay dividends. See Part II, Item 7, “Management’s Discussion and Analysis of Financial Condition and Results of Operations — Liquidity and Capital Resources.” The following table sets forth the high and low sales prices per share of our common stock, as reported on the New York Stock Exchange, for the periods indicated.
Sales Prices
Quarter High Low
2011First $ 63.09 $ 52.14Second 64.90 50.29Third 57.34 33.51Fourth 54.33 31.082012 First $ 67.34 $ 52.67Second 68.19 52.29Third 64.17 51.76Fourth 67.72 55.02
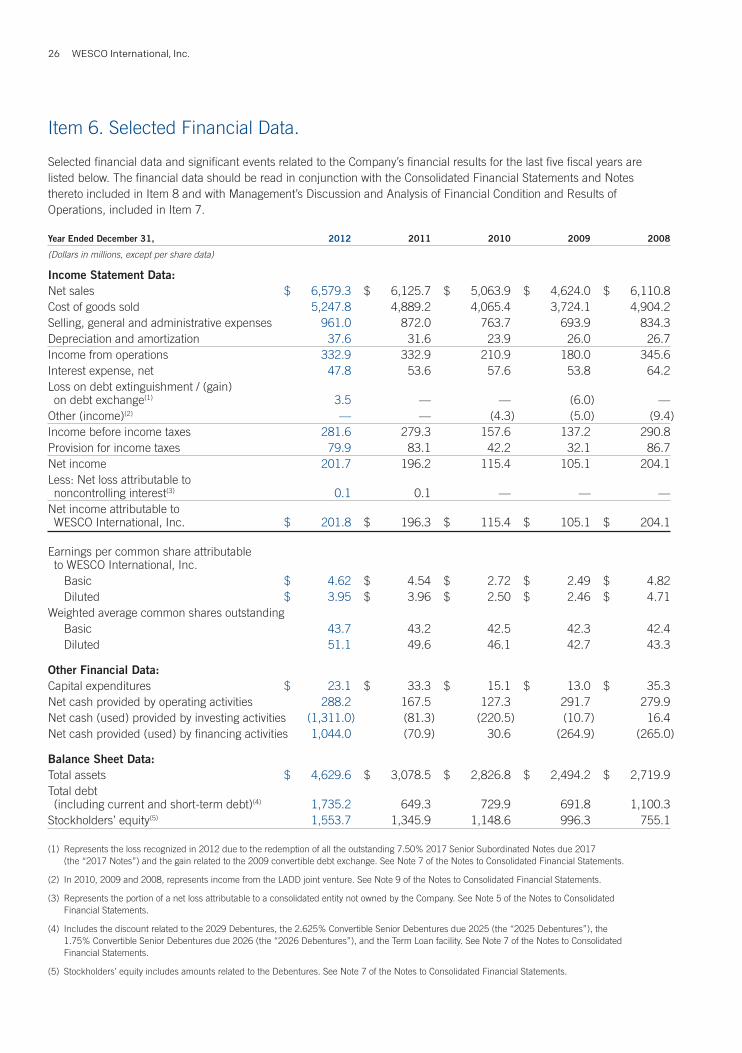
WESCO International, Inc.26
Item 6. Selected Financial Data.
Selected financial data and significant events related to the Company’s financial results for the last five fiscal years are listed below. The financial data should be read in conjunction with the Consolidated Financial Statements and Notes thereto included in Item 8 and with Management’s Discussion and Analysis of Financial Condition and Results of Operations, included in Item 7.
Year Ended December 31, 2012 2011 2010 2009 2008
(Dollars in millions, except per share data)
Income Statement Data: Net sales $ 6,579.3 $ 6,125.7 $ 5,063.9 $ 4,624.0 $ 6,110.8Cost of goods sold 5,247.8 4,889.2 4,065.4 3,724.1 4,904.2Selling, general and administrative expenses 961.0 872.0 763.7 693.9 834.3Depreciation and amortization 37.6 31.6 23.9 26.0 26.7Income from operations 332.9 332.9 210.9 180.0 345.6Interest expense, net 47.8 53.6 57.6 53.8 64.2Loss on debt extinguishment / (gain) on debt exchange(1) 3.5 — — (6.0) —Other (income)(2) — — (4.3) (5.0) (9.4)Income before income taxes 281.6 279.3 157.6 137.2 290.8Provision for income taxes 79.9 83.1 42.2 32.1 86.7Net income 201.7 196.2 115.4 105.1 204.1Less: Net loss attributable to noncontrolling interest(3) 0.1 0.1 — — —Net income attributable to WESCO International, Inc. $ 201.8 $ 196.3 $ 115.4 $ 105.1 $ 204.1
Earnings per common share attributable to WESCO International, Inc. Basic $ 4.62 $ 4.54 $ 2.72 $ 2.49 $ 4.82 Diluted $ 3.95 $ 3.96 $ 2.50 $ 2.46 $ 4.71Weighted average common shares outstanding Basic 43.7 43.2 42.5 42.3 42.4 Diluted 51.1 49.6 46.1 42.7 43.3
Other Financial Data: Capital expenditures $ 23.1 $ 33.3 $ 15.1 $ 13.0 $ 35.3Net cash provided by operating activities 288.2 167.5 127.3 291.7 279.9Net cash (used) provided by investing activities (1,311.0) (81.3) (220.5) (10.7) 16.4Net cash provided (used) by financing activities 1,044.0 (70.9) 30.6 (264.9) (265.0)
Balance Sheet Data: Total assets $ 4,629.6 $ 3,078.5 $ 2,826.8 $ 2,494.2 $ 2,719.9Total debt (including current and short-term debt)(4) 1,735.2 649.3 729.9 691.8 1,100.3Stockholders’ equity(5) 1,553.7 1,345.9 1,148.6 996.3 755.1
(1) Represents the loss recognized in 2012 due to the redemption of all the outstanding 7.50% 2017 Senior Subordinated Notes due 2017 (the “2017 Notes”) and the gain related to the 2009 convertible debt exchange. See Note 7 of the Notes to Consolidated Financial Statements.
(2) In 2010, 2009 and 2008, represents income from the LADD joint venture. See Note 9 of the Notes to Consolidated Financial Statements.
(3) Represents the portion of a net loss attributable to a consolidated entity not owned by the Company. See Note 5 of the Notes to Consolidated Financial Statements.
(4) Includes the discount related to the 2029 Debentures, the 2.625% Convertible Senior Debentures due 2025 (the “2025 Debentures”), the 1.75% Convertible Senior Debentures due 2026 (the “2026 Debentures”), and the Term Loan facility. See Note 7 of the Notes to Consolidated Financial Statements.
(5) Stockholders’ equity includes amounts related to the Debentures. See Note 7 of the Notes to Consolidated Financial Statements.
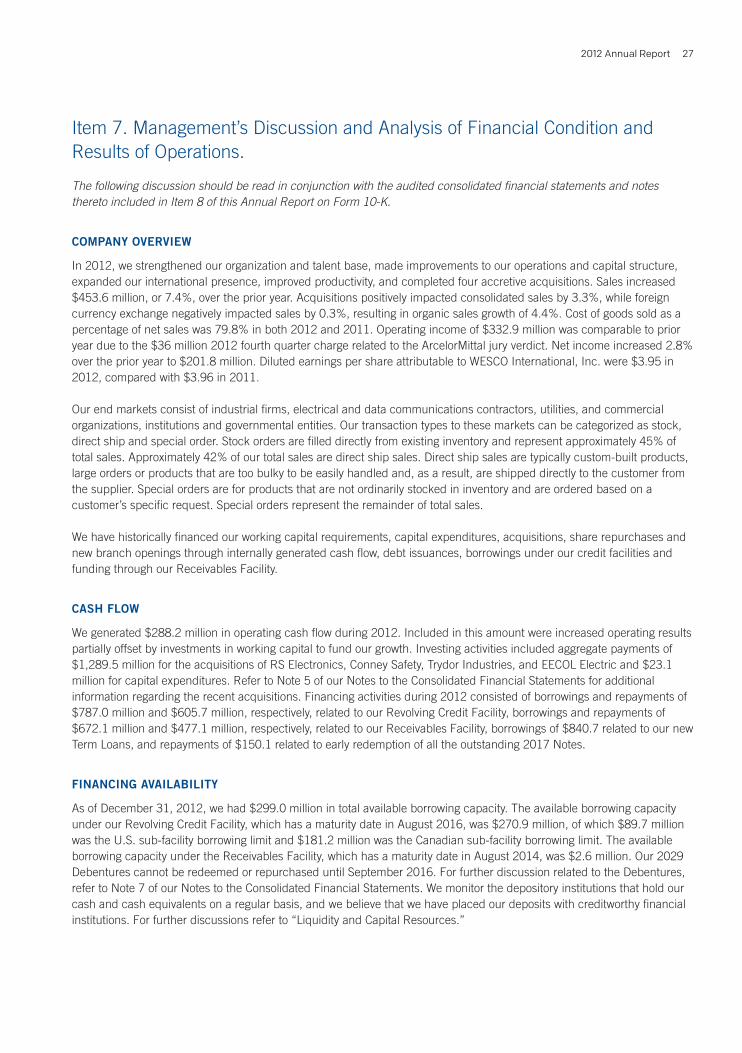
2012 Annual Report 27
Item 7. Management’s Discussion and Analysis of Financial Condition and Results of Operations.
The following discussion should be read in conjunction with the audited consolidated financial statements and notes thereto included in Item 8 of this Annual Report on Form 10-K.
COMPANY OVERVIEW
In 2012, we strengthened our organization and talent base, made improvements to our operations and capital structure, expanded our international presence, improved productivity, and completed four accretive acquisitions. Sales increased $453.6 million, or 7.4%, over the prior year. Acquisitions positively impacted consolidated sales by 3.3%, while foreign currency exchange negatively impacted sales by 0.3%, resulting in organic sales growth of 4.4%. Cost of goods sold as a percentage of net sales was 79.8% in both 2012 and 2011. Operating income of $332.9 million was comparable to prior year due to the $36 million 2012 fourth quarter charge related to the ArcelorMittal jury verdict. Net income increased 2.8% over the prior year to $201.8 million. Diluted earnings per share attributable to WESCO International, Inc. were $3.95 in 2012, compared with $3.96 in 2011.
Our end markets consist of industrial firms, electrical and data communications contractors, utilities, and commercial organizations, institutions and governmental entities. Our transaction types to these markets can be categorized as stock, direct ship and special order. Stock orders are filled directly from existing inventory and represent approximately 45% of total sales. Approximately 42% of our total sales are direct ship sales. Direct ship sales are typically custom-built products, large orders or products that are too bulky to be easily handled and, as a result, are shipped directly to the customer from the supplier. Special orders are for products that are not ordinarily stocked in inventory and are ordered based on a customer’s specific request. Special orders represent the remainder of total sales.
We have historically financed our working capital requirements, capital expenditures, acquisitions, share repurchases and new branch openings through internally generated cash flow, debt issuances, borrowings under our credit facilities and funding through our Receivables Facility.
CASH FLOW
We generated $288.2 million in operating cash flow during 2012. Included in this amount were increased operating results partially offset by investments in working capital to fund our growth. Investing activities included aggregate payments of $1,289.5 million for the acquisitions of RS Electronics, Conney Safety, Trydor Industries, and EECOL Electric and $23.1 million for capital expenditures. Refer to Note 5 of our Notes to the Consolidated Financial Statements for additional information regarding the recent acquisitions. Financing activities during 2012 consisted of borrowings and repayments of $787.0 million and $605.7 million, respectively, related to our Revolving Credit Facility, borrowings and repayments of $672.1 million and $477.1 million, respectively, related to our Receivables Facility, borrowings of $840.7 related to our new Term Loans, and repayments of $150.1 related to early redemption of all the outstanding 2017 Notes.
FINANCING AVAILABILITY
As of December 31, 2012, we had $299.0 million in total available borrowing capacity. The available borrowing capacity under our Revolving Credit Facility, which has a maturity date in August 2016, was $270.9 million, of which $89.7 million was the U.S. sub-facility borrowing limit and $181.2 million was the Canadian sub-facility borrowing limit. The available borrowing capacity under the Receivables Facility, which has a maturity date in August 2014, was $2.6 million. Our 2029 Debentures cannot be redeemed or repurchased until September 2016. For further discussion related to the Debentures, refer to Note 7 of our Notes to the Consolidated Financial Statements. We monitor the depository institutions that hold our cash and cash equivalents on a regular basis, and we believe that we have placed our deposits with creditworthy financial institutions. For further discussions refer to “Liquidity and Capital Resources.”
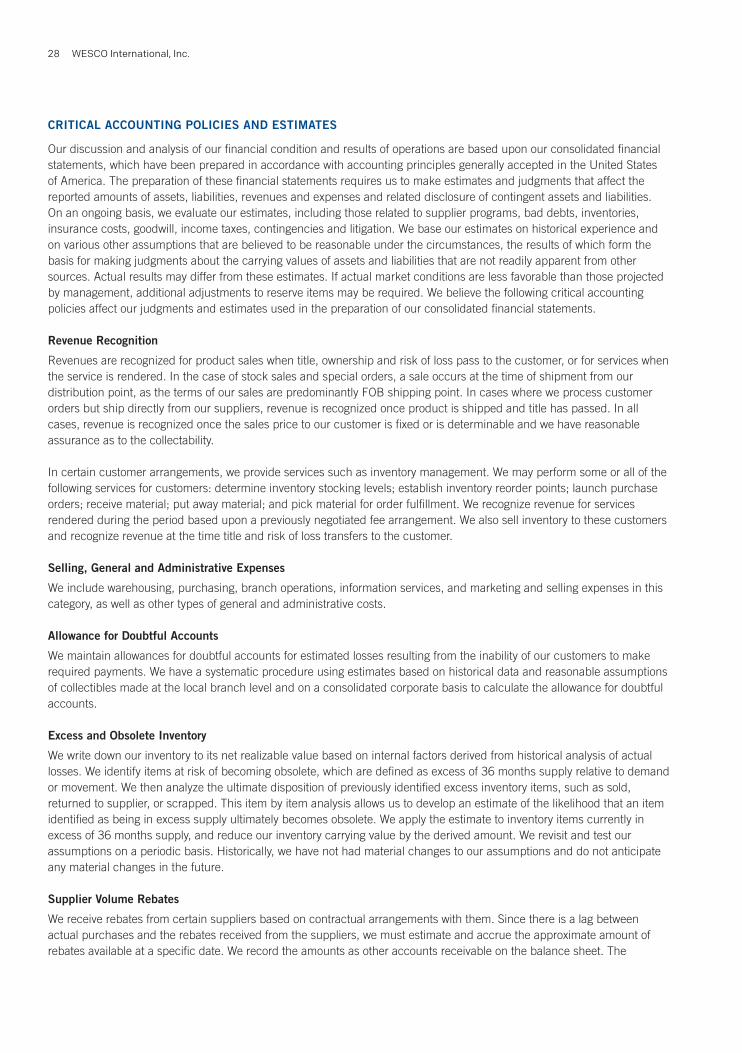
WESCO International, Inc.28
CRITICAL ACCOUNTING POLICIES AND ESTIMATES
Our discussion and analysis of our financial condition and results of operations are based upon our consolidated financial statements, which have been prepared in accordance with accounting principles generally accepted in the United States of America. The preparation of these financial statements requires us to make estimates and judgments that affect the reported amounts of assets, liabilities, revenues and expenses and related disclosure of contingent assets and liabilities. On an ongoing basis, we evaluate our estimates, including those related to supplier programs, bad debts, inventories, insurance costs, goodwill, income taxes, contingencies and litigation. We base our estimates on historical experience and on various other assumptions that are believed to be reasonable under the circumstances, the results of which form the basis for making judgments about the carrying values of assets and liabilities that are not readily apparent from other sources. Actual results may differ from these estimates. If actual market conditions are less favorable than those projected by management, additional adjustments to reserve items may be required. We believe the following critical accounting policies affect our judgments and estimates used in the preparation of our consolidated financial statements.
Revenue Recognition
Revenues are recognized for product sales when title, ownership and risk of loss pass to the customer, or for services when the service is rendered. In the case of stock sales and special orders, a sale occurs at the time of shipment from our distribution point, as the terms of our sales are predominantly FOB shipping point. In cases where we process customer orders but ship directly from our suppliers, revenue is recognized once product is shipped and title has passed. In all cases, revenue is recognized once the sales price to our customer is fixed or is determinable and we have reasonable assurance as to the collectability.
In certain customer arrangements, we provide services such as inventory management. We may perform some or all of the following services for customers: determine inventory stocking levels; establish inventory reorder points; launch purchase orders; receive material; put away material; and pick material for order fulfillment. We recognize revenue for services rendered during the period based upon a previously negotiated fee arrangement. We also sell inventory to these customers and recognize revenue at the time title and risk of loss transfers to the customer.
Selling, General and Administrative Expenses
We include warehousing, purchasing, branch operations, information services, and marketing and selling expenses in this category, as well as other types of general and administrative costs.
Allowance for Doubtful Accounts
We maintain allowances for doubtful accounts for estimated losses resulting from the inability of our customers to make required payments. We have a systematic procedure using estimates based on historical data and reasonable assumptions of collectibles made at the local branch level and on a consolidated corporate basis to calculate the allowance for doubtful accounts.
Excess and Obsolete Inventory
We write down our inventory to its net realizable value based on internal factors derived from historical analysis of actual losses. We identify items at risk of becoming obsolete, which are defined as excess of 36 months supply relative to demand or movement. We then analyze the ultimate disposition of previously identified excess inventory items, such as sold, returned to supplier, or scrapped. This item by item analysis allows us to develop an estimate of the likelihood that an item identified as being in excess supply ultimately becomes obsolete. We apply the estimate to inventory items currently in excess of 36 months supply, and reduce our inventory carrying value by the derived amount. We revisit and test our assumptions on a periodic basis. Historically, we have not had material changes to our assumptions and do not anticipate any material changes in the future.
Supplier Volume Rebates
We receive rebates from certain suppliers based on contractual arrangements with them. Since there is a lag between actual purchases and the rebates received from the suppliers, we must estimate and accrue the approximate amount of rebates available at a specific date. We record the amounts as other accounts receivable on the balance sheet. The
2012 Annual Report 29
corresponding rebate income is recorded as a reduction of cost of goods sold. The appropriate level of such income is derived from the level of actual purchases made by us from suppliers. Supplier volume rebate rates have historically ranged between approximately 0.8% and 1.3% of sales depending on market conditions. In 2012, the rebate rate was 1.3%.
Goodwill and Indefinite Life Intangible Assets
We test goodwill and indefinite life intangible assets for impairment annually during the fourth quarter using information available at the end of September, or more frequently when events or circumstances occur indicating that their carrying value may not be recoverable. We test for goodwill impairment on a reporting unit level. The evaluation of impairment involves comparing the current fair value of goodwill and indefinite life intangible assets to the recorded value. We estimate the fair value of goodwill using a combination of discounted cash flow analyses and market multiples. Assumptions used for these fair value techniques are based on a combination of historical results, current forecasts, market data and recent economic events. We evaluate the recoverability of indefinite life intangible assets using a discounted cash flow analysis based on projected financial information. The determination of fair value involves significant management judgment and we apply our best judgment when assessing the reasonableness of financial projections. Two primary assumptions were a discount rate of 9.8% and a terminal growth rate of 5.0%.
A possible indicator of goodwill impairment is the relationship of a company’s market capitalization to its book value. As of December 31, 2012, our market capitalization exceeded our book value and there were no reporting units sensitive to impairment.
The reported value of indefinite life trademarks totaled $105.1 million and $46.9 million at December 31, 2012 and 2011, respectively. Two trademarks totaling $18.1 million are most sensitive to a decline in financial performance. We are taking actions to improve our financial performance related to these businesses; however, we cannot predict whether or not there will be certain events that could adversely affect the reported value of these trademarks.
Intangible Assets
We account for certain economic benefits purchased as a result of our acquisitions, including customer relations, distribution agreements, technology and trademarks, as intangible assets. Most trademarks have an indefinite life. We amortize all other intangible assets over a useful life determined by the expected cash flows produced by such intangibles and their respective tax benefits. Useful lives vary between 4 and 20 years, depending on the specific intangible asset.
Insurance Programs
We use commercial insurance for auto, workers’ compensation, casualty and health claims as a risk sharing strategy to reduce our exposure to catastrophic losses. Our strategy involves large deductibles where we must pay all costs up to the deductible amount. We estimate our reserve based on historical incident rates and costs.
Income Taxes
We recognize deferred tax assets and liabilities for expected future tax consequences of events that have been included in our consolidated financial statements or tax returns. Deferred tax assets and liabilities are determined based on the difference between the financial reporting and the tax bases of assets and liabilities using enacted tax rates in effect for the year in which the differences are expected to reverse.
We record our deferred tax assets at amounts that are expected to be realized. We evaluate future taxable income and potential tax planning strategies in assessing the potential need for a valuation allowance. Should we determine that it is more likely than not that we would not be able to realize all or part of our deferred tax assets in the future, an adjustment to the deferred tax asset would be charged to income in the period such determination was made.
We account for uncertainty in income taxes using a recognition threshold and measurement attribute prescribed by income tax accounting guidance. We frequently review tax issues and positions taken on tax returns to determine the need and amount of contingency reserves necessary to cover any probable audit adjustments.
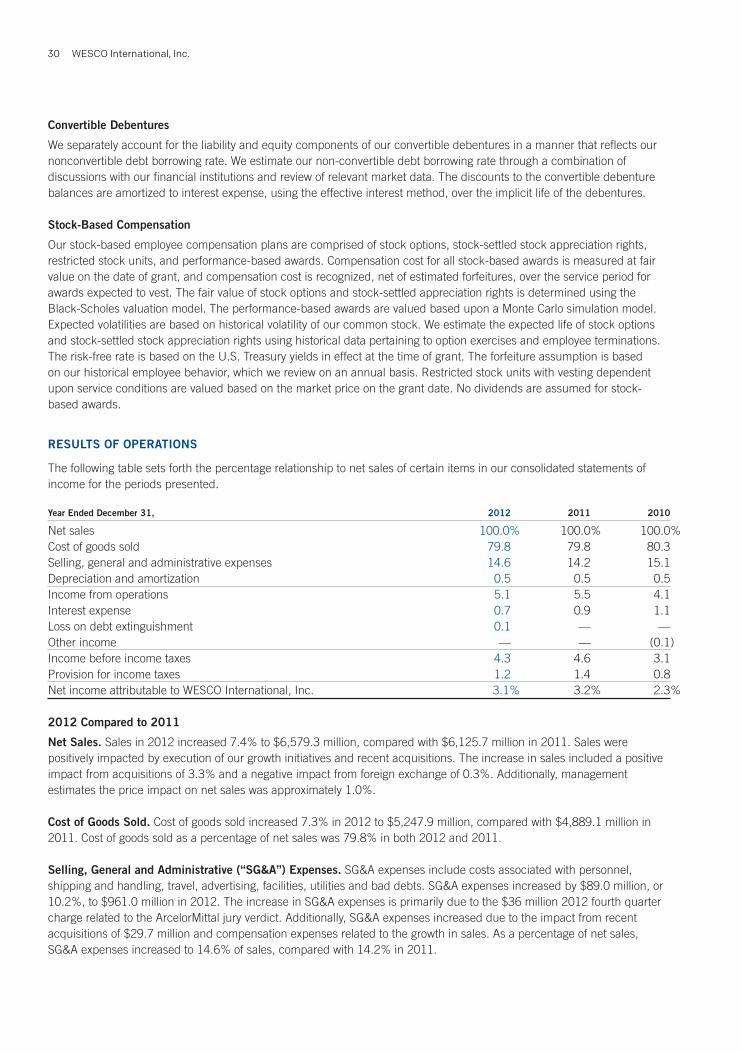
WESCO International, Inc.30
Convertible Debentures
We separately account for the liability and equity components of our convertible debentures in a manner that reflects our nonconvertible debt borrowing rate. We estimate our non-convertible debt borrowing rate through a combination of discussions with our financial institutions and review of relevant market data. The discounts to the convertible debenture balances are amortized to interest expense, using the effective interest method, over the implicit life of the debentures.
Stock-Based Compensation
Our stock-based employee compensation plans are comprised of stock options, stock-settled stock appreciation rights, restricted stock units, and performance-based awards. Compensation cost for all stock-based awards is measured at fair value on the date of grant, and compensation cost is recognized, net of estimated forfeitures, over the service period for awards expected to vest. The fair value of stock options and stock-settled appreciation rights is determined using the Black-Scholes valuation model. The performance-based awards are valued based upon a Monte Carlo simulation model. Expected volatilities are based on historical volatility of our common stock. We estimate the expected life of stock options and stock-settled stock appreciation rights using historical data pertaining to option exercises and employee terminations. The risk-free rate is based on the U.S. Treasury yields in effect at the time of grant. The forfeiture assumption is based on our historical employee behavior, which we review on an annual basis. Restricted stock units with vesting dependent upon service conditions are valued based on the market price on the grant date. No dividends are assumed for stock-based awards.
RESULTS OF OPERATIONS
The following table sets forth the percentage relationship to net sales of certain items in our consolidated statements of income for the periods presented.
Year Ended December 31, 2012 2011 2010
Net sales 100.0% 100.0% 100.0%Cost of goods sold 79.8 79.8 80.3Selling, general and administrative expenses 14.6 14.2 15.1Depreciation and amortization 0.5 0.5 0.5Income from operations 5.1 5.5 4.1Interest expense 0.7 0.9 1.1Loss on debt extinguishment 0.1 — —Other income — — (0.1)Income before income taxes 4.3 4.6 3.1Provision for income taxes 1.2 1.4 0.8Net income attributable to WESCO International, Inc. 3.1% 3.2% 2.3%
2012 Compared to 2011
Net Sales. Sales in 2012 increased 7.4% to $6,579.3 million, compared with $6,125.7 million in 2011. Sales were positively impacted by execution of our growth initiatives and recent acquisitions. The increase in sales included a positive impact from acquisitions of 3.3% and a negative impact from foreign exchange of 0.3%. Additionally, management estimates the price impact on net sales was approximately 1.0%.
Cost of Goods Sold. Cost of goods sold increased 7.3% in 2012 to $5,247.9 million, compared with $4,889.1 million in 2011. Cost of goods sold as a percentage of net sales was 79.8% in both 2012 and 2011.
Selling, General and Administrative (“SG&A”) Expenses. SG&A expenses include costs associated with personnel, shipping and handling, travel, advertising, facilities, utilities and bad debts. SG&A expenses increased by $89.0 million, or 10.2%, to $961.0 million in 2012. The increase in SG&A expenses is primarily due to the $36 million 2012 fourth quarter charge related to the ArcelorMittal jury verdict. Additionally, SG&A expenses increased due to the impact from recent acquisitions of $29.7 million and compensation expenses related to the growth in sales. As a percentage of net sales, SG&A expenses increased to 14.6% of sales, compared with 14.2% in 2011.

2012 Annual Report 31
SG&A payroll expenses for 2012 of $661.6 million increased by $52.7 million compared to 2011. The increase in SG&A payroll expense was primarily due to an increase in salary expense of $40.8 million and an increase in benefits of $15.5 million. These increases are primarily due to an increase in headcount, which is the result of both recent acquisitions and organic growth initiatives. Temporary labor costs and other SG&A payroll related costs each decreased $2.0 million.
The remaining SG&A expenses for 2012 of $263.3 million increased by $0.2 million compared to 2011.
Depreciation and Amortization. Depreciation and amortization increased $6.0 million to $37.6 million in 2012, compared with $31.6 million in 2011. The increase in depreciation and amortization was primarily due to the impact from recent acquisitions of $4.6 million.
Income from Operations. Income from operations decreased by $0.1 million to $332.9 million in 2012, compared to $333.0 million in 2011.
Interest Expense. Interest expense totaled $47.8 million in 2012, compared with $53.6 million in 2011, a decrease of 10.9%. Non-cash interest expense, which includes convertible debt interest, interest related to uncertain tax positions, and the amortization of deferred financing fees, for 2012 and 2011 was $1.5 million and $8.8 million, respectively.
Loss on Debt Extinguishment. In 2012, a loss on debt extinguishment of $3.5 million was incurred due to the redemption of the 2017 Notes.
Income Taxes. Our effective income tax rate decreased to 28.4% in 2012, compared with 29.8% in 2011, primarily as a result of the increase in taxable income outside the United States that is taxed at a lower rate.
Net Income. Net income increased by $5.5 million, or 2.8%, to $201.8 million in 2012, compared to $196.2 million in 2011.
Net Loss attributable to noncontrolling interest. Net loss attributable to noncontrolling interest totaled less than $0.1 million in 2012 and 2011.
Net Income attributable to WESCO International, Inc. Net income and diluted earnings per share attributable to WESCO International, Inc. on a consolidated basis totaled $201.8 million and $3.95 per share, respectively, in 2012, compared with $196.3 million and $3.96 per share, respectively, in 2011.
2011 Compared to 2010
Net Sales. Sales in 2011 increased 21.0% to $6,125.7 million, compared with $5,063.9 million in 2010. Sales were positively impacted by our growth initiatives, improved conditions in our markets served, favorable foreign currency exchange rates positively impacting net sales by 0.8%, and acquisitions positively impacting net sales by 6.8%. Additionally, management estimates the price impact on net sales was approximately 3.0%.
Cost of Goods Sold. Cost of goods sold increased 20.3% in 2011 to $4,889.2 million, compared with $4,065.4 million in 2010. Cost of goods sold as a percentage of net sales was 79.8% in 2011 versus 80.3% in 2010. The decrease in the cost of goods sold percentage was primarily due to the margin impact from recent acquisitions and higher supplier volume rebate rates driven by the increase in sales.
Selling, General and Administrative Expenses. SG&A expenses include costs associated with personnel, shipping and handling, travel, advertising, facilities, utilities and bad debts. SG&A expenses increased by $108.4 million, or 14.2%, to $872.0 million in 2011. The increase in SG&A expenses is primarily due to compensation expenses related to the growth in sales and the impact from recent acquisitions of $44.6 million. As a percentage of net sales, SG&A expenses decreased to 14.2% of sales, compared with 15.1% in 2010. SG&A expenses increased at a lower rate than sales due to the continued effectiveness of our cost control initiatives and the fixed cost nature of certain SG&A expense components.
WESCO International, Inc.32
SG&A payroll expenses for 2011 of $608.9 million increased by $81.4 million compared to 2010. The increase in SG&A payroll expense was primarily due to an increase in salary expense of $43.9 million and an increase in commissions and incentives of $23.7 million. These increases are primarily due to an increase in headcount, which is the result of both recent acquisitions and organic growth initiatives.
The remaining SG&A expenses for 2011 of $263.1 million increased by $27.0 million compared to 2010 due to an increase in variable operating expenses associated with the growth in sales.
Depreciation and Amortization. Depreciation and amortization increased $7.7 million to $31.6 million in 2011, compared with $23.9 million in 2010. The increase in depreciation and amortization was primarily due to an increase in capital expenditures from $15.1 million in 2010 to $33.3 million in 2011.
Income from Operations. Income from operations increased by $122.1 million, or 57.9%, to $332.9 million in 2011, compared to $210.9 million in 2010.
Interest Expense. Interest expense totaled $53.6 million in 2011, compared with $57.6 million in 2010, a decrease of 6.9%. In 2010, interest expense was negatively impacted by $4.2 million resulting from the resolution of an outstanding tax matter.
Other Income. No other income was reported in 2011. In 2010, other income was comprised of equity income from the LADD joint venture totaling $4.3 million.
Income Taxes. Our effective income tax rate increased to 29.8% in 2011, compared with 26.7% in 2010, primarily as a result of the increase in taxable income in the United States.
Net Income. Net income increased by $80.8 million, or 69.9%, to $196.2 million in 2011, compared to $115.4 million in 2010.
Net Loss attributable to noncontrolling interest. Net loss attributable to noncontrolling interest totaled less than $0.1 million in 2011.
Net Income attributable to WESCO International, Inc. Net income and diluted earnings per share attributable to WESCO International, Inc. on a consolidated basis totaled $196.3 million and $3.96 per share, respectively, in 2011, compared with $115.4 million and $2.50 per share, respectively, in 2010.
LIQUIDITY AND CAPITAL RESOURCES
Total assets were $4.6 billion at December 31, 2012, compared to $3.1 billion at December 31, 2011. The $1.3 billion increase in total assets was principally attributable to the increase in goodwill of $769.7 million, intangible assets of $339.9 million, inventory of $167.0 million, and accounts receivable of $96.8 million. These increases are primarily attributable to recent acquisitions along with an increase in sales activity. Total liabilities at December 31, 2012 compared to December 31, 2011 increased by $1.3 billion to $3.1 billion. Contributing to the increase in total liabilities was the increase in long-term debt of $1,052.5 million and accounts payable of $63.8 million. These increases were associated with the recent and current year acquisitions and increased purchasing activity. Stockholders’ equity increased by 15.4% to $1.6 billion at December 31, 2012, compared with $1.3 billion at December 31, 2011, primarily as a result of net earnings of $201.8 million.
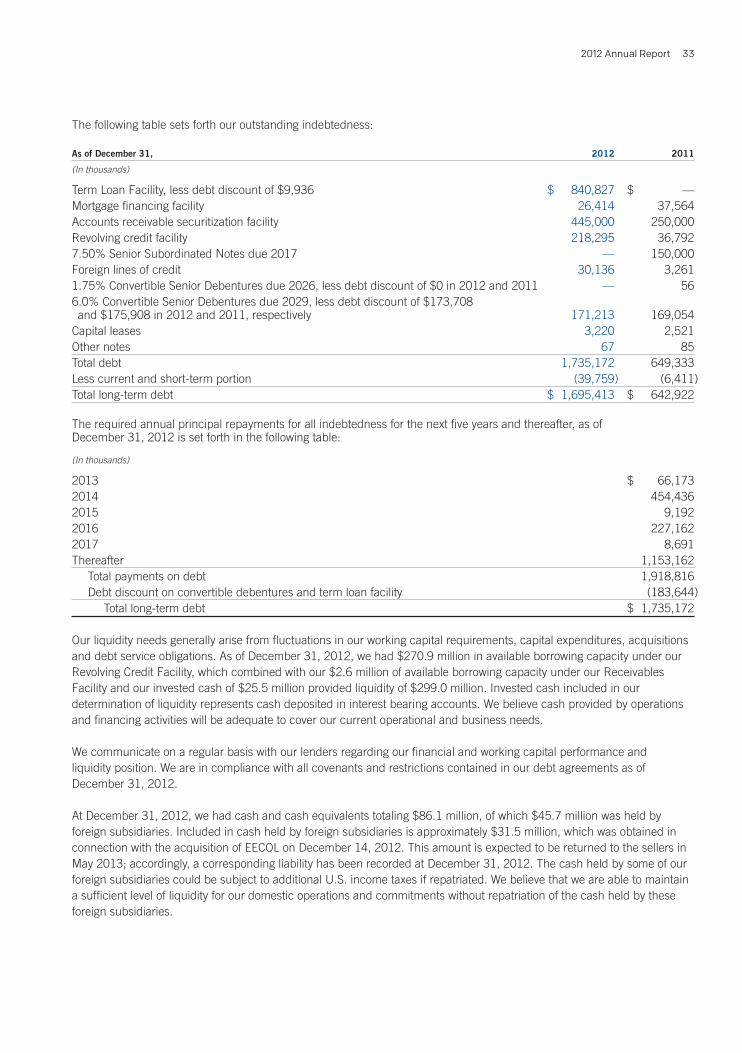
2012 Annual Report 33
The following table sets forth our outstanding indebtedness:
As of December 31, 2012 2011
(In thousands)
Term Loan Facility, less debt discount of $9,936 $ 840,827 $ —Mortgage financing facility 26,414 37,564Accounts receivable securitization facility 445,000 250,000Revolving credit facility 218,295 36,7927.50% Senior Subordinated Notes due 2017 — 150,000Foreign lines of credit 30,136 3,2611.75% Convertible Senior Debentures due 2026, less debt discount of $0 in 2012 and 2011 — 566.0% Convertible Senior Debentures due 2029, less debt discount of $173,708 and $175,908 in 2012 and 2011, respectively 171,213 169,054Capital leases 3,220 2,521Other notes 67 85Total debt 1,735,172 649,333Less current and short-term portion (39,759) (6,411)Total long-term debt $ 1,695,413 $ 642,922
The required annual principal repayments for all indebtedness for the next five years and thereafter, as of December 31, 2012 is set forth in the following table:
(In thousands)
2013 $ 66,1732014 454,4362015 9,1922016 227,1622017 8,691Thereafter 1,153,162 Total payments on debt 1,918,816 Debt discount on convertible debentures and term loan facility (183,644) Total long-term debt $ 1,735,172
Our liquidity needs generally arise from fluctuations in our working capital requirements, capital expenditures, acquisitions and debt service obligations. As of December 31, 2012, we had $270.9 million in available borrowing capacity under our Revolving Credit Facility, which combined with our $2.6 million of available borrowing capacity under our Receivables Facility and our invested cash of $25.5 million provided liquidity of $299.0 million. Invested cash included in our determination of liquidity represents cash deposited in interest bearing accounts. We believe cash provided by operations and financing activities will be adequate to cover our current operational and business needs.
We communicate on a regular basis with our lenders regarding our financial and working capital performance and liquidity position. We are in compliance with all covenants and restrictions contained in our debt agreements as of December 31, 2012.
At December 31, 2012, we had cash and cash equivalents totaling $86.1 million, of which $45.7 million was held by foreign subsidiaries. Included in cash held by foreign subsidiaries is approximately $31.5 million, which was obtained in connection with the acquisition of EECOL on December 14, 2012. This amount is expected to be returned to the sellers in May 2013; accordingly, a corresponding liability has been recorded at December 31, 2012. The cash held by some of our foreign subsidiaries could be subject to additional U.S. income taxes if repatriated. We believe that we are able to maintain a sufficient level of liquidity for our domestic operations and commitments without repatriation of the cash held by these foreign subsidiaries.
WESCO International, Inc.34
Over the next several quarters, we expect to maintain working capital productivity, and it is expected that excess cash will be directed primarily at debt reduction and acquisitions. Our near term focus will be managing our working capital as we experience sales growth and maintaining ample liquidity and credit availability. We anticipate capital expenditures in 2013 to be at levels similar to 2012. We believe our balance sheet and ability to generate ample cash flow provides us with a durable business model and should allow us to fund expansion needs and growth initiatives.
We finance our operating and investing needs as follows:
Term Loan Facility
On December 12, 2012, WESCO Distribution, as U.S. borrower, WDCC Enterprises, Inc. (WDCC and together with WESCO Distribution, the “Borrowers”), as Canadian borrower, and WESCO International entered into a Term Loan Agreement (the “Term Loan Agreement”) among WESCO Distribution, WDCC, the Company, the lenders party thereto and Credit Suisse AG Cayman Islands Branch, as administrative agent and as collateral agent.
The Term Loan Agreement provides for a seven-year term loan facility (the “Term Loan Facility”), which consists of two separate sub-facilities: (i) a Canadian sub-facility in an aggregate principal amount of CAD $150.0 million, issued at a 2.0% discount and (ii) a U.S. sub-facility in an aggregate principal amount of US $700.0 million, issued at a 1.0% discount. WESCO is amortizing the debt discount and financing costs over the life of the instrument. Non-cash interest expense of $0.1 million was recorded for the year ended December 31, 2012. The debt discount amortization is expected to be $1.4 million annually.
Subject to the terms of the Term Loan Facility, the Borrowers may request incremental term loans thereunder from time to time in an aggregate principal amount not to exceed at any time US $300.0 million, with an equivalent principal amount in U.S. Dollars being calculated for any incremental term loan denominated in Canadian Dollars, in order to finance certain permitted acquisitions. The proceeds of the Term Loan Facility were used to finance the acquisition of EECOL, to pay fees and expenses incurred in connection with the acquisition and certain other transactions. At December 31, 2012, WESCO had a balance outstanding under the facility of US $850.8 million.
Borrowings under the Term Loan Facility bear interest at base rates plus applicable margins. At December 31, 2012, the interest rates on borrowings under the Canadian sub-facility and U.S. sub-facility were approximately 5.2% and 4.5%, respectively. The Borrowers will pay quarterly installments of principal equal to 0.25% of the original principal amount of their respective term loans, plus accrued and unpaid interest, beginning on March 31, 2013. To the extent not previously paid, the term loans will become due and payable on December 12, 2019, with any unpaid incremental term loans becoming due and payable on the respective maturity dates applicable to those incremental term loans. Other than in certain circumstances prior to the first anniversary of the closing of the Term Loan Facility, at any time or from time to time, the Borrowers may prepay borrowings under the Term Loan Facility in whole or in part without premium or penalty. The Borrowers’ obligations under the Term Loan Facility are secured by substantially all of the assets of the Borrowers, the Company and certain of the Company’s other subsidiaries; provided that, with respect to borrowings under the U.S. sub-facility, the collateral does not include assets of certain foreign subsidiaries or more than 65% of the issued and outstanding equity interests in certain foreign subsidiaries.
The Term Loan Facility contains customary affirmative and negative covenants for credit facilities of this type, including limitations on the Term Loan Parties with respect to indebtedness, liens, investments, mergers and acquisitions, dispositions of assets and transactions with affiliates. The Term Loan Facility also provides for customary events of default.
Mortgage Financing Facility
In 2003, WESCO finalized a mortgage financing facility of $51 million, of which $26.4 million was outstanding as of December 31, 2012. Total borrowings under the mortgage financing facility are subject to a 22-year amortization schedule, with a balloon payment due during the first quarter of 2013. The interest rate on borrowings under this facility is fixed at 6.5%. The Company’s intent is to pay the 2013 obligations of $26.4 million utilizing the Revolving Credit Facility and therefore this facility is classified as long-term.

2012 Annual Report 35
Accounts Receivable Securitization Facility
On December 11, 2012, WESCO Distribution entered into an amendment of the Receivables Facility pursuant to the terms and conditions of a Seventh Amendment to Third Amended and Restated Receivables Purchase Agreement, dated as of December 11, 2012 (the “Amendment”), by and among WESCO Receivables Corp. (“WESCO Receivables”), WESCO Distribution, the Purchasers and Purchaser Agents party thereto and PNC Bank, National Association, as Administrator. The Amendment, among other things, added certain defined terms and amended certain other terms such as change in control, excluded receivables, and an intercreditor agreement. Substantially all other terms and conditions of the Receivables Facility remain unchanged. In addition, on December 11, 2012, WESCO Distribution and WESCO Receivables exercised an existing accordion feature under the Receivables Facility to increase the purchasing limit thereunder from $450.0 million to $475.0 million. The Receivables Facility matures in August 2014.
Under the Receivables Facility, we sell, on a continuous basis, an undivided interest in all domestic accounts receivable to WESCO Receivables, a wholly owned special purpose entity (the “SPE”). The SPE sells, without recourse, a senior undivided interest in the receivables to third-party conduits and financial institutions for cash while maintaining a subordinated undivided interest in the receivables, in the form of overcollateralization. WESCO has agreed to continue servicing the sold receivables for the third-party conduits and financial institutions at market rates; accordingly, no servicing asset or liability has been recorded.
As of December 31, 2012 and 2011, accounts receivable eligible for securitization totaled approximately $601.1 million and $613.9 million, respectively. The consolidated balance sheets as of December 31, 2012 and 2011 include $445.0 million and $250.0 million, respectively, of account receivable balances legally sold to third parties, as well as borrowings for equal amounts. At December 31, 2012, the interest rate on borrowings under this facility was approximately 1.4%.
Revolving Credit Facility
On December 12, 2012, WESCO Distribution and certain other subsidiaries of the Company entered into a US $600.0 million revolving credit facility, which includes a letter of credit sub-facility of up to US $90.0 million in the aggregate, pursuant to the terms and conditions of an Amended and Restated Credit Agreement, dated as of December 12, 2012, among WESCO Distribution, the other U.S. Borrowers party thereto, WESCO Distribution Canada LP (“WESCO Canada”) and WDCC Enterprises, Inc. (“WDCC”), as Canadian Borrowers, the other Loan Parties party thereto, the Lenders party thereto, JPMorgan Chase Bank, N.A., as Administrative Agent, and JPMorgan Chase Bank, N.A., Toronto Branch, as Canadian Administrative Agent. Upon completion of the acquisition of EECOL on December 14, 2012, EECOL was added as a Canadian Borrower. The Revolving Credit Facility contains an accordion feature allowing WESCO Distribution to request increases to the borrowing commitments under the Credit Facility of up to US $100.0 million in the aggregate. The Revolving Credit Facility replaced WESCO Distribution’s US $400.0 million revolving credit facility originally entered into on August 22, 2011.
The Revolving Credit Facility matures in August 2016 and consists of two separate sub-facilities: (i) a Canadian sub-facility with a borrowing limit of up to US $400.0 million, which is collateralized by substantially all assets of WESCO Canada, WDCC and EECOL, and (ii) a U.S. sub-facility with a borrowing limit of up to US $600.0 million less the amount of outstanding borrowings under the Canadian sub-facility. The U.S. sub-facility is collateralized by substantially all assets of WESCO Distribution and its U.S. subsidiaries other than real property and accounts receivable sold or intended to be sold pursuant to the Receivables Facility. Availability under the Revolving Credit Facility is based upon the amount of eligible inventory and receivables applied against certain advance rates. The applicable interest rate for borrowings under the Revolving Credit Facility includes interest rate spreads based on available borrowing capacity that range between 1.50% and 2.00% for LIBOR-based borrowings and 0.50% and 1.00% for prime rate-based borrowings. The otherwise applicable interest rate is reduced by 0.25% if the Company’s leverage ratio falls below a ratio of 2.5 to 1.0. At December 31, 2012, the interest rate on borrowings under this facility was approximately 2.5%.
The Credit Agreement contains customary affirmative and negative covenants for credit facilities of this type, including limitations on WESCO Distribution, the Company and certain of the Company’s other subsidiaries with respect to indebtedness, liens, investments, mergers and acquisitions, dispositions of assets and transactions with affiliates. Subject
WESCO International, Inc.36
to the terms of the Credit Agreement, the Company is permitted to pay dividends, repurchase common stock or repurchase indebtedness without limitation so long as pro forma combined availability under the Revolving Credit Facility and the Receivables Facility exceeds US $160.0 million and the adjusted fixed charge ratio is not less than a ratio of 1.1 to 1.0.
During 2012, WESCO borrowed $787.0 million in the aggregate under the Revolving Credit Facility and made repayments in the aggregate amount of $605.7 million. During 2011, aggregate borrowings and repayments were $435.7 million and $398.9 million, respectively. At December 31, 2012, WESCO had a balance outstanding of $218.3 million under the Revolving Credit facility. WESCO had $270.9 million available under the Revolving Credit facility at December 31, 2012, after giving effect to outstanding letters and foreign lines of credit, as compared to approximately $299.3 million at December 31, 2011.
7.50% Senior Subordinated Notes due 2017
On December 10, 2012, WESCO International announced that WESCO Distribution would redeem all of its outstanding 2017 Notes on January 9, 2013 (the “Redemption Date”) at a redemption price equal to 101.250% of the principal amount thereof plus accrued and unpaid interest to, but excluding, the Redemption Date, for a total of $1,030 per $1,000 principal amount of 2017 Notes. The aggregate principal amount of 2017 Notes outstanding was $150.0 million. On December 11, 2012, in accordance with the terms of the Indenture, dated as of September 27, 2005, among WESCO Distribution, WESCO International and The Bank of New York Mellon, as trustee (the “Trustee”), WESCO Distribution irrevocably deposited with the Trustee funds sufficient to pay principal and interest of all outstanding 2017 Notes on the Redemption Date. As a result, the Indenture was satisfied and discharged.
Foreign Lines of Credit
Certain foreign subsidiaries of WESCO have entered into uncommitted lines of credit, which serve as overdraft facilities, to support local operations. The maximum borrowing limit varies by facility and ranges between US $0.5 million and US $8.0 million. The applicable interest rate for borrowings under these lines of credit varies by country and is governed by the applicable loan agreement. The foreign lines of credit are renewable on an annual basis and are fully and unconditionally guaranteed by WESCO Distribution. Accordingly, these lines directly reduce availability under the Revolving Credit Facility.
1.75% Convertible Senior Debentures due 2026
Proceeds of $300 million were received in connection with the issuance of the 2026 Debentures by WESCO International in November 2006. On August 27, 2009, WESCO International completed an exchange offer pursuant to which it issued $345.0 million in aggregate principal amount of 2029 Debentures in exchange for approximately $299.7 million and $57.7 million in aggregate principal amounts of its outstanding 2026 Debentures and 2025 Debentures, respectively (see the 6.0% Convertible Senior Debentures due 2029 discussion below for additional information). On November 30, 2011, WESCO International announced that it would redeem all of its 2026 Debentures on January 3, 2012. WESCO International redeemed the remaining $0.1 million aggregate principal amount of outstanding 2026 Debentures at a redemption price equal to 100% of the principal amount plus accrued and unpaid interest. Following the redemption on January 3, 2012, there were no 2026 Debentures outstanding.
On January 1, 2009, we retrospectively applied the provisions of guidance concerning convertible debt instruments to the 2026 Debentures. We utilized an interest rate of 6% to reflect the non-convertible market rate of our offering upon issuance. We amortized the debt discount over a five year period starting on the date of issuance. Non-cash interest expense of less than $0.1 million was recorded for the years ended December 31, 2011 and 2010.
6.0% Convertible Senior Debentures due 2029
On August 27, 2009, WESCO International completed an exchange offer pursuant to which it issued $345.0 million in aggregate principal amount of 2029 Debentures in exchange for approximately $299.7 million and $57.7 million in aggregate principal amounts of its outstanding 2026 Debentures and 2025 Debentures, respectively. As a result of the debt exchange, WESCO recorded a gain of $6.0 million, which included the write-off of debt issuance costs. The 2029 Debentures were issued pursuant to an Indenture dated August 27, 2009 (the “Indenture”), with The Bank of New York Mellon, as trustee, and are unconditionally guaranteed on an unsecured senior subordinate basis by WESCO Distribution.
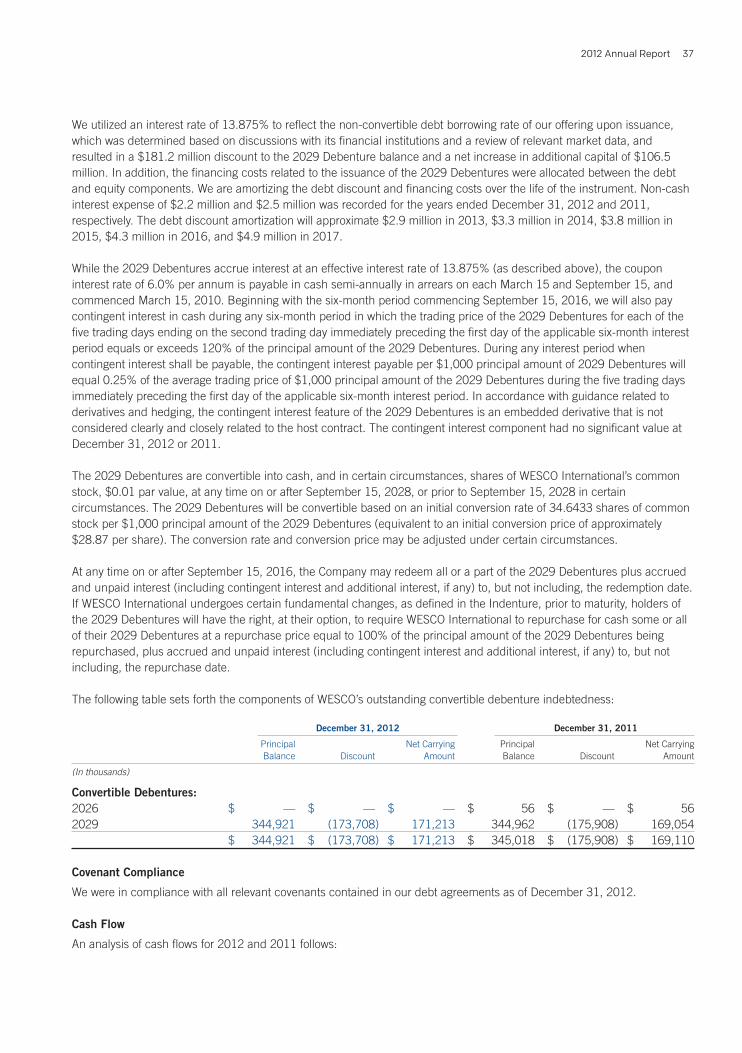
2012 Annual Report 37
We utilized an interest rate of 13.875% to reflect the non-convertible debt borrowing rate of our offering upon issuance, which was determined based on discussions with its financial institutions and a review of relevant market data, and resulted in a $181.2 million discount to the 2029 Debenture balance and a net increase in additional capital of $106.5 million. In addition, the financing costs related to the issuance of the 2029 Debentures were allocated between the debt and equity components. We are amortizing the debt discount and financing costs over the life of the instrument. Non-cash interest expense of $2.2 million and $2.5 million was recorded for the years ended December 31, 2012 and 2011, respectively. The debt discount amortization will approximate $2.9 million in 2013, $3.3 million in 2014, $3.8 million in 2015, $4.3 million in 2016, and $4.9 million in 2017.
While the 2029 Debentures accrue interest at an effective interest rate of 13.875% (as described above), the coupon interest rate of 6.0% per annum is payable in cash semi-annually in arrears on each March 15 and September 15, and commenced March 15, 2010. Beginning with the six-month period commencing September 15, 2016, we will also pay contingent interest in cash during any six-month period in which the trading price of the 2029 Debentures for each of the five trading days ending on the second trading day immediately preceding the first day of the applicable six-month interest period equals or exceeds 120% of the principal amount of the 2029 Debentures. During any interest period when contingent interest shall be payable, the contingent interest payable per $1,000 principal amount of 2029 Debentures will equal 0.25% of the average trading price of $1,000 principal amount of the 2029 Debentures during the five trading days immediately preceding the first day of the applicable six-month interest period. In accordance with guidance related to derivatives and hedging, the contingent interest feature of the 2029 Debentures is an embedded derivative that is not considered clearly and closely related to the host contract. The contingent interest component had no significant value at December 31, 2012 or 2011.
The 2029 Debentures are convertible into cash, and in certain circumstances, shares of WESCO International’s common stock, $0.01 par value, at any time on or after September 15, 2028, or prior to September 15, 2028 in certain circumstances. The 2029 Debentures will be convertible based on an initial conversion rate of 34.6433 shares of common stock per $1,000 principal amount of the 2029 Debentures (equivalent to an initial conversion price of approximately $28.87 per share). The conversion rate and conversion price may be adjusted under certain circumstances.
At any time on or after September 15, 2016, the Company may redeem all or a part of the 2029 Debentures plus accrued and unpaid interest (including contingent interest and additional interest, if any) to, but not including, the redemption date. If WESCO International undergoes certain fundamental changes, as defined in the Indenture, prior to maturity, holders of the 2029 Debentures will have the right, at their option, to require WESCO International to repurchase for cash some or all of their 2029 Debentures at a repurchase price equal to 100% of the principal amount of the 2029 Debentures being repurchased, plus accrued and unpaid interest (including contingent interest and additional interest, if any) to, but not including, the repurchase date.
The following table sets forth the components of WESCO’s outstanding convertible debenture indebtedness:
December 31, 2012 December 31, 2011
Principal Net Carrying Principal Net Carrying Balance Discount Amount Balance Discount Amount
(In thousands)
Convertible Debentures:2026 $ — $ — $ — $ 56 $ — $ 562029 344,921 (173,708) 171,213 344,962 (175,908) 169,054 $ 344,921 $ (173,708) $ 171,213 $ 345,018 $ (175,908) $ 169,110
Covenant Compliance
We were in compliance with all relevant covenants contained in our debt agreements as of December 31, 2012.
Cash Flow
An analysis of cash flows for 2012 and 2011 follows:
WESCO International, Inc.38
Operating Activities. Cash provided by operating activities for 2012 totaled $288.2 million, compared with $167.5 million of cash generated in 2011. Cash provided by operating activities included net income of $201.8 million and adjustments to net income totaling $61.6 million. Others sources of cash in 2012 were generated from a decrease in trade and other receivables of $36.4 million and a decrease in prepaid expenses and other current assets of $19.6 million. Primary uses of cash in 2012 included $29.3 million for the increase in inventory, $25.0 million for the decrease in other current and noncurrent liabilities, and $24.3 million for the decrease in payables. In 2011, primary sources of cash were net income of $196.2 million and adjustments to net income totaling $65.1 million. Other sources of cash in 2011 were generated from an increase in accounts payable of $101.7 million, an increase in accrued payroll and benefit costs of $10.0 million due to the increase in commissions, incentives, and benefit costs and a decrease in prepaid expenses and other current assets of $11.3 million. Primary uses of cash in 2011 included: $143.5 million for the increase in trade and other receivables, resulting from the increase in sales; $33.8 million for the increase in inventory; and $39.5 million for the decrease in other current and noncurrent liabilities.
Investing Activities. Net cash used by investing activities in 2012 was $1,311.0 million, compared with $81.3 million of net cash used in 2011. Included in 2012 were payments of $1,289.5 million for the acquisition of the businesses of EECOL, RS, Trydor, and Conney. During 2011, payments of $48.1 million were made for the acquisition of the businesses of RECO, LLC and Brews Supply, Ltd. Capital expenditures were $23.1 million and $33.3 million in 2012 and 2011, respectively.
Financing Activities. Net cash used by financing activities in 2012 was $1,044.0 million, compared with $70.9 million of net cash provided in 2011. During 2012, financing activities consisted of borrowings and repayments of $787.0 million and $605.7 million, respectively, related to our Revolving Credit Facility, borrowings and repayments of $672.1 million and $477.1 million, respectively, related to our Receivables Facility, borrowings of $840.8 related to our new Term Loan, and repayments of $150.0 related to early redemption of all the outstanding 2017 Notes. During 2011, borrowings and repayments of long-term debt of $435.7 million and $398.9 million, respectively, were made to our Revolving Credit Facility. Borrowings and repayments of $210.0 million and $330.0 million respectively, were applied to our Receivables Facility.
Contractual Cash Obligations and Other Commercial Commitments
The following summarizes our contractual obligations, including interest, at December 31, 2012 and the effect such obligations are expected to have on liquidity and cash flow in future periods.
2013 2014 to 2015 2016 to 2017 2018 – After Total
(In millions)
Contractual cash obligations (including interest): Debt, excluding debt discount $ 66.2 $ 463.6 $ 235.9 $ 1,153.1 $ 1,918.8Interest on indebtedness(1) 73.8 136.3 124.2 321.0 655.3Non-cancelable operating leases 53.5 76.0 52.1 53.1 234.7Total contractual cash obligations $ 193.5 $ 675.9 $ 412.2 $ 1,527.2 $ 2,808.8
(1) Interest on the variable rate debt was calculated using the rates and balances outstanding at December 31, 2012.
Purchase orders for inventory requirements and service contracts are not included in the table above. Generally, our purchase orders and contracts contain clauses allowing for cancellation. We do not have significant agreements to purchase material or goods that would specify minimum order quantities. Also, we do not consider obligations to taxing authorities to be contractual obligations requiring disclosure due to the uncertainty surrounding the ultimate settlement and timing of these obligations. As such, we have not included $30.0 million of such estimated liability in the table above.

2012 Annual Report 39
INFLATION
The rate of inflation, as measured by changes in the producer price index, affects different commodities, the cost of products purchased and ultimately the pricing of our different products and product classes to our customers. Our pricing related to inflation did not have a material impact on our sales revenue for the year ended December 31, 2012. Historically, price changes from suppliers have been consistent with inflation and have not had a material impact on the results of operations.
SEASONALITY
Our operating results are not significantly affected by seasonal factors. Sales during the first and fourth quarters are generally 1-3% below the sales of the second and third quarters, due to a reduced level of activity during the winter months of November through February. Sales typically increase beginning in March, with slight fluctuations per month through October. During periods of economic expansion or contraction our sales by quarter have varied significantly from this pattern.
IMPACT OF RECENTLY ISSUED ACCOUNTING STANDARDS
See Note 2 of our Notes to the Consolidated Financial Statements for information regarding the effect of new accounting pronouncements.
Item 7A. Quantitative and Qualitative Disclosures about Market Risks.
FOREIGN CURRENCY RISKS
Approximately 79% of our sales are denominated in U.S. dollars and are primarily from customers in the United States. As a result, currency fluctuations are currently not material to our operating results. We do have foreign subsidiaries located in North America, South America, Europe, Africa, Asia and Australia and may establish additional foreign subsidiaries in the future. Accordingly, we may derive a larger portion of our sales from international operations, and a portion of these sales may be denominated in foreign currencies. As a result, our future operating results could become subject to fluctuations in the exchange rates of those currencies in relation to the U.S. dollar. Furthermore, to the extent that we engage in international sales denominated in U.S. dollars, an increase in the value of the U.S. dollar relative to foreign currencies could make our products less competitive in international markets. We have monitored and will continue to monitor our exposure to currency fluctuations.
INTEREST RATE RISK
Fixed Rate Borrowings: Approximately 19% of our debt portfolio is comprised of fixed rate debt. At various times, we have refinanced our debt to mitigate the impact of interest rate fluctuations. As the 2029 Debentures were issued at fixed rates, interest expense would not be impacted by interest rate fluctuations, although market value would be. The aggregate fair value of the 2029 Debentures was $853.7 million at December 31, 2012. Interest expense on our other fixed rate debt also would not be impacted by changes in market interest rates. For this fixed rate debt, fair value approximated carrying value at December 31, 2012 (see Note 7 to the Consolidated Financial Statements).
WESCO International, Inc.40
Floating Rate Borrowings: The majority of our variable rate borrowings at December 31, 2012 were comprised of the amounts outstanding under the Term Loan Facility, Revolving Credit Facility and the Receivables Facility. The fair value of these debt instruments at December 31, 2012 approximated carrying value, which totaled $1,514.1 million. We entered into the Term Loan Facility on December 12, 2012 and the proceeds were primarily used to finance the acquisition of EECOL. Borrowings under the Term Loan Facility bear interest at 1.0% or, if greater, the applicable LIBOR (London Interbank Offered Rate) / CDOR (Canadian Dealer Offered Rate) or base rates plus applicable margins and therefore are subject to fluctuations in interest rates. We borrow under our Revolving Credit Facility and Receivables Facility for general corporate purposes, including working capital requirements and capital expenditures. Borrowings under our Revolving Credit Facility bear interest at base rates plus applicable margins, whereas borrowings under the Receivables Facility bear interest at the 30 day LIBOR or 30 day commercial paper rate plus applicable margins. A 100 basis point increase or decrease in interest rates would not have a significant impact on future earnings under our current capital structure.
Item 8. Financial Statements and Supplementary Data.
The information required by this item is set forth in our Consolidated Financial Statements contained in this Annual Report on Form 10-K. Specific financial statements can be found at the pages listed below:
WESCO International, Inc. PAGE
Report of Independent Registered Public Accounting Firm 41Consolidated Balance Sheets as of December 31, 2012 and 2011 42Consolidated Statements of Comprehensive Income for the years ended December 31, 2012, 2011 and 2010 43Consolidated Statements of Stockholders’ Equity for the years ended December 31, 2012, 2011 and 2010 44Consolidated Statements of Cash Flows for the years ended December 31, 2012, 2011 and 2010 46Notes to Consolidated Financial Statements 47
2012 Annual Report 41
Report of Independent Registered Public Accounting Firm
TO THE BOARD OF DIRECTORS AND SHAREHOLDERS OF WESCO INTERNATIONAL, INC.,
In our opinion, the accompanying consolidated balance sheets and the related consolidated statements of comprehensive income, stockholders’ equity and cash flows present fairly, in all material respects, the financial position of WESCO International, Inc. and its subsidiaries at December 31, 2012 and December 31, 2011, and the results of their operations and their cash flows for each of the three years in the period ended December 31, 2012 in conformity with accounting principles generally accepted in the United States of America. In addition, in our opinion, the financial statement schedule listed in the index appearing under Item 15(a)(2) presents fairly, in all material respects, the information set forth therein when read in conjunction with the related consolidated financial statements. Also in our opinion, the Company maintained, in all material respects, effective internal control over financial reporting as of December 31, 2012, based on criteria established in Internal Control — Integrated Framework issued by the Committee of Sponsoring Organizations of the Treadway Commission (COSO). The Company’s management is responsible for these financial statements and financial statement schedule, for maintaining effective internal control over financial reporting and for its assessment of the effectiveness of internal control over financial reporting, included in Management’s Report on Internal Control over Financial Reporting appearing under Item 9A. Our responsibility is to express opinions on these financial statements, on the financial statement schedule, and on the Company’s internal control over financial reporting based on our integrated audits. We conducted our audits in accordance with the standards of the Public Company Accounting Oversight Board (United States). Those standards require that we plan and perform the audits to obtain reasonable assurance about whether the financial statements are free of material misstatement and whether effective internal control over financial reporting was maintained in all material respects. Our audits of the financial statements included examining, on a test basis, evidence supporting the amounts and disclosures in the financial statements, assessing the accounting principles used and significant estimates made by management, and evaluating the overall financial statement presentation. Our audit of internal control over financial reporting included obtaining an understanding of internal control over financial reporting, assessing the risk that a material weakness exists, and testing and evaluating the design and operating effectiveness of internal control based on the assessed risk. Our audits also included performing such other procedures as we considered necessary in the circumstances. We believe that our audits provide a reasonable basis for our opinions.
A company’s internal control over financial reporting is a process designed to provide reasonable assurance regarding the reliability of financial reporting and the preparation of financial statements for external purposes in accordance with generally accepted accounting principles. A company’s internal control over financial reporting includes those policies and procedures that (i) pertain to the maintenance of records that, in reasonable detail, accurately and fairly reflect the transactions and dispositions of the assets of the company; (ii) provide reasonable assurance that transactions are recorded as necessary to permit preparation of financial statements in accordance with generally accepted accounting principles, and that receipts and expenditures of the company are being made only in accordance with authorizations of management and directors of the company; and (iii) provide reasonable assurance regarding prevention or timely detection of unauthorized acquisition, use, or disposition of the company’s assets that could have a material effect on the financial statements.
Because of its inherent limitations, internal control over financial reporting may not prevent or detect misstatements. Also, projections of any evaluation of effectiveness to future periods are subject to the risk that controls may become inadequate because of changes in conditions, or that the degree of compliance with the policies or procedures may deteriorate.
As described in Management’s Report on Internal Control over Financial Reporting, management has excluded EECOL Electric Corporation (EECOL) and Conney Safety Products (Conney) from its assessment of internal control over financial reporting as of December 31, 2012 because they were acquired by the Company in a purchase business combination during 2012. We have also excluded EECOL and Conney from our audit of internal control over financial reporting. EECOL and Conney are wholly-owned subsidiaries whose total assets represent $1.4 billion and $144.8 million, respectively, and total revenues of $24.1 million and $39.0 million, respectively, of the related consolidated financial statement amounts as of and for the year ended December 31, 2012.
PricewaterhouseCoopers LLP Pittsburgh, Pennsylvania February 27, 2013
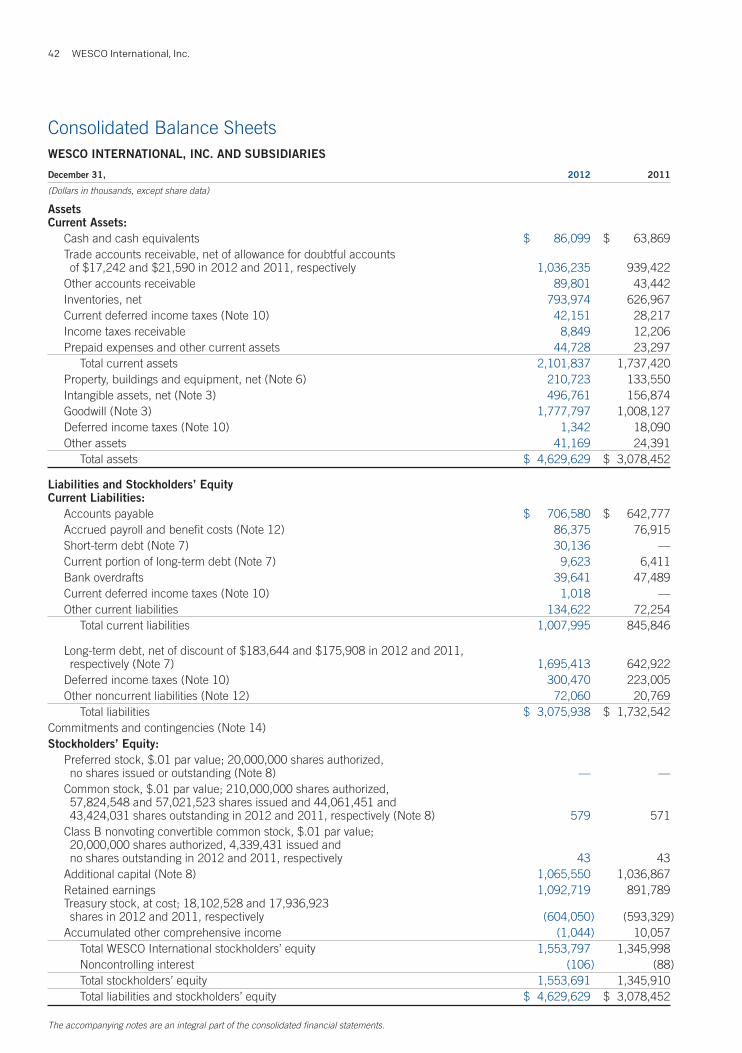
WESCO International, Inc.42
Consolidated Balance SheetsWESCO INTERNATIONAL, INC. AND SUBSIDIARIES
December 31, 2012 2011
(Dollars in thousands, except share data)
AssetsCurrent Assets: Cash and cash equivalents $ 86,099 $ 63,869 Trade accounts receivable, net of allowance for doubtful accounts
of $17,242 and $21,590 in 2012 and 2011, respectively 1,036,235 939,422 Other accounts receivable 89,801 43,442 Inventories, net 793,974 626,967 Current deferred income taxes (Note 10) 42,151 28,217 Income taxes receivable 8,849 12,206 Prepaid expenses and other current assets 44,728 23,297 Total current assets 2,101,837 1,737,420 Property, buildings and equipment, net (Note 6) 210,723 133,550 Intangible assets, net (Note 3) 496,761 156,874 Goodwill (Note 3) 1,777,797 1,008,127 Deferred income taxes (Note 10) 1,342 18,090 Other assets 41,169 24,391 Total assets $ 4,629,629 $ 3,078,452
Liabilities and Stockholders’ EquityCurrent Liabilities: Accounts payable $ 706,580 $ 642,777 Accrued payroll and benefit costs (Note 12) 86,375 76,915 Short-term debt (Note 7) 30,136 — Current portion of long-term debt (Note 7) 9,623 6,411 Bank overdrafts 39,641 47,489 Current deferred income taxes (Note 10) 1,018 — Other current liabilities 134,622 72,254 Total current liabilities 1,007,995 845,846
Long-term debt, net of discount of $183,644 and $175,908 in 2012 and 2011, respectively (Note 7) 1,695,413 642,922
Deferred income taxes (Note 10) 300,470 223,005 Other noncurrent liabilities (Note 12) 72,060 20,769 Total liabilities $ 3,075,938 $ 1,732,542Commitments and contingencies (Note 14)Stockholders’ Equity: Preferred stock, $.01 par value; 20,000,000 shares authorized,
no shares issued or outstanding (Note 8) — — Common stock, $.01 par value; 210,000,000 shares authorized,
57,824,548 and 57,021,523 shares issued and 44,061,451 and 43,424,031 shares outstanding in 2012 and 2011, respectively (Note 8) 579 571
Class B nonvoting convertible common stock, $.01 par value; 20,000,000 shares authorized, 4,339,431 issued and no shares outstanding in 2012 and 2011, respectively 43 43
Additional capital (Note 8) 1,065,550 1,036,867 Retained earnings 1,092,719 891,789 Treasury stock, at cost; 18,102,528 and 17,936,923
shares in 2012 and 2011, respectively (604,050) (593,329) Accumulated other comprehensive income (1,044) 10,057 Total WESCO International stockholders’ equity 1,553,797 1,345,998 Noncontrolling interest (106) (88) Total stockholders’ equity 1,553,691 1,345,910 Total liabilities and stockholders’ equity $ 4,629,629 $ 3,078,452
The accompanying notes are an integral part of the consolidated financial statements.
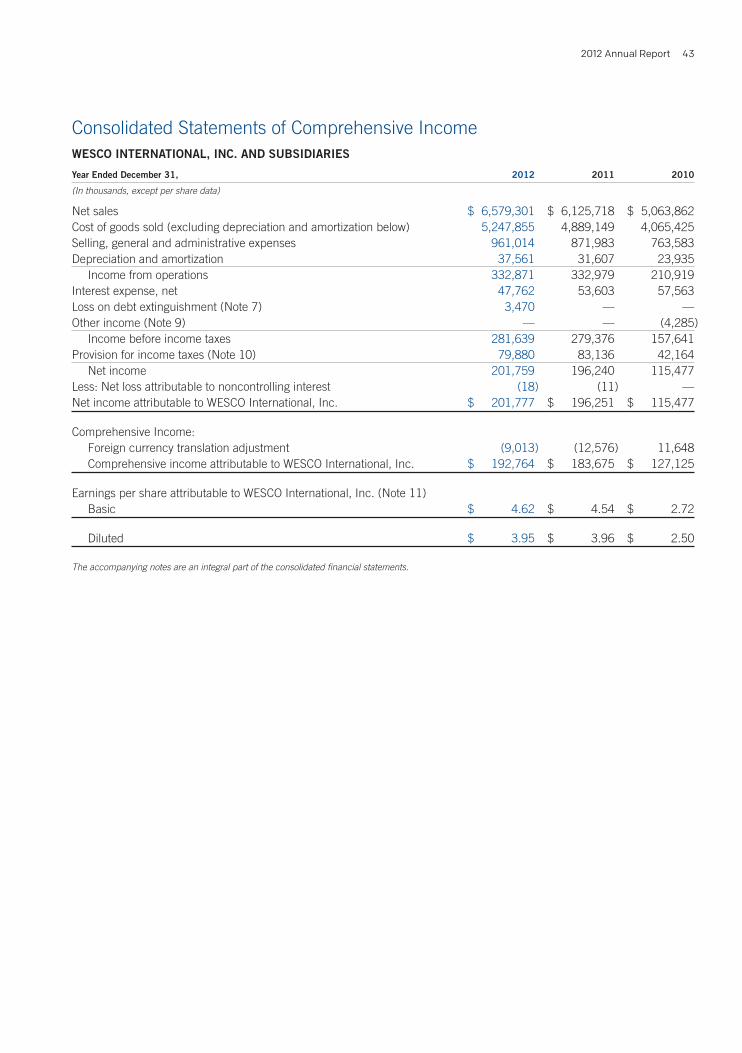
2012 Annual Report 43
Consolidated Statements of Comprehensive IncomeWESCO INTERNATIONAL, INC. AND SUBSIDIARIES
Year Ended December 31, 2012 2011 2010
(In thousands, except per share data)
Net sales $ 6,579,301 $ 6,125,718 $ 5,063,862Cost of goods sold (excluding depreciation and amortization below) 5,247,855 4,889,149 4,065,425Selling, general and administrative expenses 961,014 871,983 763,583Depreciation and amortization 37,561 31,607 23,935 Income from operations 332,871 332,979 210,919Interest expense, net 47,762 53,603 57,563Loss on debt extinguishment (Note 7) 3,470 — —Other income (Note 9) — — (4,285) Income before income taxes 281,639 279,376 157,641Provision for income taxes (Note 10) 79,880 83,136 42,164 Net income 201,759 196,240 115,477Less: Net loss attributable to noncontrolling interest (18) (11) —Net income attributable to WESCO International, Inc. $ 201,777 $ 196,251 $ 115,477
Comprehensive Income: Foreign currency translation adjustment (9,013) (12,576) 11,648 Comprehensive income attributable to WESCO International, Inc. $ 192,764 $ 183,675 $ 127,125
Earnings per share attributable to WESCO International, Inc. (Note 11) Basic $ 4.62 $ 4.54 $ 2.72
Diluted $ 3.95 $ 3.96 $ 2.50
The accompanying notes are an integral part of the consolidated financial statements.
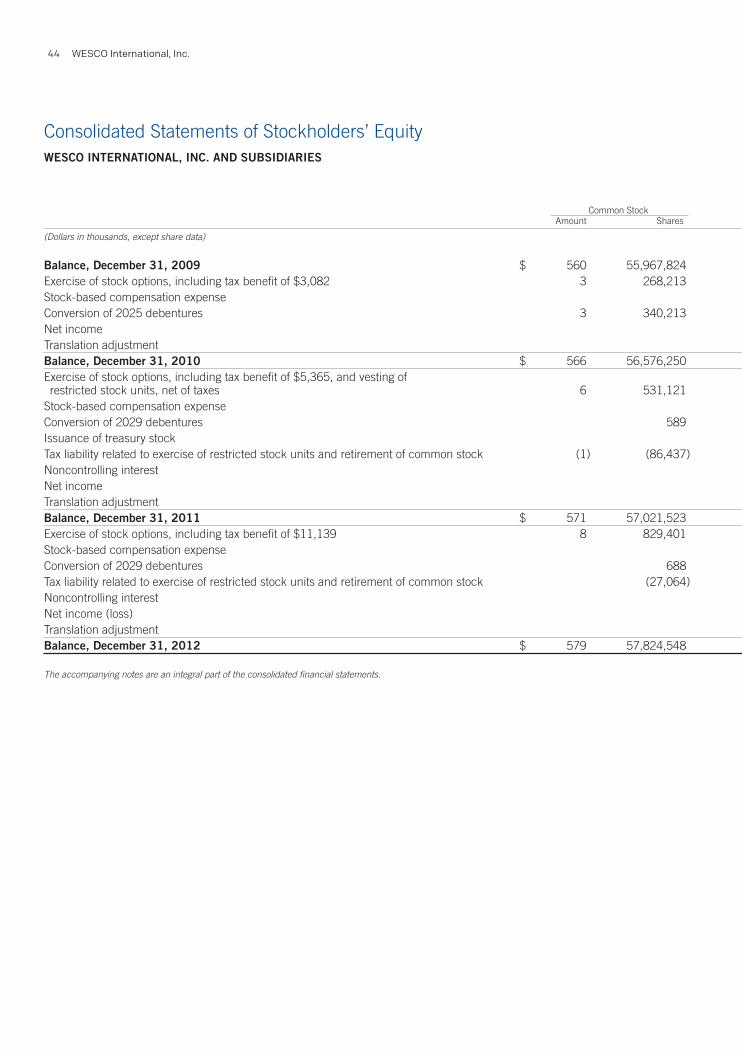
WESCO International, Inc.44
Consolidated Statements of Stockholders’ EquityWESCO INTERNATIONAL, INC. AND SUBSIDIARIES
Accumulated Retained Other Common Stock Class B Common Stock Additional Earnings Treasury Stock Noncontrolling Comprehensive
Amount Shares Amount Shares Capital (Deficit) Amount Shares Interest Income (Loss)
(Dollars in thousands, except share data)
Balance, December 31, 2009 $ 560 55,967,824 $ 43 4,339,431 $ 992,855 $ 582,199 $ (590,353) (17,890,459) $ — $ 10,985Exercise of stock options, including tax benefit of $3,082 3 268,213 4,852 (654) (15,281)Stock-based compensation expense 15,751Conversion of 2025 debentures 3 340,213 5,225Net income 115,477Translation adjustment 11,648Balance, December 31, 2010 $ 566 56,576,250 $ 43 4,339,431 $ 1,018,683 $ 697,676 $ (591,007) (17,905,740) $ — $ 22,633Exercise of stock options, including tax benefit of $5,365, and vesting of restricted stock units, net of taxes 6 531,121 5,783 (7,838) (146,614)Stock-based compensation expense 15,407Conversion of 2029 debentures 589 (5)Issuance of treasury stock (582) 957 28,994Tax liability related to exercise of restricted stock units and retirement of common stock (1) (86,437) (2,419) (2,138) 4,559 86,437Noncontrolling interest (77)Net income 196,251 (11)Translation adjustment (12,576)Balance, December 31, 2011 $ 571 57,021,523 $ 43 4,339,431 $ 1,036,867 $ 891,789 $ (593,329) (17,936,923) $ (88) $ 10,057Exercise of stock options, including tax benefit of $11,139 8 829,401 14,310 (12,277) (192,669)Stock-based compensation expense 15,088Conversion of 2029 debentures 688 (5)Tax liability related to exercise of restricted stock units and retirement of common stock (27,064) (710) (847) 1,556 27,064Noncontrolling interest (18)Net income (loss) 201,777Translation adjustment (11,101)Balance, December 31, 2012 $ 579 57,824,548 $ 43 4,339,431 $ 1,065,550 $ 1,092,719 $ (604,050) (18,102,528) $ (106) $ (1,044)
The accompanying notes are an integral part of the consolidated financial statements.
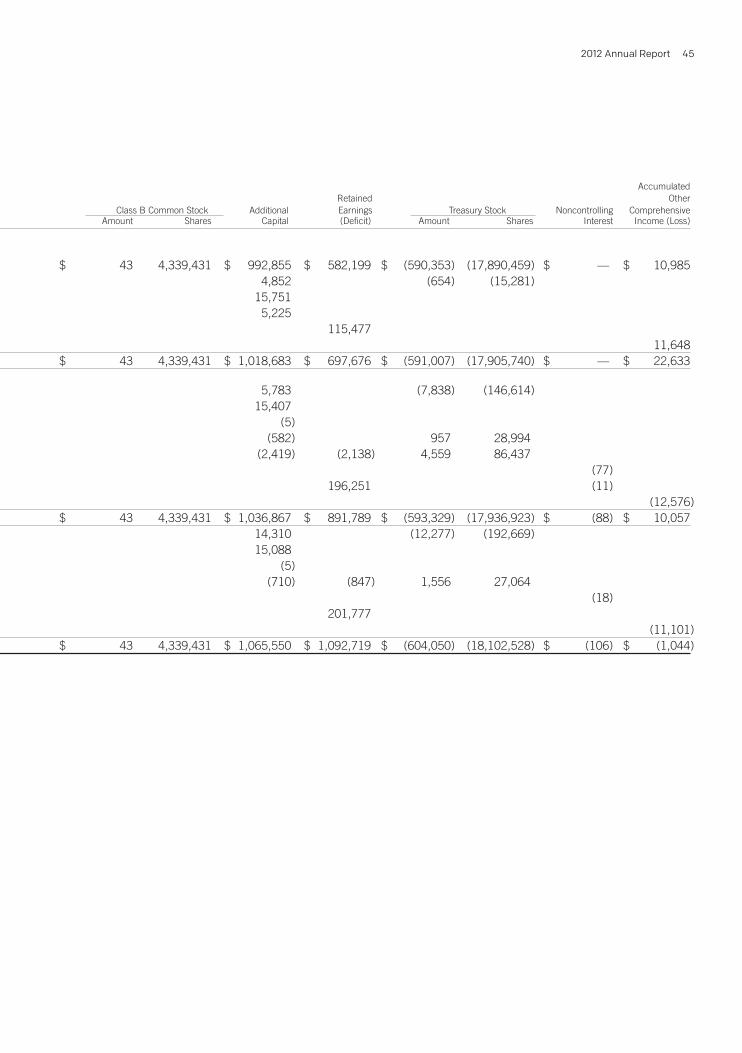
2012 Annual Report 45
Consolidated Statements of Stockholders’ EquityWESCO INTERNATIONAL, INC. AND SUBSIDIARIES
Accumulated Retained Other Common Stock Class B Common Stock Additional Earnings Treasury Stock Noncontrolling Comprehensive
Amount Shares Amount Shares Capital (Deficit) Amount Shares Interest Income (Loss)
(Dollars in thousands, except share data)
Balance, December 31, 2009 $ 560 55,967,824 $ 43 4,339,431 $ 992,855 $ 582,199 $ (590,353) (17,890,459) $ — $ 10,985Exercise of stock options, including tax benefit of $3,082 3 268,213 4,852 (654) (15,281)Stock-based compensation expense 15,751Conversion of 2025 debentures 3 340,213 5,225Net income 115,477Translation adjustment 11,648Balance, December 31, 2010 $ 566 56,576,250 $ 43 4,339,431 $ 1,018,683 $ 697,676 $ (591,007) (17,905,740) $ — $ 22,633Exercise of stock options, including tax benefit of $5,365, and vesting of restricted stock units, net of taxes 6 531,121 5,783 (7,838) (146,614)Stock-based compensation expense 15,407Conversion of 2029 debentures 589 (5)Issuance of treasury stock (582) 957 28,994Tax liability related to exercise of restricted stock units and retirement of common stock (1) (86,437) (2,419) (2,138) 4,559 86,437Noncontrolling interest (77)Net income 196,251 (11)Translation adjustment (12,576)Balance, December 31, 2011 $ 571 57,021,523 $ 43 4,339,431 $ 1,036,867 $ 891,789 $ (593,329) (17,936,923) $ (88) $ 10,057Exercise of stock options, including tax benefit of $11,139 8 829,401 14,310 (12,277) (192,669)Stock-based compensation expense 15,088Conversion of 2029 debentures 688 (5)Tax liability related to exercise of restricted stock units and retirement of common stock (27,064) (710) (847) 1,556 27,064Noncontrolling interest (18)Net income (loss) 201,777Translation adjustment (11,101)Balance, December 31, 2012 $ 579 57,824,548 $ 43 4,339,431 $ 1,065,550 $ 1,092,719 $ (604,050) (18,102,528) $ (106) $ (1,044)
The accompanying notes are an integral part of the consolidated financial statements.
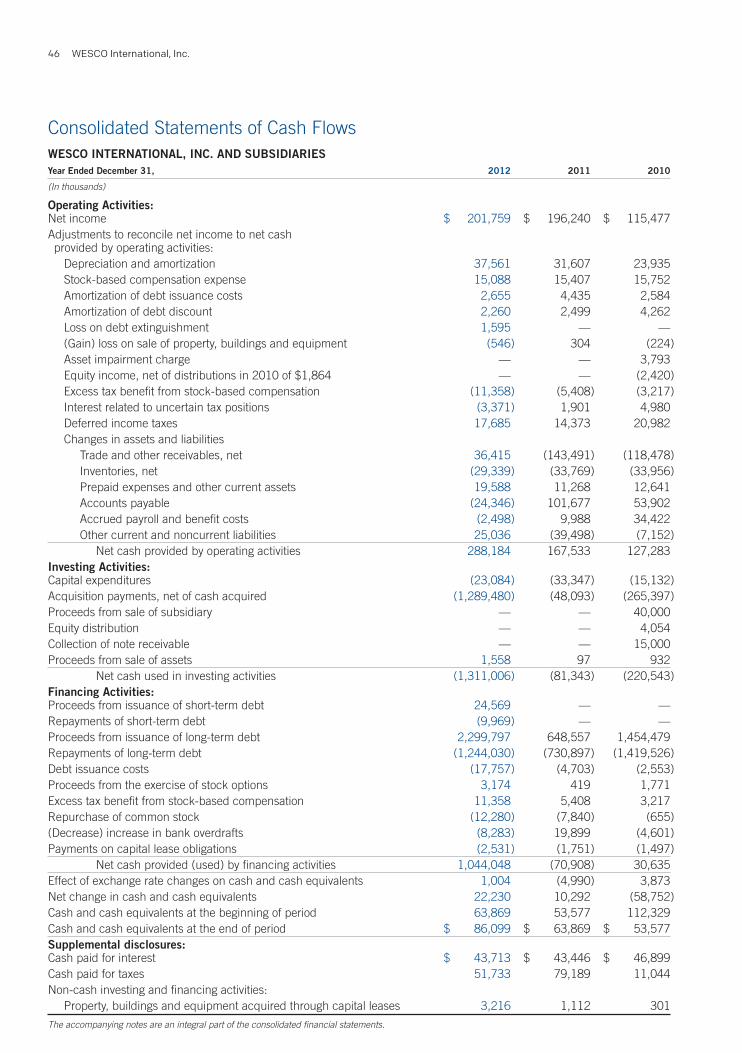
WESCO International, Inc.46
Consolidated Statements of Cash FlowsWESCO INTERNATIONAL, INC. AND SUBSIDIARIESYear Ended December 31, 2012 2011 2010
(In thousands)
Operating Activities:Net income $ 201,759 $ 196,240 $ 115,477Adjustments to reconcile net income to net cash provided by operating activities: Depreciation and amortization 37,561 31,607 23,935 Stock-based compensation expense 15,088 15,407 15,752 Amortization of debt issuance costs 2,655 4,435 2,584 Amortization of debt discount 2,260 2,499 4,262 Loss on debt extinguishment 1,595 — — (Gain) loss on sale of property, buildings and equipment (546) 304 (224) Asset impairment charge — — 3,793 Equity income, net of distributions in 2010 of $1,864 — — (2,420) Excess tax benefit from stock-based compensation (11,358) (5,408) (3,217) Interest related to uncertain tax positions (3,371) 1,901 4,980 Deferred income taxes 17,685 14,373 20,982 Changes in assets and liabilities Trade and other receivables, net 36,415 (143,491) (118,478) Inventories, net (29,339) (33,769) (33,956) Prepaid expenses and other current assets 19,588 11,268 12,641 Accounts payable (24,346) 101,677 53,902 Accrued payroll and benefit costs (2,498) 9,988 34,422 Other current and noncurrent liabilities 25,036 (39,498) (7,152) Net cash provided by operating activities 288,184 167,533 127,283Investing Activities:Capital expenditures (23,084) (33,347) (15,132)Acquisition payments, net of cash acquired (1,289,480) (48,093) (265,397)Proceeds from sale of subsidiary — — 40,000Equity distribution — — 4,054Collection of note receivable — — 15,000Proceeds from sale of assets 1,558 97 932 Net cash used in investing activities (1,311,006) (81,343) (220,543)Financing Activities:Proceeds from issuance of short-term debt 24,569 — —Repayments of short-term debt (9,969) — —Proceeds from issuance of long-term debt 2,299,797 648,557 1,454,479Repayments of long-term debt (1,244,030) (730,897) (1,419,526)Debt issuance costs (17,757) (4,703) (2,553)Proceeds from the exercise of stock options 3,174 419 1,771Excess tax benefit from stock-based compensation 11,358 5,408 3,217Repurchase of common stock (12,280) (7,840) (655)(Decrease) increase in bank overdrafts (8,283) 19,899 (4,601)Payments on capital lease obligations (2,531) (1,751) (1,497) Net cash provided (used) by financing activities 1,044,048 (70,908) 30,635Effect of exchange rate changes on cash and cash equivalents 1,004 (4,990) 3,873Net change in cash and cash equivalents 22,230 10,292 (58,752)Cash and cash equivalents at the beginning of period 63,869 53,577 112,329Cash and cash equivalents at the end of period $ 86,099 $ 63,869 $ 53,577Supplemental disclosures:Cash paid for interest $ 43,713 $ 43,446 $ 46,899Cash paid for taxes 51,733 79,189 11,044Non-cash investing and financing activities: Property, buildings and equipment acquired through capital leases 3,216 1,112 301
The accompanying notes are an integral part of the consolidated financial statements.

2012 Annual Report 47
Notes to Consolidated Financial StatementsWESCO INTERNATIONAL, INC. AND SUBSIDIARIES
1. ORGANIZATION
WESCO International, Inc. (“WESCO International”) and its subsidiaries (collectively, “WESCO”), headquartered in Pittsburgh, Pennsylvania, is a full-line distributor of electrical, industrial and communications maintenance, repair and operating (“MRO”) and original equipment manufactures (“OEM”) products, construction materials, and advanced supply chain management and logistics services used primarily in the industrial, construction, utility and commercial, institutional and government markets. We serve over 65,000 active customers globally, through approximately 475 full service branches and nine distribution centers located primarily in the United States, Canada and Mexico, with operations in 15 additional countries.
2. ACCOUNTING POLICIES
Basis of Consolidation
The consolidated financial statements include the accounts of WESCO International and all of its subsidiaries. All significant intercompany accounts and transactions have been eliminated in consolidation.
Use of Estimates
The preparation of financial statements in conformity with generally accepted accounting principles in the United States of America requires management to make estimates and assumptions that affect the amounts reported in the consolidated financial statements and accompanying disclosures. Although these estimates are based on management’s best knowledge of current events and actions WESCO may undertake in the future, actual results may ultimately differ from the estimates.
Revenue Recognition
Revenues are recognized for product sales when title, ownership and risk of loss pass to the customer or for services when the service is rendered. In the case of stock sales and special orders, a sale occurs at the time of shipment from WESCO’s distribution point, as the terms of WESCO’s sales are predominantly FOB shipping point. In cases where WESCO processes customer orders but ships directly from its suppliers, revenue is recognized once product is shipped and title has passed. In all cases, revenue is recognized once the sales price to the customer is fixed or is determinable and WESCO has reasonable assurance as to the collectability.
In certain customer arrangements, WESCO provides services such as inventory management. WESCO may perform some or all of the following services for customers: determine inventory stocking levels; establish inventory reorder points; launch purchase orders; receive material; put away material; and pick material for order fulfillment. WESCO recognizes revenue for services rendered during the period based upon a previously negotiated fee arrangement. WESCO also sells inventory to these customers and recognizes revenue at the time title and risk of loss transfers to the customer. The amount of revenue attributed to these services totaled $17.6 million, $10.8 million, and $11.1 million in 2012, 2011 and 2010, respectively.
Selling, General and Administrative Expenses
WESCO includes warehousing, purchasing, branch operations, information services, and marketing and selling expenses in this category, as well as other types of general and administrative costs.
Supplier Volume Rebates
WESCO receives volume rebates from certain suppliers based on contractual arrangements with such suppliers. Volume rebates are included within other accounts receivable on the balance sheet, and represent the estimated amounts due to WESCO under the rebate provisions of the various supplier contracts. The corresponding rebate income is recorded as a reduction of cost of goods sold. The appropriate level of such income is derived from the level of actual purchases made by WESCO from suppliers. Receivables under the supplier rebate program were $68.7 million at December 31, 2012 and $38.5 million at December 31, 2011. Supplier volume rebate rates have historically ranged between approximately 0.8% and 1.3% of sales depending on market conditions. In 2012, the rebate rate was 1.3%.

WESCO International, Inc.48
Shipping and Handling Costs and Fees
WESCO records the costs and fees associated with transporting its products to customers as a component of selling, general and administrative expenses. These costs totaled $49.9 million, $50.9 million and $42.4 million in 2012, 2011 and 2010, respectively.
Cash Equivalents
Cash equivalents are defined as highly liquid investments with original maturities of 90 days or less when purchased.
Asset Securitization
WESCO maintains control of the receivables transferred pursuant to its accounts receivable securitization program (the “Receivables Facility”); therefore the transfers do not qualify for “sale” treatment. As a result, the transferred receivables remain on the balance sheet, and WESCO recognizes the related secured borrowing. The expenses associated with the Receivables Facility are reported as interest expense in the statement of income.
Allowance for Doubtful Accounts
WESCO maintains allowances for doubtful accounts for estimated losses resulting from the inability of its customers to make required payments. WESCO has a systematic procedure using estimates based on historical data and reasonable assumptions of collectability made at the local branch level and on a consolidated corporate basis to calculate the allowance for doubtful accounts. If the financial condition of WESCO’s customers were to deteriorate, resulting in an impairment of their ability to make payments, additional allowances may be required. The allowance for doubtful accounts was $17.2 million at December 31, 2012 and $21.6 million at December 31, 2011. The total amount recorded as selling, general and administrative expense related to bad debts was $1.1 million, $6.6 million and $6.4 million for 2012, 2011 and 2010, respectively.
Inventories
Inventories primarily consist of merchandise purchased for resale and are stated at the lower of cost or market. Cost is determined principally under the average cost method. WESCO makes provisions for obsolete or slow-moving inventories as necessary to reflect reduction in inventory value. WESCO writes down its inventory to its net realizable value based on internal factors derived from historical analysis of actual losses. Looking back, WESCO identifies items at risk of becoming obsolete, which are defined as excess of 36 months supply relative to demand or movement. WESCO then analyzes the ultimate disposition of previously identified excess inventory items, such as sold, returned to supplier, or scrapped. This item by item analysis allows WESCO to develop an estimate of the historical likelihood that an item identified as being in excess supply ultimately becomes obsolete. WESCO applies the estimate to inventory items currently in excess of 36 months supply, and reduces its inventory carrying value by the derived amount. Reserves for excess and obsolete inventories were $16.7 million and $14.6 million at December 31, 2012 and 2011, respectively. The total expense related to excess and obsolete inventories, included in cost of goods sold, was $11.4 million, $5.5 million and $7.5 million for 2012, 2011 and 2010, respectively. WESCO absorbs into the cost of inventory the general and administrative expenses related to inventory such as purchasing, receiving and storage and at December 31, 2012 and 2011, $62.2 million and $47.6 million, respectively, of these costs were included in ending inventory.
Other Assets
WESCO amortizes deferred financing fees over the term of the various debt instruments. Deferred financing fees in the amount of $17.8 million were incurred during the year ending December 31, 2012. As of December 31, 2012 and 2011, the amount of other assets related to unamortized deferred financing fees was $26.4 million and $12.9 million, respectively.
Property, Buildings and Equipment
Property, buildings and equipment are recorded at cost. Depreciation expense is determined using the straight-line method over the estimated useful lives of the assets. Leasehold improvements are amortized over either their respective lease terms or their estimated lives, whichever is shorter. Estimated useful lives range from five to forty years for leasehold improvements and buildings and three to ten years for furniture, fixtures and equipment.
2012 Annual Report 49
Capitalized computer software costs are amortized using the straight-line method over the estimated useful life, typically three to five years, and are reported at the lower of unamortized cost.
Expenditures for new facilities and improvements that extend the useful life of an asset are capitalized. Ordinary repairs and maintenance are expensed as incurred. When property is retired or otherwise disposed of, the cost and the related accumulated depreciation are removed from the accounts and any related gains or losses are recorded and reported as selling, general and administrative expenses.
WESCO assesses its long-lived assets for impairment by periodically reviewing operating performance and respective utilization of real and tangible assets. Upon closure of any branch, asset usefulness and remaining life are evaluated and charges are taken as appropriate. Of WESCO’s $210.7 million net book value of property, plant and equipment as of December 31, 2012, $136.8 million consists of land, buildings and leasehold improvements and are geographically dispersed among WESCO’s 475 branches and nine distribution centers, mitigating the risk of impairment. Approximately $28.5 million of assets consist of computer equipment and capitalized software and are evaluated for use and serviceability relative to carrying value. The remaining fixed assets, mainly of furniture and fixtures, warehousing equipment and transportation equipment, are similarly evaluated for serviceability and use.
Goodwill and Indefinite Life Intangible Assets
Goodwill and indefinite life intangible assets are tested for impairment annually during the fourth quarter using information available at the end of September, or more frequently if events or circumstances occur indicating that their carrying value may not be recoverable. The evaluation of impairment involves comparing the current fair value of goodwill and indefinite life intangible assets to the recorded value. WESCO estimates the fair value of goodwill using a combination of discounted cash flow analyses and market multiples. Assumptions used for these fair value techniques are based on a combination of historical results, current forecasts, market data and recent economic events. WESCO evaluates the recoverability of indefinite life intangible assets using a discounted cash flow analysis based on projected financial information. The determination of fair value involves significant judgment and management applies its best judgment when assessing the reasonableness of financial projections. At December 31, 2012 and 2011, goodwill and indefinite life trademarks totaled $1,882.9 million and $1,055.0 million, respectively. No impairment losses were identified in 2012 as a result of this review. However, two trademarks valued at $18.1 million are sensitive to a further decline in financial performance. WESCO is taking actions to improve its future financial performance; however, WESCO cannot predict whether or not there will be certain events that could adversely affect the reported value of these trademarks.
Definite Lived Intangible Assets
Intangible assets are amortized over 4 to 20 years. A portion of intangible assets related to certain customer relationships are amortized using an accelerated method whereas all other intangible assets subject to amortization use a straight-line method which reflects the pattern in which the economic benefits of the respective assets are consumed or otherwise used. Intangible assets are tested for impairment if events or circumstances occur indicating that the respective asset might be impaired.
Insurance Programs
WESCO uses commercial insurance for auto, workers’ compensation, casualty and health claims as a risk-reduction strategy to minimize catastrophic losses. The Company’s strategy involves large deductibles where WESCO must pay all costs up to the deductible amount. WESCO estimates the reserve based on historical incident rates and costs. The assumptions included in developing this accrual include the period of time from incurrence of a claim until the claim is paid by the insurance provider. The total liability related to the insurance programs was $11.3 million at December 31, 2012 and $9.7 million at December 31, 2011.
Income Taxes
Income taxes are accounted for under the liability method in accordance with income tax accounting guidance. Deferred tax assets and liabilities are determined based on differences between the financial reporting and tax basis of assets and liabilities and are measured using the enacted tax rates and laws that will be in effect when the differences are expected to reverse. Valuation allowances, if any, are provided when it is more likely than not that a portion or all of a deferred tax asset may not be realized.
WESCO International, Inc.50
WESCO accounts for uncertainty in income taxes using a recognition threshold and measurement attribute prescribed by income tax accounting guidance. WESCO frequently reviews tax issues and positions taken on tax returns to determine the need and amount of contingency reserves necessary to cover any probable audit adjustments. WESCO recognizes interest related to unrecognized tax benefits as part of interest expense. Penalties are recognized as part of income tax expense.
Convertible Debentures
WESCO separately accounts for the liability and equity components of its convertible debentures in a manner that reflects its non-convertible debt borrowing rate. WESCO estimates its non-convertible debt borrowing rate through a combination of discussions with its financial institutions and review of relevant market data. The discounts to the convertible note balances are amortized to interest expense, using the effective interest method, over the implicit life of the Debentures.
Foreign Currency
The local currency is the functional currency for the majority of WESCO’s operations outside the United States. Assets and liabilities of these operations are translated to U.S. dollars at the exchange rate in effect at the end of each period. Income statement accounts are translated at the average exchange rate prevailing during the period. Translation adjustments arising from the use of differing exchange rates from period to period are included as a component of other comprehensive income within stockholders’ equity. Gains and losses from foreign currency transactions are included in net income for the period.
Defined Benefit Pension Plan
In connection with the December 14, 2012 acquisition of EECOL, the Company assumed a contributory defined benefit plan covering all Canadian employees of EECOL. The plan provides retirement benefits based upon earnings and credited service, and participants contribute 2% or 4% of their earnings to the plan depending on their employment level.
The Company also assumed EECOL’s Supplemental Executive Retirement Plan (SERP) which provides additional pension benefits to certain executives based on earnings, credited service, and executive service.
Liabilities and expenses for pension benefits are determined using actuarial methodologies and incorporate significant assumptions, including the interest rate used to discount the future estimated cash flows, the expected long-term rate of return on plan assets, and several assumptions relating to the employee workforce (salary increases, retirement age, and mortality).
The interest rate used to discount future estimated cash flows is determined using a high quality corporate bonds yield curve model developed with the assistance of an external actuary. The cash flows of the plans’ projected benefit obligations are discounted using a single equivalent rate derived from yields on high quality corporate bonds. The yield curve model parallels the plans’ projected cash flows. The discount rate used to determine benefit obligations for the Canadian pension was 4.5% in 2012. The impact on the liabilities of a change in the discount rate of one quarter percent would be approximately $5.1 million and either a charge or credit of $0.3 million to after-tax earnings in the following year.
The expected long-term rate of return on plan assets is applied to the fair market-related value of plan assets.
Stock-Based Compensation
WESCO’s stock-based employee compensation plans are comprised of stock options, stock-settled stock appreciation rights, restricted stock units, and performance-based awards. Compensation cost for all stock-based awards is measured at fair value on the date of grant, and compensation cost is recognized, net of estimated forfeitures, over the service period for awards expected to vest. The fair value of stock options and stock-settled appreciation rights is determined using the Black-Scholes valuation model. Expected volatilities are based on historical volatility of WESCO’s common stock. The expected life of stock options and stock-settled appreciation rights is estimated using historical data pertaining to option exercises and employee terminations. The risk-free rate is based on the U.S. Treasury yields in effect at the time of grant. The forfeiture assumption is based on WESCO’s historical employee behavior that is reviewed on an annual basis. The fair value of restricted stock units is determined by the grant-date closing price of WESCO’s common stock. Performance-based awards are valued using a Monte Carlo simulation model. The probability of meeting market criteria is considered

2012 Annual Report 51
when calculating the estimated fair market value on the date of grant. These awards are accounted for as awards with market conditions, which are recognized over the service period, regardless of whether the market conditions are achieved and the awards ultimately vest. No dividends are assumed for stock based awards.
Treasury Stock
Common stock purchased for treasury is recorded at cost. At the date of subsequent reissue, the treasury stock account is reduced by the cost of such stock, with cost determined on a weighted average basis.
Fair Value of Financial Instruments
The Company’s financial instruments consist of cash and cash equivalents, accounts receivable, accounts payable and other accrued liabilities, and outstanding indebtedness. The estimated fair value of the Company’s outstanding indebtedness described in Note 7 at December 31, 2012 and 2011 was $2,423.7 million and $1,178.9 million, respectively. The aggregate fair value of the senior notes and debentures was approximately $1,704.5 million and $850.9 million at December 31, 2012 and 2011, respectively. The fair values of these fixed rate facilities are estimated based upon market price quotes. The fair values of the mortgage facility, the Term Loan, the accounts receivable securitization facility (the “Receivables Facility”) and the revolving credit facility (“the Revolving Credit Facility”), approximated carrying values. The fair values for these facilities are based upon market price quotes and market comparisons available for instruments with similar terms and maturities. For all remaining WESCO financial instruments, carrying values are considered to approximate fair value due to their short maturities.
Environmental Expenditures
WESCO has facilities and operations that distribute certain products that must comply with environmental regulations and laws. Expenditures for current operations are expensed or capitalized, as appropriate. Expenditures relating to existing conditions caused by past operations, and that do not contribute to future revenue, are expensed. Liabilities are recorded when remedial efforts are probable and the costs can be reasonably estimated.
Reclassification
Certain prior period balances within the financial statements have been reclassified to conform with current year presentation.
Recent Accounting Pronouncements
In June 2011, the Financial Accounting Standards Board (the “FASB”) issued new disclosure guidance related to the presentation of the statement of comprehensive income. This guidance provides an entity the option to present the total of comprehensive income, the components of net income and the components of other comprehensive income either in a single continuous statement of comprehensive income or in two separate but consecutive statements; the option to report other comprehensive income and its components in the statement of changes in stockholders’ equity was eliminated. This accounting standard is effective for periods beginning on or after December 15, 2011. WESCO has elected the option to present the components of net income and the components of comprehensive income in a single continuous statement of comprehensive income.
In July 2012, the Financial Accounting Standards Board (the “FASB”) issued updated guidance on the periodic testing of indefinite-lived intangible assets, other than goodwill, for impairment. This updated guidance will allow companies the option to first access qualitative factors to determine if it is more-likely-than-not that an indefinite-lived intangible asset might be impaired and whether it is necessary to perform the quantitative impairment test required under current accounting standards. This guidance is effective for annual and interim impairment tests performed for fiscal years beginning after September 15, 2012. WESCO will adopt this guidance in 2013. Adoption of this guidance is not expected to have a material impact on WESCO’s financial position, results of operations or cash flows.
Other pronouncements issued by the FASB or other authoritative accounting standards groups with future effective dates are either not applicable or are not expected to be significant to WESCO’s financial position, results of operations or cash flows.
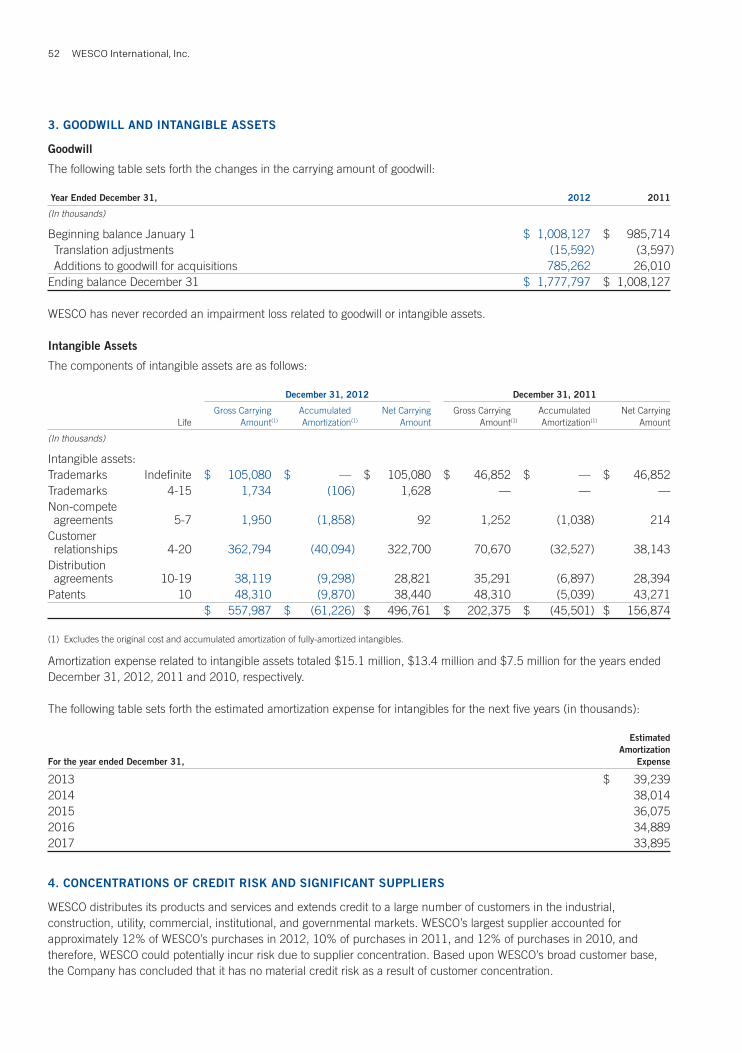
WESCO International, Inc.52
3. GOODWILL AND INTANGIBLE ASSETS
Goodwill
The following table sets forth the changes in the carrying amount of goodwill:
Year Ended December 31, 2012 2011
(In thousands)
Beginning balance January 1 $ 1,008,127 $ 985,714 Translation adjustments (15,592) (3,597) Additions to goodwill for acquisitions 785,262 26,010Ending balance December 31 $ 1,777,797 $ 1,008,127
WESCO has never recorded an impairment loss related to goodwill or intangible assets.
Intangible Assets
The components of intangible assets are as follows:
December 31, 2012 December 31, 2011
Gross Carrying Accumulated Net Carrying Gross Carrying Accumulated Net Carrying Life Amount(1) Amortization(1) Amount Amount(1) Amortization(1) Amount
(In thousands)
Intangible assets:Trademarks Indefinite $ 105,080 $ — $ 105,080 $ 46,852 $ — $ 46,852Trademarks 4-15 1,734 (106) 1,628 — — —Non-compete agreements 5-7 1,950 (1,858) 92 1,252 (1,038) 214Customer relationships 4-20 362,794 (40,094) 322,700 70,670 (32,527) 38,143Distribution agreements 10-19 38,119 (9,298) 28,821 35,291 (6,897) 28,394Patents 10 48,310 (9,870) 38,440 48,310 (5,039) 43,271 $ 557,987 $ (61,226) $ 496,761 $ 202,375 $ (45,501) $ 156,874
(1) Excludes the original cost and accumulated amortization of fully-amortized intangibles.
Amortization expense related to intangible assets totaled $15.1 million, $13.4 million and $7.5 million for the years ended December 31, 2012, 2011 and 2010, respectively.
The following table sets forth the estimated amortization expense for intangibles for the next five years (in thousands):
Estimated AmortizationFor the year ended December 31, Expense
2013 $ 39,2392014 38,0142015 36,0752016 34,8892017 33,895
4. CONCENTRATIONS OF CREDIT RISK AND SIGNIFICANT SUPPLIERS
WESCO distributes its products and services and extends credit to a large number of customers in the industrial, construction, utility, commercial, institutional, and governmental markets. WESCO’s largest supplier accounted for approximately 12% of WESCO’s purchases in 2012, 10% of purchases in 2011, and 12% of purchases in 2010, and therefore, WESCO could potentially incur risk due to supplier concentration. Based upon WESCO’s broad customer base, the Company has concluded that it has no material credit risk as a result of customer concentration.
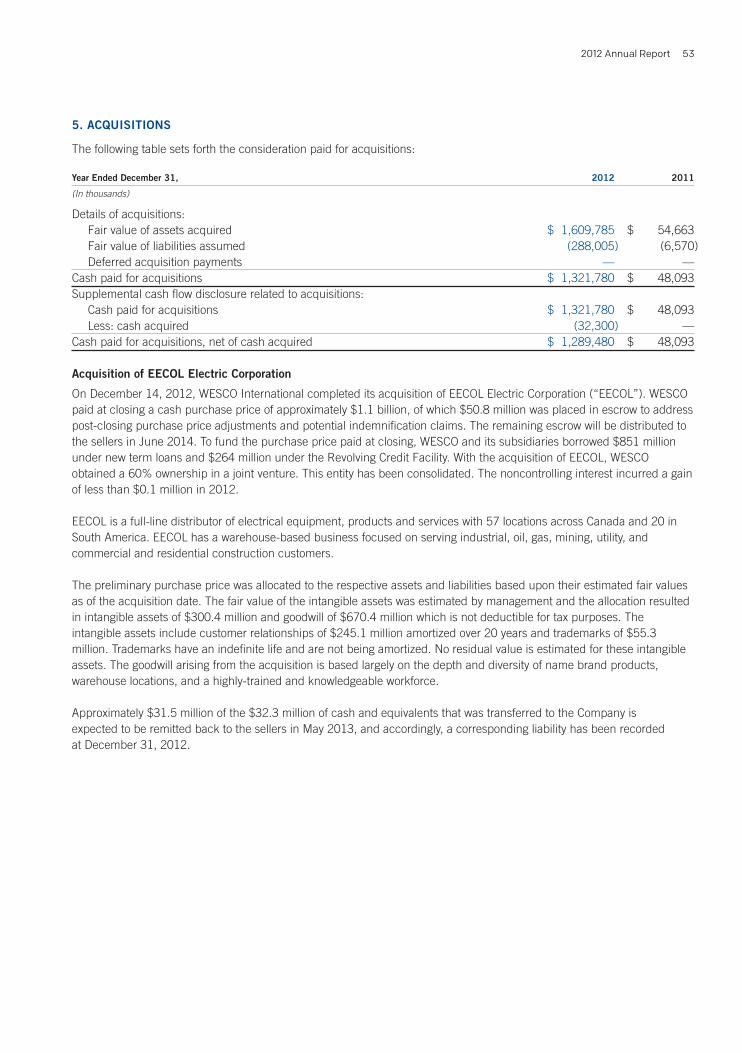
2012 Annual Report 53
5. ACQUISITIONS
The following table sets forth the consideration paid for acquisitions:
Year Ended December 31, 2012 2011
(In thousands)
Details of acquisitions: Fair value of assets acquired $ 1,609,785 $ 54,663 Fair value of liabilities assumed (288,005) (6,570) Deferred acquisition payments — —Cash paid for acquisitions $ 1,321,780 $ 48,093Supplemental cash flow disclosure related to acquisitions: Cash paid for acquisitions $ 1,321,780 $ 48,093 Less: cash acquired (32,300) —Cash paid for acquisitions, net of cash acquired $ 1,289,480 $ 48,093
Acquisition of EECOL Electric Corporation
On December 14, 2012, WESCO International completed its acquisition of EECOL Electric Corporation (“EECOL”). WESCO paid at closing a cash purchase price of approximately $1.1 billion, of which $50.8 million was placed in escrow to address post-closing purchase price adjustments and potential indemnification claims. The remaining escrow will be distributed to the sellers in June 2014. To fund the purchase price paid at closing, WESCO and its subsidiaries borrowed $851 million under new term loans and $264 million under the Revolving Credit Facility. With the acquisition of EECOL, WESCO obtained a 60% ownership in a joint venture. This entity has been consolidated. The noncontrolling interest incurred a gain of less than $0.1 million in 2012.
EECOL is a full-line distributor of electrical equipment, products and services with 57 locations across Canada and 20 in South America. EECOL has a warehouse-based business focused on serving industrial, oil, gas, mining, utility, and commercial and residential construction customers.
The preliminary purchase price was allocated to the respective assets and liabilities based upon their estimated fair values as of the acquisition date. The fair value of the intangible assets was estimated by management and the allocation resulted in intangible assets of $300.4 million and goodwill of $670.4 million which is not deductible for tax purposes. The intangible assets include customer relationships of $245.1 million amortized over 20 years and trademarks of $55.3 million. Trademarks have an indefinite life and are not being amortized. No residual value is estimated for these intangible assets. The goodwill arising from the acquisition is based largely on the depth and diversity of name brand products, warehouse locations, and a highly-trained and knowledgeable workforce.
Approximately $31.5 million of the $32.3 million of cash and equivalents that was transferred to the Company is expected to be remitted back to the sellers in May 2013, and accordingly, a corresponding liability has been recorded at December 31, 2012.
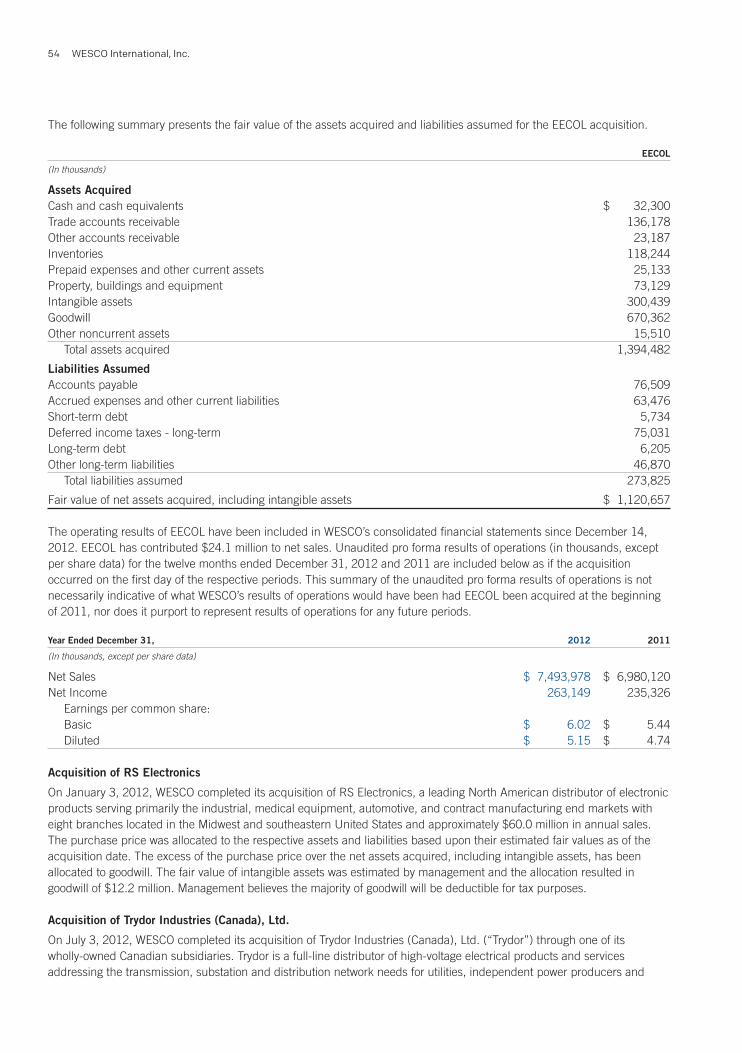
WESCO International, Inc.54
The following summary presents the fair value of the assets acquired and liabilities assumed for the EECOL acquisition.
EECOL
(In thousands)
Assets AcquiredCash and cash equivalents $ 32,300Trade accounts receivable 136,178Other accounts receivable 23,187Inventories 118,244Prepaid expenses and other current assets 25,133Property, buildings and equipment 73,129Intangible assets 300,439Goodwill 670,362Other noncurrent assets 15,510 Total assets acquired 1,394,482
Liabilities AssumedAccounts payable 76,509Accrued expenses and other current liabilities 63,476Short-term debt 5,734Deferred income taxes - long-term 75,031Long-term debt 6,205Other long-term liabilities 46,870 Total liabilities assumed 273,825
Fair value of net assets acquired, including intangible assets $ 1,120,657
The operating results of EECOL have been included in WESCO’s consolidated financial statements since December 14, 2012. EECOL has contributed $24.1 million to net sales. Unaudited pro forma results of operations (in thousands, except per share data) for the twelve months ended December 31, 2012 and 2011 are included below as if the acquisition occurred on the first day of the respective periods. This summary of the unaudited pro forma results of operations is not necessarily indicative of what WESCO’s results of operations would have been had EECOL been acquired at the beginning of 2011, nor does it purport to represent results of operations for any future periods.
Year Ended December 31, 2012 2011
(In thousands, except per share data)
Net Sales $ 7,493,978 $ 6,980,120Net Income 263,149 235,326 Earnings per common share: Basic $ 6.02 $ 5.44 Diluted $ 5.15 $ 4.74
Acquisition of RS Electronics
On January 3, 2012, WESCO completed its acquisition of RS Electronics, a leading North American distributor of electronic products serving primarily the industrial, medical equipment, automotive, and contract manufacturing end markets with eight branches located in the Midwest and southeastern United States and approximately $60.0 million in annual sales. The purchase price was allocated to the respective assets and liabilities based upon their estimated fair values as of the acquisition date. The excess of the purchase price over the net assets acquired, including intangible assets, has been allocated to goodwill. The fair value of intangible assets was estimated by management and the allocation resulted in goodwill of $12.2 million. Management believes the majority of goodwill will be deductible for tax purposes.
Acquisition of Trydor Industries (Canada), Ltd.
On July 3, 2012, WESCO completed its acquisition of Trydor Industries (Canada), Ltd. (“Trydor”) through one of its wholly-owned Canadian subsidiaries. Trydor is a full-line distributor of high-voltage electrical products and services addressing the transmission, substation and distribution network needs for utilities, independent power producers and
2012 Annual Report 55
utility contractors in Canada with approximately $35.0 million in annual sales. The purchase price was allocated to the respective assets and liabilities based upon their estimated fair values as of the acquisition date. The excess of the purchase price over the net assets acquired, including intangible assets, has been allocated to goodwill. The fair value of intangible assets was estimated by management and the allocation resulted in goodwill and intangible assets of $19.1 million and $11.8 million, respectively. Management believes the majority of goodwill will be deductible for tax purposes. The intangible assets include customer relationships of $8.9 million amortized over 10 years, supplier relationships of $2.7 million amortized over 10 years and trademarks of $0.2 million amortized over 4 years. No residual value is estimated for the intangible assets.
Acquisition of Conney Safety Products, LLC
On July 9, 2012, WESCO completed the acquisition of Conney Safety Products, LLC, a distributor of MRO safety products with approximately $85 million in annual sales. The purchase price was allocated to the respective assets and liabilities based upon their estimated fair values as of the acquisition date. The excess of the purchase price over the net assets acquired, including intangible assets, has been allocated to goodwill. The fair value of intangible assets was estimated by management and the allocation resulted in goodwill and intangible assets of $83.6 million and $45.3 million, respectively. Management believes the majority of goodwill will be deductible for tax purposes. The intangible assets include customer relationships of $40.3 million amortized over 12 years, a trademark of $1.5 million amortized over 15 years, and a trademark valued at $3.5 million with an indefinite life. No residual value is estimated for the intangible assets.
2011 Acquisitions of RECO, LLC and Brews Supply, Ltd.
On March 14, 2011, WESCO Distribution, Inc. (“WESCO Distribution”) completed its acquisition of RECO, LLC (“RECO”), a Siemens automation, controls, and electrical distributor located in the midwest and southeastern regions of the United States with approximately $25 million in annual sales. The purchase price was allocated to the respective assets and liabilities based upon their estimated fair values as of the acquisition date. The excess of the purchase price over the fair value of the net assets acquired has been allocated to goodwill valued at $6.0 million. Management believes the majority of goodwill will be deductible for tax purposes.
On October 3, 2011, WESCO Distribution through its wholly-owned Canadian subsidiary, completed its acquisition of Brews Supply, Ltd. (“Brews”), a full line electrical distributor of industrial, utility, and commercial products located in western Canada with approximately $50 million in annual sales. The purchase price was allocated to the respective assets and liabilities based upon their estimated fair values as of the acquisition date. The excess of the purchase price over the fair value of the net assets acquired, including intangible assets, has been allocated to goodwill. The fair value of intangible assets was estimated by an independent appraiser and the allocation resulted in goodwill and intangible assets of $19.8 million and $10.2 million, respectively. Management believes the majority of goodwill will be deductible for tax purposes. The intangible assets include customer relationships of $4.8 million amortized over 10 years, supplier relationships of $4.2 million amortized over 10 years and trademarks of $1.2 million. Trademarks have an indefinite life and are not being amortized. No residual value is estimated for the intangible assets. With the acquisition of Brews, WESCO obtained a 49% ownership in a joint venture. This entity has been consolidated. The noncontrolling interest incurred a loss of less than $0.1 million in 2011 and 2012.
2010 Acquisitions of TVC Communications, L.L.C. and Potelcom Supply, Inc.
On December 16, 2010, WESCO Distribution completed its acquisition of TVC Communications, L.L.C. (“TVC Communications”), an international distributor in the Western Hemisphere of infrastructure products to the cable television and telecommunication industries. TVC Communications offers products necessary to build out a broadband network, ranging from the industry’s widest selection of premier branded components, to a variety of proprietary and private label products. TVC Communications also offers a full suite of value-added services, including design, engineering, installation, repair and maintenance.
WESCO paid at closing a cash purchase price of approximately $251.0 million, net of $1.5 million of cash acquired, of which $20.0 million was held in escrow to address post-closing working capital adjustments. The purchase price was allocated to the respective assets and liabilities based upon their estimated fair values as of the acquisition date. The excess of the purchase price over the fair value of the net assets acquired, including intangible assets, has been allocated to goodwill. The fair value of intangible assets was estimated by management and the allocation resulted in intangible
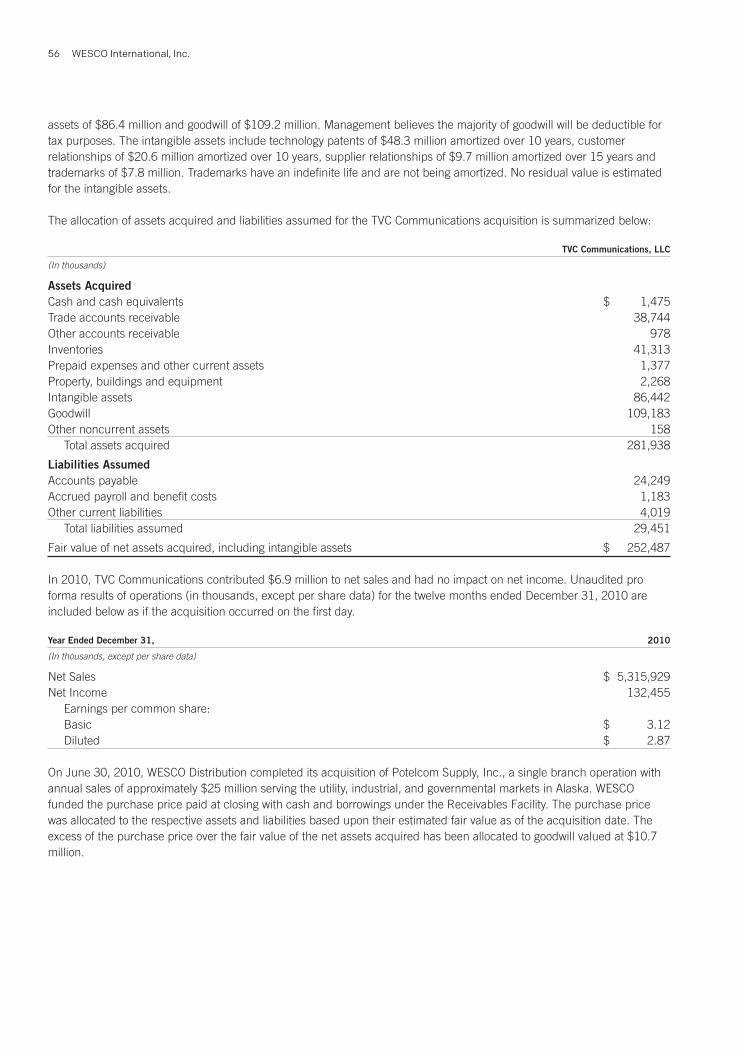
WESCO International, Inc.56
assets of $86.4 million and goodwill of $109.2 million. Management believes the majority of goodwill will be deductible for tax purposes. The intangible assets include technology patents of $48.3 million amortized over 10 years, customer relationships of $20.6 million amortized over 10 years, supplier relationships of $9.7 million amortized over 15 years and trademarks of $7.8 million. Trademarks have an indefinite life and are not being amortized. No residual value is estimated for the intangible assets.
The allocation of assets acquired and liabilities assumed for the TVC Communications acquisition is summarized below:
TVC Communications, LLC
(In thousands)
Assets AcquiredCash and cash equivalents $ 1,475Trade accounts receivable 38,744Other accounts receivable 978Inventories 41,313Prepaid expenses and other current assets 1,377Property, buildings and equipment 2,268Intangible assets 86,442Goodwill 109,183Other noncurrent assets 158 Total assets acquired 281,938
Liabilities AssumedAccounts payable 24,249Accrued payroll and benefit costs 1,183Other current liabilities 4,019 Total liabilities assumed 29,451
Fair value of net assets acquired, including intangible assets $ 252,487
In 2010, TVC Communications contributed $6.9 million to net sales and had no impact on net income. Unaudited pro forma results of operations (in thousands, except per share data) for the twelve months ended December 31, 2010 are included below as if the acquisition occurred on the first day.
Year Ended December 31, 2010
(In thousands, except per share data)
Net Sales $ 5,315,929Net Income 132,455 Earnings per common share: Basic $ 3.12 Diluted $ 2.87
On June 30, 2010, WESCO Distribution completed its acquisition of Potelcom Supply, Inc., a single branch operation with annual sales of approximately $25 million serving the utility, industrial, and governmental markets in Alaska. WESCO funded the purchase price paid at closing with cash and borrowings under the Receivables Facility. The purchase price was allocated to the respective assets and liabilities based upon their estimated fair value as of the acquisition date. The excess of the purchase price over the fair value of the net assets acquired has been allocated to goodwill valued at $10.7 million.
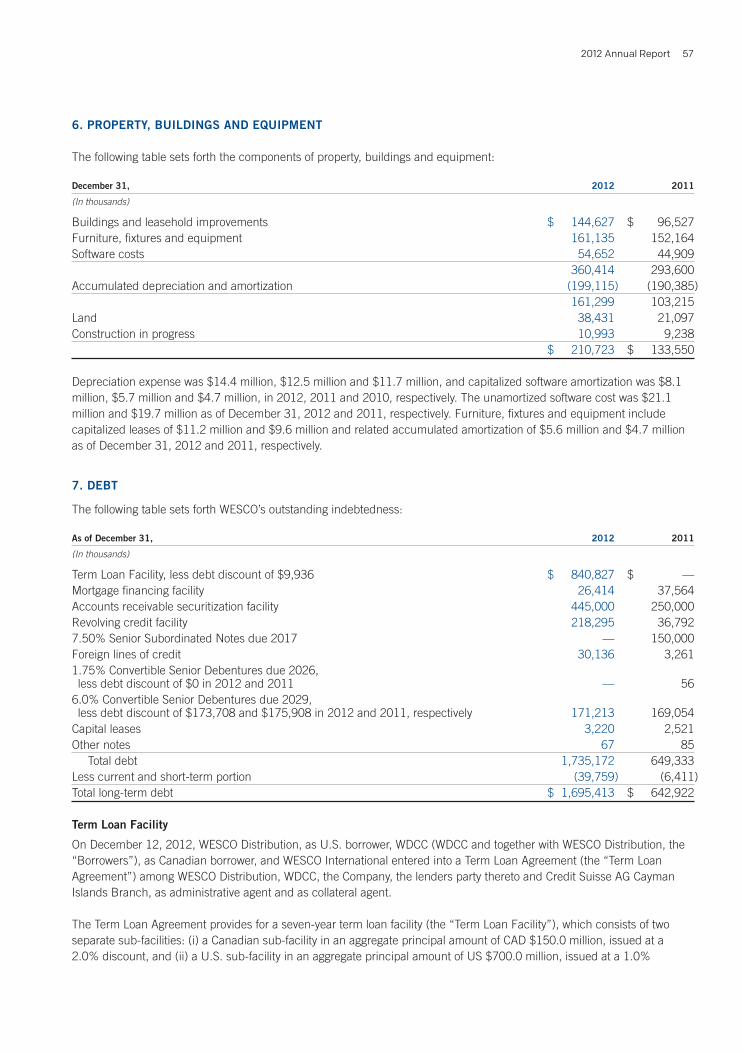
2012 Annual Report 57
6. PROPERTY, BUILDINGS AND EQUIPMENT
The following table sets forth the components of property, buildings and equipment:
December 31, 2012 2011
(In thousands)
Buildings and leasehold improvements $ 144,627 $ 96,527Furniture, fixtures and equipment 161,135 152,164Software costs 54,652 44,909 360,414 293,600Accumulated depreciation and amortization (199,115) (190,385) 161,299 103,215Land 38,431 21,097Construction in progress 10,993 9,238 $ 210,723 $ 133,550
Depreciation expense was $14.4 million, $12.5 million and $11.7 million, and capitalized software amortization was $8.1 million, $5.7 million and $4.7 million, in 2012, 2011 and 2010, respectively. The unamortized software cost was $21.1 million and $19.7 million as of December 31, 2012 and 2011, respectively. Furniture, fixtures and equipment include capitalized leases of $11.2 million and $9.6 million and related accumulated amortization of $5.6 million and $4.7 million as of December 31, 2012 and 2011, respectively.
7. DEBT
The following table sets forth WESCO’s outstanding indebtedness:
As of December 31, 2012 2011
(In thousands)
Term Loan Facility, less debt discount of $9,936 $ 840,827 $ —Mortgage financing facility 26,414 37,564Accounts receivable securitization facility 445,000 250,000Revolving credit facility 218,295 36,7927.50% Senior Subordinated Notes due 2017 — 150,000Foreign lines of credit 30,136 3,2611.75% Convertible Senior Debentures due 2026, less debt discount of $0 in 2012 and 2011 — 566.0% Convertible Senior Debentures due 2029, less debt discount of $173,708 and $175,908 in 2012 and 2011, respectively 171,213 169,054Capital leases 3,220 2,521Other notes 67 85 Total debt 1,735,172 649,333Less current and short-term portion (39,759) (6,411)Total long-term debt $ 1,695,413 $ 642,922
Term Loan Facility
On December 12, 2012, WESCO Distribution, as U.S. borrower, WDCC (WDCC and together with WESCO Distribution, the “Borrowers”), as Canadian borrower, and WESCO International entered into a Term Loan Agreement (the “Term Loan Agreement”) among WESCO Distribution, WDCC, the Company, the lenders party thereto and Credit Suisse AG Cayman Islands Branch, as administrative agent and as collateral agent.
The Term Loan Agreement provides for a seven-year term loan facility (the “Term Loan Facility”), which consists of two separate sub-facilities: (i) a Canadian sub-facility in an aggregate principal amount of CAD $150.0 million, issued at a 2.0% discount, and (ii) a U.S. sub-facility in an aggregate principal amount of US $700.0 million, issued at a 1.0%

WESCO International, Inc.58
discount. WESCO is amortizing the debt discount and financing costs over the life of the instrument. Non-cash interest expense of $0.1 million was recorded for the year ended December 31, 2012. The debt discount amortization will be $1.4 million annually.
Subject to the terms of the Term Loan Facility, the Borrowers may request incremental term loans thereunder from time to time in an aggregate principal amount not to exceed at any time US $300.0 million, with an equivalent principal amount in U.S. Dollars being calculated for any incremental term loan denominated in Canadian Dollars, in order to finance certain permitted acquisitions. The proceeds of the Term Loan Facility were used to finance the acquisition of EECOL, to pay fees and expenses incurred in connection with the acquisition and certain other transactions. At December 31, 2012, WESCO had a balance outstanding under the facility of US $850.8 million.
Borrowings under the Term Loan Facility bear interest at base rates plus applicable margins. At December 31, 2012, the interest rates on borrowings under the Canadian sub-facility and U.S. sub-facility were approximately 5.2% and 4.5%, respectively. The Borrowers will pay quarterly installments of principal equal to 0.25% of the original principal amount of their respective term loans, plus accrued and unpaid interest, beginning on March 31, 2013. To the extent not previously paid, the term loans will become due and payable on December 12, 2019, with any unpaid incremental term loans becoming due and payable on the respective maturity dates applicable to those incremental term loans. Other than in certain circumstances prior to the first anniversary of the closing of the Term Loan Facility, at any time or from time to time, the Borrowers may prepay borrowings under the Term Loan Facility in whole or in part without premium or penalty. The Borrowers’ obligations under the Term Loan Facility are secured by substantially all of the assets of the Borrowers, the Company and certain of the Company’s other subsidiaries; provided that, with respect to borrowings under the U.S. sub-facility, the collateral does not include assets of certain foreign subsidiaries or more than sixty-five percent of the issued and outstanding equity interests in certain foreign subsidiaries.
The Term Loan Facility contains customary affirmative and negative covenants for credit facilities of this type, including limitations on the Term Loan Parties with respect to indebtedness, liens, investments, mergers and acquisitions, dispositions of assets and transactions with affiliates. The Term Loan Facility also provides for customary events of default.
Mortgage Financing Facility
In 2003, WESCO finalized a mortgage financing facility of $51 million, of which $26.4 million was outstanding as of December 31, 2012. Total borrowings under the mortgage financing facility are subject to a 22-year amortization schedule, with a balloon payment due during the first quarter of 2013. The interest rate on borrowings under this facility is fixed at 6.5%. The Company’s intent is to pay the 2013 obligations of 26.4 million utilizing the Revolving Credit Facility and therefore this facility is classified as long-term.
Accounts Receivable Securitization Facility
On December 11, 2012, WESCO Distribution entered into an amendment of the Receivables Facility pursuant to the terms and conditions of a Seventh Amendment to Third Amended and Restated Receivables Purchase Agreement, dated as of December 11, 2012 (the “Amendment”), by and among WESCO Receivables Corp. (“WESCO Receivables”), WESCO Distribution, the Purchasers and Purchaser Agents party thereto and PNC Bank, National Association, as Administrator. The Amendment, among other things, added certain defined terms and amended certain other terms such as change in control, excluded receivables, and an intercreditor agreement. Substantially all other terms and conditions of the Receivables Facility remain unchanged. In addition, on December 11, 2012, WESCO Distribution and WESCO Receivables exercised an existing accordion feature under the Receivables Facility to increase the purchasing limit thereunder from $450.0 million to $475.0 million. The Receivables Facility matures in August 2014.
Under the Receivables Facility, WESCO sells, on a continuous basis, an undivided interest in all domestic accounts receivable to WESCO Receivables Corp., a wholly owned special purpose entity (the “SPE”). The SPE sells, without recourse, a senior undivided interest in the receivables to third-party conduits and financial institutions for cash while maintaining a subordinated undivided interest in the receivables, in the form of overcollateralization. WESCO has agreed to continue servicing the sold receivables for the third-party conduits and financial institutions at market rates; accordingly, no servicing asset or liability has been recorded.
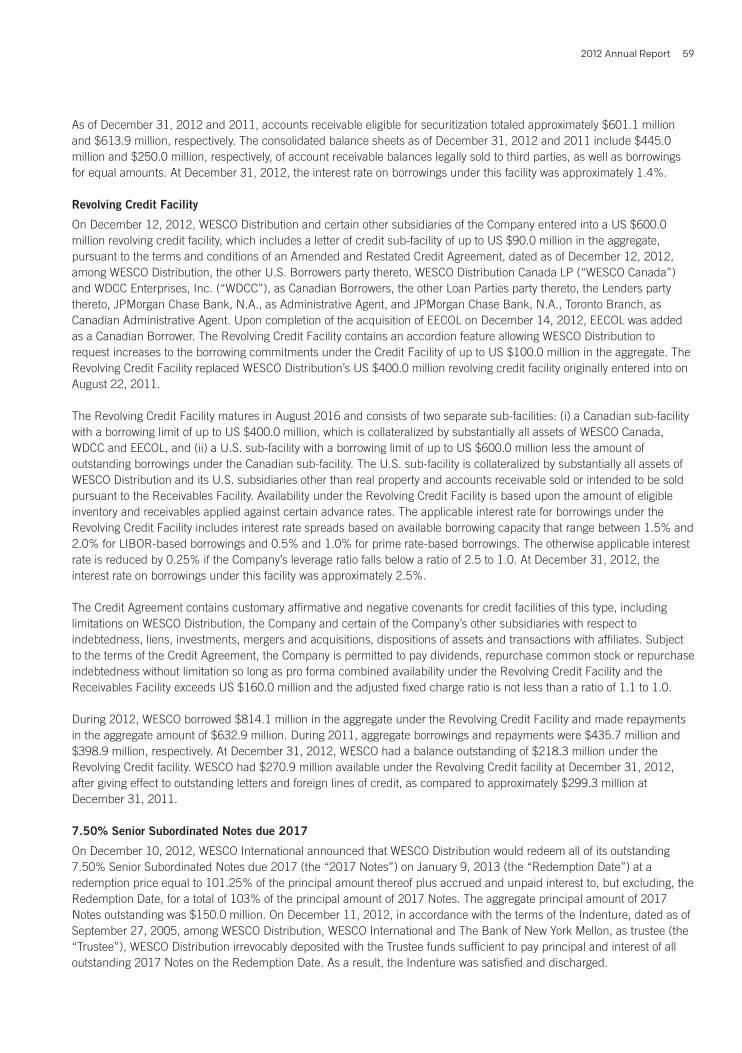
2012 Annual Report 59
As of December 31, 2012 and 2011, accounts receivable eligible for securitization totaled approximately $601.1 million and $613.9 million, respectively. The consolidated balance sheets as of December 31, 2012 and 2011 include $445.0 million and $250.0 million, respectively, of account receivable balances legally sold to third parties, as well as borrowings for equal amounts. At December 31, 2012, the interest rate on borrowings under this facility was approximately 1.4%.
Revolving Credit Facility
On December 12, 2012, WESCO Distribution and certain other subsidiaries of the Company entered into a US $600.0 million revolving credit facility, which includes a letter of credit sub-facility of up to US $90.0 million in the aggregate, pursuant to the terms and conditions of an Amended and Restated Credit Agreement, dated as of December 12, 2012, among WESCO Distribution, the other U.S. Borrowers party thereto, WESCO Distribution Canada LP (“WESCO Canada”) and WDCC Enterprises, Inc. (“WDCC”), as Canadian Borrowers, the other Loan Parties party thereto, the Lenders party thereto, JPMorgan Chase Bank, N.A., as Administrative Agent, and JPMorgan Chase Bank, N.A., Toronto Branch, as Canadian Administrative Agent. Upon completion of the acquisition of EECOL on December 14, 2012, EECOL was added as a Canadian Borrower. The Revolving Credit Facility contains an accordion feature allowing WESCO Distribution to request increases to the borrowing commitments under the Credit Facility of up to US $100.0 million in the aggregate. The Revolving Credit Facility replaced WESCO Distribution’s US $400.0 million revolving credit facility originally entered into on August 22, 2011.
The Revolving Credit Facility matures in August 2016 and consists of two separate sub-facilities: (i) a Canadian sub-facility with a borrowing limit of up to US $400.0 million, which is collateralized by substantially all assets of WESCO Canada, WDCC and EECOL, and (ii) a U.S. sub-facility with a borrowing limit of up to US $600.0 million less the amount of outstanding borrowings under the Canadian sub-facility. The U.S. sub-facility is collateralized by substantially all assets of WESCO Distribution and its U.S. subsidiaries other than real property and accounts receivable sold or intended to be sold pursuant to the Receivables Facility. Availability under the Revolving Credit Facility is based upon the amount of eligible inventory and receivables applied against certain advance rates. The applicable interest rate for borrowings under the Revolving Credit Facility includes interest rate spreads based on available borrowing capacity that range between 1.5% and 2.0% for LIBOR-based borrowings and 0.5% and 1.0% for prime rate-based borrowings. The otherwise applicable interest rate is reduced by 0.25% if the Company’s leverage ratio falls below a ratio of 2.5 to 1.0. At December 31, 2012, the interest rate on borrowings under this facility was approximately 2.5%.
The Credit Agreement contains customary affirmative and negative covenants for credit facilities of this type, including limitations on WESCO Distribution, the Company and certain of the Company’s other subsidiaries with respect to indebtedness, liens, investments, mergers and acquisitions, dispositions of assets and transactions with affiliates. Subject to the terms of the Credit Agreement, the Company is permitted to pay dividends, repurchase common stock or repurchase indebtedness without limitation so long as pro forma combined availability under the Revolving Credit Facility and the Receivables Facility exceeds US $160.0 million and the adjusted fixed charge ratio is not less than a ratio of 1.1 to 1.0.
During 2012, WESCO borrowed $814.1 million in the aggregate under the Revolving Credit Facility and made repayments in the aggregate amount of $632.9 million. During 2011, aggregate borrowings and repayments were $435.7 million and $398.9 million, respectively. At December 31, 2012, WESCO had a balance outstanding of $218.3 million under the Revolving Credit facility. WESCO had $270.9 million available under the Revolving Credit facility at December 31, 2012, after giving effect to outstanding letters and foreign lines of credit, as compared to approximately $299.3 million at December 31, 2011.
7.50% Senior Subordinated Notes due 2017
On December 10, 2012, WESCO International announced that WESCO Distribution would redeem all of its outstanding 7.50% Senior Subordinated Notes due 2017 (the “2017 Notes”) on January 9, 2013 (the “Redemption Date”) at a redemption price equal to 101.25% of the principal amount thereof plus accrued and unpaid interest to, but excluding, the Redemption Date, for a total of 103% of the principal amount of 2017 Notes. The aggregate principal amount of 2017 Notes outstanding was $150.0 million. On December 11, 2012, in accordance with the terms of the Indenture, dated as of September 27, 2005, among WESCO Distribution, WESCO International and The Bank of New York Mellon, as trustee (the “Trustee”), WESCO Distribution irrevocably deposited with the Trustee funds sufficient to pay principal and interest of all outstanding 2017 Notes on the Redemption Date. As a result, the Indenture was satisfied and discharged.
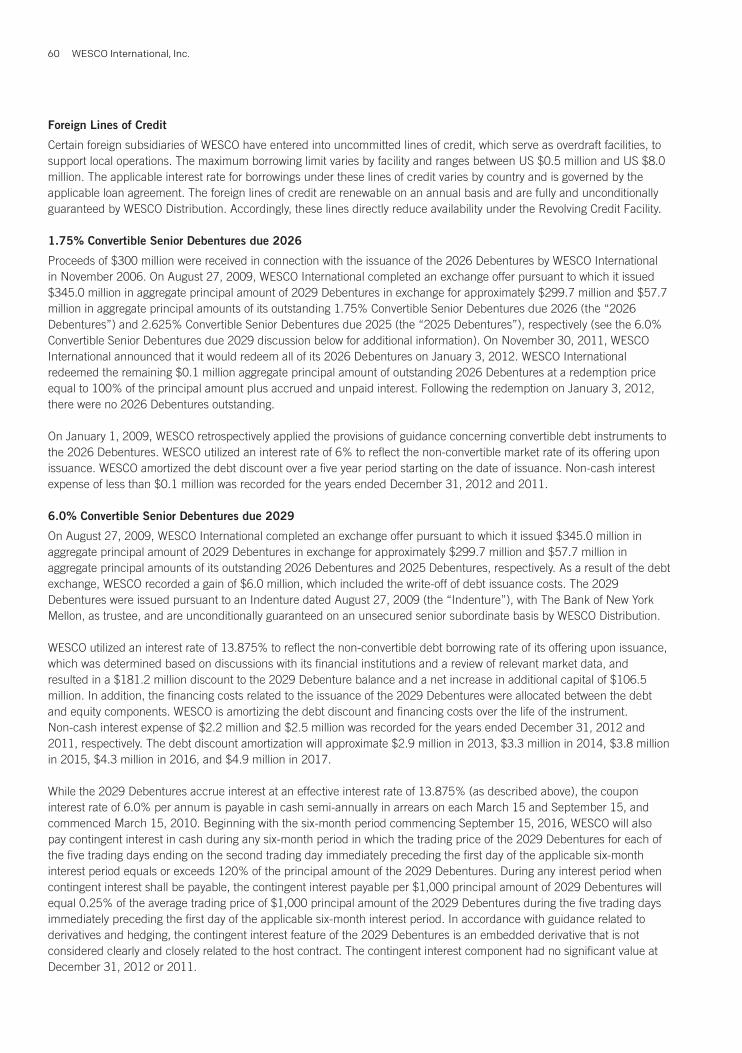
WESCO International, Inc.60
Foreign Lines of Credit
Certain foreign subsidiaries of WESCO have entered into uncommitted lines of credit, which serve as overdraft facilities, to support local operations. The maximum borrowing limit varies by facility and ranges between US $0.5 million and US $8.0 million. The applicable interest rate for borrowings under these lines of credit varies by country and is governed by the applicable loan agreement. The foreign lines of credit are renewable on an annual basis and are fully and unconditionally guaranteed by WESCO Distribution. Accordingly, these lines directly reduce availability under the Revolving Credit Facility.
1.75% Convertible Senior Debentures due 2026
Proceeds of $300 million were received in connection with the issuance of the 2026 Debentures by WESCO International in November 2006. On August 27, 2009, WESCO International completed an exchange offer pursuant to which it issued $345.0 million in aggregate principal amount of 2029 Debentures in exchange for approximately $299.7 million and $57.7 million in aggregate principal amounts of its outstanding 1.75% Convertible Senior Debentures due 2026 (the “2026 Debentures”) and 2.625% Convertible Senior Debentures due 2025 (the “2025 Debentures”), respectively (see the 6.0% Convertible Senior Debentures due 2029 discussion below for additional information). On November 30, 2011, WESCO International announced that it would redeem all of its 2026 Debentures on January 3, 2012. WESCO International redeemed the remaining $0.1 million aggregate principal amount of outstanding 2026 Debentures at a redemption price equal to 100% of the principal amount plus accrued and unpaid interest. Following the redemption on January 3, 2012, there were no 2026 Debentures outstanding.
On January 1, 2009, WESCO retrospectively applied the provisions of guidance concerning convertible debt instruments to the 2026 Debentures. WESCO utilized an interest rate of 6% to reflect the non-convertible market rate of its offering upon issuance. WESCO amortized the debt discount over a five year period starting on the date of issuance. Non-cash interest expense of less than $0.1 million was recorded for the years ended December 31, 2012 and 2011.
6.0% Convertible Senior Debentures due 2029
On August 27, 2009, WESCO International completed an exchange offer pursuant to which it issued $345.0 million in aggregate principal amount of 2029 Debentures in exchange for approximately $299.7 million and $57.7 million in aggregate principal amounts of its outstanding 2026 Debentures and 2025 Debentures, respectively. As a result of the debt exchange, WESCO recorded a gain of $6.0 million, which included the write-off of debt issuance costs. The 2029 Debentures were issued pursuant to an Indenture dated August 27, 2009 (the “Indenture”), with The Bank of New York Mellon, as trustee, and are unconditionally guaranteed on an unsecured senior subordinate basis by WESCO Distribution.
WESCO utilized an interest rate of 13.875% to reflect the non-convertible debt borrowing rate of its offering upon issuance, which was determined based on discussions with its financial institutions and a review of relevant market data, and resulted in a $181.2 million discount to the 2029 Debenture balance and a net increase in additional capital of $106.5 million. In addition, the financing costs related to the issuance of the 2029 Debentures were allocated between the debt and equity components. WESCO is amortizing the debt discount and financing costs over the life of the instrument. Non-cash interest expense of $2.2 million and $2.5 million was recorded for the years ended December 31, 2012 and 2011, respectively. The debt discount amortization will approximate $2.9 million in 2013, $3.3 million in 2014, $3.8 million in 2015, $4.3 million in 2016, and $4.9 million in 2017.
While the 2029 Debentures accrue interest at an effective interest rate of 13.875% (as described above), the coupon interest rate of 6.0% per annum is payable in cash semi-annually in arrears on each March 15 and September 15, and commenced March 15, 2010. Beginning with the six-month period commencing September 15, 2016, WESCO will also pay contingent interest in cash during any six-month period in which the trading price of the 2029 Debentures for each of the five trading days ending on the second trading day immediately preceding the first day of the applicable six-month interest period equals or exceeds 120% of the principal amount of the 2029 Debentures. During any interest period when contingent interest shall be payable, the contingent interest payable per $1,000 principal amount of 2029 Debentures will equal 0.25% of the average trading price of $1,000 principal amount of the 2029 Debentures during the five trading days immediately preceding the first day of the applicable six-month interest period. In accordance with guidance related to derivatives and hedging, the contingent interest feature of the 2029 Debentures is an embedded derivative that is not considered clearly and closely related to the host contract. The contingent interest component had no significant value at December 31, 2012 or 2011.
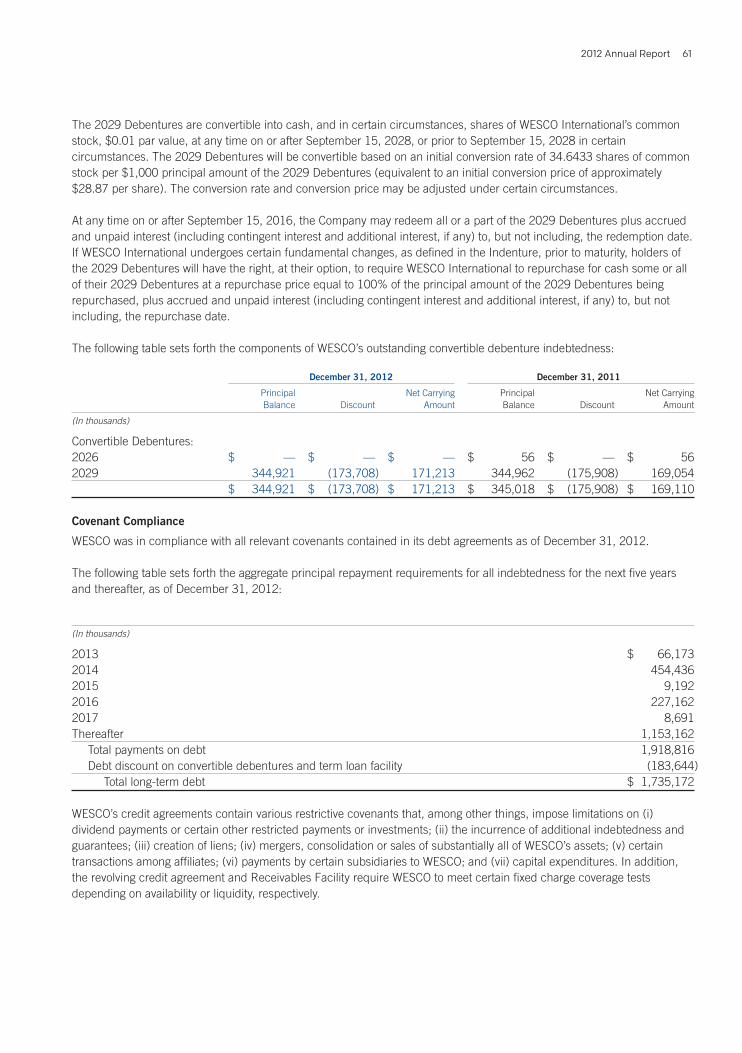
2012 Annual Report 61
The 2029 Debentures are convertible into cash, and in certain circumstances, shares of WESCO International’s common stock, $0.01 par value, at any time on or after September 15, 2028, or prior to September 15, 2028 in certain circumstances. The 2029 Debentures will be convertible based on an initial conversion rate of 34.6433 shares of common stock per $1,000 principal amount of the 2029 Debentures (equivalent to an initial conversion price of approximately $28.87 per share). The conversion rate and conversion price may be adjusted under certain circumstances.
At any time on or after September 15, 2016, the Company may redeem all or a part of the 2029 Debentures plus accrued and unpaid interest (including contingent interest and additional interest, if any) to, but not including, the redemption date. If WESCO International undergoes certain fundamental changes, as defined in the Indenture, prior to maturity, holders of the 2029 Debentures will have the right, at their option, to require WESCO International to repurchase for cash some or all of their 2029 Debentures at a repurchase price equal to 100% of the principal amount of the 2029 Debentures being repurchased, plus accrued and unpaid interest (including contingent interest and additional interest, if any) to, but not including, the repurchase date.
The following table sets forth the components of WESCO’s outstanding convertible debenture indebtedness:
December 31, 2012 December 31, 2011
Principal Net Carrying Principal Net Carrying Balance Discount Amount Balance Discount Amount
(In thousands)
Convertible Debentures:2026 $ — $ — $ — $ 56 $ — $ 562029 344,921 (173,708) 171,213 344,962 (175,908) 169,054 $ 344,921 $ (173,708) $ 171,213 $ 345,018 $ (175,908) $ 169,110
Covenant Compliance
WESCO was in compliance with all relevant covenants contained in its debt agreements as of December 31, 2012.
The following table sets forth the aggregate principal repayment requirements for all indebtedness for the next five years and thereafter, as of December 31, 2012:
(In thousands)
2013 $ 66,1732014 454,4362015 9,1922016 227,1622017 8,691Thereafter 1,153,162 Total payments on debt 1,918,816 Debt discount on convertible debentures and term loan facility (183,644) Total long-term debt $ 1,735,172
WESCO’s credit agreements contain various restrictive covenants that, among other things, impose limitations on (i) dividend payments or certain other restricted payments or investments; (ii) the incurrence of additional indebtedness and guarantees; (iii) creation of liens; (iv) mergers, consolidation or sales of substantially all of WESCO’s assets; (v) certain transactions among affiliates; (vi) payments by certain subsidiaries to WESCO; and (vii) capital expenditures. In addition, the revolving credit agreement and Receivables Facility require WESCO to meet certain fixed charge coverage tests depending on availability or liquidity, respectively.
WESCO International, Inc.62
8. CAPITAL STOCK
Preferred Stock
There are 20 million shares of preferred stock authorized at a par value of $.01 per share. The Board of Directors has the authority, without further action by the stockholders, to issue all authorized preferred shares in one or more series and to fix the number of shares, designations, voting powers, preferences, optional and other special rights and the restrictions or qualifications thereof. The rights, preferences, privileges and powers of each series of preferred stock may differ with respect to dividend rates, liquidation values, voting rights, conversion rights, redemption provisions and other matters.
Common Stock
There are 210 million shares of common stock and 20 million shares of Class B common stock authorized at a par value of $.01 per share. The Class B common stock is identical to the common stock, except for voting and conversion rights. The holders of Class B common stock have no voting rights. With certain exceptions, Class B common stock may be converted, at the option of the holder, into the same number of shares of common stock.
Under the terms of the Revolving Credit Facility and the Term Loan Agreement, WESCO International is restricted from declaring or paying dividends and as such, at December 31, 2012 and 2011, no dividends had been declared, and therefore no retained earnings were reserved for dividend payments.
Additional Capital
WESCO separately accounts for the liability and equity components of its 2029 Debentures and 2026 Debentures in a manner that reflects its non-convertible debt borrowing rate. As of December 31, 2012 and 2011, the net equity included in additional capital related to the 2029 Debentures and 2026 Debentures totaled $106.3 million and $106.4 million, respectively.
9. EQUITY INVESTMENT
During the first quarter of 2008, WESCO and Deutsch Engineered Connecting Devices, Inc. (“Deutsch”) completed a transaction with respect to WESCO’s LADD operations, which resulted in a joint venture in which Deutsch owned a 60% interest and WESCO owned a 40% interest. WESCO accounted for its investment in the joint venture using the equity method of accounting. Accordingly, earnings from the joint venture were recorded as other income in the consolidated statement of income. Deutsch was entitled, but not obliged, to acquire the remaining 40% after January 1, 2010. Deutsch paid to WESCO aggregate consideration of approximately $75.0 million, consisting of $60.0 million in cash plus a $15.0 million promissory note for its 60% interest in the joint venture.
On January 15, 2010, WESCO received $1.8 million in accrued interest related to the promissory note for the period from January 2, 2008 to January 2, 2010. In addition, Deutsch and WESCO entered into an amended promissory note agreement. The amendment extended the maturity date for the payment of principal and interest to the earlier of (a) the closing date of Deutsch’s option to acquire the remaining 40% joint venture interest or (b) the maturity date of Deutsch’s credit facility or mezzanine financing facility. Interest accrued at a rate of 8.5% compounded annually. Management believed this rate was commensurate with a market rate of interest; therefore, no reserve or allowance was recorded against the promissory note.
On April 30, 2010, Deutsch notified WESCO it would exercise its option to purchase the remaining 40% of the LADD joint venture. The option price for Deutsch to acquire the remaining 40% of the joint venture was determined based upon a multiple of trailing earnings, with a minimum purchase price of $40.0 million and maximum purchase price of $50.0 million. The investment in the LADD joint venture at March 31, 2010 was $43.4 million, and the estimated option exercise price was $40.0 million. As a result, WESCO recorded a pre-tax impairment loss of $3.4 million to selling, general and administrative expenses during the first quarter of 2010. On June 7, 2010, WESCO completed the sale of its 40% interest in the LADD joint venture and recorded an additional impairment charge of $0.4 million to selling, general and administrative expenses. WESCO received $40.0 million for its 40% interest plus $15.0 million for the outstanding promissory note and $0.5 million for accrued interest.

2012 Annual Report 63
10. INCOME TAXES
The following table sets forth the components of the provision for income taxes:
Year Ended December 31, 2012 2011 2010
(In thousands)
Current taxes: Federal(1) $ 51,132 $ 60,415 $ 11,363 State 6,006 5,705 2,018 Foreign 5,079 2,643 7,801 Total current 62,217 68,763 21,182Deferred taxes: Federal 15,034 9,692 21,069 State 1,080 2,187 1,112 Foreign 1,549 2,494 (1,199) Total deferred 17,663 14,373 20,982 $ 79,880 $ 83,136 $ 42,164
(1) Tax benefits related to stock options and other equity instruments recorded directly to additional paid in capital totaled $11.3 million, $5.6 million and $8.2 million in 2012, 2011 and 2010, respectively.
The following table sets forth the components of income before income taxes by jurisdiction:
Year Ended December 31, 2012 2011 2010
(In thousands)
United States $ 255,700 $ 260,859 $ 166,108Foreign 25,938 18,517 (8,467) $ 281,639 $ 279,376 $ 157,641
The following table sets forth the reconciliation between the federal statutory income tax rate and the effective rate:
Year Ended December 31, 2012 2011 2010
Federal statutory rate 35.0% 35.0% 35.0%State taxes, net of federal tax benefit 1.8 2.1 1.5Nondeductible expenses 1.0 0.7 1.3Domestic tax benefit from foreign operations (0.2) — (0.3)Foreign tax rate differences (0.9) (0.8) 0.2Tax effect of intercompany financing (6.3) (6.1) (10.6)Federal tax credits — (0.1) (0.1)Domestic production activity deduction (0.5) (0.5) (0.5)Adjustment related to uncertain tax positions (0.6) (0.7) (4.2)Revaluation of deferred tax items (0.1) 0.4 1.9Other (0.8) (0.2) 2.5 28.4% 29.8% 26.7%
As of December 31, 2012, WESCO had approximately $323.5 million of undistributed earnings related to its foreign subsidiaries. Management believes that these earnings will be indefinitely reinvested in foreign jurisdiction; accordingly, WESCO has not provided for U.S. federal income taxes related to these earnings.
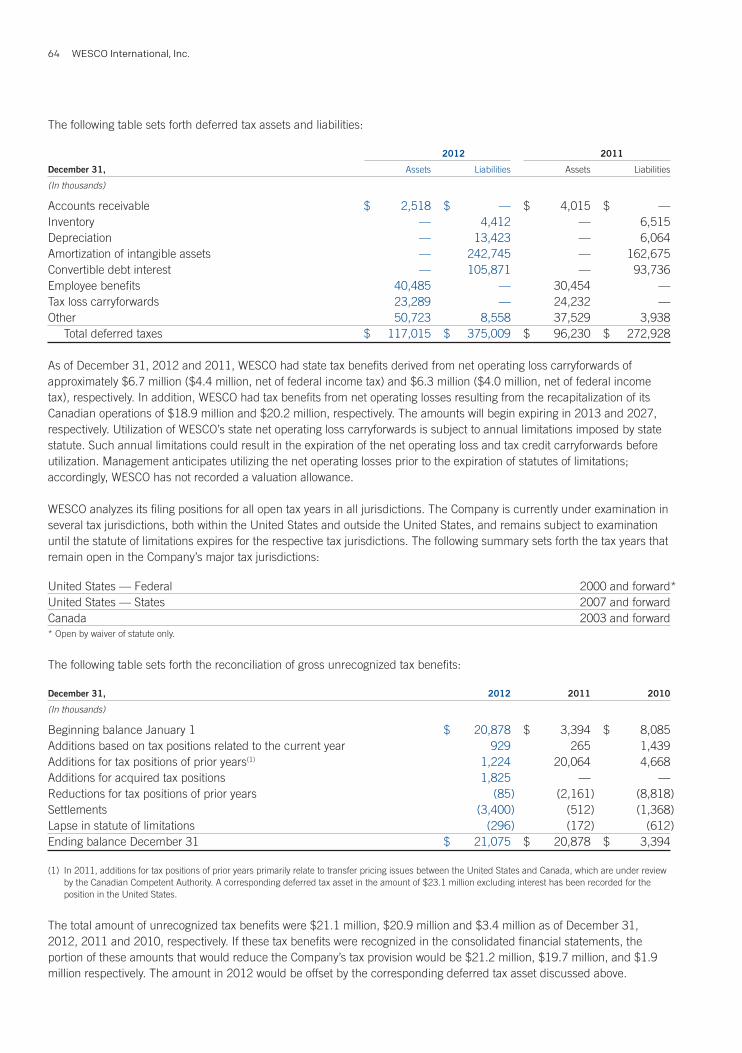
WESCO International, Inc.64
The following table sets forth deferred tax assets and liabilities:
2012 2011
December 31, Assets Liabilities Assets Liabilities
(In thousands)
Accounts receivable $ 2,518 $ — $ 4,015 $ —Inventory — 4,412 — 6,515Depreciation — 13,423 — 6,064Amortization of intangible assets — 242,745 — 162,675Convertible debt interest — 105,871 — 93,736Employee benefits 40,485 — 30,454 —Tax loss carryforwards 23,289 — 24,232 —Other 50,723 8,558 37,529 3,938 Total deferred taxes $ 117,015 $ 375,009 $ 96,230 $ 272,928
As of December 31, 2012 and 2011, WESCO had state tax benefits derived from net operating loss carryforwards of approximately $6.7 million ($4.4 million, net of federal income tax) and $6.3 million ($4.0 million, net of federal income tax), respectively. In addition, WESCO had tax benefits from net operating losses resulting from the recapitalization of its Canadian operations of $18.9 million and $20.2 million, respectively. The amounts will begin expiring in 2013 and 2027, respectively. Utilization of WESCO’s state net operating loss carryforwards is subject to annual limitations imposed by state statute. Such annual limitations could result in the expiration of the net operating loss and tax credit carryforwards before utilization. Management anticipates utilizing the net operating losses prior to the expiration of statutes of limitations; accordingly, WESCO has not recorded a valuation allowance.
WESCO analyzes its filing positions for all open tax years in all jurisdictions. The Company is currently under examination in several tax jurisdictions, both within the United States and outside the United States, and remains subject to examination until the statute of limitations expires for the respective tax jurisdictions. The following summary sets forth the tax years that remain open in the Company’s major tax jurisdictions:
United States — Federal 2000 and forward*United States — States 2007 and forwardCanada 2003 and forward* Open by waiver of statute only.
The following table sets forth the reconciliation of gross unrecognized tax benefits:
December 31, 2012 2011 2010
(In thousands)
Beginning balance January 1 $ 20,878 $ 3,394 $ 8,085Additions based on tax positions related to the current year 929 265 1,439Additions for tax positions of prior years(1) 1,224 20,064 4,668Additions for acquired tax positions 1,825 — —Reductions for tax positions of prior years (85) (2,161) (8,818)Settlements (3,400) (512) (1,368)Lapse in statute of limitations (296) (172) (612)Ending balance December 31 $ 21,075 $ 20,878 $ 3,394
(1) In 2011, additions for tax positions of prior years primarily relate to transfer pricing issues between the United States and Canada, which are under review by the Canadian Competent Authority. A corresponding deferred tax asset in the amount of $23.1 million excluding interest has been recorded for the position in the United States.
The total amount of unrecognized tax benefits were $21.1 million, $20.9 million and $3.4 million as of December 31, 2012, 2011 and 2010, respectively. If these tax benefits were recognized in the consolidated financial statements, the portion of these amounts that would reduce the Company’s tax provision would be $21.2 million, $19.7 million, and $1.9 million respectively. The amount in 2012 would be offset by the corresponding deferred tax asset discussed above.
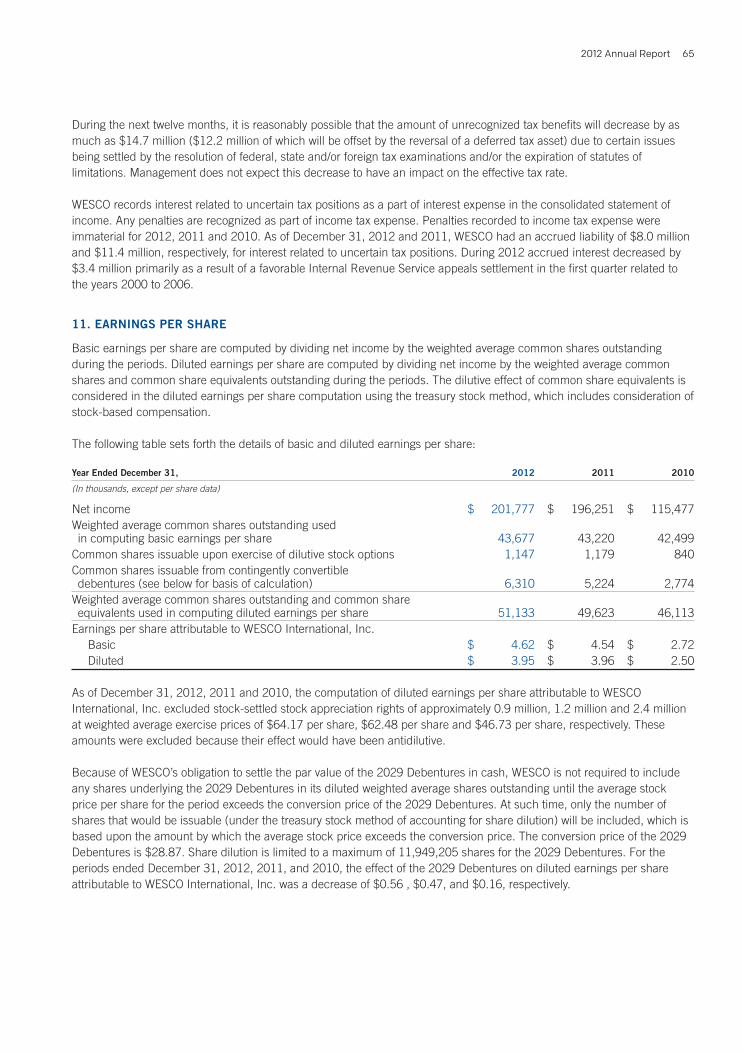
2012 Annual Report 65
During the next twelve months, it is reasonably possible that the amount of unrecognized tax benefits will decrease by as much as $14.7 million ($12.2 million of which will be offset by the reversal of a deferred tax asset) due to certain issues being settled by the resolution of federal, state and/or foreign tax examinations and/or the expiration of statutes of limitations. Management does not expect this decrease to have an impact on the effective tax rate.
WESCO records interest related to uncertain tax positions as a part of interest expense in the consolidated statement of income. Any penalties are recognized as part of income tax expense. Penalties recorded to income tax expense were immaterial for 2012, 2011 and 2010. As of December 31, 2012 and 2011, WESCO had an accrued liability of $8.0 million and $11.4 million, respectively, for interest related to uncertain tax positions. During 2012 accrued interest decreased by $3.4 million primarily as a result of a favorable Internal Revenue Service appeals settlement in the first quarter related to the years 2000 to 2006.
11. EARNINGS PER SHARE
Basic earnings per share are computed by dividing net income by the weighted average common shares outstanding during the periods. Diluted earnings per share are computed by dividing net income by the weighted average common shares and common share equivalents outstanding during the periods. The dilutive effect of common share equivalents is considered in the diluted earnings per share computation using the treasury stock method, which includes consideration of stock-based compensation.
The following table sets forth the details of basic and diluted earnings per share:
Year Ended December 31, 2012 2011 2010
(In thousands, except per share data)
Net income $ 201,777 $ 196,251 $ 115,477Weighted average common shares outstanding used in computing basic earnings per share 43,677 43,220 42,499Common shares issuable upon exercise of dilutive stock options 1,147 1,179 840Common shares issuable from contingently convertible debentures (see below for basis of calculation) 6,310 5,224 2,774Weighted average common shares outstanding and common share equivalents used in computing diluted earnings per share 51,133 49,623 46,113Earnings per share attributable to WESCO International, Inc. Basic $ 4.62 $ 4.54 $ 2.72 Diluted $ 3.95 $ 3.96 $ 2.50
As of December 31, 2012, 2011 and 2010, the computation of diluted earnings per share attributable to WESCO International, Inc. excluded stock-settled stock appreciation rights of approximately 0.9 million, 1.2 million and 2.4 million at weighted average exercise prices of $64.17 per share, $62.48 per share and $46.73 per share, respectively. These amounts were excluded because their effect would have been antidilutive.
Because of WESCO’s obligation to settle the par value of the 2029 Debentures in cash, WESCO is not required to include any shares underlying the 2029 Debentures in its diluted weighted average shares outstanding until the average stock price per share for the period exceeds the conversion price of the 2029 Debentures. At such time, only the number of shares that would be issuable (under the treasury stock method of accounting for share dilution) will be included, which is based upon the amount by which the average stock price exceeds the conversion price. The conversion price of the 2029 Debentures is $28.87. Share dilution is limited to a maximum of 11,949,205 shares for the 2029 Debentures. For the periods ended December 31, 2012, 2011, and 2010, the effect of the 2029 Debentures on diluted earnings per share attributable to WESCO International, Inc. was a decrease of $0.56 , $0.47, and $0.16, respectively.
WESCO International, Inc.66
12. EMPLOYEE BENEFIT PLANS
Defined Contribution Plans
A majority of WESCO’s employees are covered by defined contribution retirement savings plans for their service rendered subsequent to WESCO’s formation. WESCO also offers a deferred compensation plan for select individuals. For U.S. participants, WESCO will make contributions in an amount equal to 50% of the participant’s total monthly contributions up to a maximum of 6% of eligible compensation. For Canadian participants, WESCO will make contributions in an amount ranging from 1% to 7% of the participant’s eligible compensation based on years of continuous service. In addition, employer contributions may be made at the discretion of the Board of Directors. Discretionary employer contributions charges of $18.6 million, $16.2 million, and $14.2 million were incurred in 2012, 2011, and 2010, respectively. For the years ended December 31, 2012, 2011 and 2010, WESCO incurred charges of $31.8 million, $27.6 million, and $25.3 million, respectively, for all such plans. Contributions are made in cash to employee retirement savings plan accounts. Employees then have the option to transfer balances allocated to their accounts into any of the available investment options, including WESCO common stock.
Defined Benefit Plans
In connection with the December 14, 2012 acquisition of EECOL discussed in Note 5, the Company assumed a contributory defined benefit plan covering all employees of EECOL. The plan provides retirement benefits based on earnings and credited service, and participants may contribute 2% of their earnings to the plan. Participants become 100% vested after two years of continuous service.
The Company also assumed EECOL’s Supplemental Executive Retirement Plan (SERP) which provides additional pension benefits to certain executives based on earnings, credited service, and executive service. Participants in the plan are vested after two years of continuous service and may contribute 4% of their earnings to the plan.
The following tables present the changes in benefit obligations, plan assets and funded status for the pension plans and the components of net periodic pension cost.
2012 Annual Report 67
Year ended December 31, 2012
(In thousands)
Accumulated Benefit Obligation (ABO) at December 31 $ 80,252
Change in Projected Benefit Obligation (PBO)PBO at beginning of year $ —Effect of acquisition 102,829Service cost 158Interest cost 217Participant contributions 85Actuarial loss (gain), including assumption changes 277Benefits paid (100)PBO at end of year $ 103,466
Change in Fair Value of Plan AssetsPlan assets at beginning of year $ —Effect of acquisition 60,297Actual return on plan assets 870Employee contributions 85Company contributions 298Benefits paid (100)Plan assets at end of year $ 61,450
Funded status $ (42,016)
Amounts recognized in the balance sheetCurrent liabilities $ (201)Non-current liabilities (41,815)Net pension liability at end of year $ (42,016)
Amounts recognized in Accumulated Other Comprehensive Loss Before TaxNet actuarial loss (gain) $ (414)Prior service cost —Total recognized in accumulated other comprehensive loss $ (414)
Year ended December 31, 2012
(In thousands)
Net Periodic Pension CostService cost $ 158Interest cost 217Expected return on plan assets (177)Total net periodic pension cost $ 198
Other Changes in Plan Assets and Projected Benefit Obligation Recognized in Other Comprehensive EarningsNet actuarial loss (gain) $ (416)Total recognized in other comprehensive earnings $ (416)Total recognized in net periodic pension cost and other comprehensive earnings $ (218)
Actuarial assumptions used to determine benefit obligations at December 31, 2012 are as follows:
Pension Plan SERP
Discount rate 4.5% 4.5%Average salary increases 4.0% 4.0%
WESCO International, Inc.68
Actuarial assumptions used to determine net periodic pension cost for the year ended December 31, 2012 are as follows:
Pension Plan SERP
Discount rate 4.5% 4.5%Expected return on long-term assets 6.3% n/aRate of compensation increase 4.0% 4.0%
The following benefit payments, which reflect expected future service, are expected to be paid:
Years ending December 31,
(In thousands)
2013 $ 1,9212014 2,1712015 2,5682016 2,6452017 2,7342018-2023 16,724
The Company expects to contribute approximately $3.9 million to the plans in 2013.
The Company’s pension plan weighted asset allocations as of December 31, 2012 by asset category are as follows:
Asset CategoryEquity securities 57.7 %Debt securities 42.3 % 100.0 %
The Plan’s long-term overall objective is to maintain benefits at their current level without affecting the cost of maintaining the plan, assuming that the demographic make-up of the group of members remains the same.
The primary investment objective, in support of the overall objective, is to earn the highest rate of return possible for the Plan, while keeping risk at acceptable levels. The long-term return objective of the Plan is to achieve a minimum annualized rate of return in excess of the actuarial requirements. This translates into a required return of 3.5% percent above inflation, net of investment management fees. The return objective is consistent with the overall investment risk level that the Plan assumes in order to meet the pension obligations of the Plan. To achieve this long term investment objective, the Plan has adopted an asset mix that has a combination of equity and fixed income investments. Risk is controlled by investing in a well-diversified portfolio of asset classes. To meet this objective, a benchmark portfolio is established based on the expected returns for each asset class available. The investment of the Plan’s assets in accordance with the benchmark portfolio should enable the Plan to not only attain, but also exceed the minimum overall objective.
The following table presents the target asset mix based on market value for each investment category within which the investment managers must invest the Plan’s assets. The manager is required to rebalance the asset mix back to the target on a quarterly basis.
Asset Category Target %
Canadian equities 25 %U.S. equities 15 %Non-North American equities 20 % Total equities 60 %Fixed income bond managers 40 %
Fair value is defined as the price that would be received to sell an asset or paid to transfer a liability in an orderly transaction between market participants at the measurement date. The fair value hierarchy distinguishes between (1) market participant assumptions developed based on market data obtained from independent sources (observable inputs)
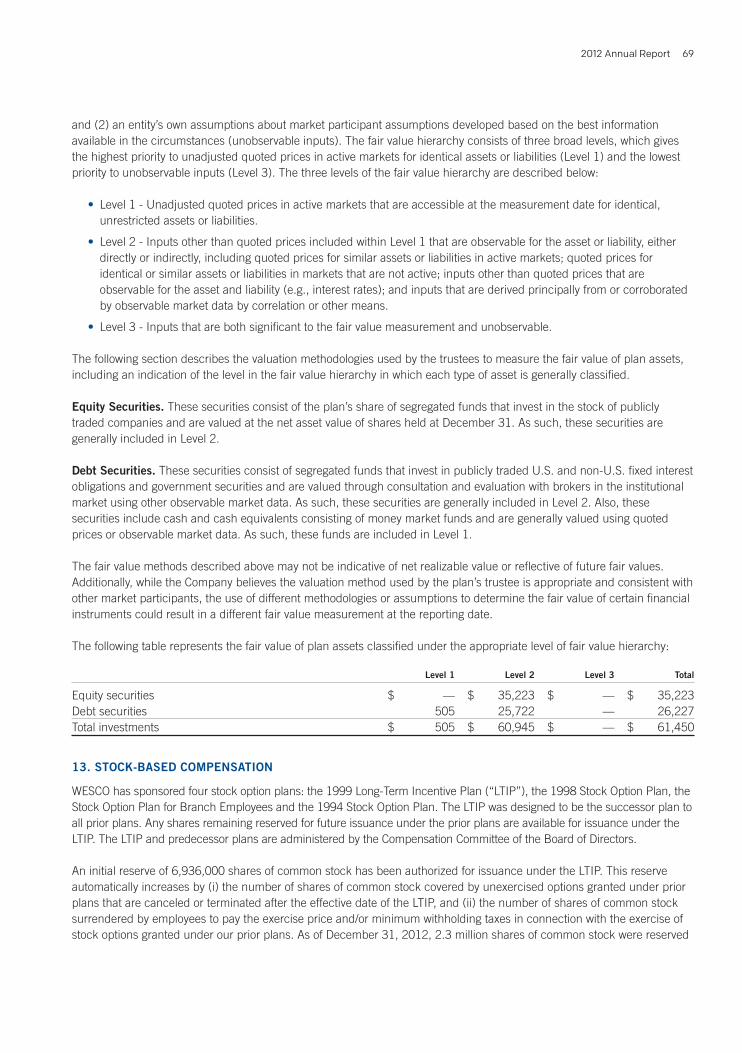
2012 Annual Report 69
and (2) an entity’s own assumptions about market participant assumptions developed based on the best information available in the circumstances (unobservable inputs). The fair value hierarchy consists of three broad levels, which gives the highest priority to unadjusted quoted prices in active markets for identical assets or liabilities (Level 1) and the lowest priority to unobservable inputs (Level 3). The three levels of the fair value hierarchy are described below:
• Level 1 - Unadjusted quoted prices in active markets that are accessible at the measurement date for identical, unrestricted assets or liabilities.
• Level 2 - Inputs other than quoted prices included within Level 1 that are observable for the asset or liability, either directly or indirectly, including quoted prices for similar assets or liabilities in active markets; quoted prices for identical or similar assets or liabilities in markets that are not active; inputs other than quoted prices that are observable for the asset and liability (e.g., interest rates); and inputs that are derived principally from or corroborated by observable market data by correlation or other means.
• Level 3 - Inputs that are both significant to the fair value measurement and unobservable.
The following section describes the valuation methodologies used by the trustees to measure the fair value of plan assets, including an indication of the level in the fair value hierarchy in which each type of asset is generally classified.
Equity Securities. These securities consist of the plan’s share of segregated funds that invest in the stock of publicly traded companies and are valued at the net asset value of shares held at December 31. As such, these securities are generally included in Level 2.
Debt Securities. These securities consist of segregated funds that invest in publicly traded U.S. and non-U.S. fixed interest obligations and government securities and are valued through consultation and evaluation with brokers in the institutional market using other observable market data. As such, these securities are generally included in Level 2. Also, these securities include cash and cash equivalents consisting of money market funds and are generally valued using quoted prices or observable market data. As such, these funds are included in Level 1.
The fair value methods described above may not be indicative of net realizable value or reflective of future fair values. Additionally, while the Company believes the valuation method used by the plan’s trustee is appropriate and consistent with other market participants, the use of different methodologies or assumptions to determine the fair value of certain financial instruments could result in a different fair value measurement at the reporting date.
The following table represents the fair value of plan assets classified under the appropriate level of fair value hierarchy:
Level 1 Level 2 Level 3 Total
Equity securities $ — $ 35,223 $ — $ 35,223Debt securities 505 25,722 — 26,227Total investments $ 505 $ 60,945 $ — $ 61,450
13. STOCK-BASED COMPENSATION
WESCO has sponsored four stock option plans: the 1999 Long-Term Incentive Plan (“LTIP”), the 1998 Stock Option Plan, the Stock Option Plan for Branch Employees and the 1994 Stock Option Plan. The LTIP was designed to be the successor plan to all prior plans. Any shares remaining reserved for future issuance under the prior plans are available for issuance under the LTIP. The LTIP and predecessor plans are administered by the Compensation Committee of the Board of Directors.
An initial reserve of 6,936,000 shares of common stock has been authorized for issuance under the LTIP. This reserve automatically increases by (i) the number of shares of common stock covered by unexercised options granted under prior plans that are canceled or terminated after the effective date of the LTIP, and (ii) the number of shares of common stock surrendered by employees to pay the exercise price and/or minimum withholding taxes in connection with the exercise of stock options granted under our prior plans. As of December 31, 2012, 2.3 million shares of common stock were reserved

WESCO International, Inc.70
under the LTIP for future equity award grants. In December 2003, in a privately negotiated transaction, WESCO redeemed the net equity value of stock options originally granted in 1994 and 1995, representing approximately 2.9 million shares. These shares are included in the reserve of common stock available for issuance under the LTIP.
Except for the performance-based award, awards granted vest and become exercisable once criteria based on time is achieved. Performance-based awards vest based on market or performance conditions. All awards vest immediately in the event of a change in control. Each award terminates on the tenth anniversary of its grant date unless terminated sooner under certain conditions.
As of December 31, 2012, there was $18.0 million of total unrecognized compensation expense related to non-vested stock-based compensation arrangements for all awards previously made of which approximately $11.5 million is expected to be recognized in 2013, $5.9 million in 2014 and $0.7 million in 2015.
The total intrinsic value of awards exercised during the years ended December 31, 2012, 2011, and 2010 was $41.1 million, $13.8 million, and $9.9 million, respectively. The total amount of cash received from the exercise of options was $3.2 million, $0.4 million, and $1.8 million, respectively. The tax benefit associated with the exercise of stock options and stock-settled stock appreciation rights totaled $11.4 million, $5.4 million , and $3.1 million in 2012, 2011, and 2010, respectively. WESCO uses the direct only method and tax law ordering approach to calculate the tax effects of stock-based compensation. The tax benefit was recorded as a credit to additional paid-in capital.
The following table sets forth a summary of both stock options and stock appreciation rights and related information for the years indicated:
2012 2011 2010
Weighted Weighted Average Aggregate Weighted Weighted Average Remaining Intrinsic Average Average Exercise Conntractual Value Exercise Exercise Awards Price Life (In thousands) Awards Price Awards Price
Beginning of year 4,266,533 $ 39.64 4,498,303 $ 36.38 4,226,153 $ 35.30
Granted 257,932 64.12 399,260 59.16 708,949 33.19
Exercised (1,340,986) 30.54 (543,154) 25.83 (335,155) 14.79
Cancelled (41,458) 49.96 (87,876) 46.86 (101,644) 40.62
End of year 3,142,021 45.40 5.8 $ 53,058 4,266,533 39.64 4,498,303 36.38
Exercisable at end of year 2,450,391 $ 43.16 5.1 $ 46,898 3,176,161 $ 39.23 3,011,120 $ 38.65
WESCO granted the following stock-settled stock appreciation rights at the following weighted average assumptions:
2012 2011 2010
Stock-settled appreciation rights granted 257,932 399,260 708,949Risk free interest rate 0.9% 2.3% 1.8%Expected life (in years) 5 5 5Expected volatility 50% 49% 49%
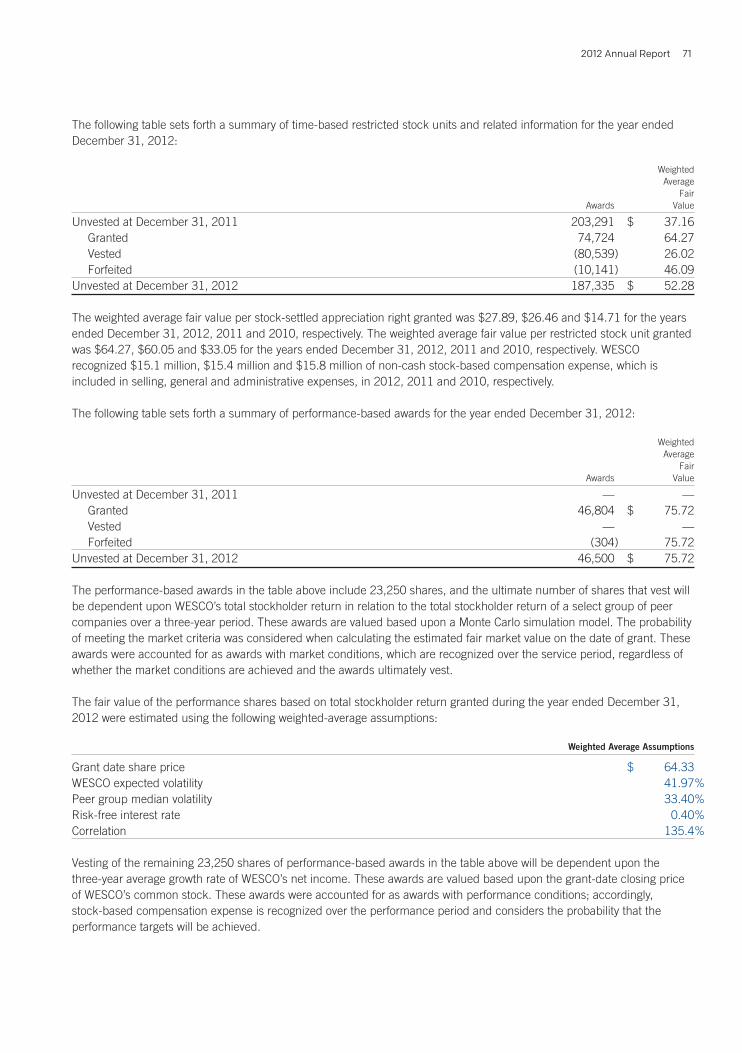
2012 Annual Report 71
The following table sets forth a summary of time-based restricted stock units and related information for the year ended December 31, 2012:
Weighted Average Fair Awards Value
Unvested at December 31, 2011 203,291 $ 37.16 Granted 74,724 64.27 Vested (80,539) 26.02 Forfeited (10,141) 46.09Unvested at December 31, 2012 187,335 $ 52.28
The weighted average fair value per stock-settled appreciation right granted was $27.89, $26.46 and $14.71 for the years ended December 31, 2012, 2011 and 2010, respectively. The weighted average fair value per restricted stock unit granted was $64.27, $60.05 and $33.05 for the years ended December 31, 2012, 2011 and 2010, respectively. WESCO recognized $15.1 million, $15.4 million and $15.8 million of non-cash stock-based compensation expense, which is included in selling, general and administrative expenses, in 2012, 2011 and 2010, respectively.
The following table sets forth a summary of performance-based awards for the year ended December 31, 2012:
Weighted Average Fair Awards Value
Unvested at December 31, 2011 — — Granted 46,804 $ 75.72 Vested — — Forfeited (304) 75.72Unvested at December 31, 2012 46,500 $ 75.72
The performance-based awards in the table above include 23,250 shares, and the ultimate number of shares that vest will be dependent upon WESCO’s total stockholder return in relation to the total stockholder return of a select group of peer companies over a three-year period. These awards are valued based upon a Monte Carlo simulation model. The probability of meeting the market criteria was considered when calculating the estimated fair market value on the date of grant. These awards were accounted for as awards with market conditions, which are recognized over the service period, regardless of whether the market conditions are achieved and the awards ultimately vest.
The fair value of the performance shares based on total stockholder return granted during the year ended December 31, 2012 were estimated using the following weighted-average assumptions:
Weighted Average Assumptions
Grant date share price $ 64.33WESCO expected volatility 41.97%Peer group median volatility 33.40%Risk-free interest rate 0.40%Correlation 135.4%
Vesting of the remaining 23,250 shares of performance-based awards in the table above will be dependent upon the three-year average growth rate of WESCO’s net income. These awards are valued based upon the grant-date closing price of WESCO’s common stock. These awards were accounted for as awards with performance conditions; accordingly, stock-based compensation expense is recognized over the performance period and considers the probability that the performance targets will be achieved.

WESCO International, Inc.72
14. COMMITMENTS AND CONTINGENCIES
Future minimum rental payments required under operating leases, primarily for real property that have noncancelable lease terms in excess of one year as of December 31, 2012, are as follows:
(In thousands)
2013 $ 53,4632014 40,2532015 35,7262016 29,1472017 22,990Thereafter 53,092
Rental expense for the years ended December 31, 2012, 2011 and 2010 was $50.0 million, $48.0 million and $45.4 million, respectively.
From time to time, a number of lawsuits and claims have been or may be asserted against WESCO relating to the conduct of its business, including routine litigation relating to commercial and employment matters. The outcomes of litigation cannot be predicted with certainty, and some lawsuits may be determined adversely to WESCO. However, management does not believe that the ultimate outcome is likely to have a material adverse effect on WESCO’s financial condition or liquidity, although the resolution in any fiscal quarter of one or more of these matters may have a material adverse effect on WESCO’s results of operations for that period.
As initially reported in our 2008 Annual Report on Form 10-K, WESCO International, Inc. (the “Company”), through its wholly owned subsidiary, WESCO Distribution, Inc., is a defendant in a lawsuit filed in a state court in Indiana in which a customer, ArcelorMittal Indiana Harbor, Inc. (“AIH”), alleges that the Company sold defective products to AIH in 2004 that were supplied to the Company by others. The lawsuit sought monetary damages in the amount of approximately $50 million. On February 14, 2013, the jury returned a verdict in favor of AIH and awarded damages in the amount of approximately $36 million. Judgment was entered on the jury’s verdict on February 14, 2013. The Company disputes this outcome and intends to appeal the judgment. The judgment amount may increase or decrease based on the outcome of various post-trial proceedings, which cannot be predicted with certainty. The Company has also submitted the claims to its insurance carriers.
15. SEGMENTS AND RELATED INFORMATION
WESCO provides distribution of product and services through its eleven operating segments which have been aggregated as one reportable segment. WESCO has over 250,000 unique product stock keeping units and markets more than 1,000,000 products for customers. There were no material amounts of sales or transfers among geographic areas and no material amounts of export sales.
WESCO attributes revenues from external customers to individual countries on the basis of the point of sale. The following table sets forth information about WESCO by geographic area:
Net Sales Long-Lived Assets Year Ended December 31, December 31,
2012 2011 2010 2012 2011 2010
(In thousands)
United States $ 5,215,849 79 % $ 4,994,641 82 % $ 4,198,420 83 % $ 144,947 $ 131,989 $ 117,768
Canada 1,084,109 17 % 900,551 15 % 682,415 13 % 100,366 24,609 12,446
Mexico 92,370 1 % 84,871 1 % 51,413 1 % 532 572 641
Subtotal North American Operations 6,392,328 5,980,063 4,932,248 245,845 157,170 130,855
Other Foreign 186,973 3 % 145,655 2 % 131,614 3 % 6,049 771 325
Total U.S. and Foreign $ 6,579,301 $ 6,125,718 $ 5,063,862 $ 251,894 $ 157,941 $ 131,180
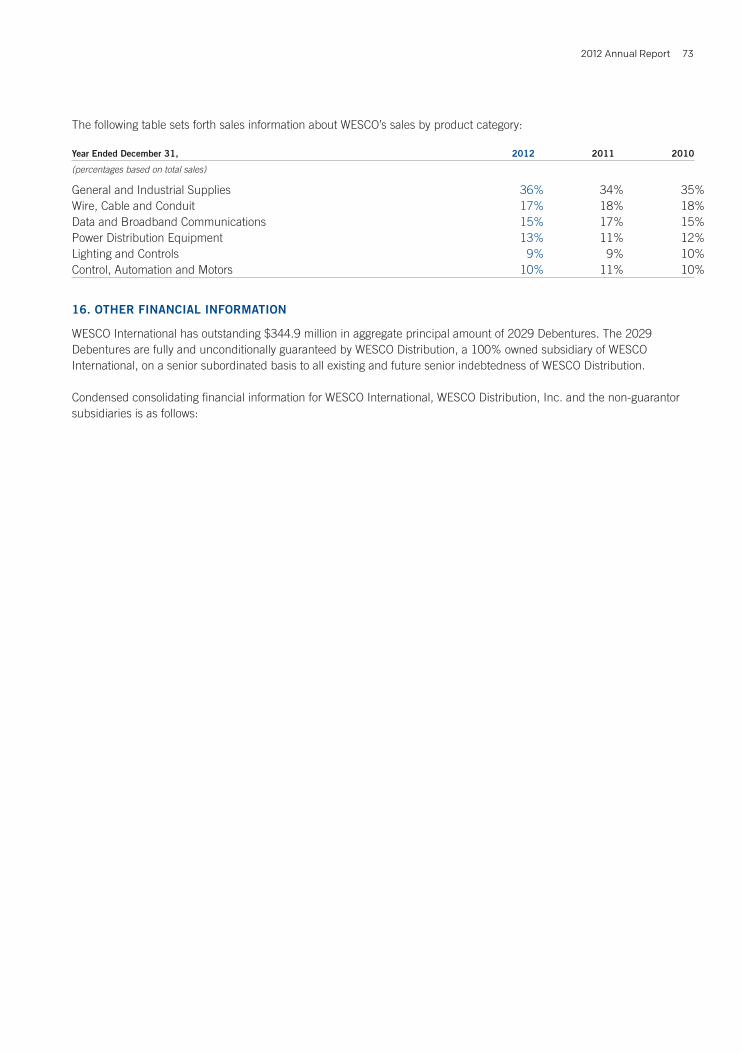
2012 Annual Report 73
The following table sets forth sales information about WESCO’s sales by product category:
Year Ended December 31, 2012 2011 2010
(percentages based on total sales)
General and Industrial Supplies 36% 34% 35%Wire, Cable and Conduit 17% 18% 18%Data and Broadband Communications 15% 17% 15%Power Distribution Equipment 13% 11% 12%Lighting and Controls 9% 9% 10%Control, Automation and Motors 10% 11% 10%
16. OTHER FINANCIAL INFORMATION
WESCO International has outstanding $344.9 million in aggregate principal amount of 2029 Debentures. The 2029 Debentures are fully and unconditionally guaranteed by WESCO Distribution, a 100% owned subsidiary of WESCO International, on a senior subordinated basis to all existing and future senior indebtedness of WESCO Distribution.
Condensed consolidating financial information for WESCO International, WESCO Distribution, Inc. and the non-guarantor subsidiaries is as follows:
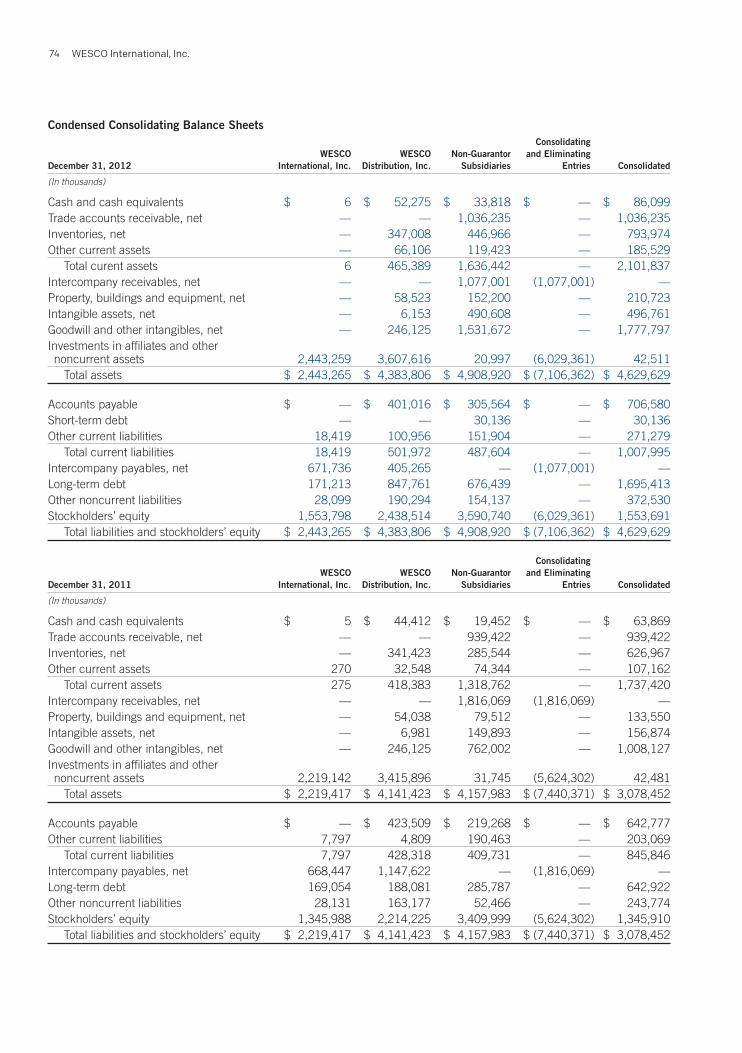
WESCO International, Inc.74
Condensed Consolidating Balance Sheets Consolidating WESCO WESCO Non-Guarantor and Eliminating December 31, 2012 International, Inc. Distribution, Inc. Subsidiaries Entries Consolidated
(In thousands)
Cash and cash equivalents $ 6 $ 52,275 $ 33,818 $ — $ 86,099Trade accounts receivable, net — — 1,036,235 — 1,036,235Inventories, net — 347,008 446,966 — 793,974Other current assets — 66,106 119,423 — 185,529 Total curent assets 6 465,389 1,636,442 — 2,101,837Intercompany receivables, net — — 1,077,001 (1,077,001) —Property, buildings and equipment, net — 58,523 152,200 — 210,723Intangible assets, net — 6,153 490,608 — 496,761Goodwill and other intangibles, net — 246,125 1,531,672 — 1,777,797Investments in affiliates and other noncurrent assets 2,443,259 3,607,616 20,997 (6,029,361) 42,511 Total assets $ 2,443,265 $ 4,383,806 $ 4,908,920 $ (7,106,362) $ 4,629,629
Accounts payable $ — $ 401,016 $ 305,564 $ — $ 706,580Short-term debt — — 30,136 — 30,136Other current liabilities 18,419 100,956 151,904 — 271,279 Total current liabilities 18,419 501,972 487,604 — 1,007,995Intercompany payables, net 671,736 405,265 — (1,077,001) —Long-term debt 171,213 847,761 676,439 — 1,695,413Other noncurrent liabilities 28,099 190,294 154,137 — 372,530Stockholders’ equity 1,553,798 2,438,514 3,590,740 (6,029,361) 1,553,691 Total liabilities and stockholders’ equity $ 2,443,265 $ 4,383,806 $ 4,908,920 $ (7,106,362) $ 4,629,629
Consolidating WESCO WESCO Non-Guarantor and Eliminating December 31, 2011 International, Inc. Distribution, Inc. Subsidiaries Entries Consolidated
(In thousands)
Cash and cash equivalents $ 5 $ 44,412 $ 19,452 $ — $ 63,869Trade accounts receivable, net — — 939,422 — 939,422Inventories, net — 341,423 285,544 — 626,967Other current assets 270 32,548 74,344 — 107,162 Total current assets 275 418,383 1,318,762 — 1,737,420Intercompany receivables, net — — 1,816,069 (1,816,069) —Property, buildings and equipment, net — 54,038 79,512 — 133,550Intangible assets, net — 6,981 149,893 — 156,874Goodwill and other intangibles, net — 246,125 762,002 — 1,008,127Investments in affiliates and other noncurrent assets 2,219,142 3,415,896 31,745 (5,624,302) 42,481 Total assets $ 2,219,417 $ 4,141,423 $ 4,157,983 $ (7,440,371) $ 3,078,452
Accounts payable $ — $ 423,509 $ 219,268 $ — $ 642,777Other current liabilities 7,797 4,809 190,463 — 203,069 Total current liabilities 7,797 428,318 409,731 — 845,846Intercompany payables, net 668,447 1,147,622 — (1,816,069) —Long-term debt 169,054 188,081 285,787 — 642,922Other noncurrent liabilities 28,131 163,177 52,466 — 243,774Stockholders’ equity 1,345,988 2,214,225 3,409,999 (5,624,302) 1,345,910 Total liabilities and stockholders’ equity $ 2,219,417 $ 4,141,423 $ 4,157,983 $ (7,440,371) $ 3,078,452

2012 Annual Report 75
Condensed Consolidating Statements of Income Consolidating WESCO WESCO Non-Guarantor and Eliminating Year Ended December 31, 2012 International, Inc. Distribution, Inc. Subsidiaries Entries Consolidated
(In thousands)
Net sales $ — $ 3,442,714 $ 3,265,007 $ (128,420) $ 6,579,301Cost of goods sold — 2,738,941 2,637,334 (128,420) 5,247,855Selling, general and administrative expenses 59 593,400 367,555 — 961,014Depreciation and amortization — 15,208 22,353 — 37,561Results of affiliates’ operations 235,467 184,947 — (420,414) —Interest expense, net 23,163 17,683 6,916 — 47,762Loss on debt extinguishment — 3,470 — — 3,470Provision for income taxes 10,486 23,493 45,901 — 79,880 Net income (loss) 201,759 235,466 184,948 (420,414) 201,759 Less: Net loss attributable to
noncontrolling interest — — (18) — (18) Net income (loss) attributable to
WESCO International, Inc. $ 201,759 $ 235,466 $ 184,966 $ (420,414) $ 201,777
Consolidating WESCO WESCO Non-Guarantor and Eliminating Year Ended December 31, 2011 International, Inc. Distribution, Inc. Subsidiaries Entries Consolidated
(In thousands)
Net sales $ — $ 3,230,753 $ 2,998,639 $ (103,674) $ 6,125,718Cost of goods sold — 2,585,978 2,406,845 (103,674) 4,889,149Selling, general and administrative expenses 70 546,902 325,011 — 871,983Depreciation and amortization — 11,996 19,611 — 31,607Results of affiliates’ operations 229,621 176,581 — (406,202) —Interest expense, net 23,990 21,382 8,231 — 53,603Provision for income taxes 9,321 11,455 62,360 — 83,136 Net income 196,240 229,621 176,581 (406,202) 196,240 Less: Net loss attributable to
noncontrolling interest — — (11) — (11) Net income attributable to
WESCO International, Inc. $ 196,240 $ 229,621 $ 176,592 $ (406,202) $ 196,251
Consolidating WESCO WESCO Non-Guarantor and Eliminating Year Ended December 31, 2010 International, Inc. Distribution, Inc. Subsidiaries Entries Consolidated
(In thousands)
Net sales $ — $ 2,820,855 $ 2,318,495 $ (75,488) $ 5,063,862Cost of goods sold — 2,262,038 1,878,875 (75,488) 4,065,425Selling, general and administrative expenses 234 518,100 245,249 — 763,583Depreciation and amortization — 12,581 11,354 — 23,935Results of affiliates’ operations 153,107 130,267 — (283,374) —Interest expense, net 27,565 22,291 7,707 — 57,563Other income — (4,285) — — (4,285)Provision for income taxes 9,831 (12,708) 45,041 — 42,164 Net income attributable to
WESCO International, Inc. $ 115,477 $ 153,105 $ 130,269 $ (283,374) $ 115,477
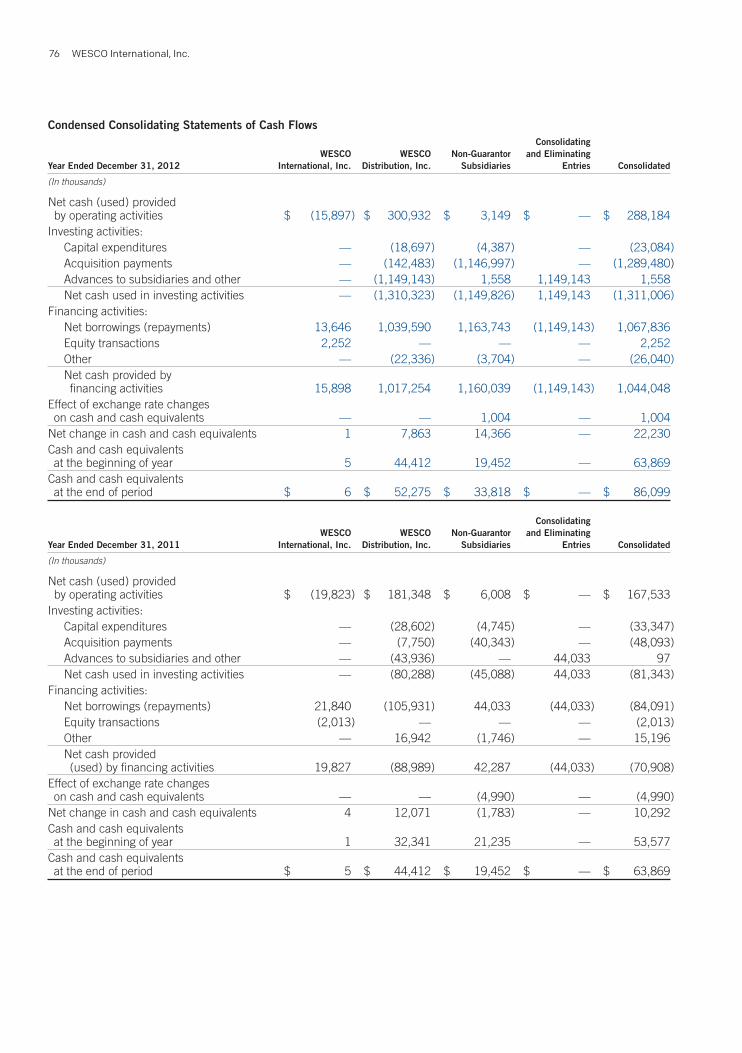
WESCO International, Inc.76
Condensed Consolidating Statements of Cash Flows Consolidating WESCO WESCO Non-Guarantor and Eliminating Year Ended December 31, 2012 International, Inc. Distribution, Inc. Subsidiaries Entries Consolidated
(In thousands)
Net cash (used) provided by operating activities $ (15,897) $ 300,932 $ 3,149 $ — $ 288,184Investing activities: Capital expenditures — (18,697) (4,387) — (23,084) Acquisition payments — (142,483) (1,146,997) — (1,289,480) Advances to subsidiaries and other — (1,149,143) 1,558 1,149,143 1,558 Net cash used in investing activities — (1,310,323) (1,149,826) 1,149,143 (1,311,006)Financing activities: Net borrowings (repayments) 13,646 1,039,590 1,163,743 (1,149,143) 1,067,836 Equity transactions 2,252 — — — 2,252 Other — (22,336) (3,704) — (26,040) Net cash provided by
financing activities 15,898 1,017,254 1,160,039 (1,149,143) 1,044,048Effect of exchange rate changes on cash and cash equivalents — — 1,004 — 1,004Net change in cash and cash equivalents 1 7,863 14,366 — 22,230Cash and cash equivalents at the beginning of year 5 44,412 19,452 — 63,869Cash and cash equivalents at the end of period $ 6 $ 52,275 $ 33,818 $ — $ 86,099
Consolidating WESCO WESCO Non-Guarantor and Eliminating Year Ended December 31, 2011 International, Inc. Distribution, Inc. Subsidiaries Entries Consolidated
(In thousands)
Net cash (used) provided by operating activities $ (19,823) $ 181,348 $ 6,008 $ — $ 167,533Investing activities: Capital expenditures — (28,602) (4,745) — (33,347) Acquisition payments — (7,750) (40,343) — (48,093) Advances to subsidiaries and other — (43,936) — 44,033 97 Net cash used in investing activities — (80,288) (45,088) 44,033 (81,343)Financing activities: Net borrowings (repayments) 21,840 (105,931) 44,033 (44,033) (84,091) Equity transactions (2,013) — — — (2,013) Other — 16,942 (1,746) — 15,196 Net cash provided
(used) by financing activities 19,827 (88,989) 42,287 (44,033) (70,908)Effect of exchange rate changes on cash and cash equivalents — — (4,990) — (4,990)Net change in cash and cash equivalents 4 12,071 (1,783) — 10,292Cash and cash equivalents at the beginning of year 1 32,341 21,235 — 53,577Cash and cash equivalents at the end of period $ 5 $ 44,412 $ 19,452 $ — $ 63,869

2012 Annual Report 77
Condensed Consolidating Statements of Cash Flows (continued) Consolidating WESCO WESCO Non-Guarantor and Eliminating Year Ended December 31, 2010 International, Inc. Distribution, Inc. Subsidiaries Entries Consolidated
(In thousands)
Net cash (used) provided by operating activities $ (96,685) $ 301,578 $ (77,610) $ — $ 127,283Investing activities: Capital expenditures — (12,903) (2,229) — (15,132) Acquisition payments — (265,397) — — (265,397) Sale of subsidiary — 40,000 — — 40,000 Advances to subsidiaries and other — 16,431 — 3,555 19,986 Net cash used in investing activities — (221,869) (2,229) 3,555 (220,543)Financing activities: Net borrowings (repayments) 92,350 (58,894) 3,555 (3,555) 33,456 Equity transactions 4,333 — — — 4,333 Other — (5,398) (1,756) — (7,154) Net cash provided
(used) by financing activities 96,683 (64,292) 1,799 (3,555) 30,635Effect of exchange rate changes on cash and cash equivalents — — 3,873 — 3,873Net change in cash and cash equivalents (2) 15,417 (74,167) — (58,752)Cash and cash equivalents at the beginning of year 3 16,924 95,402 — 112,329Cash and cash equivalents at the end of period $ 1 $ 32,341 $ 21,235 $ — $ 53,577
The Company has revised the condensed consolidating statement of cash flows of WESCO Distribution, Inc. The revised statements present cash paid for acquisitions of $40.3 million for the year ended December 31, 2011 as intercompany loans to Non-Guarantor Subsidiaries. These payments represent acquisi-tions made by the Non-Guarantor subsidiaries that were funded by WECSO Distribution, Inc. Such transactions have now been revised to reflect an investing cash outflow and a corresponding intercompany borrowing from WESCO Distribution, Inc as a financing cash inflow in the statement of cash flows of the Non-Guarantor Subsidiaries. The impact of such revision, which the Company has determined was not material, did not have any impact on the consolidated amounts, nor did it impact the Company’s obligations under the 2029 Debentures. The prior period quarterly condensed consolidating financial statements will be similarly revised as the information is presented in our Form 10-Q filings in fiscal year 2013.
The condensed consolidating financial information was also revised to properly reflect interest expense related to intercompany borrowings in the amount of $4.9 million and $5.5 million for the years ended December 31, 2011 and 2010, respectively.
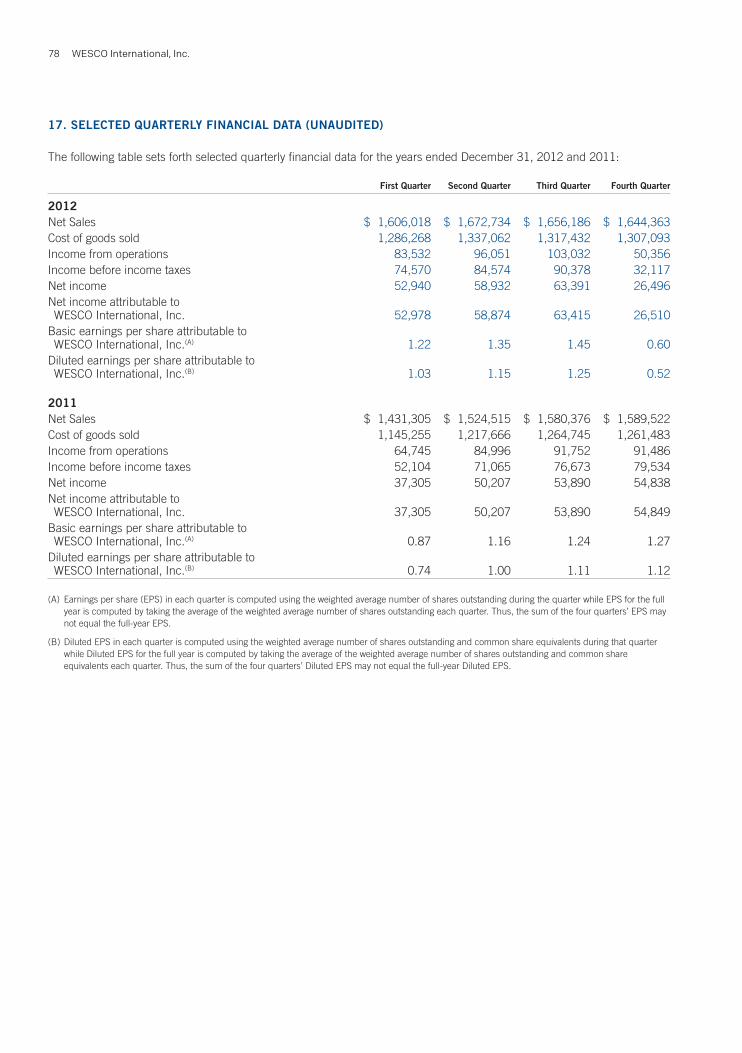
WESCO International, Inc.78
17. SELECTED QUARTERLY FINANCIAL DATA (UNAUDITED)
The following table sets forth selected quarterly financial data for the years ended December 31, 2012 and 2011:
First Quarter Second Quarter Third Quarter Fourth Quarter
2012 Net Sales $ 1,606,018 $ 1,672,734 $ 1,656,186 $ 1,644,363Cost of goods sold 1,286,268 1,337,062 1,317,432 1,307,093Income from operations 83,532 96,051 103,032 50,356Income before income taxes 74,570 84,574 90,378 32,117Net income 52,940 58,932 63,391 26,496Net income attributable to WESCO International, Inc. 52,978 58,874 63,415 26,510Basic earnings per share attributable to WESCO International, Inc.(A) 1.22 1.35 1.45 0.60Diluted earnings per share attributable to WESCO International, Inc.(B) 1.03 1.15 1.25 0.52
2011 Net Sales $ 1,431,305 $ 1,524,515 $ 1,580,376 $ 1,589,522Cost of goods sold 1,145,255 1,217,666 1,264,745 1,261,483Income from operations 64,745 84,996 91,752 91,486Income before income taxes 52,104 71,065 76,673 79,534Net income 37,305 50,207 53,890 54,838Net income attributable to WESCO International, Inc. 37,305 50,207 53,890 54,849Basic earnings per share attributable to WESCO International, Inc.(A) 0.87 1.16 1.24 1.27Diluted earnings per share attributable to WESCO International, Inc.(B) 0.74 1.00 1.11 1.12
(A) Earnings per share (EPS) in each quarter is computed using the weighted average number of shares outstanding during the quarter while EPS for the full year is computed by taking the average of the weighted average number of shares outstanding each quarter. Thus, the sum of the four quarters’ EPS may not equal the full-year EPS.
(B) Diluted EPS in each quarter is computed using the weighted average number of shares outstanding and common share equivalents during that quarter while Diluted EPS for the full year is computed by taking the average of the weighted average number of shares outstanding and common share equivalents each quarter. Thus, the sum of the four quarters’ Diluted EPS may not equal the full-year Diluted EPS.
2012 Annual Report 79
Item 9. Changes in and Disagreements with Accountants on Accounting and Financial Disclosure.
None.
Item 9A. Controls and Procedures.
Conclusion Regarding the Effectiveness of Disclosure Controls and Procedures
Under the supervision and with the participation of our management, including our principal executive officer and principal financial officer, we conducted an evaluation of our disclosure controls and procedures as such term is defined under Rule 13a-15(e) promulgated under the Exchange Act. Based on this evaluation, our principal executive officer and our principal financial officer concluded that our disclosure controls and procedures were effective as of the end of the period covered by this report.
Management’s Report on Internal Control Over Financial Reporting
Our management is responsible for establishing and maintaining adequate internal control over financial reporting as such term is defined in Exchange Act Rule 13a-15(f). Because of its inherent limitations, internal control over financial reporting may not prevent or detect misstatements. Also, projections of any evaluation of effectiveness to future periods are subject to the risk that controls may become inadequate because of changes in conditions, or that the degree of compliance with the policies or procedures may deteriorate. Under the supervision and with the participation of our management, including our principal executive officer and principal financial officer, we conducted an evaluation of the effectiveness of our internal control over financial reporting based on the framework in Internal Control — Integrated Framework issued by the Committee of Sponsoring Organizations of the Treadway Commission. Based on our evaluation under the framework in Internal Control — Integrated Framework, our management concluded that our internal control over financial reporting was effective as of December 31, 2012. Management has excluded EECOL Electric Corporation (EECOL) and Conney Safety Products (Conney) from its assessment of internal control over financial reporting as of December 31, 2012 because they were acquired by the Company in a purchase business combination during 2012. EECOL and Conney are wholly-owned subsidiaries whose total assets represent $1.4 billion and $144.8 million, respectively, and total revenues of $24.1 million and $39.0 million, respectively, of the related consolidated financial statement amounts as of and for the year ended December 31, 2012.
The effectiveness of the Company’s internal control over financial reporting as of December 31, 2012 has been audited by PricewaterhouseCoopers LLP, an independent registered public accounting firm, as stated in their report, which is included herein.
Changes in Internal Control Over Financial Reporting
During the last fiscal quarter of 2012, there were no changes in the Company’s internal control over financial reporting identified in connection with management’s evaluation of the effectiveness of the Company’s internal control over financial reporting that have materially affected, or are reasonably likely to materially affect, the Company’s internal control over financial reporting.
Item 9B. Other Information.
None.
WESCO International, Inc.80
PART III
Item 10. Directors, Executive Officers and Corporate Governance.
The information set forth under the captions “Board of Directors” and “Executive Officers” in our definitive Proxy Statement for our 2013 Annual Meeting of Stockholders is incorporated herein by reference.
CODES OF BUSINESS ETHICS AND CONDUCT
We have adopted a Code of Business Ethics and Conduct (“Code of Conduct”) that applies to our Directors, officers and employees that is available on our website at www.wesco.com by selecting the “Investors” tab followed by the “Corporate Governance” heading. Any amendment or waiver of the Code of Conduct for our officers or Directors will be disclosed promptly at that location on our website.
We also have adopted a Senior Financial Executive Code of Principles for Senior Executives (“Senior Financial Executive Code”) that applies to our principal executive officer, principal financial officer, principal accounting officer or controller, or persons performing these functions. The Senior Financial Executive Code is also available at that same location on our website. We intend to timely disclose any amendment or waiver of the Senior Financial Executive Code on our website and will retain such information on our website as required by applicable SEC rules.
A copy of the Code of Conduct and/or Senior Financial Executive Code may also be obtained upon request by any stockholder, without charge, by writing to us at WESCO International, Inc., 225 West Station Square Drive, Suite 700, Pittsburgh, Pennsylvania 15219, Attention: Corporate Secretary.
The information required by Item 10 that relates to our Directors and executive officers is incorporated by reference from the information appearing under the captions “Corporate Governance”, “Board and Committee Meetings” and “Security Ownership” in our definitive Proxy Statement for our 2013 Annual Meeting of Stockholders that is to be filed with the SEC pursuant to the Exchange Act within 120 days of the end of our fiscal year on December 31, 2012.
Item 11. Executive Compensation.
The information set forth under the captions “Compensation Discussion and Analysis” and “Director Compensation” in our definitive Proxy Statement for our 2013 Annual Meeting of Stockholders is incorporated herein by reference.
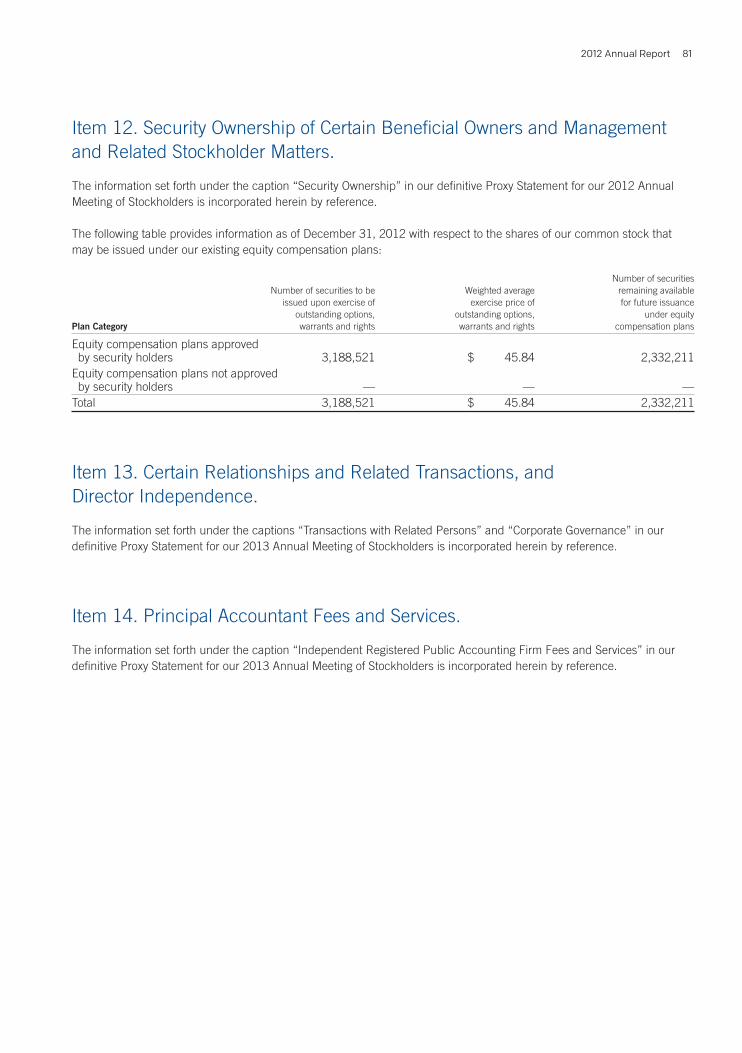
2012 Annual Report 81
Item 12. Security Ownership of Certain Beneficial Owners and Management and Related Stockholder Matters.
The information set forth under the caption “Security Ownership” in our definitive Proxy Statement for our 2012 Annual Meeting of Stockholders is incorporated herein by reference.
The following table provides information as of December 31, 2012 with respect to the shares of our common stock that may be issued under our existing equity compensation plans:
Number of securities Number of securities to be Weighted average remaining available issued upon exercise of exercise price of for future issuance outstanding options, outstanding options, under equity Plan Category warrants and rights warrants and rights compensation plans
Equity compensation plans approved by security holders 3,188,521 $ 45.84 2,332,211Equity compensation plans not approved by security holders — — —Total 3,188,521 $ 45.84 2,332,211
Item 13. Certain Relationships and Related Transactions, and Director Independence.
The information set forth under the captions “Transactions with Related Persons” and “Corporate Governance” in our definitive Proxy Statement for our 2013 Annual Meeting of Stockholders is incorporated herein by reference.
Item 14. Principal Accountant Fees and Services.
The information set forth under the caption “Independent Registered Public Accounting Firm Fees and Services” in our definitive Proxy Statement for our 2013 Annual Meeting of Stockholders is incorporated herein by reference.
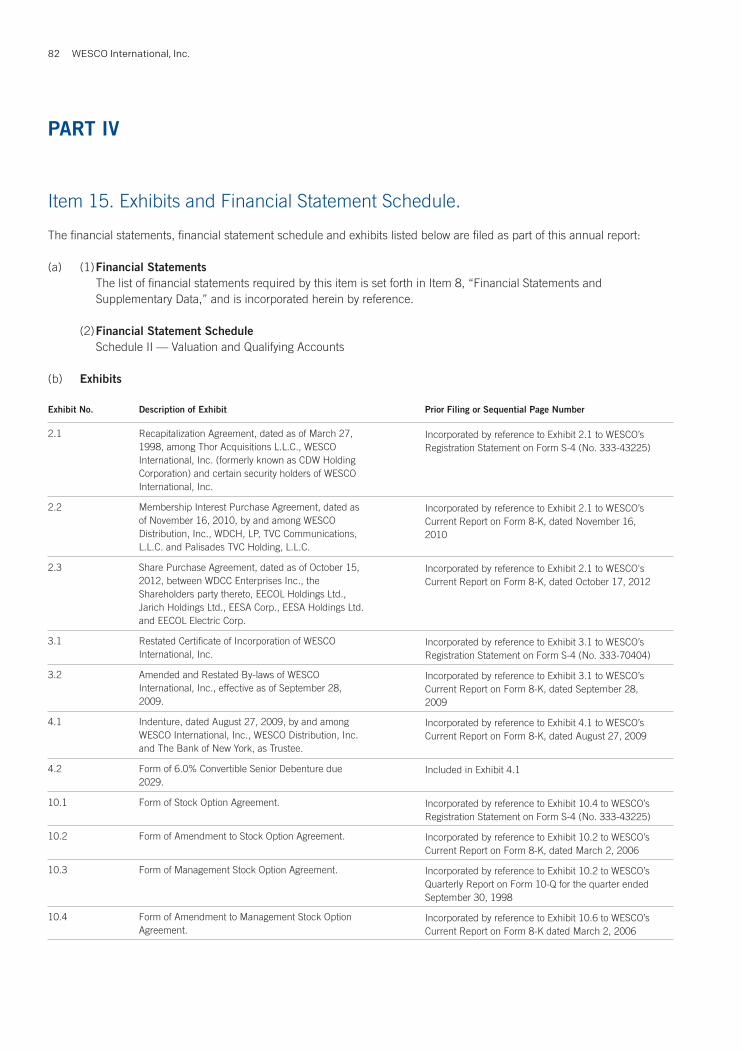
WESCO International, Inc.82
PART IV
Item 15. Exhibits and Financial Statement Schedule.
The financial statements, financial statement schedule and exhibits listed below are filed as part of this annual report:
(a) (1) Financial Statements The list of financial statements required by this item is set forth in Item 8, “Financial Statements and Supplementary Data,” and is incorporated herein by reference.
(2) Financial Statement Schedule Schedule II — Valuation and Qualifying Accounts
(b) Exhibits
Exhibit No. Description of Exhibit Prior Filing or Sequential Page Number
2.1 Recapitalization Agreement, dated as of March 27, 1998, among Thor Acquisitions L.L.C., WESCO International, Inc. (formerly known as CDW Holding Corporation) and certain security holders of WESCO International, Inc.
Incorporated by reference to Exhibit 2.1 to WESCO’s Registration Statement on Form S-4 (No. 333-43225)
2.2 Membership Interest Purchase Agreement, dated as of November 16, 2010, by and among WESCO Distribution, Inc., WDCH, LP, TVC Communications, L.L.C. and Palisades TVC Holding, L.L.C.
Incorporated by reference to Exhibit 2.1 to WESCO’s Current Report on Form 8-K, dated November 16, 2010
2.3 Share Purchase Agreement, dated as of October 15, 2012, between WDCC Enterprises Inc., the Shareholders party thereto, EECOL Holdings Ltd., Jarich Holdings Ltd., EESA Corp., EESA Holdings Ltd. and EECOL Electric Corp.
Incorporated by reference to Exhibit 2.1 to WESCO's Current Report on Form 8-K, dated October 17, 2012
3.1 Restated Certificate of Incorporation of WESCO International, Inc.
Incorporated by reference to Exhibit 3.1 to WESCO’s Registration Statement on Form S-4 (No. 333-70404)
3.2 Amended and Restated By-laws of WESCO International, Inc., effective as of September 28, 2009.
Incorporated by reference to Exhibit 3.1 to WESCO’s Current Report on Form 8-K, dated September 28, 2009
4.1 Indenture, dated August 27, 2009, by and among WESCO International, Inc., WESCO Distribution, Inc. and The Bank of New York, as Trustee.
Incorporated by reference to Exhibit 4.1 to WESCO’s Current Report on Form 8-K, dated August 27, 2009
4.2 Form of 6.0% Convertible Senior Debenture due 2029.
Included in Exhibit 4.1
10.1 Form of Stock Option Agreement. Incorporated by reference to Exhibit 10.4 to WESCO’s Registration Statement on Form S-4 (No. 333-43225)
10.2 Form of Amendment to Stock Option Agreement. Incorporated by reference to Exhibit 10.2 to WESCO’s Current Report on Form 8-K, dated March 2, 2006
10.3 Form of Management Stock Option Agreement. Incorporated by reference to Exhibit 10.2 to WESCO’s Quarterly Report on Form 10-Q for the quarter ended September 30, 1998
10.4 Form of Amendment to Management Stock Option Agreement.
Incorporated by reference to Exhibit 10.6 to WESCO’s Current Report on Form 8-K dated March 2, 2006
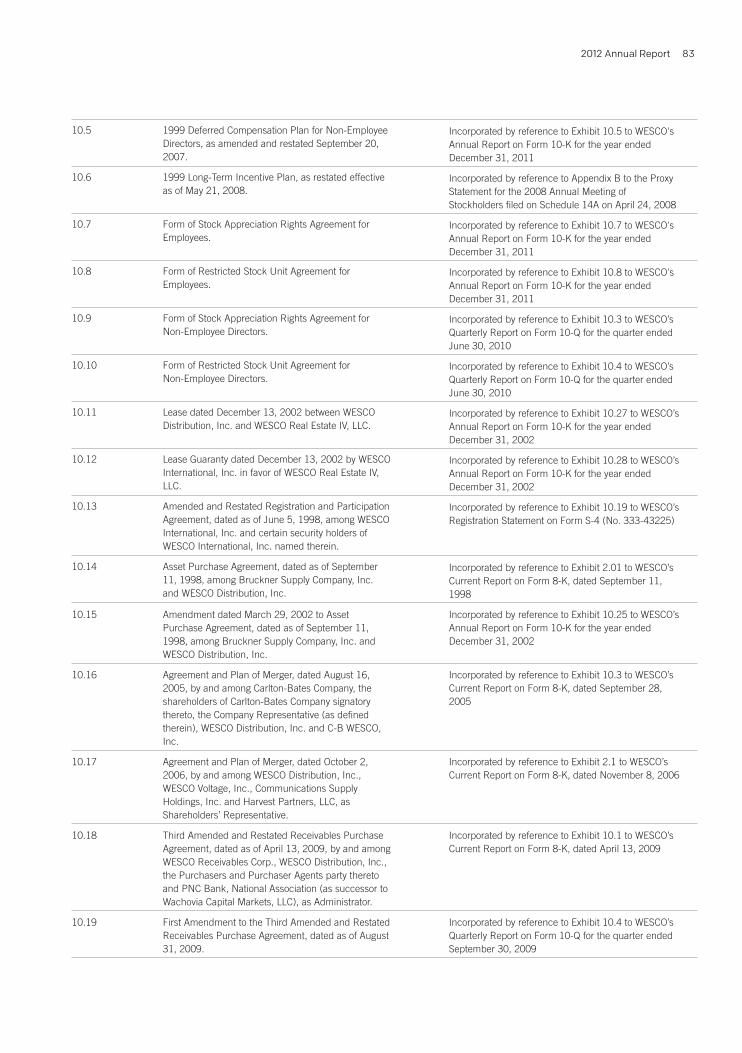
2012 Annual Report 83
10.5 1999 Deferred Compensation Plan for Non-Employee Directors, as amended and restated September 20, 2007.
Incorporated by reference to Exhibit 10.5 to WESCO's Annual Report on Form 10-K for the year ended December 31, 2011
10.6 1999 Long-Term Incentive Plan, as restated effective as of May 21, 2008.
Incorporated by reference to Appendix B to the Proxy Statement for the 2008 Annual Meeting of Stockholders filed on Schedule 14A on April 24, 2008
10.7 Form of Stock Appreciation Rights Agreement for Employees.
Incorporated by reference to Exhibit 10.7 to WESCO's Annual Report on Form 10-K for the year ended December 31, 2011
10.8 Form of Restricted Stock Unit Agreement for Employees.
Incorporated by reference to Exhibit 10.8 to WESCO's Annual Report on Form 10-K for the year ended December 31, 2011
10.9 Form of Stock Appreciation Rights Agreement for Non-Employee Directors.
Incorporated by reference to Exhibit 10.3 to WESCO’s Quarterly Report on Form 10-Q for the quarter ended June 30, 2010
10.10 Form of Restricted Stock Unit Agreement for Non-Employee Directors.
Incorporated by reference to Exhibit 10.4 to WESCO’s Quarterly Report on Form 10-Q for the quarter ended June 30, 2010
10.11 Lease dated December 13, 2002 between WESCO Distribution, Inc. and WESCO Real Estate IV, LLC.
Incorporated by reference to Exhibit 10.27 to WESCO’s Annual Report on Form 10-K for the year ended December 31, 2002
10.12 Lease Guaranty dated December 13, 2002 by WESCO International, Inc. in favor of WESCO Real Estate IV, LLC.
Incorporated by reference to Exhibit 10.28 to WESCO’s Annual Report on Form 10-K for the year ended December 31, 2002
10.13 Amended and Restated Registration and Participation Agreement, dated as of June 5, 1998, among WESCO International, Inc. and certain security holders of WESCO International, Inc. named therein.
Incorporated by reference to Exhibit 10.19 to WESCO’s Registration Statement on Form S-4 (No. 333-43225)
10.14 Asset Purchase Agreement, dated as of September 11, 1998, among Bruckner Supply Company, Inc. and WESCO Distribution, Inc.
Incorporated by reference to Exhibit 2.01 to WESCO’s Current Report on Form 8-K, dated September 11, 1998
10.15 Amendment dated March 29, 2002 to Asset Purchase Agreement, dated as of September 11, 1998, among Bruckner Supply Company, Inc. and WESCO Distribution, Inc.
Incorporated by reference to Exhibit 10.25 to WESCO’s Annual Report on Form 10-K for the year ended December 31, 2002
10.16 Agreement and Plan of Merger, dated August 16, 2005, by and among Carlton-Bates Company, the shareholders of Carlton-Bates Company signatory thereto, the Company Representative (as defined therein), WESCO Distribution, Inc. and C-B WESCO, Inc.
Incorporated by reference to Exhibit 10.3 to WESCO’s Current Report on Form 8-K, dated September 28, 2005
10.17 Agreement and Plan of Merger, dated October 2, 2006, by and among WESCO Distribution, Inc., WESCO Voltage, Inc., Communications Supply Holdings, Inc. and Harvest Partners, LLC, as Shareholders’ Representative.
Incorporated by reference to Exhibit 2.1 to WESCO’s Current Report on Form 8-K, dated November 8, 2006
10.18 Third Amended and Restated Receivables Purchase Agreement, dated as of April 13, 2009, by and among WESCO Receivables Corp., WESCO Distribution, Inc., the Purchasers and Purchaser Agents party thereto and PNC Bank, National Association (as successor to Wachovia Capital Markets, LLC), as Administrator.
Incorporated by reference to Exhibit 10.1 to WESCO’s Current Report on Form 8-K, dated April 13, 2009
10.19 First Amendment to the Third Amended and Restated Receivables Purchase Agreement, dated as of August 31, 2009.
Incorporated by reference to Exhibit 10.4 to WESCO’s Quarterly Report on Form 10-Q for the quarter ended September 30, 2009
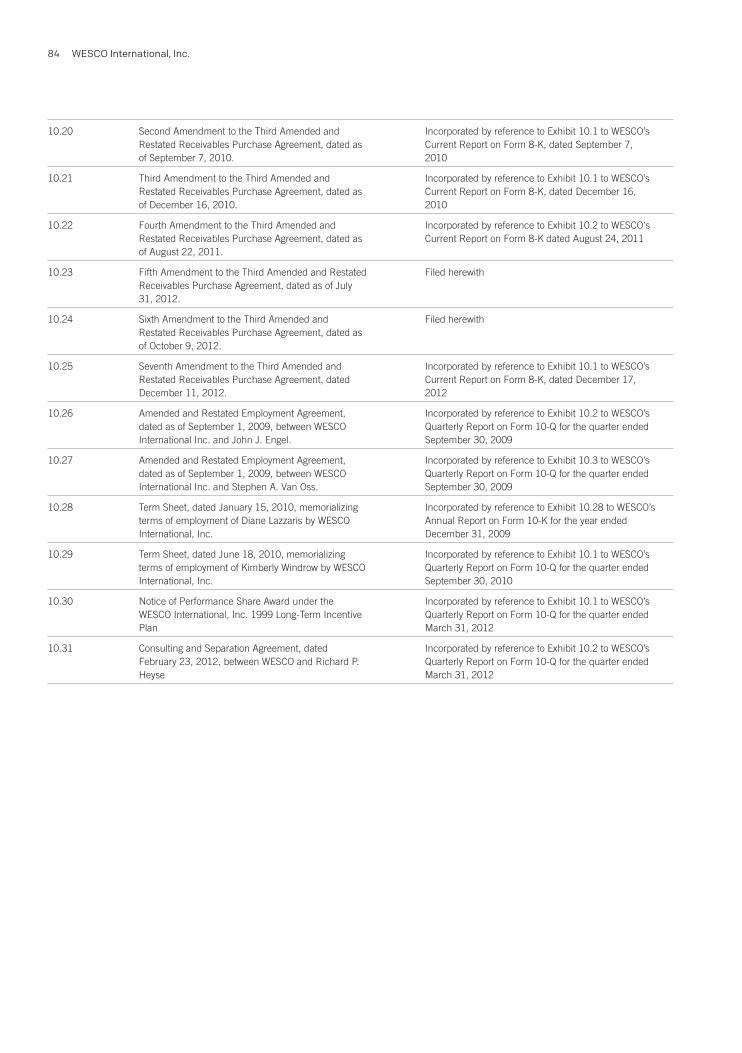
WESCO International, Inc.84
10.20 Second Amendment to the Third Amended and Restated Receivables Purchase Agreement, dated as of September 7, 2010.
Incorporated by reference to Exhibit 10.1 to WESCO’s Current Report on Form 8-K, dated September 7, 2010
10.21 Third Amendment to the Third Amended and Restated Receivables Purchase Agreement, dated as of December 16, 2010.
Incorporated by reference to Exhibit 10.1 to WESCO’s Current Report on Form 8-K, dated December 16, 2010
10.22 Fourth Amendment to the Third Amended and Restated Receivables Purchase Agreement, dated as of August 22, 2011.
Incorporated by reference to Exhibit 10.2 to WESCO's Current Report on Form 8-K dated August 24, 2011
10.23 Fifth Amendment to the Third Amended and Restated Receivables Purchase Agreement, dated as of July 31, 2012.
Filed herewith
10.24 Sixth Amendment to the Third Amended and Restated Receivables Purchase Agreement, dated as of October 9, 2012.
Filed herewith
10.25 Seventh Amendment to the Third Amended and Restated Receivables Purchase Agreement, dated December 11, 2012.
Incorporated by reference to Exhibit 10.1 to WESCO’s Current Report on Form 8-K, dated December 17, 2012
10.26 Amended and Restated Employment Agreement, dated as of September 1, 2009, between WESCO International Inc. and John J. Engel.
Incorporated by reference to Exhibit 10.2 to WESCO’s Quarterly Report on Form 10-Q for the quarter ended September 30, 2009
10.27 Amended and Restated Employment Agreement, dated as of September 1, 2009, between WESCO International Inc. and Stephen A. Van Oss.
Incorporated by reference to Exhibit 10.3 to WESCO’s Quarterly Report on Form 10-Q for the quarter ended September 30, 2009
10.28 Term Sheet, dated January 15, 2010, memorializing terms of employment of Diane Lazzaris by WESCO International, Inc.
Incorporated by reference to Exhibit 10.28 to WESCO’s Annual Report on Form 10-K for the year ended December 31, 2009
10.29 Term Sheet, dated June 18, 2010, memorializing terms of employment of Kimberly Windrow by WESCO International, Inc.
Incorporated by reference to Exhibit 10.1 to WESCO’s Quarterly Report on Form 10-Q for the quarter ended September 30, 2010
10.30 Notice of Performance Share Award under the WESCO International, Inc. 1999 Long-Term Incentive Plan
Incorporated by reference to Exhibit 10.1 to WESCO’s Quarterly Report on Form 10-Q for the quarter ended March 31, 2012
10.31 Consulting and Separation Agreement, dated February 23, 2012, between WESCO and Richard P. Heyse
Incorporated by reference to Exhibit 10.2 to WESCO’s Quarterly Report on Form 10-Q for the quarter ended March 31, 2012
2012 Annual Report 85
10.32 Term Sheet, dated May 24, 2012, memorializing terms of employment of Kenneth Parks by WESCO International, Inc.
Incorporated by reference to Exhibit 10.1 to WESCO's Quarterly Report on Form 10-Q for the quarter ended June 30, 2012
10.33 Term Loan agreement, dated as of December 12, 2012 among WESCO Distribution, Inc., WDCC Enterprises Inc., WESCO International, Inc., Credit Suisse AG, Cayman Island Branch, as Administrative Agent and Collateral Agent and the other Lenders and Agents party thereto
Incorporated by reference to Exhibit 10.1 to WESCO's Current Report on Form 8-K, dated December 17, 2012
21.1 Subsidiaries of WESCO. Filed herewith
23.1 Consent of PricewaterhouseCoopers LLP. Filed herewith
31.1 Certification of Chief Executive Officer pursuant to Rule 13a-14(a) promulgated under the Exchange Act.
Filed herewith
31.2 Certification of Chief Financial Officer pursuant to Rule 13a-14(a) promulgated under the Exchange Act.
Filed herewith
32.1 Certification of Chief Executive Officer pursuant to Section 906 of the Sarbanes-Oxley Act of 2002.
Filed herewith
32.2 Certification of Chief Financial Officer pursuant to Section 906 of the Sarbanes-Oxley Act of 2002.
Filed herewith
101 Interactive Data File* Filed herewith
* In with accordance with Rule 406T of Regulation S-T promulgated by the Securities and Exchange Commission, Exhibit 101 is deemed not filed or part of a registration statement or prospectus for purposes of Sections 11 or 12 of the Securities Act of 1933, is deemed not filed for purposes of Section 18 of the Securities Exchange Act of 1934, and otherwise is not subject to liability under these sections.
The registrant hereby agrees to furnish supplementally to the Commission, upon request, a copy of any omitted schedule to any of the agreements contained herein.
Copies of exhibits may be retrieved electronically at the Securities and Exchange Commission’s home page at www.sec.gov. Exhibits will also be furnished without charge by writing to Kenneth S. Parks, Vice President and Chief Financial Officer, 225 West Station Square Drive, Suite 700, Pittsburgh, Pennsylvania 15219. Requests may also be directed to (412) 454-2200.
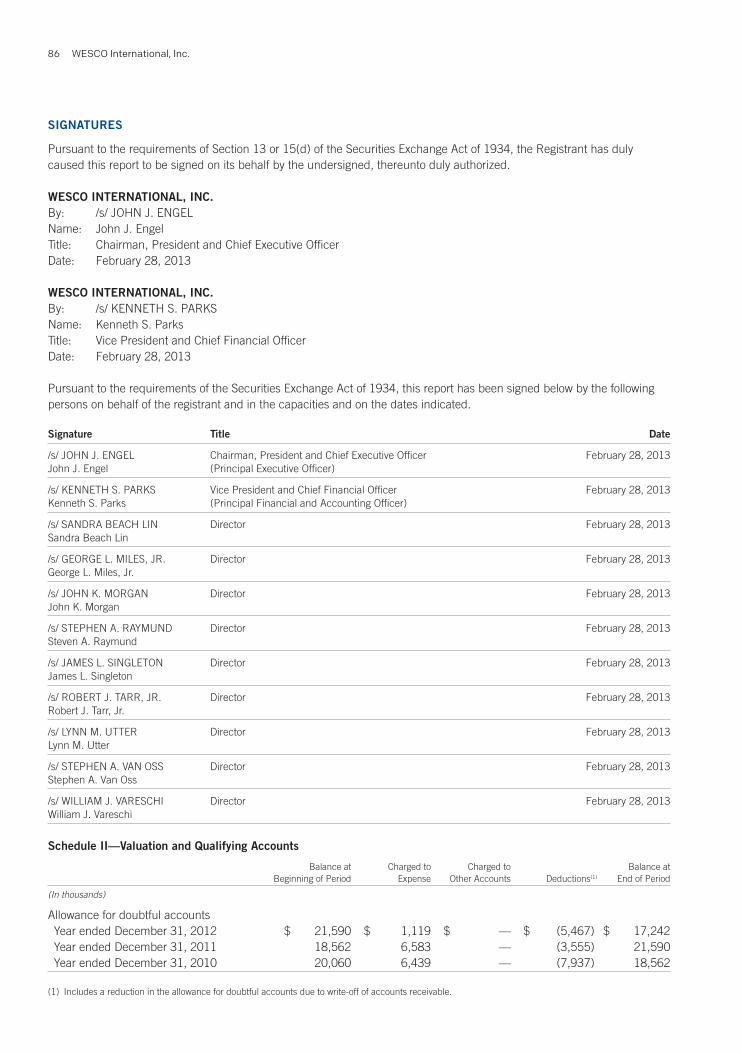
WESCO International, Inc.86
SIGNATURES
Pursuant to the requirements of Section 13 or 15(d) of the Securities Exchange Act of 1934, the Registrant has duly caused this report to be signed on its behalf by the undersigned, thereunto duly authorized.
WESCO INTERNATIONAL, INC.By: /s/ JOHN J. ENGEL Name: John J. Engel Title: Chairman, President and Chief Executive Officer Date: February 28, 2013
WESCO INTERNATIONAL, INC.By: /s/ KENNETH S. PARKS Name: Kenneth S. Parks Title: Vice President and Chief Financial Officer Date: February 28, 2013
Pursuant to the requirements of the Securities Exchange Act of 1934, this report has been signed below by the following persons on behalf of the registrant and in the capacities and on the dates indicated.
Signature Title Date
/s/ JOHN J. ENGEL Chairman, President and Chief Executive Officer February 28, 2013 John J. Engel (Principal Executive Officer)
/s/ KENNETH S. PARKS Vice President and Chief Financial Officer February 28, 2013 Kenneth S. Parks (Principal Financial and Accounting Officer)
/s/ SANDRA BEACH LIN Director February 28, 2013 Sandra Beach Lin
/s/ GEORGE L. MILES, JR. Director February 28, 2013 George L. Miles, Jr.
/s/ JOHN K. MORGAN Director February 28, 2013 John K. Morgan
/s/ STEPHEN A. RAYMUND Director February 28, 2013 Steven A. Raymund
/s/ JAMES L. SINGLETON Director February 28, 2013 James L. Singleton
/s/ ROBERT J. TARR, JR. Director February 28, 2013 Robert J. Tarr, Jr.
/s/ LYNN M. UTTER Director February 28, 2013 Lynn M. Utter
/s/ STEPHEN A. VAN OSS Director February 28, 2013 Stephen A. Van Oss
/s/ WILLIAM J. VARESCHI Director February 28, 2013 William J. Vareschi
Schedule II—Valuation and Qualifying Accounts
Balance at Charged to Charged to Balance at Beginning of Period Expense Other Accounts Deductions(1) End of Period
(In thousands)
Allowance for doubtful accounts Year ended December 31, 2012 $ 21,590 $ 1,119 $ — $ (5,467) $ 17,242 Year ended December 31, 2011 18,562 6,583 — (3,555) 21,590 Year ended December 31, 2010 20,060 6,439 — (7,937) 18,562
(1) Includes a reduction in the allowance for doubtful accounts due to write-off of accounts receivable.
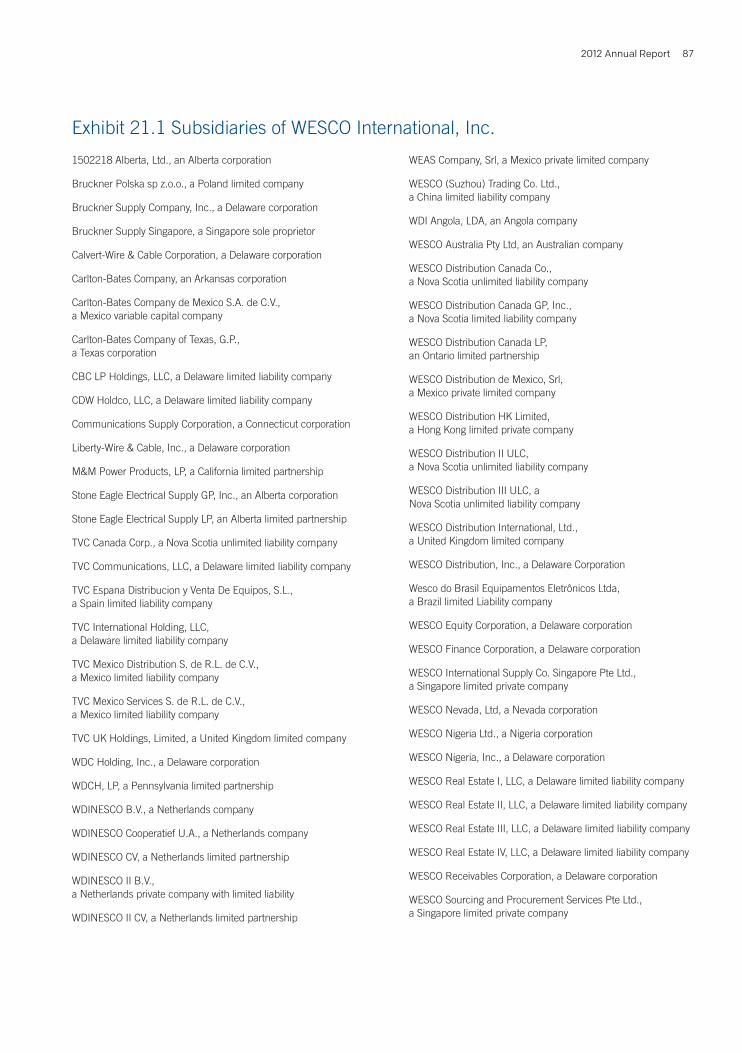
2012 Annual Report 87
Exhibit 21.1 Subsidiaries of WESCO International, Inc.
1502218 Alberta, Ltd., an Alberta corporation
Bruckner Polska sp z.o.o., a Poland limited company
Bruckner Supply Company, Inc., a Delaware corporation
Bruckner Supply Singapore, a Singapore sole proprietor
Calvert-Wire & Cable Corporation, a Delaware corporation
Carlton-Bates Company, an Arkansas corporation
Carlton-Bates Company de Mexico S.A. de C.V., a Mexico variable capital company
Carlton-Bates Company of Texas, G.P., a Texas corporation
CBC LP Holdings, LLC, a Delaware limited liability company
CDW Holdco, LLC, a Delaware limited liability company
Communications Supply Corporation, a Connecticut corporation
Liberty-Wire & Cable, Inc., a Delaware corporation
M&M Power Products, LP, a California limited partnership
Stone Eagle Electrical Supply GP, Inc., an Alberta corporation
Stone Eagle Electrical Supply LP, an Alberta limited partnership
TVC Canada Corp., a Nova Scotia unlimited liability company
TVC Communications, LLC, a Delaware limited liability company
TVC Espana Distribucion y Venta De Equipos, S.L., a Spain limited liability company
TVC International Holding, LLC, a Delaware limited liability company
TVC Mexico Distribution S. de R.L. de C.V., a Mexico limited liability company
TVC Mexico Services S. de R.L. de C.V., a Mexico limited liability company
TVC UK Holdings, Limited, a United Kingdom limited company
WDC Holding, Inc., a Delaware corporation
WDCH, LP, a Pennsylvania limited partnership
WDINESCO B.V., a Netherlands company
WDINESCO Cooperatief U.A., a Netherlands company
WDINESCO CV, a Netherlands limited partnership
WDINESCO II B.V., a Netherlands private company with limited liability
WDINESCO II CV, a Netherlands limited partnership
WEAS Company, Srl, a Mexico private limited company
WESCO (Suzhou) Trading Co. Ltd., a China limited liability company
WDI Angola, LDA, an Angola company
WESCO Australia Pty Ltd, an Australian company
WESCO Distribution Canada Co., a Nova Scotia unlimited liability company
WESCO Distribution Canada GP, Inc., a Nova Scotia limited liability company
WESCO Distribution Canada LP, an Ontario limited partnership
WESCO Distribution de Mexico, Srl, a Mexico private limited company
WESCO Distribution HK Limited, a Hong Kong limited private company
WESCO Distribution II ULC, a Nova Scotia unlimited liability company
WESCO Distribution III ULC, a Nova Scotia unlimited liability company
WESCO Distribution International, Ltd., a United Kingdom limited company
WESCO Distribution, Inc., a Delaware Corporation
Wesco do Brasil Equipamentos Eletrônicos Ltda, a Brazil limited Liability company
WESCO Equity Corporation, a Delaware corporation
WESCO Finance Corporation, a Delaware corporation
WESCO International Supply Co. Singapore Pte Ltd., a Singapore limited private company
WESCO Nevada, Ltd, a Nevada corporation
WESCO Nigeria Ltd., a Nigeria corporation
WESCO Nigeria, Inc., a Delaware corporation
WESCO Real Estate I, LLC, a Delaware limited liability company
WESCO Real Estate II, LLC, a Delaware limited liability company
WESCO Real Estate III, LLC, a Delaware limited liability company
WESCO Real Estate IV, LLC, a Delaware limited liability company
WESCO Receivables Corporation, a Delaware corporation
WESCO Sourcing and Procurement Services Pte Ltd., a Singapore limited private company

WESCO International, Inc.88
Exhibit 23.1. Consent of Independent Registered Public Accounting Firm
We hereby consent to the incorporation by reference in the Registration Statements on Form S-8 (No’s. 333-81857, 333-81847, 333-81845, 333-81841, 333-91187 and 333-172531) of WESCO International, Inc. of our report dated February 27, 2013 relating to the financial statements, financial statement schedule and the effectiveness of internal control over financial reporting, which appears in this Form 10-K.
/s/ PricewaterhouseCoopers LLP Pittsburgh, Pennsylvania February 28, 2013
2012 Annual Report 89
Exhibit 31.1. Certification
I, John J. Engel, certify that:
1. I have reviewed this annual report on Form 10-K of WESCO International, Inc.;
2. Based on my knowledge, this report does not contain any untrue statement of a material fact or omit to state a material fact necessary to make the statements made, in light of the circumstances under which such statements were made, not misleading with respect to the period covered by this report;
3. Based on my knowledge, the financial statements, and other financial information included in this report, fairly present in all material respects the financial condition, results of operations and cash flows of the registrant as of, and for, the periods presented in this report;
4. The registrant’s other certifying officer(s) and I are responsible for establishing and maintaining disclosure controls and procedures (as defined in Exchange Act Rules 13a-15(e) and 15d-15(e)) and internal control over financial reporting (as defined in Exchange Act Rules 13a-15(f) and 15d-15(f)) for the registrant and have:
(a) Designed such disclosure controls and procedures, or caused such disclosure controls and procedures to be designed under our supervision, to ensure that material information relating to the registrant, including its consolidated subsidiaries, is made known to us by others within those entities, particularly during the period in which this report is being prepared;
(b) Designed such internal control over financial reporting, or caused such internal control over financial reporting to be designed under our supervision, to provide reasonable assurance regarding the reliability of financial reporting and the preparation of financial statements for external purposes in accordance with generally accepted accounting principles;
(c) Evaluated the effectiveness of the registrant’s disclosure controls and procedures and presented in this report our conclusions about the effectiveness of the disclosure controls and procedures, as of the end of the period covered by this report based on such evaluation; and
(d) Disclosed in this report any change in the registrant’s internal control over financial reporting that occurred during the registrant’s most recent fiscal quarter (the registrant’s fourth fiscal quarter in the case of an annual report) that has materially affected, or is reasonably likely to materially affect, the registrant’s internal control over financial reporting; and
5. The registrant’s other certifying officer(s) and I have disclosed, based on our most recent evaluation of internal control over financial reporting, to the registrant’s auditors and the audit committee of the registrant’s board of directors (or persons performing the equivalent functions):
(a) All significant deficiencies and material weaknesses in the design or operation of internal control over financial reporting which are reasonably likely to adversely affect the registrant’s ability to record, process, summarize and report financial information; and
(b) Any fraud, whether or not material, that involves management or other employees who have a significant role in the registrant’s internal control over financial reporting.
Date: February 28, 2013
By: /s/ John J. Engel John J. Engel Chairman, President and Chief Executive Officer
WESCO International, Inc.90
Exhibit 31.2. Certification
I, Kenneth S. Parks, certify that:
1. I have reviewed this annual report on Form 10-K of WESCO International, Inc.;
2. Based on my knowledge, this report does not contain any untrue statement of a material fact or omit to state a material fact necessary to make the statements made, in light of the circumstances under which such statements were made, not misleading with respect to the period covered by this report;
3. Based on my knowledge, the financial statements, and other financial information included in this report, fairly present in all material respects the financial condition, results of operations and cash flows of the registrant as of, and for, the periods presented in this report;
4. The registrant’s other certifying officer(s) and I are responsible for establishing and maintaining disclosure controls and procedures (as defined in Exchange Act Rules 13a-15(e) and 15d-15(e)) and internal control over financial reporting (as defined in Exchange Act Rules 13a-15(f) and 15d-15(f)) for the registrant and have:
(a) Designed such disclosure controls and procedures, or caused such disclosure controls and procedures to be designed under our supervision, to ensure that material information relating to the registrant, including its consolidated subsidiaries, is made known to us by others within those entities, particularly during the period in which this report is being prepared;
(b) Designed such internal control over financial reporting, or caused such internal control over financial reporting to be designed under our supervision, to provide reasonable assurance regarding the reliability of financial reporting and the preparation of financial statements for external purposes in accordance with generally accepted accounting principles;
(c) Evaluated the effectiveness of the registrant’s disclosure controls and procedures and presented in this report our conclusions about the effectiveness of the disclosure controls and procedures, as of the end of the period covered by this report based on such evaluation; and
(d) Disclosed in this report any change in the registrant’s internal control over financial reporting that occurred during the registrant’s most recent fiscal quarter (the registrant’s fourth fiscal quarter in the case of an annual report) that has materially affected, or is reasonably likely to materially affect, the registrant’s internal control over financial reporting; and
5. The registrant’s other certifying officer(s) and I have disclosed, based on our most recent evaluation of internal control over financial reporting, to the registrant’s auditors and the audit committee of the registrant’s board of directors (or persons performing the equivalent functions):
(a) All significant deficiencies and material weaknesses in the design or operation of internal control over financial reporting which are reasonably likely to adversely affect the registrant’s ability to record, process, summarize and report financial information; and
(b) Any fraud, whether or not material, that involves management or other employees who have a significant role in the registrant’s internal control over financial reporting.
Date: February 28, 2013
By: /s/ Kenneth S. Parks Kenneth S. Parks Vice President and Chief Financial Officer
2012 Annual Report 91
Exhibit 32.1. Certification Pursuant to 18 U.S.C. Section 1350 as Adopted Pursuant to Section 906 of the Sarbanes-Oxley Act of 2002
In connection with the Annual Report of WESCO International, Inc. (the “Company”) on Form 10-K for the period ended December 31, 2012 as filed with the Securities and Exchange Commission on the date hereof (the “Report”), the undersigned, in the capacity and on the date indicated below, hereby certifies pursuant to 18 U.S.C. Section 1350, as adopted pursuant to Section 906 of the Sarbanes-Oxley Act of 2002, that to his knowledge:
1. The Report fully complies with the requirements of Section 13(a) or 15(d) of the Securities Exchange Act of 1934; and
2. The information contained in the Report fairly presents, in all material respects, the financial condition and results of operation of the Company.
Date: February 28, 2013
By: /s/ John J. Engel John J. Engel Chairman, President and Chief Executive Officer
Exhibit 32.2. Certification Pursuant to 18 U.S.C. Section 1350 as Adopted Pursuant to Section 906 of the Sarbanes-Oxley Act of 2002
In connection with the Annual Report of WESCO International, Inc. (the “Company”) on Form 10-K for the period ended December 31, 2012 as filed with the Securities and Exchange Commission on the date hereof (the “Report”), the undersigned, in the capacity and on the date indicated below, hereby certifies pursuant to 18 U.S.C. Section 1350, as adopted pursuant to Section 906 of the Sarbanes-Oxley Act of 2002, that to his knowledge:
1. The Report fully complies with the requirements of Section 13(a) or 15(d) of the Securities Exchange Act of 1934; and
2. The information contained in the Report fairly presents, in all material respects, the financial condition and results of operation of the Company.
Date: February 28, 2013
By: /s/ Kenneth S. Parks Kenneth S. Parks Vice President and Chief Financial Officer
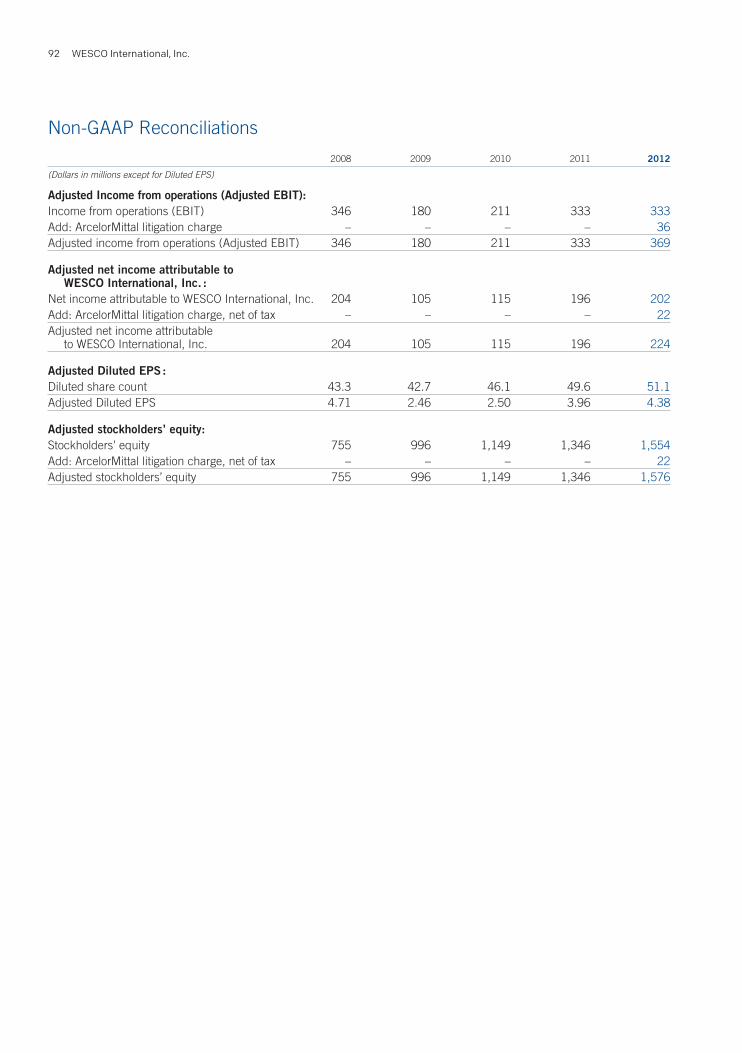
WESCO International, Inc.92
Non-GAAP Reconciliations
2008 2009 2010 2011 2012
(Dollars in millions except for Diluted EPS)
Adjusted Income from operations (Adjusted EBIT): Income from operations (EBIT) 346 180 211 333 333Add: ArcelorMittal litigation charge – – – – 36Adjusted income from operations (Adjusted EBIT) 346 180 211 333 369
Adjusted net income attributable to WESCO International, Inc. :Net income attributable to WESCO International, Inc. 204 105 115 196 202Add: ArcelorMittal litigation charge, net of tax – – – – 22Adjusted net income attributable to WESCO International, Inc. 204 105 115 196 224
Adjusted Diluted EPS :Diluted share count 43.3 42.7 46.1 49.6 51.1Adjusted Diluted EPS 4.71 2.46 2.50 3.96 4.38
Adjusted stockholders’ equity:Stockholders’ equity 755 996 1,149 1,346 1,554Add: ArcelorMittal litigation charge, net of tax – – – – 22Adjusted stockholders’ equity 755 996 1,149 1,346 1,576
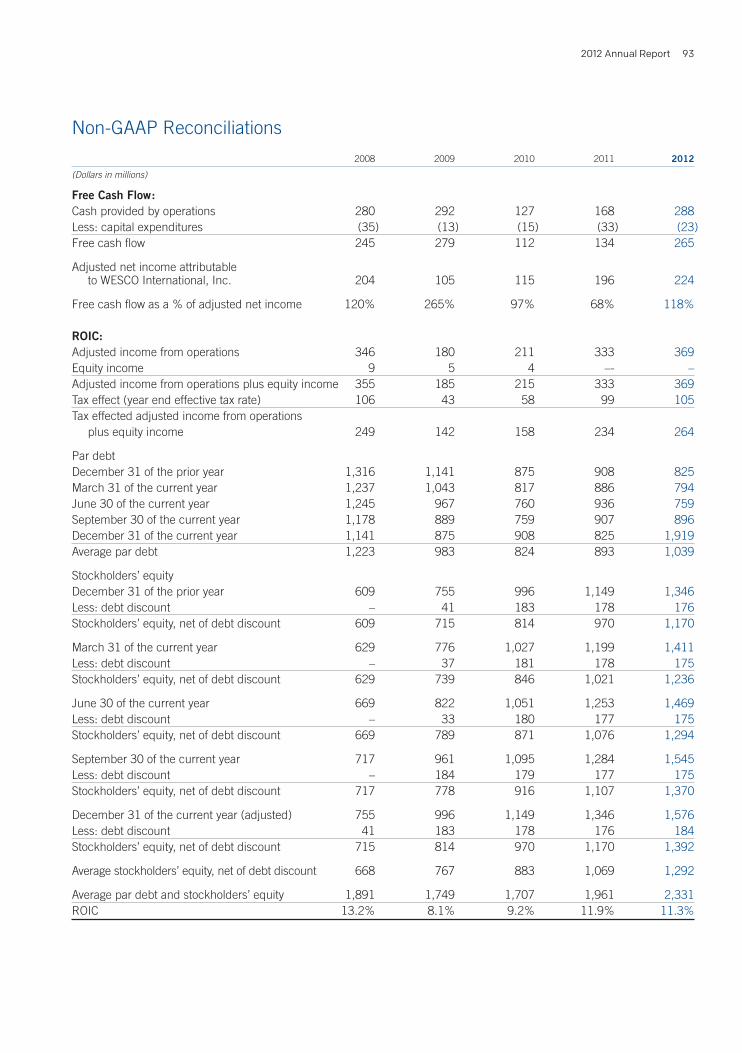
2012 Annual Report 93
Non-GAAP Reconciliations
2008 2009 2010 2011 2012
(Dollars in millions)
Free Cash Flow :Cash provided by operations 280 292 127 168 288 Less: capital expenditures (35) (13) (15) (33) (23)Free cash flow 245 279 112 134 265
Adjusted net income attributable to WESCO International, Inc. 204 105 115 196 224
Free cash flow as a % of adjusted net income 120% 265% 97% 68% 118%
ROIC: Adjusted income from operations 346 180 211 333 369 Equity income 9 5 4 –- – Adjusted income from operations plus equity income 355 185 215 333 369 Tax effect (year end effective tax rate) 106 43 58 99 105 Tax effected adjusted income from operations plus equity income 249 142 158 234 264
Par debt December 31 of the prior year 1,316 1,141 875 908 825 March 31 of the current year 1,237 1,043 817 886 794 June 30 of the current year 1,245 967 760 936 759 September 30 of the current year 1,178 889 759 907 896 December 31 of the current year 1,141 875 908 825 1,919 Average par debt 1,223 983 824 893 1,039
Stockholders’ equity December 31 of the prior year 609 755 996 1,149 1,346 Less: debt discount – 41 183 178 176 Stockholders’ equity, net of debt discount 609 715 814 970 1,170
March 31 of the current year 629 776 1,027 1,199 1,411 Less: debt discount – 37 181 178 175 Stockholders’ equity, net of debt discount 629 739 846 1,021 1,236
June 30 of the current year 669 822 1,051 1,253 1,469 Less: debt discount – 33 180 177 175 Stockholders’ equity, net of debt discount 669 789 871 1,076 1,294
September 30 of the current year 717 961 1,095 1,284 1,545 Less: debt discount – 184 179 177 175 Stockholders’ equity, net of debt discount 717 778 916 1,107 1,370
December 31 of the current year (adjusted) 755 996 1,149 1,346 1,576 Less: debt discount 41 183 178 176 184 Stockholders’ equity, net of debt discount 715 814 970 1,170 1,392
Average stockholders’ equity, net of debt discount 668 767 883 1,069 1,292 Average par debt and stockholders’ equity 1,891 1,749 1,707 1,961 2,331 ROIC 13.2% 8.1% 9.2% 11.9% 11.3%

WESCO International, Inc.94
Corporate Headquarters
WESCO International, Inc.
Suite 700
225 West Station Square Drive
Pittsburgh, PA 15219-1122
Phone: 412-454-2200
www.wesco.com
Investor Relations
For questions regarding WESCO, contact Daniel A. Brailer,
Vice President, Investor Relations and Corporate Affairs,
at [email protected]. A copy of the Company’s
Annual Report on Form 10-K or other financial information
may be requested through our website (www.wesco.com)
or by contacting Investor Relations.
Common Stock
WESCO International, Inc. is listed on the New York Stock
Exchange under the ticker symbol WCC.
Annual Meeting
The Annual Meeting of stockholders will be held on
May 30, 2013, at 2:00 p.m., E.D.T., at:
Sheraton Station Square
300 West Station Square Drive
Pittsburgh, PA 15219
Transfer Agent and Registrar
Computershare
P.O. Box 43006
Providence, RI 02940-3006
Toll free: 877-264-3927
TDD for Hearing Impaired: 800-231-5469
Foreign Shareholders: 201-680-6578
TDD Foreign Shareholders: 201-680-6610
Website address: www.computershare.com/investor
Independent Registered Public Accounting Firm
PricewaterhouseCoopers LLP
Pittsburgh, PA
Certifications to the NYSE and the SEC
On June 11, 2012, the Company submitted its CEO
Certification to the NYSE under NYSE Rule 303A.12(a).
Also, any CEO/CFO certifications required to be filed
with the SEC, including the Section 302 certifications,
are filed by the Company as exhibits to its Annual Report
on Form 10-K.
An online version of the Annual Report is available
at www.wesco.com
Airgas, Inc.
Anixter International, Inc.
Applied Industrial Technologies
Arrow Electronics, Inc.
Avnet, Inc.
Beacon Roofing Supply, Inc.
Danaher Corporation
Eaton Corporation Plc
Emerson Electric Co.
Fastenal Company
Genuine Parts Company
Houston Wire & Cable Company
Hubbell Incorporated
Ingram Micro Inc.
MSC Industrial Direct Co., Inc.
Pool Corporation
Rockwell Automation Inc.
Tech Data Corporation
United Stationers Inc.
W.W. Grainger, Inc.
Watsco, Inc.
Performance Peer Group

CORPORATE GOVERNANCE
(left to right)
Stephen A. Van Oss Senior Vice President and Chief Operating Officer WESCO International, Inc.
William J. Vareschi Former Chief Executive Officer Central Parking Corporation
Sandra Beach Lin Former, Chief Executive Officer Calisolar, Inc.
George L. Miles, Jr. Chairman Emeritus Chester Engineers, Inc.
John J. Engel Chairman, President and Chief Executive Officer WESCO International, Inc.
John K. Morgan Chairman, President and Chief Executive Officer Zep, Inc.
Robert J. Tarr, Jr. Professional Director and Private Investor
James L. Singleton Vice Chairman Cürex Group Holdings, LLC
Lynn M. Utter President and Chief Operating Officer Knoll Office
Steven A. Raymund Chairman Tech Data Corporation
Class I: Term expires 2015 John J. Engel Steven A. Raymund Lynn M. Utter William J. Vareschi
Class II: Term expires 2013 Sandra Beach Lin Robert J. Tarr, Jr. Stephen A. Van Oss
Class III: Term expires 2014 George L. Miles, Jr. John K. Morgan James L. Singleton
BOARD OF DIRECTORS EXECUTIVE OFFICERS
(as of April 1, 2013)
John J. Engel Chairman, President and Chief Executive Officer
Stephen A. Van Oss Senior Vice President and Chief Operating Officer
Kenneth S. Parks Vice President and Chief Financial Officer
Daniel A. Brailer Vice President, Investor Relations and Corporate Affairs
Allan A. Duganier Director, Internal Audit
Timothy A. Hibbard Vice President and Corporate Controller
Diane E. Lazzaris Vice President, Legal Affairs
Kimberly G. Windrow Vice President, Human Resources
© Copyright by WESCO 2013– 2014. All rights reserved.
PRINTED ON PAPER CONTAINING 30% POST-CONSUMER WASTE FIBER
WESCO International, Inc.
Suite 700 225 West Station Square Drive Pittsburgh, Pennsylvania 15219-1122 Phone: 412-454-2200 www.wesco.com