learning algorithms with unified and interactive web … · learning algorithms with unified and...
TRANSCRIPT

Olympiads in Informatics, 2012, Vol. 6, 53–68 53© 2012 Vilnius University
Learning Algorithms with Unifiedand Interactive Web-Based Visualization
Steven HALIM, Zi Chun KOH, Victor Bo Huai LOH, Felix HALIMSchool of Computing, National University of SingaporeComputing 1, 13 Computing Drive, 117417, Singaporee-mail: {dcssh, zichun, u0805026, felix.halim} @ nus.edu.sg
Abstract. We present a unified and interactive web-based visualization of various classical andnon-classical algorithms athttp://www.comp.nus.edu.sg/∼stevenha/visualization.Our collection of algorithm visualizations has the following advantages over many other web-
based algorithm visualizations in the Internet – (1) it has visualizations of various non-classicalalgorithms that currently cannot be found elsewhere in the Internet; (2) it is interactive; users (usu-ally students) can enter their own input data to test the behavior of the algorithm; (3) it has aconsistent user interface across different algorithm visualizations that are currently available; (4)it is built with HTML5 making it accessible on modern portable PCs including tablets and smart-phones. User studies in two algorithm classes in NUS show that our visualizations is of immensehelp to some students who prefer to learn visually.
Key words: unified, interactive, algorithm, visualization.
1. Introduction
To teach data structures and algorithms (henceforth referred to as algorithms) in a typicalComputer Science class, a professor/lecturer/instructor/teacher (henceforth referred to asteacher) has to illustrate at least one (and preferably several) working example(s) on howa particular algorithm works. The typical teaching methods employed are as follows:
1. The examples are pre-scripted in printed handouts, textbooks, or in PowerPoint(or equivalent presentation software) slides with a collection of static pictures/diagrams. A slightly better approach is to use a hardcoded presentation with ani-mations that clearly demonstrates the steps of the algorithm. One drawback of thisapproach is that it is possible for the teacher to advance the animation too quickly.Also, it is difficult for the teacher to show another example that was not hardcodedor to demonstrate spontaneous examples asked by the students; the teacher has toeither draw it directly on the PowerPoint slide manually (using the mouse or astylus pen) or to draw the example on the board by hand (method 2).
2. The teacher hand-draws the examples on the board. Unlike PowerPoint where theteacher can advance to the next slide rapidly, this hand-drawing method allows thestudents to assimilate the steps taken by the algorithm in proper “human (student)
54 S. Halim et al.
pace” as drawing successive steps of the algorithm may take some time. However,the drawback is that such manual drawing can be very time consuming if not ex-ecuted/prepared properly. It is also error-prone if the algorithm is complex or ifthe teacher is in a rush. Students have to not only understand the algorithm but alsocopy the teacher’s examples into their notes in order to review the illustrations later.The conflicting task to internalize the algorithm and copy the examples manuallyis exacerbated if the lesson is not recorded.
3. The teacher simply points the students to certain existing websites (usually createdby independent developers) with some algorithm animations. Some of these web-sites are effective tools for teaching algorithms, as will be elaborated in Section 2below. However, this method has drawbacks: most of these websites only supporta few classical algorithm visualizations. Thus, if the teacher refers to one websitefor one algorithm and different website for another, the students may be confusedby the different conventions and styles employed. The diversity of the various userinterfaces adopted by these websites adds another layer of learning curve for thestudent. Some students have certain inertia that reduces their will to visit manydifferent links. Also, this method cannot be used if the teacher is teaching a rare,non-classical algorithm that nobody has visualized before.
In our opinion, a better way to teach algorithms is to give a combination of a well-chosen and scripted example with animation (to introduce the concept for the first time)combined with two-or-three more examples on student-supplied input data. There aretwo conditions for this approach to be effective – the visualization of the spontaneousexamples must be animated in a manner that is consistent and bug-free, and it must bedone quickly and not take up too much time.
We made the decision to deliver our visualization on a web-based platform throughthe browser so that algorithmic knowledge is accessible to a larger pool of audienceworldwide. Almost every devices nowadays – desktops, laptops, tablets, and even smart-phones – have built-in web browser(s), e.g., Mozilla Firefox, Google Chrome, Safari1,etc., that support HTML5 natively. There is thus no need to install any program or worryabout cross-platform issue.
The choice of having interactive over static visualizations is for the students to gainmore in-depth understanding about the algorithm being visualized. We believe that thestudents will have better understanding on how the algorithm works if they can enter theinput data themselves.
With the rapidly increasing proliferation of portable devices with Internet connectiv-ity: laptops, tablets, and smartphones2, many students can access the web-based visual-ization during the lesson and follow the teacher’s examples on their own devices. Afterclass, students can then play around with the visualization again at their own pace/timeto further reinforce their understanding of the algorithm’s behavior.
1Safari is the default browser built-in on iPhone and iPad. This is worth mentioning because one of thefeatures of our visualization is its accessibility on modern devices.
2As an illustration, during the fourth quarter of 2011, Apple sold 17.07 million iPhones (smartphone)and 11.12 million iPads (tablet), www.apple.com/pr/library/2011/10/18Apple-Reports-Fourth-Quarter-Results.html, last accessed: April 2012.

Learning Algorithms with Unified and Interactive Web-Based Visualization 55
On the pedagogy side, having such visualizations will reduce the number of questionsin quizzes and exams that simply test students’ knowledge of how the algorithm willbehave given certain input data. Such questions are now redundant as the students areexpected to know how the algorithm works by using the visualization. Thus, the teachercan focus on testing on more advanced usages of the algorithms.
The choice of unified interface will also benefit the students. It is reasonable to expecta typical Computer Science class having more than one algorithm covered in the syllabus.By having a unified interface, students can expect similar look and feel when using dif-ferent algorithm visualizations. Also, the students can just bookmark one webpage anduse it for the entire semester. It is better than having a collection of different websitesto visit. The student need not have to navigate through the lecture slides or handouts toget to the URLs recommended by the teacher. Every extra inconvenience increases thestudent’s inertia and can be a possible cause for the student to be lazier and not bother tounderstand the algorithms properly.
This paper is organized as follows: In Section 2, we will detail and dissect the currentavailable web-based algorithm visualizations for the algorithms listed in “CompetitiveProgramming 2” (Halim and Halim, 2011). This competitive programming handbookis written by the first and the last authors of this paper. A substantial number of algo-rithms are discussed in that book, of which many do not have publicly available visualiza-tions yet. At the same time, we also discuss the weaknesses of the existing visualizationsthrough the lens of the objectives that we want to achieve, namely: provide visualizationsfor the non-classical algorithms, use unified interface, provide the ability to interactivelyenter user (student)-supplied input data, and provide the ability to access the visualiza-tion using modern web browsers particularly on smartphones. In Section 3, we discussthe details of our visualization project. In Section 4, we report the initial feedbacks from31 students in National University of Singapore (NUS) who used the first version ofthe visualizations during semester 2 of academic year 2011/2012. In Section 5, we listdown our preliminary conclusions regarding the effect of this visualization project. Weconclude this paper by listing down our plans to continually improve this visualizationproject in the near future.
2. Existing Web-Based Algorithm Visualization
In this section, we summarize the results of our analysis of various algorithm visualizationwebsites on the Internet as of April 2012. This report does not take into account algorithmvisualizations that are not publicly available in the Internet. The list of algorithms istaken from “Competitive Programming 2” handbook (Halim and Halim, 2011). Fromour analysis, we found that there is a huge imbalance on the number of visualizationsof classical – and usually easier – algorithms like sorting algorithms, binary search on asorted array etc., versus the non classical and rare (usually harder) algorithms like BinaryIndexed (Fenwick) Tree (Fenwick, 1994), finding Strongly Connected Components of adirected graph (Tarjan, 1972), computing the Maximum Flow of a network (Edmondsand Karp, 1972), etc.
56 S. Halim et al.
2.1. Standalone Visualizations
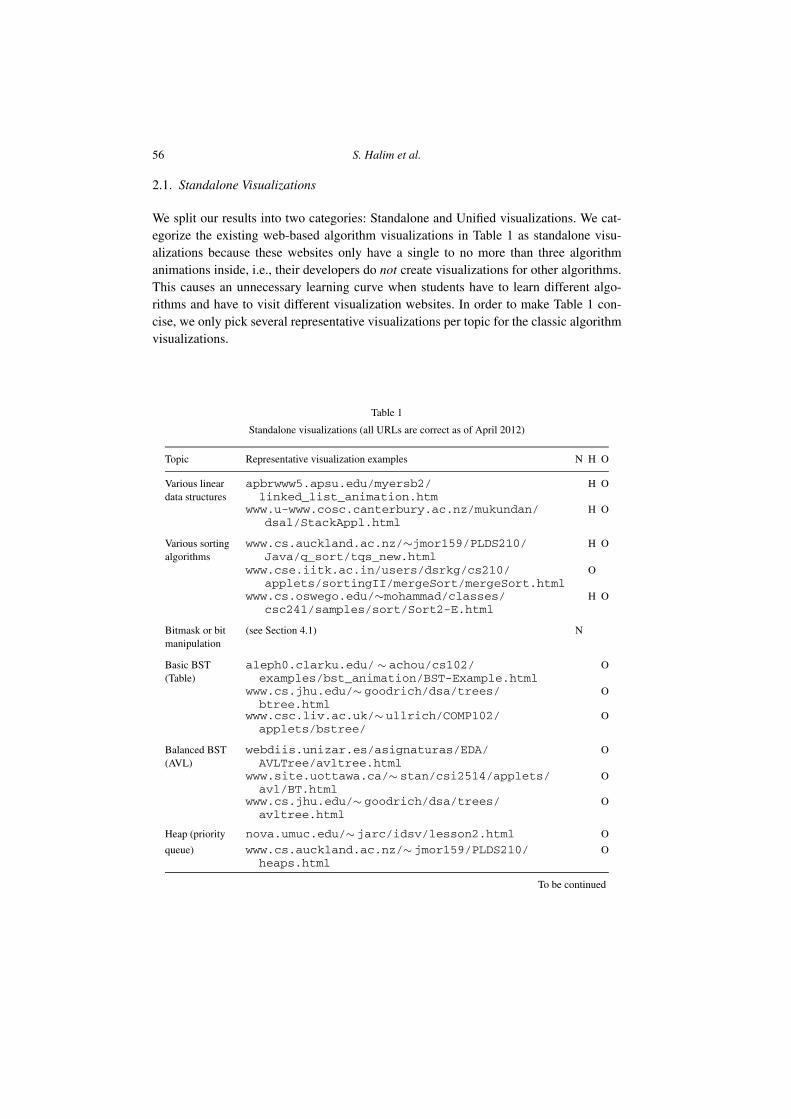
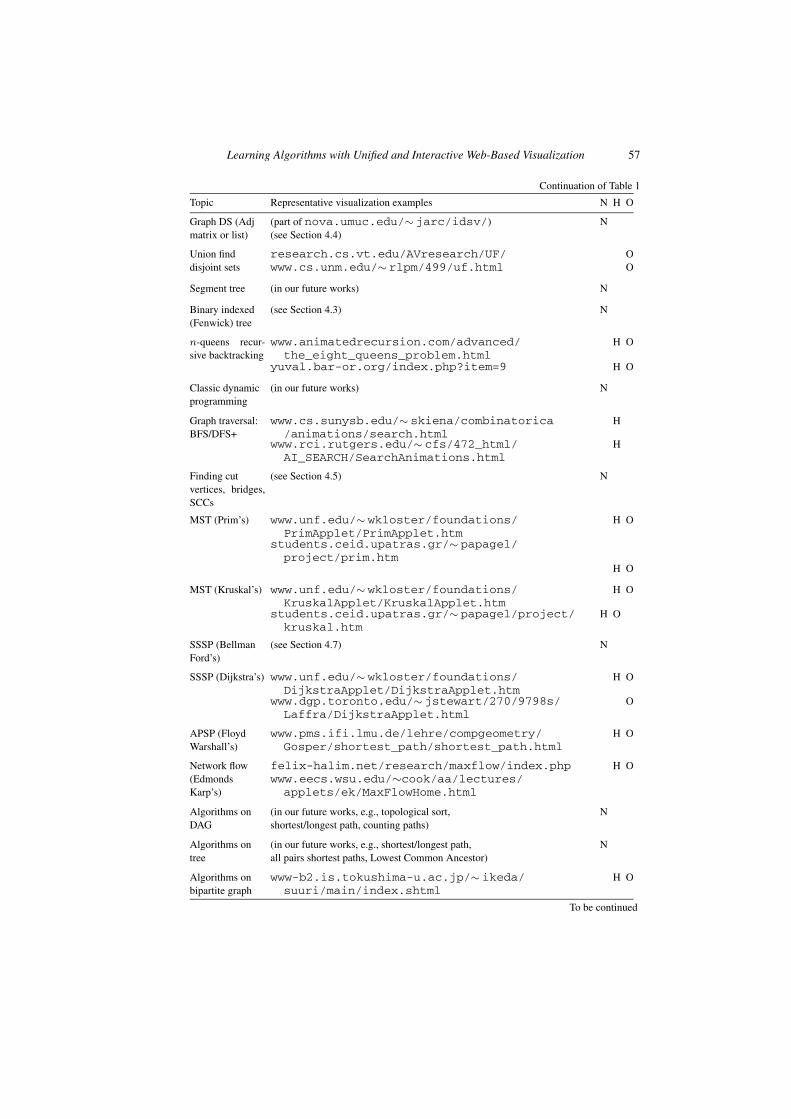
We split our results into two categories: Standalone and Unified visualizations. We cat-egorize the existing web-based algorithm visualizations in Table 1 as standalone visu-alizations because these websites only have a single to no more than three algorithmanimations inside, i.e., their developers do not create visualizations for other algorithms.This causes an unnecessary learning curve when students have to learn different algo-rithms and have to visit different visualization websites. In order to make Table 1 con-cise, we only pick several representative visualizations per topic for the classic algorithmvisualizations.
Table 1
Standalone visualizations (all URLs are correct as of April 2012)
Topic Representative visualization examples N H O
Various lineardata structures
apbrwww5.apsu.edu/myersb2/linked_list_animation.htm
H O
www.u-www.cosc.canterbury.ac.nz/mukundan/dsal/StackAppl.html
H O
Various sortingalgorithms
www.cs.auckland.ac.nz/∼jmor159/PLDS210/Java/q_sort/tqs_new.html
H O
www.cse.iitk.ac.in/users/dsrkg/cs210/applets/sortingII/mergeSort/mergeSort.html
O
www.cs.oswego.edu/∼mohammad/classes/csc241/samples/sort/Sort2-E.html
H O
Bitmask or bitmanipulation
(see Section 4.1) N
Basic BST(Table)
aleph0.clarku.edu/ ∼ achou/cs102/examples/bst_animation/BST-Example.html
O
www.cs.jhu.edu/∼ goodrich/dsa/trees/btree.html
O
www.csc.liv.ac.uk/∼ ullrich/COMP102/applets/bstree/
O
Balanced BST(AVL)
webdiis.unizar.es/asignaturas/EDA/AVLTree/avltree.html
O
www.site.uottawa.ca/∼ stan/csi2514/applets/avl/BT.html
O
www.cs.jhu.edu/∼ goodrich/dsa/trees/avltree.html
O
Heap (priority nova.umuc.edu/∼ jarc/idsv/lesson2.html O
queue) www.cs.auckland.ac.nz/∼ jmor159/PLDS210/heaps.html
O
To be continued
Learning Algorithms with Unified and Interactive Web-Based Visualization 57
Continuation of Table 1
Topic Representative visualization examples N H O
Graph DS (Adjmatrix or list)
(part of nova.umuc.edu/∼ jarc/idsv/)(see Section 4.4)
N
Union find research.cs.vt.edu/AVresearch/UF/ Odisjoint sets www.cs.unm.edu/∼ rlpm/499/uf.html O
Segment tree (in our future works) N
Binary indexed(Fenwick) tree
(see Section 4.3) N
n-queens recur-sive backtracking
www.animatedrecursion.com/advanced/the_eight_queens_problem.html
H O
yuval.bar-or.org/index.php?item=9 H O
Classic dynamicprogramming
(in our future works) N
Graph traversal:BFS/DFS+
www.cs.sunysb.edu/∼ skiena/combinatorica/animations/search.html
H
www.rci.rutgers.edu/∼ cfs/472_html/AI_SEARCH/SearchAnimations.html
H
Finding cutvertices, bridges,SCCs
(see Section 4.5) N
MST (Prim’s) www.unf.edu/∼ wkloster/foundations/PrimApplet/PrimApplet.htm
H O
students.ceid.upatras.gr/∼ papagel/project/prim.htm
H O
MST (Kruskal’s) www.unf.edu/∼ wkloster/foundations/KruskalApplet/KruskalApplet.htm
H O
students.ceid.upatras.gr/∼ papagel/project/kruskal.htm
H O
SSSP (BellmanFord’s)
(see Section 4.7) N
SSSP (Dijkstra’s) www.unf.edu/∼ wkloster/foundations/DijkstraApplet/DijkstraApplet.htm
H O
www.dgp.toronto.edu/∼ jstewart/270/9798s/Laffra/DijkstraApplet.html
O
APSP (FloydWarshall’s)
www.pms.ifi.lmu.de/lehre/compgeometry/Gosper/shortest_path/shortest_path.html
H O
Network flow(EdmondsKarp’s)
felix-halim.net/research/maxflow/index.phpwww.eecs.wsu.edu/∼cook/aa/lectures/applets/ek/MaxFlowHome.html
H O
Algorithms onDAG
(in our future works, e.g., topological sort,shortest/longest path, counting paths)
N
Algorithms ontree
(in our future works, e.g., shortest/longest path,all pairs shortest paths, Lowest Common Ancestor)
N
Algorithms onbipartite graph
www-b2.is.tokushima-u.ac.jp/∼ ikeda/suuri/main/index.shtml
H O
To be continued
58 S. Halim et al.
Continuation of Table 1
Topic Representative visualization examples N H O
String matching cgjennings.ca/fjs/index.html O
Suffix tree illya-keeplearning.blogspot.com/2009/06/suffix-trees-java-applet.html
O
Suffix array felix-halim.net/pg/suffix-array
Algorithms onpolygon
(see Section 4.9) N
Convex hull(Graham’s scan,
www.cs.princeton.edu/courses/archive/spr10/cos226/demo/ah/GrahamScan.html
H O
Andrew’s, JarvisMarch)
nms.lcs.mit.edu/∼ aklmiu/6.838/convexhull/
O
www.cs.unc.edu/∼snoeyink/demos/ch/Jarvis.html
O
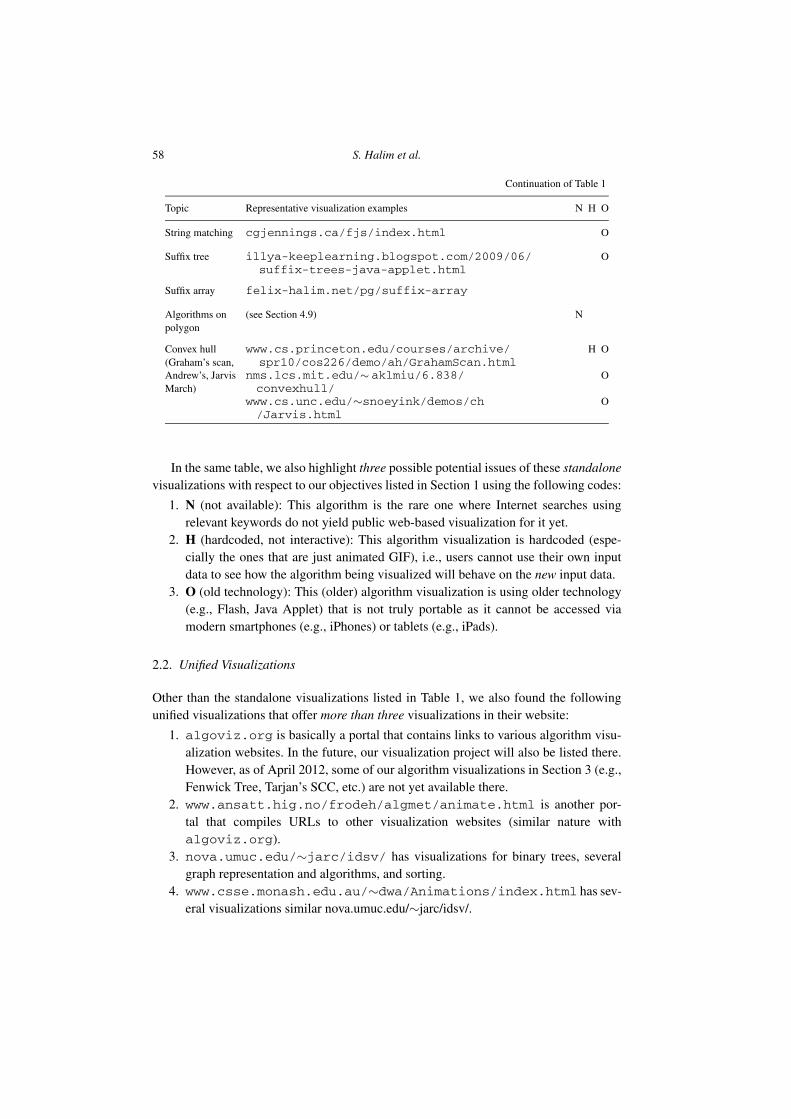
In the same table, we also highlight three possible potential issues of these standalonevisualizations with respect to our objectives listed in Section 1 using the following codes:
1. N (not available): This algorithm is the rare one where Internet searches usingrelevant keywords do not yield public web-based visualization for it yet.
2. H (hardcoded, not interactive): This algorithm visualization is hardcoded (espe-cially the ones that are just animated GIF), i.e., users cannot use their own inputdata to see how the algorithm being visualized will behave on the new input data.
3. O (old technology): This (older) algorithm visualization is using older technology(e.g., Flash, Java Applet) that is not truly portable as it cannot be accessed viamodern smartphones (e.g., iPhones) or tablets (e.g., iPads).
2.2. Unified Visualizations
Other than the standalone visualizations listed in Table 1, we also found the followingunified visualizations that offer more than three visualizations in their website:
1. algoviz.org is basically a portal that contains links to various algorithm visu-alization websites. In the future, our visualization project will also be listed there.However, as of April 2012, some of our algorithm visualizations in Section 3 (e.g.,Fenwick Tree, Tarjan’s SCC, etc.) are not yet available there.
2. www.ansatt.hig.no/frodeh/algmet/animate.html is another por-tal that compiles URLs to other visualization websites (similar nature withalgoviz.org).
3. nova.umuc.edu/∼jarc/idsv/ has visualizations for binary trees, severalgraph representation and algorithms, and sorting.
4. www.csse.monash.edu.au/∼dwa/Animations/index.html has sev-eral visualizations similar nova.umuc.edu/∼jarc/idsv/.
Learning Algorithms with Unified and Interactive Web-Based Visualization 59
5. research.cs.vt.edu/AVresearch/ has several algorithm visualizationsdeveloped between 2003 and 2009.
6. www.cs.usfca.edu/∼galles/visualization/Algorithms.htmlis the closest unified visualization project that is the most similar with the ideaspresented in this paper. It also built with HTML5. We highlight some of the differ-ences between our visualization and this project in Section 3.
3. Our Unified and Interactive Web-Based Algorithm Visualization
These are the algorithm visualizations that we have built as of April 2012. Our focus at theearly stages of this visualization project is to provide visualizations of the non-classicalalgorithms rather than the more classical ones. We also highlight the differences and theextra features that we have incorporated for the algorithms that have been visualized bysome other programmers and can be found publicly on Internet.
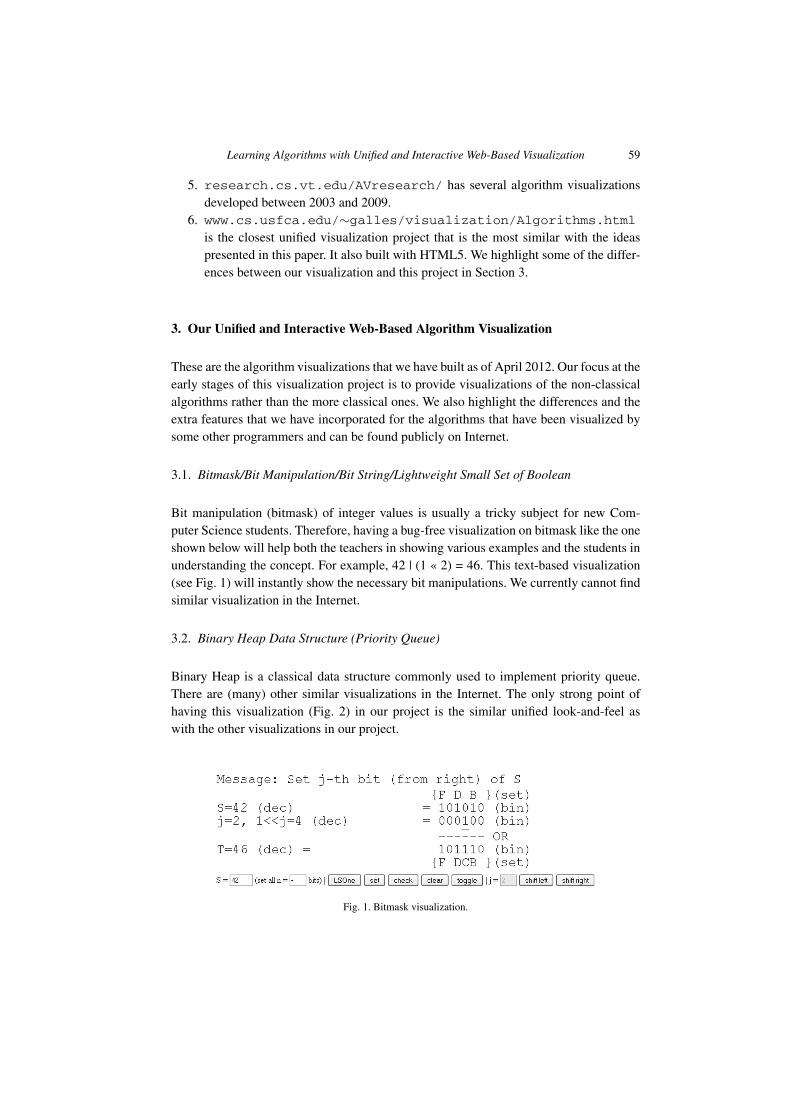
3.1. Bitmask/Bit Manipulation/Bit String/Lightweight Small Set of Boolean
Bit manipulation (bitmask) of integer values is usually a tricky subject for new Com-puter Science students. Therefore, having a bug-free visualization on bitmask like the oneshown below will help both the teachers in showing various examples and the students inunderstanding the concept. For example, 42 | (1 « 2) = 46. This text-based visualization(see Fig. 1) will instantly show the necessary bit manipulations. We currently cannot findsimilar visualization in the Internet.
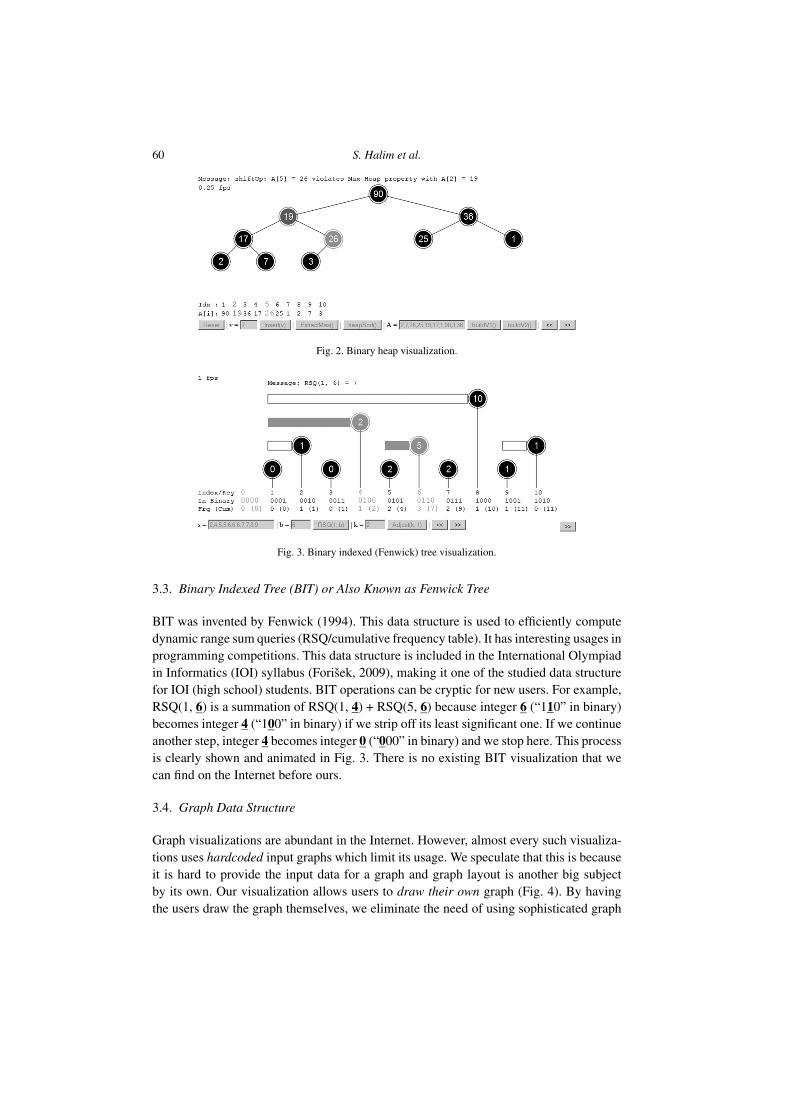
3.2. Binary Heap Data Structure (Priority Queue)
Binary Heap is a classical data structure commonly used to implement priority queue.There are (many) other similar visualizations in the Internet. The only strong point ofhaving this visualization (Fig. 2) in our project is the similar unified look-and-feel aswith the other visualizations in our project.
Fig. 1. Bitmask visualization.
60 S. Halim et al.
Fig. 2. Binary heap visualization.
Fig. 3. Binary indexed (Fenwick) tree visualization.
3.3. Binary Indexed Tree (BIT) or Also Known as Fenwick Tree
BIT was invented by Fenwick (1994). This data structure is used to efficiently computedynamic range sum queries (RSQ/cumulative frequency table). It has interesting usages inprogramming competitions. This data structure is included in the International Olympiadin Informatics (IOI) syllabus (Forišek, 2009), making it one of the studied data structurefor IOI (high school) students. BIT operations can be cryptic for new users. For example,RSQ(1, 6) is a summation of RSQ(1, 4) + RSQ(5, 6) because integer 6 (“110” in binary)becomes integer 4 (“100” in binary) if we strip off its least significant one. If we continueanother step, integer 4 becomes integer 0 (“000” in binary) and we stop here. This processis clearly shown and animated in Fig. 3. There is no existing BIT visualization that wecan find on the Internet before ours.
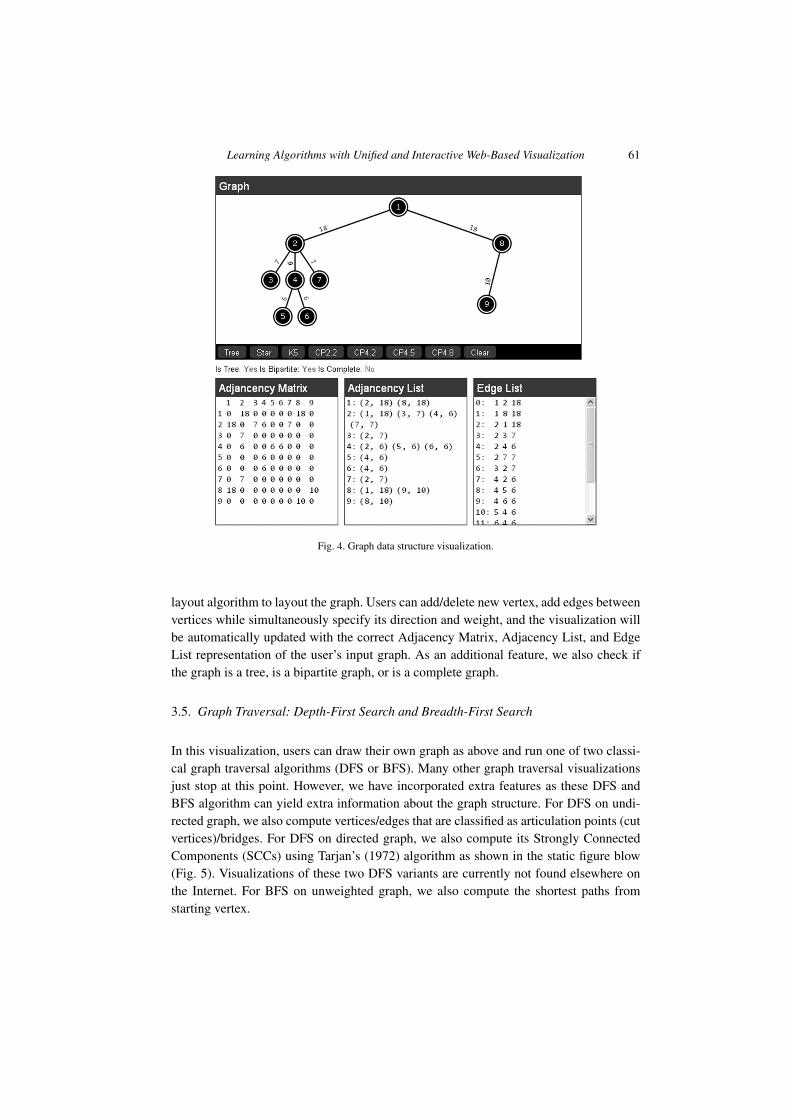
3.4. Graph Data Structure
Graph visualizations are abundant in the Internet. However, almost every such visualiza-tions uses hardcoded input graphs which limit its usage. We speculate that this is becauseit is hard to provide the input data for a graph and graph layout is another big subjectby its own. Our visualization allows users to draw their own graph (Fig. 4). By havingthe users draw the graph themselves, we eliminate the need of using sophisticated graph
Learning Algorithms with Unified and Interactive Web-Based Visualization 61
Fig. 4. Graph data structure visualization.
layout algorithm to layout the graph. Users can add/delete new vertex, add edges betweenvertices while simultaneously specify its direction and weight, and the visualization willbe automatically updated with the correct Adjacency Matrix, Adjacency List, and EdgeList representation of the user’s input graph. As an additional feature, we also check ifthe graph is a tree, is a bipartite graph, or is a complete graph.
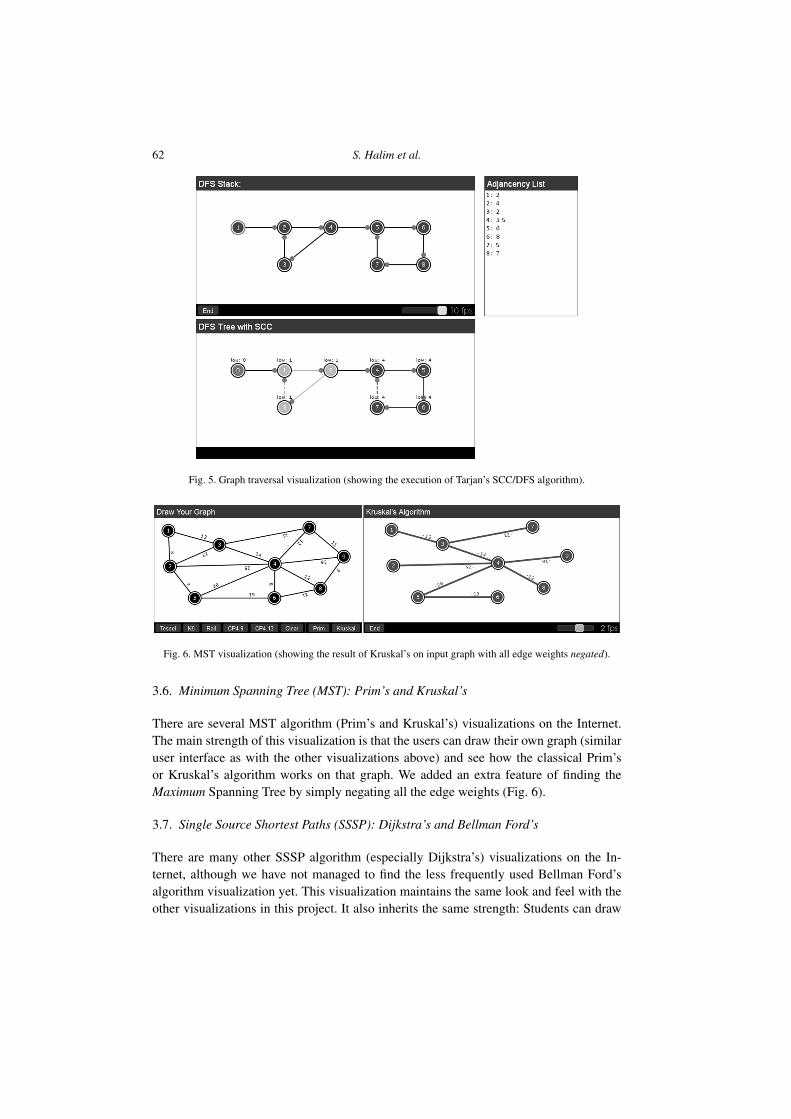
3.5. Graph Traversal: Depth-First Search and Breadth-First Search
In this visualization, users can draw their own graph as above and run one of two classi-cal graph traversal algorithms (DFS or BFS). Many other graph traversal visualizationsjust stop at this point. However, we have incorporated extra features as these DFS andBFS algorithm can yield extra information about the graph structure. For DFS on undi-rected graph, we also compute vertices/edges that are classified as articulation points (cutvertices)/bridges. For DFS on directed graph, we also compute its Strongly ConnectedComponents (SCCs) using Tarjan’s (1972) algorithm as shown in the static figure blow(Fig. 5). Visualizations of these two DFS variants are currently not found elsewhere onthe Internet. For BFS on unweighted graph, we also compute the shortest paths fromstarting vertex.
62 S. Halim et al.
Fig. 5. Graph traversal visualization (showing the execution of Tarjan’s SCC/DFS algorithm).
Fig. 6. MST visualization (showing the result of Kruskal’s on input graph with all edge weights negated).
3.6. Minimum Spanning Tree (MST): Prim’s and Kruskal’s
There are several MST algorithm (Prim’s and Kruskal’s) visualizations on the Internet.The main strength of this visualization is that the users can draw their own graph (similaruser interface as with the other visualizations above) and see how the classical Prim’sor Kruskal’s algorithm works on that graph. We added an extra feature of finding theMaximum Spanning Tree by simply negating all the edge weights (Fig. 6).
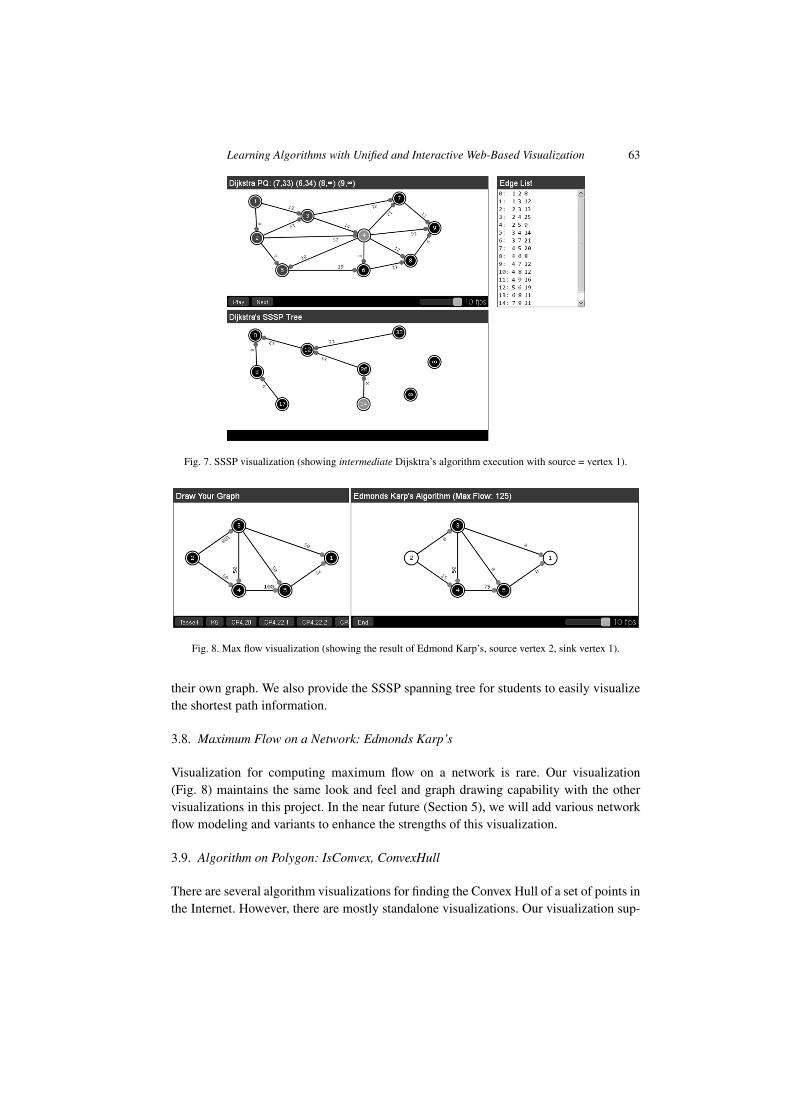
3.7. Single Source Shortest Paths (SSSP): Dijkstra’s and Bellman Ford’s
There are many other SSSP algorithm (especially Dijkstra’s) visualizations on the In-ternet, although we have not managed to find the less frequently used Bellman Ford’salgorithm visualization yet. This visualization maintains the same look and feel with theother visualizations in this project. It also inherits the same strength: Students can draw
Learning Algorithms with Unified and Interactive Web-Based Visualization 63
Fig. 7. SSSP visualization (showing intermediate Dijsktra’s algorithm execution with source = vertex 1).
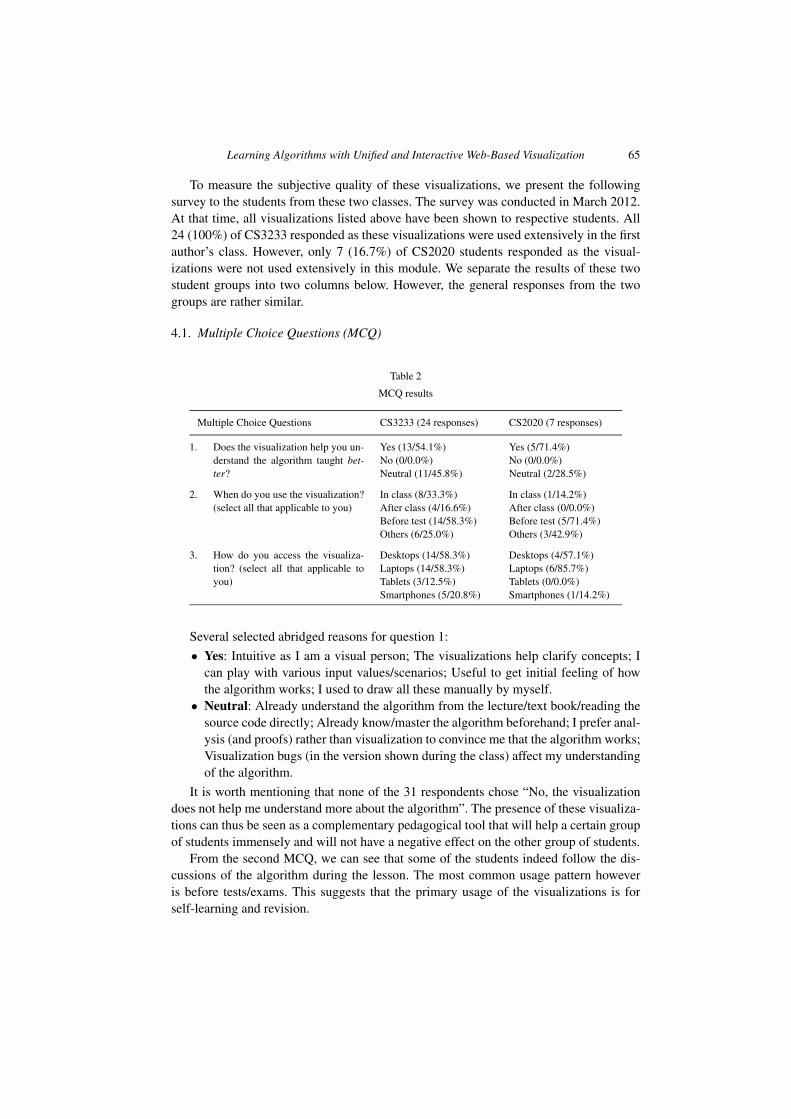
Fig. 8. Max flow visualization (showing the result of Edmond Karp’s, source vertex 2, sink vertex 1).
their own graph. We also provide the SSSP spanning tree for students to easily visualizethe shortest path information.
3.8. Maximum Flow on a Network: Edmonds Karp’s
Visualization for computing maximum flow on a network is rare. Our visualization(Fig. 8) maintains the same look and feel and graph drawing capability with the othervisualizations in this project. In the near future (Section 5), we will add various networkflow modeling and variants to enhance the strengths of this visualization.
3.9. Algorithm on Polygon: IsConvex, ConvexHull
There are several algorithm visualizations for finding the Convex Hull of a set of points inthe Internet. However, there are mostly standalone visualizations. Our visualization sup-

64 S. Halim et al.
Fig. 9. Intermediate computations of IsConvex() routine (top) and Graham’s scan algorithm (below).
ports three Convex Hull algorithms: Graham’s Scan (Graham, 1972) as shown in Fig 9.bottom, Jarvis’s March (Gift Wrapping) algorithm (Jarvis, 1973), and Andrew’s Mono-tone Chain algorithm (Andrew, 1979). With this feature, users can compare the behaviorof these three algorithms on the same set of points.
Additionally, we can do several other things with a polygon, like an algorithm to testwhether it is convex or concave (Fig. 9, top), computing the area and perimeter of anarbitrary polygon, checking if a point is inside or outside the given convex or concavepolygon, or cutting a polygon with a straight line. Some of these features have alreadybeen implemented whereas the rest will be added in the near future (Section 5).
4. Students’ Feedbacks
The visualizations in Section 3 were used for the first time in two modules offered insemester 2 (January–April 2012) at National University of Singapore:
1. CS3233 – Competitive Programming (24 students), taught by the first author. Visu-alizations used: bitmask, bit, representation, dfsbfs, mst, sssp, maxflow, and poly-gon/convexhull.
2. CS2020 – Data Structures and Algorithms Accelerated (42 students), taught by acolleague of the first author. Visualizations used: heap, representation, dfsbfs, mst,sssp.
Learning Algorithms with Unified and Interactive Web-Based Visualization 65
To measure the subjective quality of these visualizations, we present the followingsurvey to the students from these two classes. The survey was conducted in March 2012.At that time, all visualizations listed above have been shown to respective students. All24 (100%) of CS3233 responded as these visualizations were used extensively in the firstauthor’s class. However, only 7 (16.7%) of CS2020 students responded as the visual-izations were not used extensively in this module. We separate the results of these twostudent groups into two columns below. However, the general responses from the twogroups are rather similar.
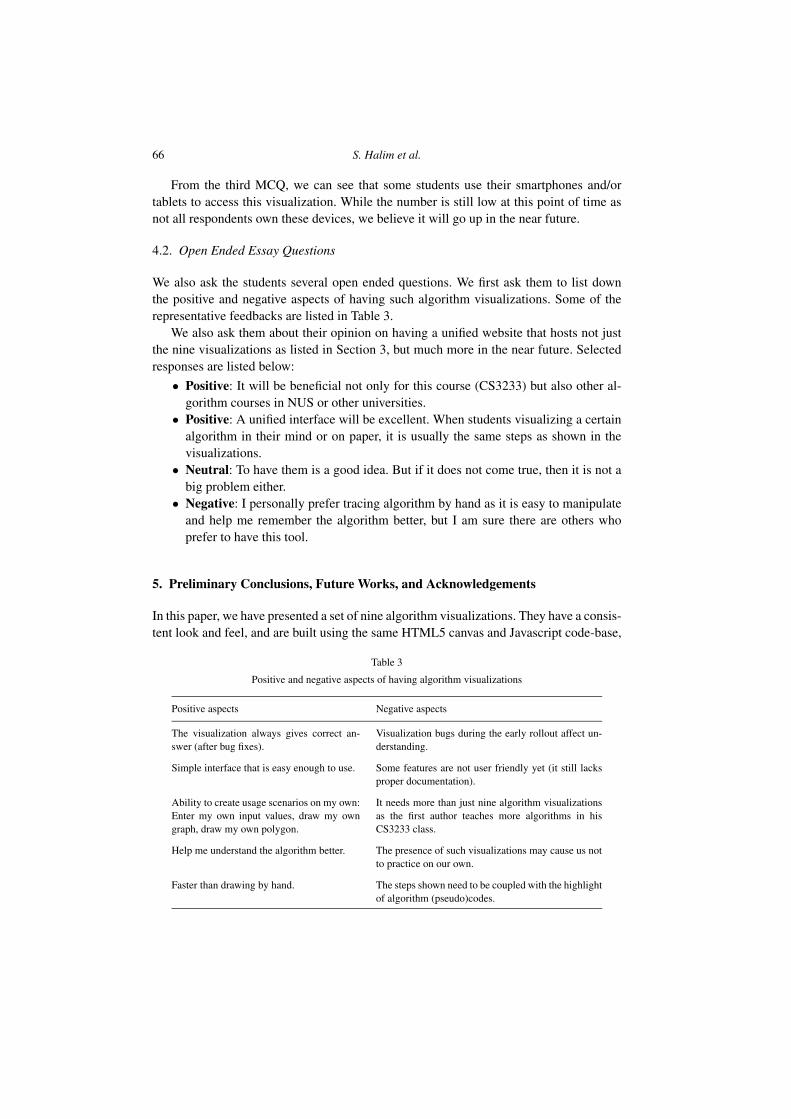
4.1. Multiple Choice Questions (MCQ)
Table 2
MCQ results
Multiple Choice Questions CS3233 (24 responses) CS2020 (7 responses)
1. Does the visualization help you un-derstand the algorithm taught bet-ter?
Yes (13/54.1%)No (0/0.0%)Neutral (11/45.8%)
Yes (5/71.4%)No (0/0.0%)Neutral (2/28.5%)
2. When do you use the visualization?(select all that applicable to you)
In class (8/33.3%)After class (4/16.6%)Before test (14/58.3%)Others (6/25.0%)
In class (1/14.2%)After class (0/0.0%)Before test (5/71.4%)Others (3/42.9%)
3. How do you access the visualiza-tion? (select all that applicable toyou)
Desktops (14/58.3%)Laptops (14/58.3%)Tablets (3/12.5%)Smartphones (5/20.8%)
Desktops (4/57.1%)Laptops (6/85.7%)Tablets (0/0.0%)Smartphones (1/14.2%)
Several selected abridged reasons for question 1:
• Yes: Intuitive as I am a visual person; The visualizations help clarify concepts; Ican play with various input values/scenarios; Useful to get initial feeling of howthe algorithm works; I used to draw all these manually by myself.
• Neutral: Already understand the algorithm from the lecture/text book/reading thesource code directly; Already know/master the algorithm beforehand; I prefer anal-ysis (and proofs) rather than visualization to convince me that the algorithm works;Visualization bugs (in the version shown during the class) affect my understandingof the algorithm.
It is worth mentioning that none of the 31 respondents chose “No, the visualizationdoes not help me understand more about the algorithm”. The presence of these visualiza-tions can thus be seen as a complementary pedagogical tool that will help a certain groupof students immensely and will not have a negative effect on the other group of students.
From the second MCQ, we can see that some of the students indeed follow the dis-cussions of the algorithm during the lesson. The most common usage pattern howeveris before tests/exams. This suggests that the primary usage of the visualizations is forself-learning and revision.
66 S. Halim et al.
From the third MCQ, we can see that some students use their smartphones and/ortablets to access this visualization. While the number is still low at this point of time asnot all respondents own these devices, we believe it will go up in the near future.
4.2. Open Ended Essay Questions
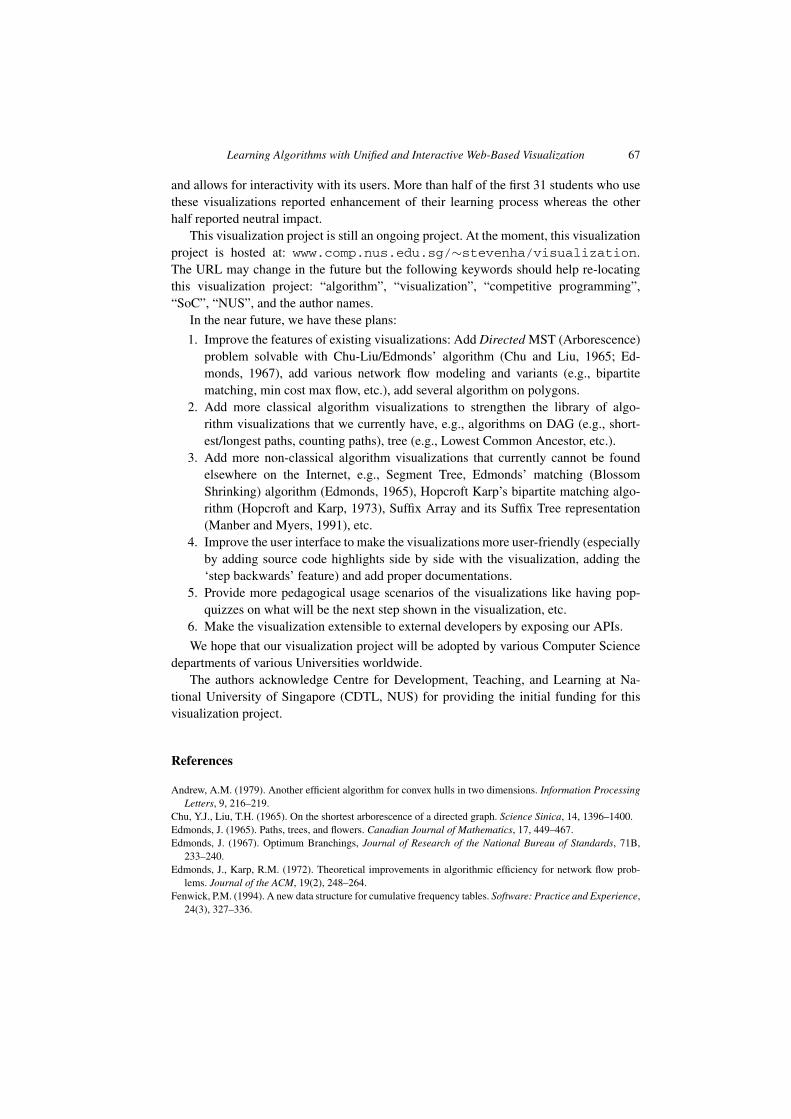
We also ask the students several open ended questions. We first ask them to list downthe positive and negative aspects of having such algorithm visualizations. Some of therepresentative feedbacks are listed in Table 3.
We also ask them about their opinion on having a unified website that hosts not justthe nine visualizations as listed in Section 3, but much more in the near future. Selectedresponses are listed below:
• Positive: It will be beneficial not only for this course (CS3233) but also other al-gorithm courses in NUS or other universities.
• Positive: A unified interface will be excellent. When students visualizing a certainalgorithm in their mind or on paper, it is usually the same steps as shown in thevisualizations.
• Neutral: To have them is a good idea. But if it does not come true, then it is not abig problem either.
• Negative: I personally prefer tracing algorithm by hand as it is easy to manipulateand help me remember the algorithm better, but I am sure there are others whoprefer to have this tool.
5. Preliminary Conclusions, Future Works, and Acknowledgements
In this paper, we have presented a set of nine algorithm visualizations. They have a consis-tent look and feel, and are built using the same HTML5 canvas and Javascript code-base,
Table 3
Positive and negative aspects of having algorithm visualizations
Positive aspects Negative aspects
The visualization always gives correct an-swer (after bug fixes).
Visualization bugs during the early rollout affect un-derstanding.
Simple interface that is easy enough to use. Some features are not user friendly yet (it still lacksproper documentation).
Ability to create usage scenarios on my own:Enter my own input values, draw my owngraph, draw my own polygon.
It needs more than just nine algorithm visualizationsas the first author teaches more algorithms in hisCS3233 class.
Help me understand the algorithm better. The presence of such visualizations may cause us notto practice on our own.
Faster than drawing by hand. The steps shown need to be coupled with the highlightof algorithm (pseudo)codes.
Learning Algorithms with Unified and Interactive Web-Based Visualization 67
and allows for interactivity with its users. More than half of the first 31 students who usethese visualizations reported enhancement of their learning process whereas the otherhalf reported neutral impact.
This visualization project is still an ongoing project. At the moment, this visualizationproject is hosted at: www.comp.nus.edu.sg/∼stevenha/visualization.The URL may change in the future but the following keywords should help re-locatingthis visualization project: “algorithm”, “visualization”, “competitive programming”,“SoC”, “NUS”, and the author names.
In the near future, we have these plans:
1. Improve the features of existing visualizations: Add Directed MST (Arborescence)problem solvable with Chu-Liu/Edmonds’ algorithm (Chu and Liu, 1965; Ed-monds, 1967), add various network flow modeling and variants (e.g., bipartitematching, min cost max flow, etc.), add several algorithm on polygons.
2. Add more classical algorithm visualizations to strengthen the library of algo-rithm visualizations that we currently have, e.g., algorithms on DAG (e.g., short-est/longest paths, counting paths), tree (e.g., Lowest Common Ancestor, etc.).
3. Add more non-classical algorithm visualizations that currently cannot be foundelsewhere on the Internet, e.g., Segment Tree, Edmonds’ matching (BlossomShrinking) algorithm (Edmonds, 1965), Hopcroft Karp’s bipartite matching algo-rithm (Hopcroft and Karp, 1973), Suffix Array and its Suffix Tree representation(Manber and Myers, 1991), etc.
4. Improve the user interface to make the visualizations more user-friendly (especiallyby adding source code highlights side by side with the visualization, adding the‘step backwards’ feature) and add proper documentations.
5. Provide more pedagogical usage scenarios of the visualizations like having pop-quizzes on what will be the next step shown in the visualization, etc.
6. Make the visualization extensible to external developers by exposing our APIs.
We hope that our visualization project will be adopted by various Computer Sciencedepartments of various Universities worldwide.
The authors acknowledge Centre for Development, Teaching, and Learning at Na-tional University of Singapore (CDTL, NUS) for providing the initial funding for thisvisualization project.
References
Andrew, A.M. (1979). Another efficient algorithm for convex hulls in two dimensions. Information ProcessingLetters, 9, 216–219.
Chu, Y.J., Liu, T.H. (1965). On the shortest arborescence of a directed graph. Science Sinica, 14, 1396–1400.Edmonds, J. (1965). Paths, trees, and flowers. Canadian Journal of Mathematics, 17, 449–467.Edmonds, J. (1967). Optimum Branchings, Journal of Research of the National Bureau of Standards, 71B,
233–240.Edmonds, J., Karp, R.M. (1972). Theoretical improvements in algorithmic efficiency for network flow prob-
lems. Journal of the ACM, 19(2), 248–264.Fenwick, P.M. (1994). A new data structure for cumulative frequency tables. Software: Practice and Experience,
24(3), 327–336.
68 S. Halim et al.
Forišek. M. (2009). IOI Syllabus. http://people.ksp.sk/∼misof/ioi-syllabus/. Last accessed11 April 2012.
Graham, R.L. (1972). An efficient algorithm for determining the convex hull of a finite planar set. InformationProcessing Letters, 1, 132–133.
Halim, S., Halim, F. (2011). Competitive Programming 2: This increases the lower bound of programmingcontests. Again. http://www.lulu.com.
Hopcroft, J.E., Karp, R.M. (1973). An n5/2 algorithm for maximum matchings in bipartite graphs. SIAMJournal on Computing, 2(4), 225–231.
Jarvis, R.A. (1973). On the identification of the convex hull of a finite set of points in the plane. InformationProcessing Letters, 2, 18–21.
Manber, U., Myers, G. (1991). Suffix arrays: a new method for on-line string searches. SIAM Journal on Com-puting, 22(5), 935–948.
Tarjan, R.E. (1972). Depth-first search and linear graph algorithms. SIAM Journal on Computing, 1(2), 146–160.
S. Halim is a lecturer in SoC, NUS. He teaches several programmingcourses, ranging from basic programming methodology, intermediatedata structures and algorithms, and up to the “Competitive Program-ming” module. He is the coach of both NUS ACM ICPC teams andSingapore IOI team. So far, he and other trainers @ NUS have suc-cessfully groomed two ACM ICPC World Finalist teams (2009–2010;
2012) as well as two gold, four silver, and six bronze IOI medalists (2009–2011).
Z.C. Koh is a second year computer science undergraduate at theNational University of Singapore School of Computing. He has rep-resented Singapore in the IOI in 2005–2007 and is now training forthe ACM ICPC World Finals 2012. Zi Chun is passionate about soft-ware, design, and coffee. He is also interested in the pedagogy ofcomputer science education. You can find out more about him at
http://zichun.i-xo.net/.
V.B.H. Loh is an undergraduate in Faculty of Science, National Uni-versity of Singapore. His interest lies in data structures and algorithmsand mathematics (such as algebraic geometry and number theory). Helikes to spend his free time solving challenging problems and is an avidGeoCacher.
F. Halim is a PhD student in SoC, NUS. He was IOI 2002 contestant(representing Indonesia). His ICPC teams (at that time, Bina NusantaraUniversity) took part in ACM ICPC Manila Regional 2003–2004–2005and obtained rank 10th, 6th, and 10th respectively. Then, in his finalyear, his team finally won ACM ICPC Kaohsiung Regional 2006 andthus became ACM ICPC World Finalist Tokyo 2007. Today, he actively
joins TopCoder Single Round Matches and his highest rating is a yellow coder.