least squares regression: y on x © christine crisp “teach a level maths” vol. 2: a2 core...
TRANSCRIPT

Least Squares Least Squares Regression:Regression:
yy on on xx
© Christine Crisp
““Teach A Level Maths”Teach A Level Maths”
Vol. 2: A2 Core Vol. 2: A2 Core ModulesModules

Least Squares Regression
We often want to know whether there is a relationship between one variable and another.
e.g. Does the number of driving accidents increase with the age of the driver?
e.g. Can we predict a student’s mark in a French exam if we know it in an English exam?
e.g. Is the weight of a baby at birth related to the height of the father?
You met sets of data like these at GCSE and you’ve drawn scatter diagrams and also drawn a line of best fit “by eye”. This line is called the regression line.
In this presentation we will see how to calculate a regression line.

Least Squares Regression
The data I’m going to use is a random sample from the Census at School database.
I’ve chosen a random sample from the data for height and foot size of 99 children from the UK.
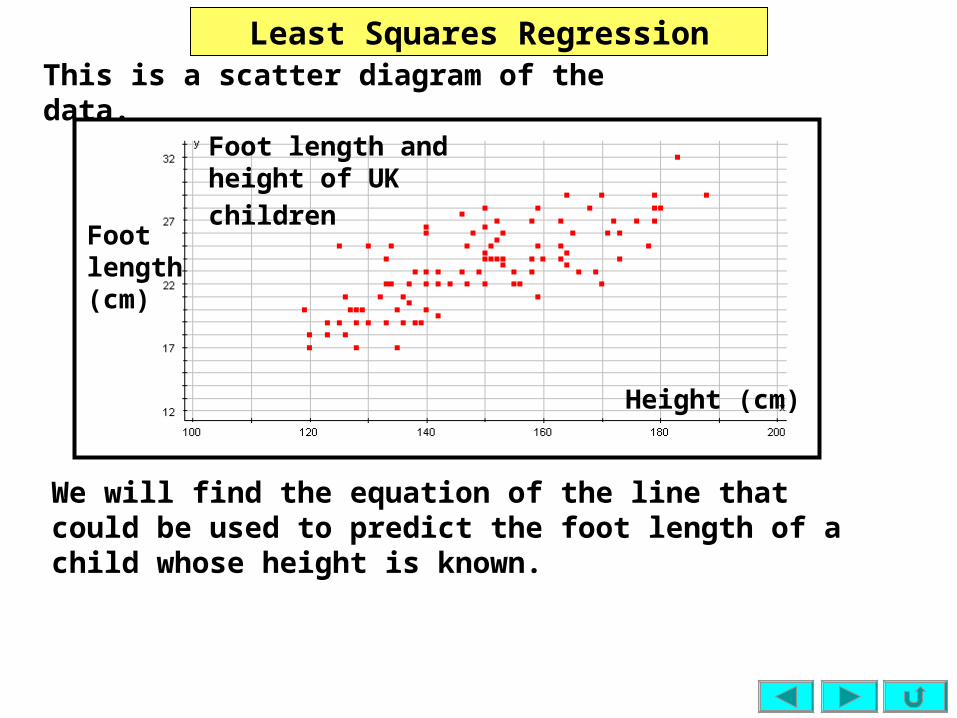
Least Squares RegressionThis is a scatter diagram of the data.
We will find the equation of the line that could be used to predict the foot length of a child whose height is known.
Foot length and height of UK children
Height (cm)
Foot length (cm)

Least Squares RegressionThis is a scatter diagram of the data.
Foot length and height of UK children
Height (cm)
Foot length (cm)
e.g. This length . . . is squared

Least Squares RegressionThis is a scatter diagram of the data.
Foot length and height of UK children
Height (cm)
Foot length (cm)
e.g. This length . . . is squaredand added to the other squares.
Points below the line result in negative “lengths”, so would cancel out those above if we didn’t square.

Least Squares Regression
Foot length and height of UK children
Foot length (cm)
Height (cm)
This is a scatter diagram of the data.
The line is positioned so that the sum of the squares of the distances of all the points from the line is as small as possible.
This makes the line run through the middle of the points.
Least Squares Regression
Foot length and height of UK children
Foot length (cm)
Height (cm)
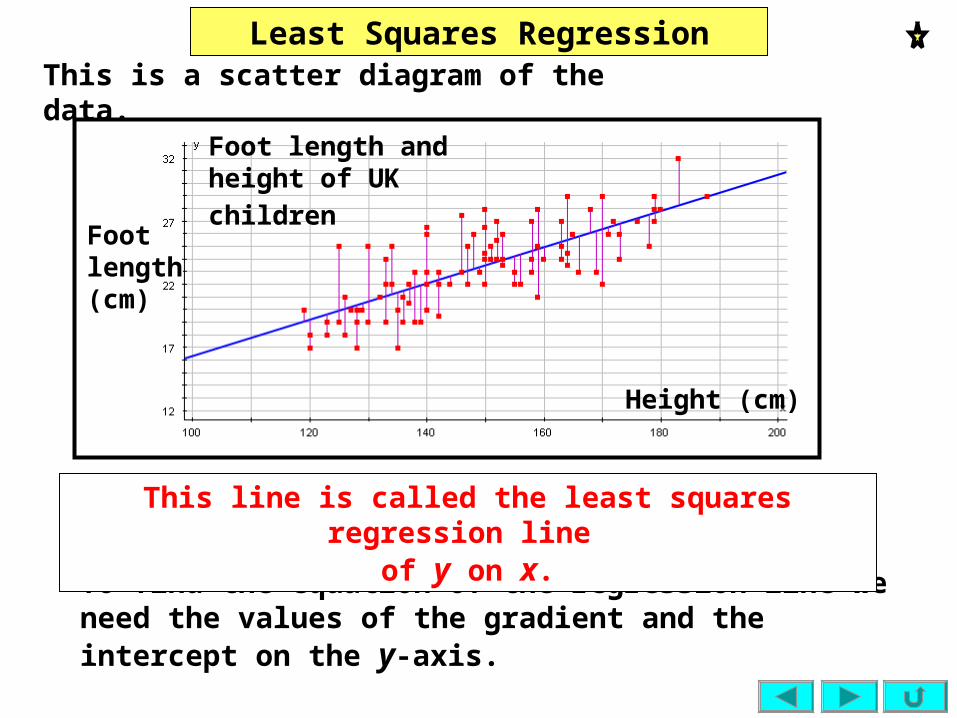
This is a scatter diagram of the data.
To find the equation of the regression line we need the values of the gradient and the intercept on the y-axis.
This line is called the least squares regression line
of y on x.

Least Squares RegressionSUMMARY
bxay
To estimate a value of y for a given value of x, we need the least squares regression line of y on x.
Suppose we have a set of values of 2 variables, x and y.
The equation of the line is of the form
where b is the gradient and a is the intercept on the y-axis.
To find the values of the gradient and intercept on my calculator I . . . ( note down here what you need to do )• The gradient is given by b and
called the regression coefficient.• The intercept is given by a.
The regression line always passes through the point where and are the means of the x- and y- values respectively.
yx),( yx

Least Squares RegressionTaking ExamsThe problem with using a calculator to find the regression line and then directly writing down the answer is that one small error entering the data could mean that in an exam you lose several marks.
To avoid this problem we always check the data carefully after entering it.
The formulae are in your formulae booklet but we’ll now see what the terms in the formulae mean.
If you you are given summary data instead of raw data, you will need to use the formulae as it isn’t then possible to use the calculator regression function.

Least Squares Regression
I’ll use the simple data set again to illustrate the method.
Formulae for the regression line
x 1 2 3
y 5 4 1The gradient of the regression line for y on x is given by
xx
xy
S
Sb
is called the covariance andxyS
xy
x yS xy
n

Least Squares RegressionFormulae for the regression line
x 1 2 3
y 5 4 1The gradient of the regression line for y on x is given by
xx
xy
S
Sb
is called the covariance andxyS
xy
x yS xy
n
43
)10)(6(16 xyS
6 xy y x16 10
I’ll use the simple data set again to illustrate the method.

Least Squares RegressionFormulae for the regression line
x 1 2 3
y 5 4 1The gradient of the regression line for y on x is given by
xx
xy
S
Sb
22xx
xS x
n
2x 2x14941 3662
3
3614 xxS
2 xxS
4xyS
As before, we use the 2nd form
I’ll use the simple data set again to illustrate the method.

Least Squares RegressionFormulae for the regression line
2xxS
xx
xy
S
Sb 2
2
4
x 1 2 3
y 5 4 1The gradient of the regression line for y on x is given by
4xyS
I’ll use the simple data set again to illustrate the method.

Least Squares RegressionFormulae for the regression line
The equation of the line is bxay We now use the fact that the regression line passes through the point so these coordinates satisfy the equation
),( yxy y b x x( )
2b
23
6 33333
3
10
3 3333 2 2y x( )
x ywhere,
So, xy 23337
Now enter the data into your calculator and use the regression function to check
the result.
I’ll use the simple data set again to illustrate the method.
x 1 2 3
y 5 4 1
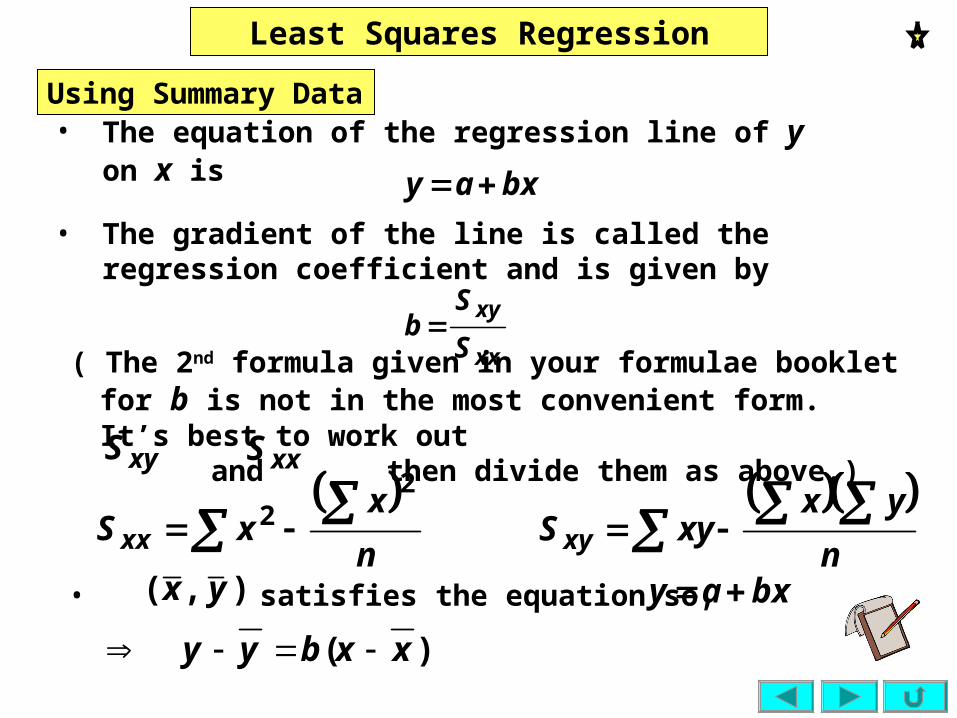
Least Squares RegressionUsing Summary Data• The equation of the regression line of y on x
is bxay
xx
xy
S
Sb
• The gradient of the line is called the regression coefficient and is given by
n
xxS xx
22
n
yxxyS xy
• satisfies the equation so,),( yx bxay
y y b x x( )
( The 2nd formula given in your formulae booklet for b is not in the most convenient form. It’s best to work out
and then divide them as above.)xyS xxS
Least Squares Regression
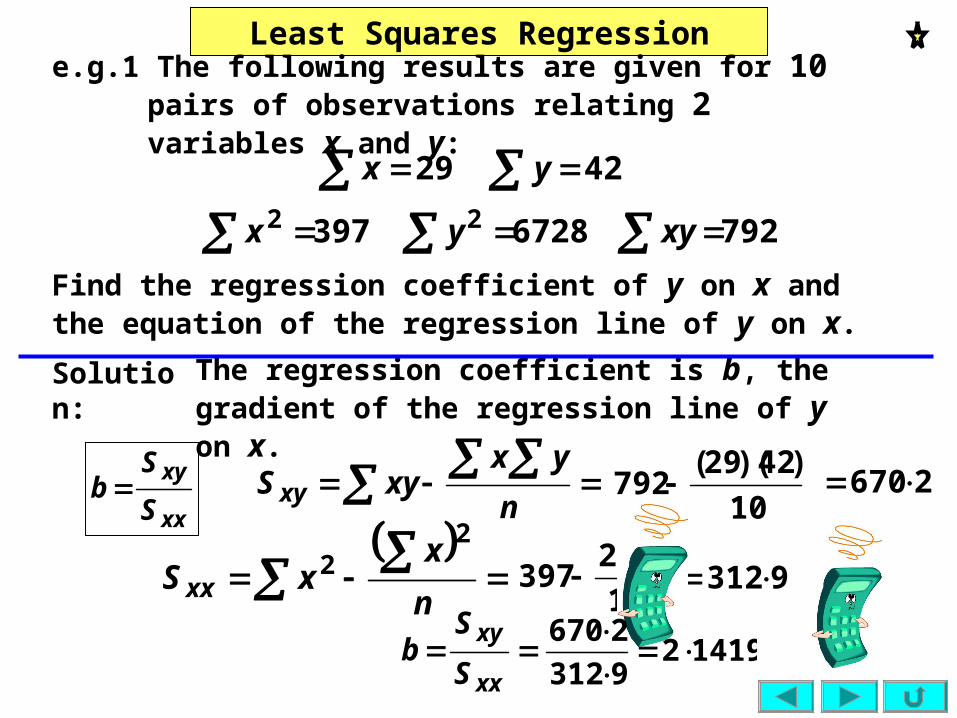
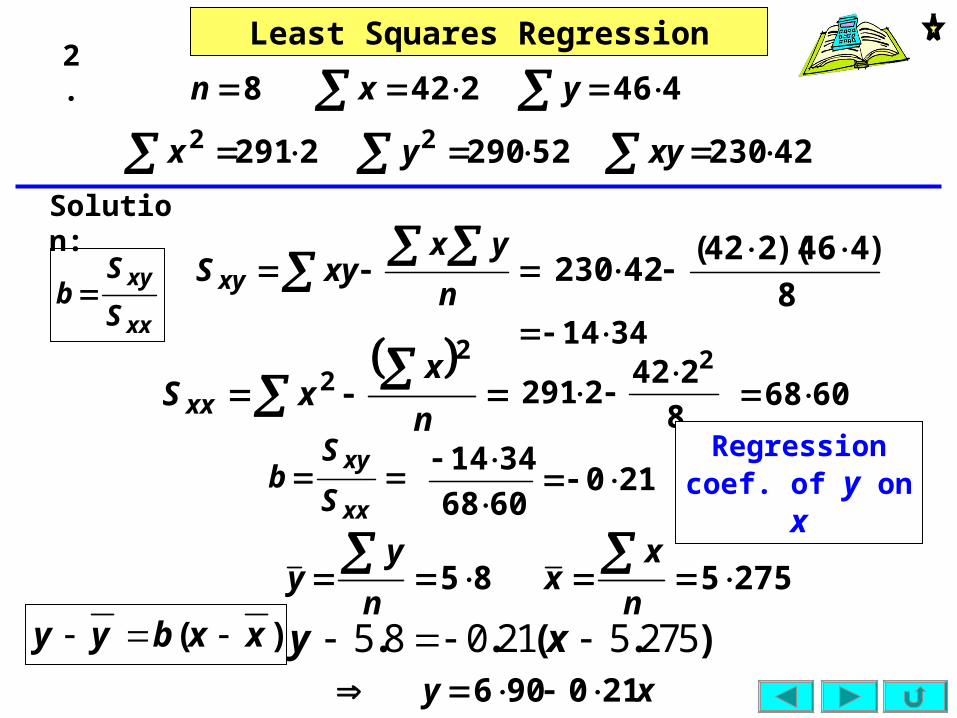
e.g.1 The following results are given for 10 pairs of observations relating 2 variables x and y:
7926728397
4229
22
xyyx
yx
xx
xy
S
Sb
n
yxxyS xy
n
xxS xx
22
10
)42)(29(792 2670
10
29397
2 9312
xx
xy
S
Sb
Find the regression coefficient of y on x and the equation of the regression line of y on x.
Solution:
The regression coefficient is b, the gradient of the regression line of y on x.
141929312
2670

Least Squares Regression
e.g.1 The following results are given for 10 pairs of observations relating 2 variables x and y:
7926728397
4229
22
xyyx
yx
14192b
Find the regression coefficient of y on x and the equation of the regression line of y on x.
Solution:
y y b x x( )
4 2 2 1419 2 9y x( )
n
yy
n
xx24 92
The equation of the regression line of y on x is
xy 142012

Least Squares RegressionExercise
109331166710421
37936113
22
xyyx
yxn
Find the regression coefficient of y on x and the equation of the regression line of y on x for each of the following sets of data:1.
42230522902291
4462428
22
xyyx
yxn2.

Least Squares RegressionSolutions
xx
xy
S
Sb
n
yxxyS xy
n
xxS xx
22
13
)379)(361(10933
13
36110421
2 31396
xx
xy
S
Sb 031
31396
46408
109331166710421
37936113
22
xyyx
yxn1.
46408
1529n
yy 76927
n
xx
Regression coef. of y on x
Your answers may be slightly different from mine as I stored each value as I calculated it and used the fully correct values rather than rounded ones when I did subsequent calculations. This is
good practice but not essential at this stage.
xy 031530
y y b x x( ) 29 15 1 03 27 769y x. . ( . )
Least Squares Regression
xx
xy
S
Sb
n
yxxyS xy
n
xxS xx
22
8
)446)(242(42230
8
2422291
2 6068
xx
xy
S
Sb 210
6068
3414
2.
3414
42230522902291
4462428
22
xyyx
yxn
85n
yy 2755
n
xx
Solution:
Regression coef. of y on x
xy 210906
y y b x x( ) 5 8 0 21 5 275y x. . ( . )

Least Squares RegressionExercise1. Find the equation of the least squares
regression line of y on x, for the following sets of data:(a)
2. Using the answer to 1(b), estimate the values of y for x = 12 and x = 21, giving your answers to 1 d.p. Are these values reliable? If not, why not?
98754421y
1411986431x
(b)
81418105171318315y
23171619251815222820x
( Give the gradient and intercept to 2 d.p. )

Least Squares RegressionSolutions
:1(a) xy 640550
xy 9606531 (b)
2. xyx 960653112 in
)12(9606531 y
120 y
xyx 960653121 in
)21(9606531 y511 y
The 1st answer is not reliable since 12 lies outside the range of values used to calculate the regression line. The 2nd gives a reasonable estimate.

Least Squares Regression
The following slides contain repeats of information on earlier slides, shown without colour, so that they can be printed and photocopied.For most purposes the slides can be printed as “Handouts” with up to 6 slides per sheet.

Least Squares RegressionSUMMAR
Y
bxay
To estimate a value of y for a given value of x, we need the least squares regression line of y on x.
Suppose we have a set of values of 2 variables, x and y.
The equation of the line is of the form
where b is the gradient and a is the intercept on the y-axis.
To find the values of the gradient and intercept on my calculator I . . . ( note down here what you need to do )• The gradient is given by b and
called the regression coefficient.• The intercept is given by a.
The regression line always passes through the point where and are the means of the x- and y- values respectively.
yx),( yx
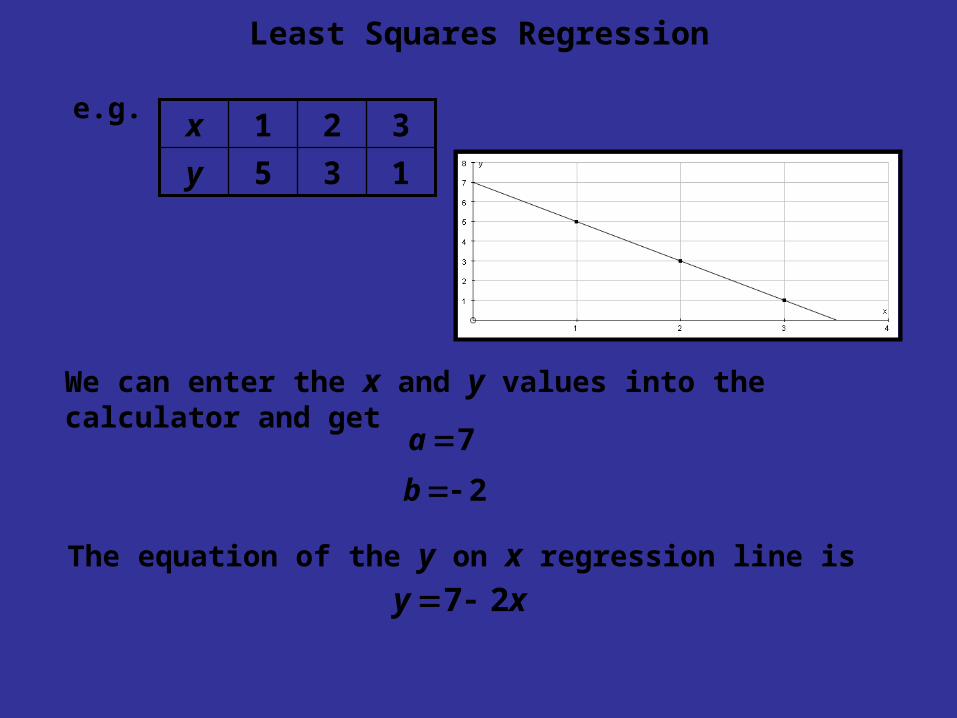
Least Squares Regression
135y
321xe.g.
We can enter the x and y values into the calculator and get
7a
2b
The equation of the y on x regression line is
xy 27

Least Squares RegressionUsing summary data• The equation of the regression line of y on x
is bxay
xx
xy
S
Sb
• The gradient of the line is called the regression coefficient and is given by
n
xxS xx
22
n
yxxyS xy
• satisfies the equation so,),( yx bxay xbay xbya
( The 2nd formula given in your formula booklet for b is not in the most convenient form. It’s best to work out
and then divide them as above.)xyS xxS

Least Squares Regression
e.g.1 The following results are given for 10 pairs of observations relating 2 variables x and y:
7926728397
20429
22
xyyx
yx
xx
xy
S
Sb
n
yxxyS xy
n
xxS xx
22
10
)42)(29(792 2670
10
29397
2 9312
Find the regression coefficient of y on x and the equation of the regression line of y on x.
Solution:
The regression coefficient is b, the gradient of the regression line of y on x.
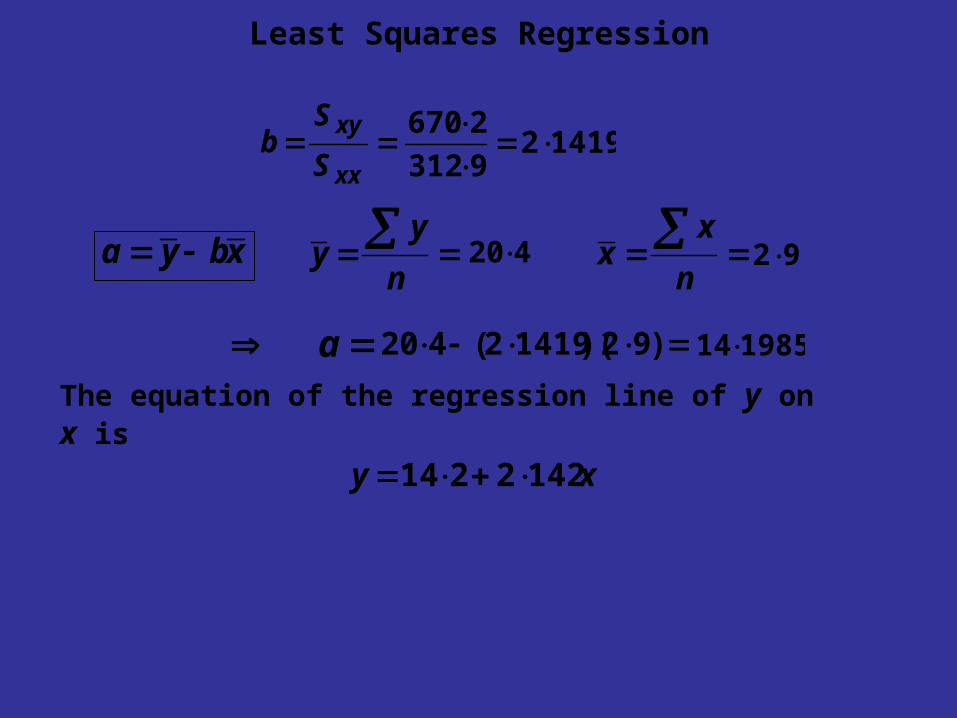
Least Squares Regression
xbya
)92)(14192(420 a
n
yy
n
xx420 92
198514
The equation of the regression line of y on x is
xy 1422214
xx
xy
S
Sb 14192
9312
2670

Least Squares Regression
Suppose we have data showing that there is a strong linear relationship between the amount of fertilizer used on some plants and the yield from the plants.The yield clearly depends on the amount of fertilizer, not the other way round. The yield is responding to the fertilizer.
In this example, the yield is called the response, or dependent, variable.
Explanatory and Response Variables
The amount of fertilizer used is the explanatory, or independent, variable. It will have been controlled in the trial from which the data have been taken.