lecture 16 - lick observatorywoosley/ay220-15/lectures/lecture16.15.pdflecture 16 supernova light...
TRANSCRIPT

SN 1994D
Lecture 16
Supernova Light Curves and Spectra

Supernova – the explosive death of an entire star* –
currently active supernovae
are given at
* Usually, you only die once

Basic spectroscopic classification of supernovae
(It used to stop here)
Also II b, II n, Ic – High vel, I-pec, UL-SN, etc.

Observational Properties: Type Ia supernovae
• The “classical” SN I; no hydrogen; strong Si II 6347, 6371 line • Maximum light spectrum dominated by P-Cygni features of Si II, S II, Ca II, O I, Fe II and Fe III • Nebular spectrum at late times dominated by Fe II, III, Co II, III • Found in all kinds of galaxies, elliptical to spiral, some mild evidence for a association with spiral arms • Prototypes 1972E (Kirshner and Kwan 1974) and SN 1981B (Branch et al 1981) • Brightest kind of common supernova, though briefer. Higher average velocities. Mbol ~ -19.3 • Assumed due to an old stellar population. Favored theoretical model is an accreting CO white dwarf that ignites a thermonuclear runaway and is completely disrupted.

Spectra of three Type Ia supernovae near peak light – courtesy Alex Filippenko
Spectra of SN Ia near maximum are very similar from event to event

Possible Type Ia Supernovae in Our Galaxy
SN D(kpc) mV 185 1.2+-0.2 -8+-2 1006 1.4+-0.3 -9+-1
1572 2.5+-0.5 -4.0+-0.3 1604 4.2+-0.8 -4.3+-0.3
Expected rate in the Milky Way Galaxy about 1 every 200 years, but dozens are found in other galaxies every year. About one SN Ia occurs per decade closer than about 5 Mpc. 2011fe a SN Ia reached appaent magnitude 9.9, 21 Mly. 72e was closer
Tycho Kepler

The Phillips Relation (post 1993)
Broader = Brighter
Can be used to compensate for the variation in observed SN Ia light curves to give a “calibrated standard candle”.
Note that this makes the supernova luminosity at peak a function of a single parameter – e.g., the width.

Properties: Type Ib/c supernovae
• Lack hydrogen, but also lack the Si II 6355 feature that typifies SN Ia. • SN Ib have strong features due to He I at 5876, 6678, 7065 and 10830 A. SN Ic lack these helium features, at least the 5876 A line. Some people think there is a continuum of properties between SN Ib and SN Ic • Found in spiral and irregular galaxies. Found in spiral arms and star forming regions. Not found in ellipticals. Associated with star formation • Often strong radio sources • Fainter at peak than SN Ia by about 1.5 magnitudes. Otherwise similar light curve. • Only supernovae definitely associated with gamma-ray bursts so far are Type Ic • Cannot have high mass in the common case. Probably come from binaries

Filippenko, (1996), Ann. Rev. Astron. Ap

Properties: Type II supernovae
• Have strong Balmer lines – H, H, H - in peak light and late time spectra. Also show lines of Fe II, Na I, Ca II, and, if the supernova is discovered early enough, He I. • Clearly come from massive stars. Found in star forming regions of spiral and irregular galaxies. Not found in ellipticals. Several dozen presupernova stars have been identified: SN 1987A = B3 supergiant; SN 1993J = G8 supergiant (Aldering et al 1994) • Usually fainter than Type I, but highly variable in brightness (presumably depending on hydrogen envelope mass and radius and the explosion energy). Typically lower speed than Type Ia. Last longer. • Come in at least two varieties (in addition to 87A) – Type II-p or “plateau” and Type II-L or “linear”. There may also be Type II-b supernovae which have only a trace amount of hydrogen left on what would otherwise have been a Type Ib/c (e.g., SN 1993J) • Strong radio sources, and at least occasionally emit neutrino bursts

Filippenko (1990)
Typical Type II-p on the Plateau

SN 1987A Philipps (1987) CTIO
2 days after SN)


1952 supernovae were discovered in 2014.

Supernova Factory Lick observatory SN search CfA SN group Carnegie SN project ESSENCE Supernova Legacy Survey
Supernova Discovery Future Rough predictions and promises… PalomarTransient Facory Zwicky PanStarrs Dark Energy Survey Wide Field Infrared Survey Large Synoptic Survey Telescope

550 total (incomplete) – KAIT - 47
CTRS = Catalina Real Time Transient Survey

Li et al 2010, MNRAS, 412, 1441
In a volume limited sample

Tammann et al (1994) says total SN rate in MW is one every 40+-10 years, with 85% from massive stars. The very largest spirals produce about 10 SNae per century.
Good rule of thumb - 2 core collapse supernovae per centery; one SN Ia every other century

Type II Supernovae Models and Physics of
the Light Curve

log
lum
inos
ity
time
Shock break out and cooling
plateau (recombination)
Radioactive Tail
Typical Type II Plateau Supernova
Light Curve
0 few months
43
42
~1045?

For a typical red supergiant derived from a star over 8 solar masses.
• Break out – temperatures of 100’s of thousands K. Very brief stage, not observed so far (indirectly in 87A). Shock heating followed by expansion and cooling • Plateau – the hydrogen envelope expands and cools to ~5500 K. Radiation left by the shock is released. Nearly constant luminosity (T is constant and radius of photosphere does not change much – around 1015 cm). Lasts until the entire envelope recombines. • Radioactive tail – powered by the decay of radioactive 56Co produced in the explosion as 56Ni.
The light curve will vary depending upon the mass of the envelope, radius of the presupernova star, energy of the explosion, degree of mixing, and mass of 56Ni produced.

Shock Break-out
1. The electromagnetic display begins as the shock wave erupts through the surface of the star. A brief, hard ultra-violet (or even soft x-ray) transient ensues as a small amount of mass expands and cools very rapidly. The transient is brighter and longer for larger progenitors but hotter for smaller ones
Tominaga et al. 2011, ApJ, 193, 20
For red supergiants

0.01 d = 864 s Tominaga et al. 2011, ApJ, 193, 20

For SN 1987A detailed calculations exist. It was little hotter, briefer and fainter because it was a BSG with 10 times smaller radius than a RSG.

The effect of the uv-transient in SN 1987A was observed in the circumstellar ionization that it caused. The first spectroscopic observations of SN 1987A, made 35 hours after core collapse (t = 0 defined by the neutrino burst) – Kirshner et al, ApJ, 320, 602, (1987), showed an emission temperature of 15,000 K that was already declining rapidly.
Ultraviolet observations later (Fransson et al, ApJ, 336, 429 (1989) showed narrow emission lines of N III, N IV, N V, and C III (all in the 1200 – 2000 Angstrom band). The ionization threshold for these species is 30 to 80 keV.
Modeling (Fransson and Lundquist ApJL, 341, L59, (1989)) implied an irradiating flux with Te = 4 to 8 x 10⁵ K and an ionizing fluence (> 100 eV) ~ 2 x 1046 erg. This is in good agreement with the models. The emission came from a circumstellar shell around the supernova that was ejected prior to the explosion – hence the narrow lines.

Fransson et al (1989) IUE Observations of circumstellar material in SN 1987 A

Soderberg et al 2008, Nature, 453, 469
Shock breakout in Type Ib supernova SN 2008D (serendipitous discovery while observing SN 2007uy)
x-ray UV
0.3 - 10 keV 6.1 x 1043 erg s-1

GALLEX discovery of ultraviolet emission just after shock break-out in a Type II-p supernova (Gezari et al 2008, ApJ, 683, L131). Missed the initial peak (about 2000 s, 90 Angstroms) but captured the 2 day uv-plateau
FUV = 1539 A NUV = 2316 A
SNLS light curve

Modeling shows that they captured two supernovae, SNLS-04D2dc and SNLS-06D1jd within 7.1 hr and 13.7 hr after shock break out (in the SN rest frame) SNLS = supernova legacy survey
Kepler (15 Msun) plus CMFGEN models

T ∝ 1r
ρ∝ 1r3 ρ ∝ T 3 (adiabatic with radiation
entropy dominant)
ε ∝ T 4
ρ∝ 1
r
As a result only ~1049 erg (RSG; 1048 BSG) is available to be radiated away. The remainder has gone into kinetic energy, now ~1051 erg. As the hydrogen recombines, the free electron density decreases and es similarly declines. (note analogy to the early universe)..
Over the next few days the temperature falls to ~5500 K, at which point, for the densities near the photosphere, hydrogen recombines. The recombination does not occur all at once for the entire envelope, but rather as a wave that propagates inwards in mass – though initially outwards in radius. During this time Rphoto ~ 1015 – 1016 cm. The internal energy deposited by the shock is converted almost entirely to expansion kinetic energy. R has expanded by 100 or more (depending on the initial radius of the star) and the envelope has cooled dramatically.
2. Envelope Recombination

H ionization - 15 solar masses. As the recombination front moves in the photospheric v declines. When the recombination reaches the He core the plateau ends

Kasen and Woosley (2009)
Photospheric speed


tplateau
≈ 109daysκ
0.4
1/6 M10
1/ 2 R500
1/6
E51
1/6 Tion
/ 4500( )2/3
Lbol
≈ 1.1×1042 erg
s
R500
2/3 E51
5/6 Tion
/ 4500( )4/3
M10
1/ 2κ
0.4
1/3
where R500
is the radius of the preSN star in units of 500 R
(3.5×1013 cm);
κ0.4
is the opacity in units of 0.4 cm2gm-1
M10
is the mass of the hydrogen envelope (not the star) in units of 10 M
E51
is the kinetic energy of the explosion in units of 1051 erg
Tion
is the recombination temperature (5500 is better than 4500)
Popov (1993, ApJ, 414, 712) gives the following scaling relations which he derives analytically:
In fact the correct duration of the plateau cannot be determined in a calculation that ignores radioactive energy input.
not quite linear in R because a more compact progenitor recombines at a slightly smaller radius.

φ = L4πD2 =
4πRph2 σTe
4
4πD2 D =distance
D = Rph Te2 σφ
⎛⎝⎜
⎞⎠⎟
1/2
Rph = Rph0 + vph(t − t0 )
can ignore Rph0
Measure on two or more occasions, ti − vi , Ti , and φi
Solve for D and t0.
In reality, the color temperature and effective temperature are notthe same and that requires the solution of a model. But the physics ofthe plateau is well understood. This is a first principles method of gettingdistances. No Cepheid calibration is necessary - but it is helpful.
Cosmology on the Plateau Baade-Wesselink Method
(akq “The Expanding Photosphere Method (EPM)

Eastman, Schmidt, and Kirshner (1996) give the dilution factor for a set of models
H0= 73± 7
The dilution factor corrects for the difference between color temperature and effective temperature and also for the finite thickness of the photosphere which leads to a spread in T

Modeling the spectrum of a Type II supernova in the Hubble flow (5400 km/s) by Baron et al. (2003). SN 1993W at 28 days. The spectrum suggests low metallicity. Sedonna code.

3. Light Curve Tail Powered by Radioactive Decay

1238 keV
847 keV

1.2 B explosion of 15 solar mass RSG with different productions of 56Ni indicated by the labels. Kasen et al. (2009)


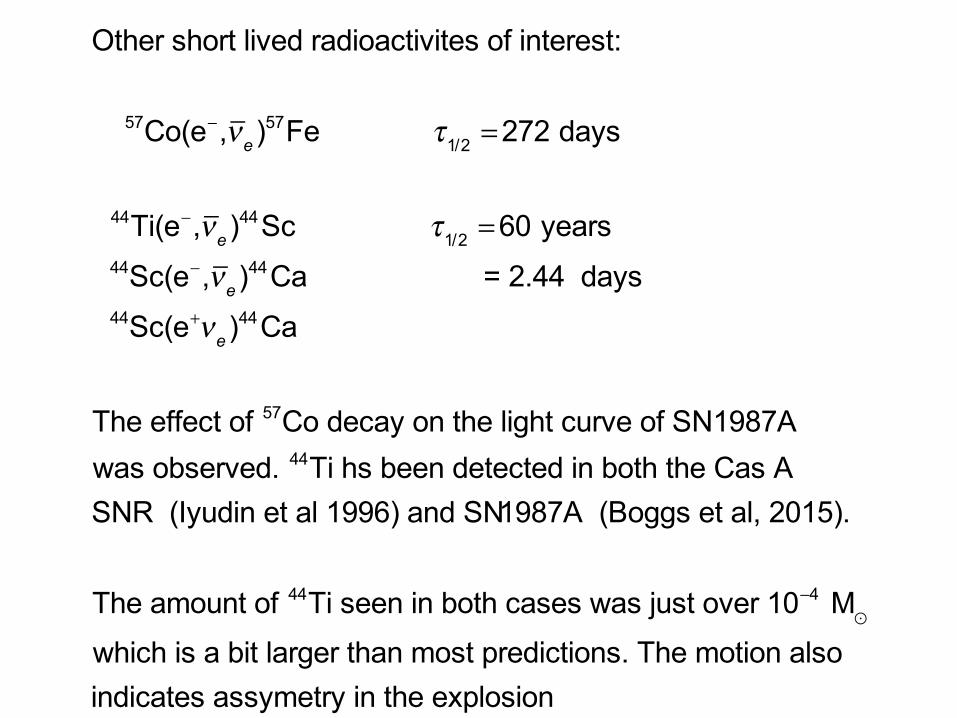
Other short lived radioactivites of interest:
57Co(e−,νe )57Fe τ1/2 =272 days
44Ti(e−,νe )44Sc τ1/2 =60 years 44Sc(e−,νe )44Ca = 2.44 days 44Sc(e+νe )44Ca
The effect of 57Co decay on the light curve of SN1987Awas observed. 44Ti hs been detected in both the Cas ASNR (Iyudin et al 1996) and SN1987A (Boggs et al, 2015).
The amount of 44Ti seen in both cases was just over 10−4 Mwhich is a bit larger than most predictions. The motion also indicates assymetry in the explosion

1.5 ×10⁻⁴ M of 44Ti ejected in SN1987A
Boggs et al (2015; Science)Asymmetric ejection

Exceptional Cases (models)

Stars in the ~8.5 – 10.5 solar mass range are virtually impossible not to explode, but the explosion energy will be low
Density structure, 9.5 Msun (Woosley unpublished)
Energy of explosion
given by (unavoidable)
neutrino wind
~1050
erg. 8 M
ejected
so v ~ 1000 km s−1
Faint supernovae

Light curve from
9.2 M model
KE∞ = 1.0 × 1050 erg
(Teff ≈ 6000 K)
2 - 3 × 1041 erg s-1
Typical SN IIp
Could be shortentened by mass loss.
Shock breakout

Magnetar illuminated supernovae: (Woosley 2010, ApJ, 719, 204)
• Approximately 10% of neutron stars are born as “magnetars”, neutron stars with exceptionally high magnetic field strength (B ~ 1014-15 gauss) and possibly large rotation rates.
• A rotational period of 6 ms corresponds to 5 x 1050 erg. A high rotational rate may be required to make a magnetar. Where did this energy go?
• Moderate field strengths give a large late time energy input. In fact weaker fields can make brighter supernovae (for a given rotational energy). This reflects the competition
between adiabatic energy loss and diffusion.

The initial explosion might not be rotationally powered but assume a highly magnetized pulsar is nevertheless created.
E51(t = 0) = 0.210 ms
P0
⎛⎝⎜
⎞⎠⎟
2
E51(t) =B15
2t
4× 10⁴+
1
E51(t = 0)
⎛
⎝⎜⎞
⎠⎟
−1
L = 1049B15
2 E51(t)
20.
⎛⎝⎜
⎞⎠⎟
2
∝ B15−2t−2
at late times

15 M
1.2 ×1051 erg
Maeda et al 2007; Woosley 2010; Kasen and Bildsten 2010
Typical SN IIp no magnetar power
B15=0.1;
Po=4.5 ms
E51
= 1
B15=0.2;
Po=6.3 ms
E51
= 0.5
B15=0.4;
Po=8.9 ms
E51= 0.25

Chen, Woosley and Sukhbold – in prepration (2015)

The dashed line is for the decay of 0.3 solar masses of 56Ni. Other lines are the calculated light curves for B15 = 0.5 and 0.7 and a neutron star rotational energy of 2 and 5 x 1050 erg.
Woosley (2010)
7.2 M
helium core
1.2 × 1051
erg explosion
and Type Ibc


less M
Broad light curve. May be faint. Few examples
5Mα≥
This is for non-rotating models.For rapid rotation and high final mass gamma-ray bursts may occur
More recent studies suggest binary evolution the most likely path and M ~ 3 - 4 the most likely progenitor

fWR is a reduction factor applied to older overly large WR mass loss rates

Type Ic
Type Ib
Recent Type Ib and Ic Simulations
It is popular (mis)conception that the production of Type Ic supernovae requires the removal of the hydrogen envelope and helium shell of a very massive star in order to have a weak helium line at 5876 A. The two models on the left are both derived from a 5.1 helium star that originated from a binary pair in which each star was lighter than 20 solar masses (Yoon, Langer and Woosley 2010)
Lots of mixing
Some mixing
Dessart, Hillier, & Woosley, MNRAS, 424, 2139 (2012)

blue is continuum red is total model