lecture 4--genetic data analysis
DESCRIPTION
For extra credit question, please use the index cards provided at the back of the room. Print your name, TA name, and section # at top of card and place in the appropriate box at the front of the room. Thanks!. Extra-credit question: - PowerPoint PPT PresentationTRANSCRIPT
Lecture 4--Genetic Data Analysis
For extra credit question, please use the index cards provided at the back of the room.
Print your name, TA name, and section # at top of card and place in the appropriate box at the front of the room.
Thanks!
Extra-credit question:
Name one dominant human trait mentioned in Chapter 2 of your text.
Genetic Data Analysis
Does a genetic model fit the data?

Genetic Experiments
You have discovered a new mutation in a fruit fly and have done a set of crosses to determine the inheritance pattern.
What if the F2 generation of a monohybrid cross has a phenotypic ratio of 3.5 to 1?
How do we tell if deviations from an expected result is due to chance or due to the fact that our genetic hypothesis is wrong?
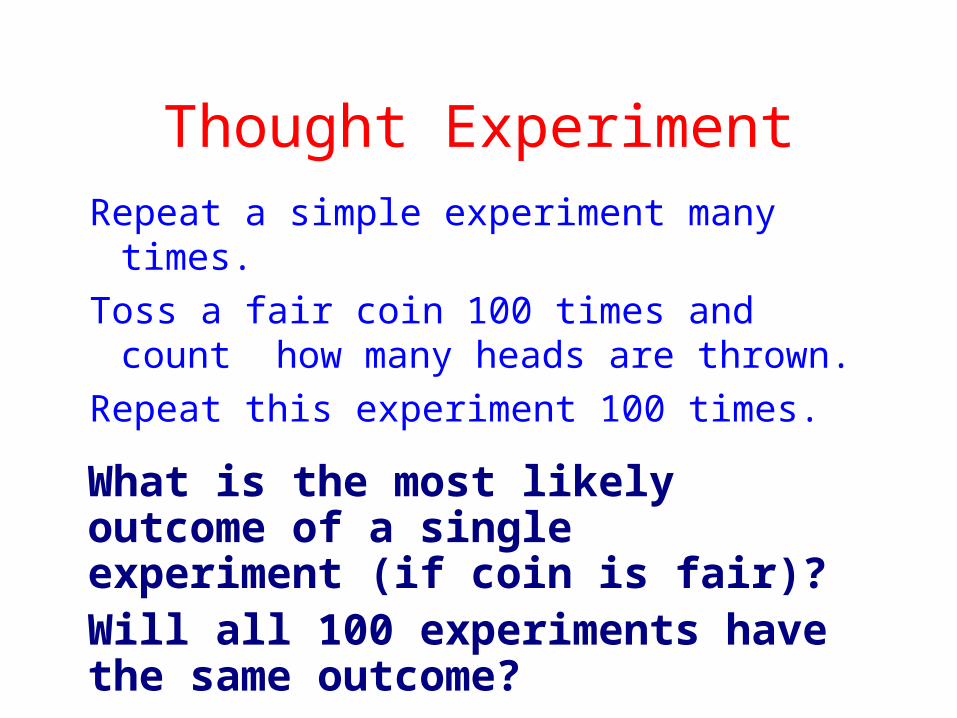
Thought Experiment
Repeat a simple experiment many times.
Toss a fair coin 100 times and count how many heads are thrown.
Repeat this experiment 100 times.
What is the most likely outcome of a single experiment (if coin is fair)? Will all 100 experiments have the same outcome?
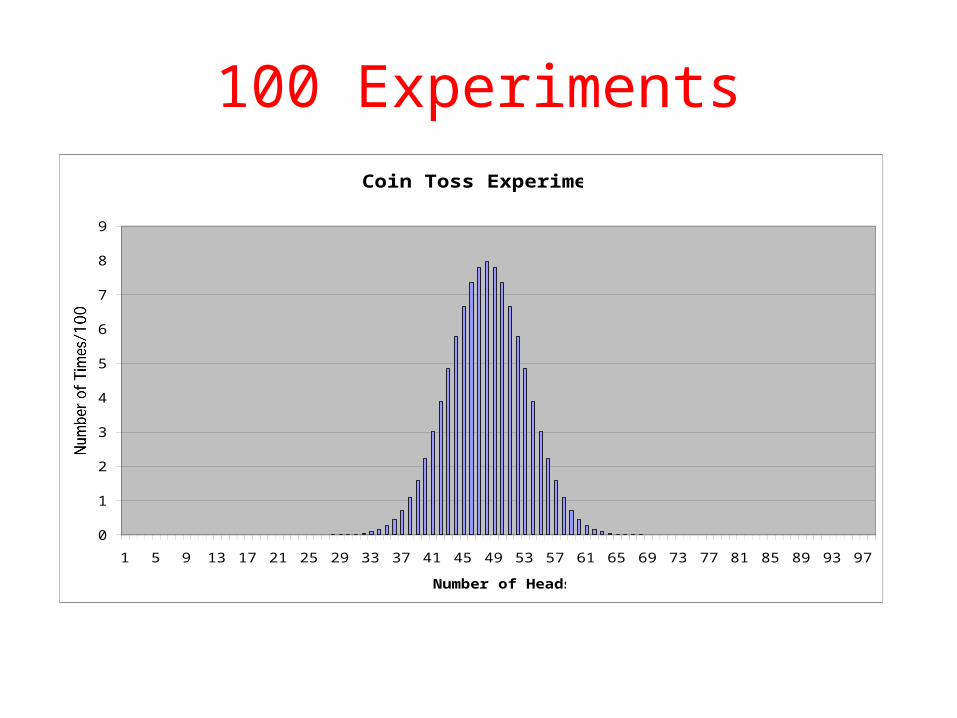
100 ExperimentsCoin Toss Experiment
0
1
2
3
4
5
6
7
8
9
1 5 9 13 17 21 25 29 33 37 41 45 49 53 57 61 65 69 73 77 81 85 89 93 97
Number of Heads
Number of Times/100
Coin Toss Experiment
0
1
2
3
4
5
6
7
8
9
1 5 9 13 17 21 25 29 33 37 41 45 49 53 57 61 65 69 73 77 81 85 89 93 97
Number of Heads
Number of Times/100
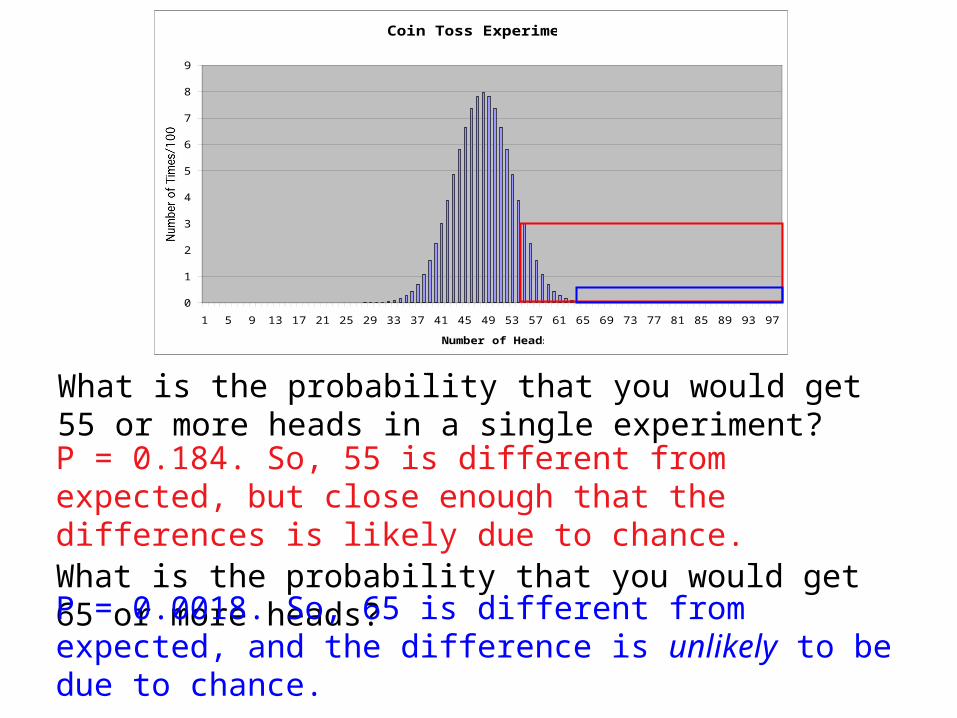
What is the probability that you would get 55 or more heads in a single experiment?
What is the probability that you would get 65 or more heads?
P = 0.184. So, 55 is different from expected, but close enough that the differences is likely due to chance.
P = 0.0018. So, 65 is different from expected, and the difference is unlikely to be due to chance.

Genetic exampleQ: You cross two moths with different phenotypes,
then cross the F1 back to the parent that you think has a recessive phenotype (testcross). Progeny: 65 of the “dominant” phenotype, and 35 of the “recessive” phenotype. Can you reject your hypothesis that the F1 individual was Aa and the ‘recessive’ parent was aa?
First, what is the expected result?
What is the observed result?
How could we measure the difference between the expected and observed results?

Genetic ModelP: AA x aa
F1: Aa
Testcross: Aa x aa
Expected result?
(100 offspring)
Observed result?
50 Aa: 50 aa
65 Aa: 35 aa
Hypothesis (null): observed results do not deviate from expected results more than expected by chance.

2 TestA way to tell if the difference between observed results
and expected results is too big to be due to chance.
Observed number (O) in each category is compared to the expected number (E) under your genetic model: (Obs - Exp).
Use the square of the difference between observed
and expected numbers : (O - E)2
Standardize by dividing by the expected number in a category: (O - E)2 /E

2 Test
= ∑ [(O-E)2]/E = ∑ (d2/E)
(O-E) is the “difference” (d).
symbol means to sum the values over each category or “class” of the data.

2 TableProbabilities
df 0.90 0.50 0.20 0.05 0.01 0.001
1 0.02 0.46 1.64 3.84 6.64 10.83
2 0.21 1.39 3.22 5.99 9.21 13.82
3 0.58 2.37 4.64 7.82 11.35
16.27
4 1.06 3.36 5.99 9.49 13.28
18.47
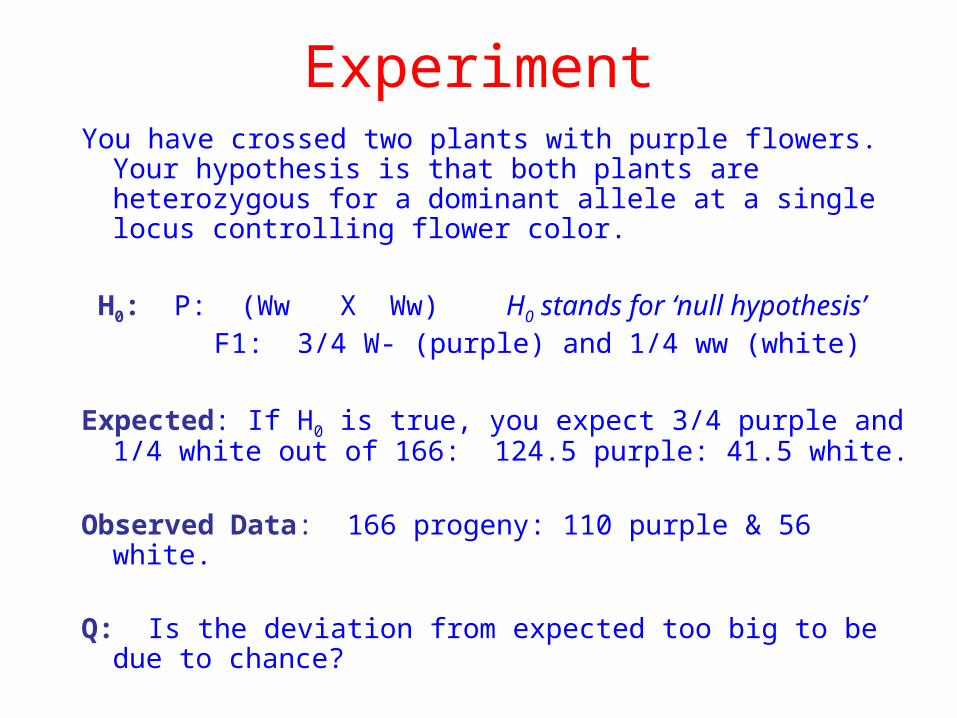
ExperimentYou have crossed two plants with purple flowers. Your
hypothesis is that both plants are heterozygous for a dominant allele at a single locus controlling flower color.
H0: P: (Ww X Ww) H0 stands for ‘null hypothesis’ F1: 3/4 W- (purple) and 1/4 ww (white)
Expected: If H0 is true, you expect 3/4 purple and 1/4 white out of 166: 124.5 purple: 41.5 white.
Observed Data: 166 progeny: 110 purple & 56 white.
Q: Is the deviation from expected too big to be due to chance?
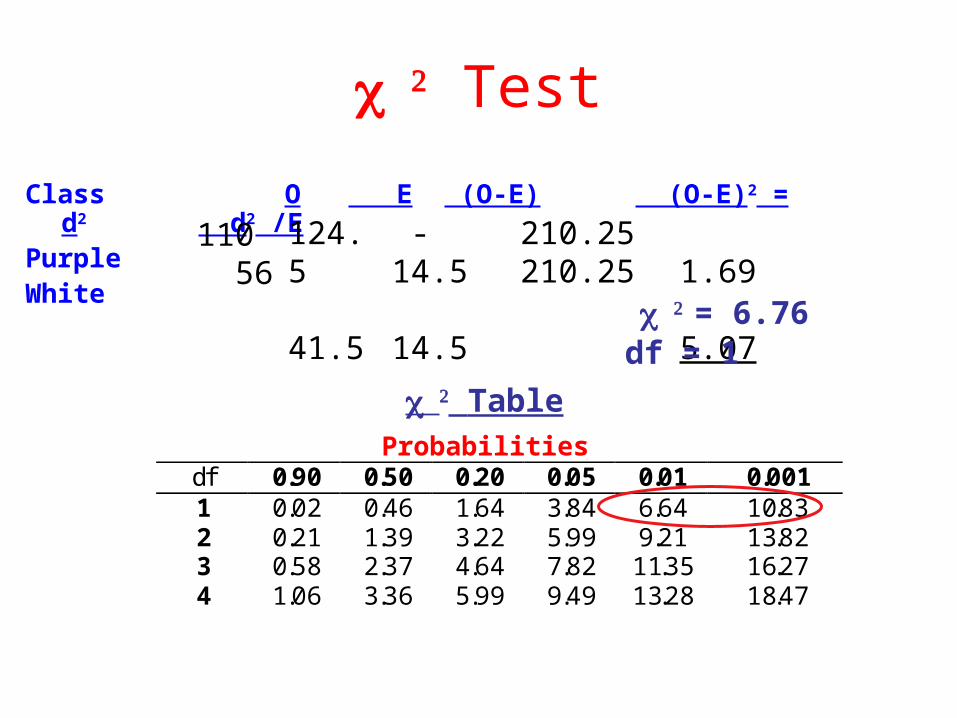
Test
Class O E (O-E) (O-E)2 = d2 d2 /E
PurpleWhite
110 56
124.5 41.5
-14.5 14.5
210.25210.25
1.69 5.07
= 6.76
df 0.90 0.50 0.20 0.05 0.01 0.0011 0.02 0.46 1.64 3.84 6.64 10.832 0.21 1.39 3.22 5.99 9.21 13.823 0.58 2.37 4.64 7.82 11.35 16.274 1.06 3.36 5.99 9.49 13.28 18.47
Table
df = 1
Probabilities

Problem: An ear of corn has a total of 381 grains, including 216 purple, smooth, 79 purple, shrunken, 65 yellow, smooth, and 21 yellow, shrunken.
Your Hypothesis: This ear of corn was produced by a dihybrid cross (PpSs x PpSs) involving two pairs of heterozygous genes resulting in an expected ratio of 9:3:3:1. Purple dominant to yellow; smooth dominant to shrunken.

Class Obs Exp O-E (O-E)2/E
Purple
Smooth
216 214 2 4/214 = 0.019
Purple
Shrunk
79 71 8 64/71 = 0.901
Yellow
Smooth
65 71 6 36/71 = 0.507
Yellow
Shrunk
21 24 3 9/24 = 0.375
d.f. = 3 2 = 1.80
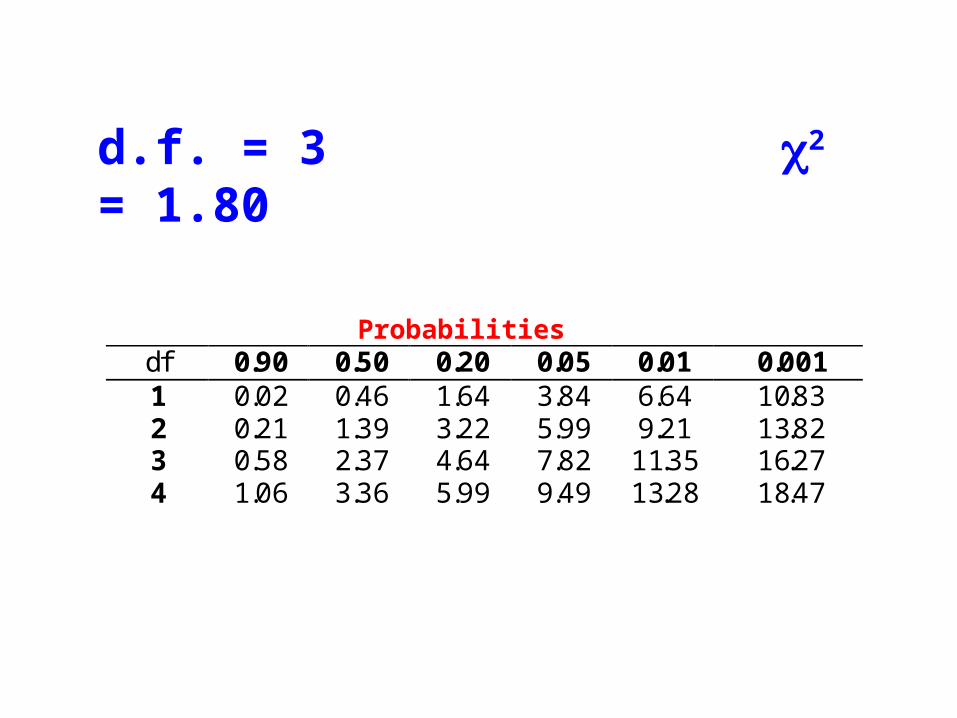
df 0.90 0.50 0.20 0.05 0.01 0.0011 0.02 0.46 1.64 3.84 6.64 10.832 0.21 1.39 3.22 5.99 9.21 13.823 0.58 2.37 4.64 7.82 11.35 16.274 1.06 3.36 5.99 9.49 13.28 18.47
Probabilities
d.f. = 3 2 = 1.80

Extra credit problem for next class
An agouti mouse is crossed to a white mouse and all the F1 offspring are agouti.
An F1 female is crossed to an F1 male, and the offspring are:
11 agouti: 5 white: 4 black
Q: Test the hypothesis that the original parental genotypes were BBCC and bbcc. Give the 2 value, the df, the P value, and state whether or not you reject the hypothesis.

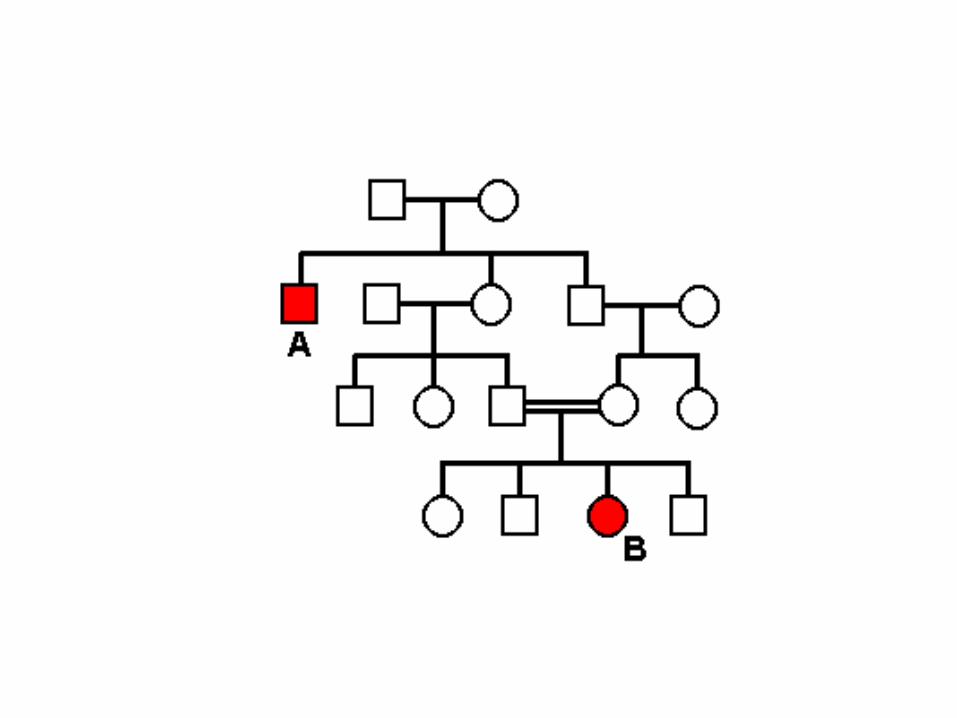
Pedigrees-Review
Female
Male
Not affected Affected Partly affected
Which is the pedigree of (1) autosomal dominant; (2) autosomal recessive; (3) sex-
linked recessive?
QuickTime™ and aTIFF (LZW) decompressor
are needed to see this picture.