lee moore wash basin management study – summary report · lee moore wash basin management study...
TRANSCRIPT


LEE MOORE WASH BASIN MANAGEMENT STUDY – SUMMARY REPORT
ii
ACKNOWLEDGEMENTS
Stantec Consulting Inc. would like to acknowledge and thank the following people instrumental
in completing the Lee Moore Wash Basin Management Study (LMWBMS). First and foremost,
the Pima County Regional Flood Control District that provided funding for the project, and the
key members of the County project team that lent their support and guidance throughout the
course of the study. The PCRFCD Project Manager, Mr. Bill Zimmerman, provided countless
hours, guidance and invaluable executive-decision making that allowed the project to stay on
track and meet key scheduling deadlines. In-depth technical discussions with Mr. Evan Canfield,
Chief Hydrologist, and other PCRFCD staff members also provided important insights as the
project progressed through the various stages toward completion. In addition, we are indebted
to the prime subconsultants involved with the LMWBMS; JE Fuller Hydrology & Geomorphology
for their technical expertise, and C.L Williams Consulting, Inc. and Gordley Design Group, Inc.
that led the project through the public and private stakeholder scrutiny phases of the LMWBMS;
as well as the Development Criteria and Implementation Plan tasks. All provided much-
appreciated support needed to meet deadlines, as well as contributions in compiling this
Summary Report for the LMWBMS. The completion of the project was truly a joint effort that
involved a multi-disciplinary project team including both the public and private sectors.

LEE MOORE WASH BASIN MANAGEMENT STUDY – SUMMARY REPORT
iii
Lee Moore Wash Basin Management Study
Summary Report
Table of Contents
1.0 EXECUTIVE SUMMARY .................................................................................................. 1
2.0 INTRODUCTION...............................................................................................................8
2.1 DESCRIPTION OF STUDY AREA........................................................................ 8
2.2 DESCRIPTION OF PROJECT ............................................................................ 11
2.2.1 PROJECT OBJECTIVE........................................................................... 11
2.2.2 PROJECT SCOPE .................................................................................. 11
2.2.3 PROJECT PARTICIPATION ................................................................... 11
3.0 EXISTING CONDITIONS................................................................................................ 13
3.1 STUDY AREA ....................................................................................................... 13
3.1.1 LAND DEVELOPMENT........................................................................... 13
3.1.2 ENVIRONMENTAL SETTING ................................................................. 14
3.1.3 HYDROGEOLOGY.................................................................................. 15
3.1.4 DRAINAGE.............................................................................................. 16
3.2 GEOMORPHIC ASSESSMENT ........................................................................... 17
3.2.1 SUMMARY AND REVIEW OF FIELD WORK ......................................... 17
3.2.2 PHYSIOGRAPHY.................................................................................... 17
3.2.3 ONE AND TWO-DIMENSIONAL FLOW AREAS .................................... 18
3.2.4 FLOW RELATED HAZARDS................................................................... 18
3.2.5 GEOMORPHIC STUDY ZONES ............................................................. 19
3.2.5.1 PEDIMENT ZONE .................................................................... 19
3.2.5.2 TRIBUTARY PIEDMONT ZONE............................................... 19

LEE MOORE WASH BASIN MANAGEMENT STUDY – SUMMARY REPORT
iv
3.2.5.3 DISTRIBUTARY PIEDMONT ZONE......................................... 22
3.2.5.2 INCISED ZONE ........................................................................ 22
3.2.6 GEOMORPHIC RISK AREAS ................................................................. 22
3.2.7 SIGNIFICANT DISTRIBUTARY FLOW CORRIDORS ............................ 24
3.3 HYDROLOGIC AND HYDRAULIC ANALYSES................................................... 24
3.3.1 ONE-DIMENSIONAL MODELING ANALYSES....................................... 24
3.3.1.1 HYDROLOGIC MODELING...................................................... 25
3.3.1.2 HYDROLOGIC MODELING RESULTS .................................... 26
3.3.1.3 HYDRAULIC MODELING ......................................................... 28
3.3.2 TWO-DIMENSIONAL FLO2D MODELING ANALYSES ......................... 31
3.3.2.1 PRELIMINARY MODELING ..................................................... 31
3.3.2.2 DETAILED MODELS ................................................................ 31
3.3.2.3 MODELED STORM EVENTS................................................... 33
3.3.2.4 FLOODPLAIN MAPPING.......................................................... 34
3.3.2.5 SUMMARY RESULTS .............................................................. 34
3.3.3 SUMMIT AREA STUDY........................................................................... 39
3.3.4 SANTA CRUZ RIVER STUDY................................................................. 43
4.0 PUBLIC INVOLVEMENT ................................................................................................ 45
5.0 ALTERNATIVE IDENTIFICATION ANALYSIS................................................................ 46
5.1 ALTERNATIVE DEVELOPMENT......................................................................... 46
5.1.1 PLANNING AREAS ................................................................................. 46
5.1.2 SPECIFIC CRITERIA .............................................................................. 49
5.1.3 ALTERNATIVE IDENTIFICATION........................................................... 49
5.1.4 ALTERNATIVE RANKING....................................................................... 50
5.2 RECOMMENDED ALTERNATIVE ANALYSIS ................................................... 50
5.2.1 ALTERNATIVE WEIGHTING .................................................................. 50
5.2.2 RANKED ALTERNATIVE ANALYSIS...................................................... 51
LEE MOORE WASH BASIN MANAGEMENT STUDY – SUMMARY REPORT
v
5.2.2.1 REGIONAL DETENTION BASINS ........................................... 51
5.2.2.2 FLOW CORRIDORS................................................................. 52
5.2.2.3 COST ESTIMATES................................................................... 53
5.3 RECOMMENDED ALTERNATIVES.................................................................... 53
5.3.1 COST/BENEFIT ANALYSES................................................................... 53
5.3.2 SUMMARY OF RECOMMENDED ALTERNATIVES .............................. 53
6.0 DEVELOPMENT CRITERIA ........................................................................................... 64
7.0 IMPLEMENTATION PLAN.............................................................................................. 67
7.1 STAKEHOLDER INVOLVEMENT PROGRAM APPROACH .............................. 67
7.1.1 PHASE 1.................................................................................................. 67
7.1.2 PHASE 2.................................................................................................. 67
7.1.3 PHASE 3.................................................................................................. 68
7.2 IMPLEMENTATION STRATEGY ........................................................................ 68
8.0 REFERENCES................................................................................................................ 70
LIST OF FIGURES AND EXHIBITS
EXHIBIT A LOCATION MAP AND MAJOR WATERSHEDS................................................... 1
EXHIBIT B AERIAL VIEW OF DISTRIBUTARY CHANNEL NETWORK................................. 2
EXHIBIT C 100-YEAR FLOODPLAINS AND PROPOSED FLOW CORRIDORS................... 4
FIGURE 1 LEE MOORE WASH BASIN MANAGEMENT STUDY PROJECT AREA ........... 10
FIGURE 2 GEOMORPHIC ZONE LOCATION MAP ............................................................ 20
FIGURE 3 GENERAL PROFILE OF STUDY AREA WITH FLOW RELATED HAZARDS AND GEOMORPHIC COMPONENTS.............................................. 21
FIGURE 4 GEOMORPHIC RISK AREAS............................................................................. 23
FIGURE 5 WATERSHED MAP DISPLAYING HEC-HMS SUBAREAS................................ 27
FIGURE 6 100-YEAR FLOODPLAINS WITHIN ONE-DIMENSIONAL MODELING AREA .............................................................................................. 30
FIGURE 7 FLO-2D MODELING AREA................................................................................. 32

LEE MOORE WASH BASIN MANAGEMENT STUDY – SUMMARY REPORT
vi
FIGURE 8A FLO-2D AREA KEY CONCENTRATION POINTS.............................................. 35
FIGURE 8B FLO-2D AREA KEY CONCENTRATION POINTS.............................................. 36
FIGURE 8C FLO-2D AREA KEY CONCENTRATION POINTS.............................................. 37
FIGURE 8D FLO-2D AREA KEY CONCENTRATION POINTS.............................................. 38
FIGURE 9 SUMMIT AREA WATERSHED MAP................................................................... 41
FIGURE 10 SUMMIT AREA LOCAL FLOODPLAIN MAP ...................................................... 42
FIGURE 11 LEE MOORE WASH BASIN MANAGEMENT STUDY PLANNING AREAS ....... 48
LIST OF TABLES
TABLE 1 SUMMARY OF 100-YEAR PEAK DISCHARGES - ONE-DIMENSIONAL MODELING AREA .............................................................................................. 26
TABLE 2 SUMMARY OF FLO-2D 100-YEAR PEAK DISCHARGES................................. 39
TABLE 3 PERFORMANCE CRITERIA WEIGHTING FACTOR SCORE ........................... 51
TABLE 4 AREA WIDE RECOMMENDED ALTERNATIVES - EXISTING CONDITIONS .................................................................................... 55
TABLE 5 FRANCO/FLATO/SUMMIT AREA RECOMMENDED ALTERNATIVES - EXISTING CONDITIONS .................................................................................... 56
TABLE 5A FRANCO/FLATO/SUMMIT AREA RECOMMENDED ALTERNATIVES - EXISTING CONDITIONS .................................................................................... 57
TABLE 6 CUPRITE/FAGAN/PETTY RANCH AREA RECOMMENDED ALTERNATIVES - EXISTING CONDITIONS...................................................... 58
TABLE 7 SYCAMORE CANYON & GUNNERY RANGE AREA RECOMMENDED ALTERNATIVES - EXISTING CONDITIONS...................................................... 59
TABLE 8 AREA WIDE RECOMMENDED ALTERNATIVES - FUTURE CONDITIONS ...................................................................................... 60
TABLE 9 FRANCO/FLATO/SUMMIT AREA RECOMMENDED ALTERNATIVES - FUTURE CONDITIONS ...................................................................................... 61
TABLE 10 CUPRITE/FAGAN/PETTY RANCH AREA RECOMMENDED ALTERNATIVES - FUTURE CONDITIONS ........................................................ 62
TABLE 11 SYCAMORE CANYON & GUNNERY RANGE AREA RECOMMENDED ALTERNATIVES - FUTURE CONDITIONS ........................................................ 63


LEE MOORE WASH BASIN MANAGEMENT STUDY – SUMMARY REPORT
1
1.0 Executive Summary
This report presents a summary of the studies performed by Stantec Consulting, Inc., JE Fuller
Hydrology and Geomorphology, Inc., and C.L. Williams Consulting, Inc. for the Lee Moore Wash
Basin Management Study (LMWBMS), a 198 square mile watershed situated within
southeastern Pima County. The LMWBMS project area extends from the Santa Rita Mountains
to the east/southeast to the Lee Moore Wash and Santa Cruz River along the western margin.
The watershed consists of eight tributaries, generally known as Gunnery Range Wash,
Sycamore Canyon Wash, Fagan Wash, Cuprite Wash, Petty Ranch Wash, Flato Wash, Summit
Wash, and Franco Wash (Exhibit A). Headwaters of the larger tributaries are situated within the
Santa Rita Mountains and generally drain west-northwest. The Summit Wash and Petty Ranch
Wash are situated within valley areas of the northwestern portion of the Lee Moore watershed.
All watercourses within the study watershed ultimately discharge to the Lee Moore Wash or
Santa Cruz River.
Exhibit A - Location Map and Major Watersheds

LEE MOORE WASH BASIN MANAGEMENT STUDY – SUMMARY REPORT
2
The project area is characterized by landscapes typical of the semi-arid areas of the southwest,
with the Santa Rita Mountains rising above the valley floor, and alluvial fans situated at the base
of the mountains comprising the mountain foothills. Vegetation ranges from limited woodlands in
the higher elevations to desert shrub/scrub mix prevalent within the valley floor areas. The full
range of ephemeral channels, from steep gradient, mountain washes with coarse sediment
loads to sand-bed washes within the lower gradient areas, characterize the drainage area’s
channel system. The dominant stream channel morphology within the study area is a
distributary channel network comprised of numerous, ill-defined channels capable of flowing in
multiple directions, and the unpredictable nature of these networks plays a major role in
planning efforts for the LMWBMS. An example of this type of drainage network is displayed in
Exhibit B.
Exhibit B - Aerial View of Distributary Channel Network
The study area is composed of six different jurisdictional entities, including Pima County, City of
Tucson, Town of Sahuarita, Santa Rita Experimental Range, Coronado National Forest, and the
Tohono O’Odham Nation (San Xavier District). The unincorporated areas within the Pima
County jurisdiction encompass the majority of the study area, and the majority of the land is

LEE MOORE WASH BASIN MANAGEMENT STUDY – SUMMARY REPORT
3
presently undeveloped and managed by governmental entities. The private land holdings that
are developed are typically rural residential and limited areas of suburban residential land uses.
Environmentally sensitive lands, including riparian habitat resources, biological corridors,
historic and cultural sites within the LMWBMS project area, have been designated for
conservation purposes by various jurisdictional plans. The Pima County Sonoran Desert
Conservation Plan (SDCP) is a long-range conservation plan that seeks to protect and enhance
the natural and cultural environment, with efforts focused on six elements, including Habitat
Corridors, Cultural Resources, Mountain Parks, Ranch Conservation and Riparian Protection.
The County’s plan is structured to reflect the natural system through the conservation of large
landscape reserve areas, including parks, preserves and riparian resources in order to provide
protection of endangered and vulnerable species.
The purpose of the Lee Moore Wash Basin Management Study (LMWBMS) is to provide a
comprehensive flood control protection program and develop floodplain management protocol,
while enhancing public safety, fiscal responsibility, and habitat preservation through a balanced
multi-objective approach. The study is intended to provide guidance and regulatory authority to
discourage development in flood prone areas by minimizing encroachments into regional
floodplains, and establishing a watershed-wide “backbone” drainage system, primarily by
employing a natural flow corridor concept (Exhibit C). In addition, the study will ensure that the
floodplain management regulations/guidelines incorporate a multi-objective approach, which will
balance the competing community and private interests. These objectives were met through a
systematic and multi-disciplinary process of documenting existing hydrologic, geomorphologic
and hydraulic conditions, and evaluating the results of these studies to determine the most
effective program to mitigate existing and future drainage issues.
JE Fuller Hydrology and Geomorphology (JEF) prepared a geomorphic assessment of the Lee
Moore Wash drainage basin to document existing flow related hazards. Based on this study,
recommendations were developed to assist floodplain managers, engineers, and development
reviewers in planning for future development of roads, infrastructure, and other amenities within
the study area. The assessment was based on review of maps and publications prepared by
others, new analysis and field reconnaissance by the Consultant, as well as review of hydraulic
modeling prepared by Stantec and JEF as a separate task of this project. Details of this study
are presented as a separate volume (JEF, 2008a) of the LMWBMS.
The northernmost watersheds; Franco Wash, Flato Wash, and Summit Wash, represent
relatively well-defined drainage areas, and lent themselves to traditional one-dimensional

LEE MOORE WASH BASIN MANAGEMENT STUDY – SUMMARY REPORT
4
hydrologic and hydraulic modeling techniques. Detailed watershed analysis and modeling
associated with these areas was performed by Stantec Consulting. The central portion of Flato
Wash, and areas south, display far less watershed definition and channel development, and
were analyzed using two-dimensional FLO-2D hydrologic and hydraulic modeling. This area
represents approximately 65% of the total Lee Moore watershed, and detailed analysis and
modeling for these areas were performed by JEF. Detailed reports associated with these
studies are also presented in separate report volumes (Stantec, 2008b, JEF, 2008b). Exhibit C
displays the results of the 100-year floodplain modeling associated with the LMWBMS efforts.
Exhibit C - 100-year Floodplains and Proposed Flow Corridors
While the focus of these studies documented existing drainage conditions, a major component
of the LMWBMS was to identify specific alternatives and programs intended to mitigate existing
flooding problems identified with these efforts. Planning efforts also focused on minimizing
additional concerns associated with proposed future development anticipated within the project
area. In order to develop watershed-wide solutions, a comprehensive, systematic approach was
employed to evaluate the full range of potential alternatives in an objective manner. Initially,
alternatives were analyzed solely on their merits in meeting specific performance criteria; public
safety and flood hazard mitigation, implementation, environmental resources, sustainability, and

LEE MOORE WASH BASIN MANAGEMENT STUDY – SUMMARY REPORT
5
planning and infrastructure needs, with a ranking system developed among the five categories
relative to their importance. Workgroups were formed with project team members and
stakeholders with expertise in each of the chosen disciplines, and a system of weighting various
alternatives was developed. Ultimately, recommended alternatives for the study were chosen on
the basis of these criteria through an overall weighting process intended to designate the
preferred solutions in the most objective manner as possible.
Sixteen different alternative solutions, focused on mitigating the identified drainage issues,
represented the final suite of recommended alternatives for the LMWBMS, with the
recommended alternatives including both structural and non-structural solutions. Structural
alternatives, which address existing drainage issues, ranged from the installation of new
culverts, construction of bank stabilization, floodproofing, to construction of regional detention
facilities. Non-structural alternatives will involve public education and outreach, and potential
implementation of the FLAP (Floodplain Land Acquisition Program) and/or improvement
districts. Future recommended alternatives were much more broad-based in nature, and with
the exception of the construction of regional detention facilities, were generally non-structural in
nature. The major components of future alternatives involve generating Development Criteria,
intended to provide regulations and guidelines for future development within the area, and the
delineation of a network of flow corridors throughout the study area. Public education and
outreach, as well as recommending modifications or changes to future roadway alignments to
avoid floodprone areas, were also recommended alternatives associated with the future
analyses.
The Public Involvement Plan for this project was designed to fulfill the promise of “consult” on
the International Association for Public Participation (IAP2) Spectrum of Public Participation: to
keep the public informed, listen to and acknowledge concerns and aspirations, and provide
feedback on how the public input was considered in the decision. The goal of the plan was to
bring more information into the study for consideration, provide additional perspectives on
alternatives in order to reach the best outcome, and greater public understanding, support and
acceptance of the study and its final outcome. The plan outlined 12 stakeholder workgroup
meetings, 12 individual stakeholder meetings and six public meetings (three rounds of two
meetings).
The actual effort materialized as seven workgroup meetings (three rounds of two meetings - one
for public agencies and one for private organizations; the final meeting combined both public
and private), seven stakeholder meetings (one each with Diamond Ventures, Pima Association
LEE MOORE WASH BASIN MANAGEMENT STUDY – SUMMARY REPORT
6
of Governments, Arizona State Land Department, Southern Arizona Home Builders Association
and Tucson Water, and two with City of Tucson staff), three rounds of two public meetings
(each round included a meeting on both the east and west sides of the study area, for a more
inclusive approach), and an additional two (2) public meetings were held in the Summit area to
address specific flooding and drainage needs in that area. Additionally, 10 focus group meetings
were held with staff from both public agencies and private organizations to collaboratively
discuss and edit the Development Criteria for the LMWBMS.
The Development Criteria identified herein are part of the non-structural Recommended
Alternative of the LMWBMS. Adherence to these development criteria will lessen the adverse
impacts of urbanization and decrease the cost of flooding for the public and private sectors.
Over the past few decades that the County has been managing floodplain areas, it has become
apparent that there is a lack of tools to adequately manage individual lot development,
especially in distributary flow areas. In addition, as part of this basin management study, it was
determined that Development Criteria which focused both on single-family development on
individual lots, standard subdivisions and/or large master planned developments could reduce
flood and related damage within the Lee Moore Wash watershed. As a result, a major
component of the study presented herein establishes preferred, natural flow corridors to convey
flows within these areas, as illustrated in Exhibit C.
Approximately 48% of the LMWBMS area is owned by the state of Arizona and managed by the
Arizona State Land Department (ASLD). ASLD manages lands in compliance with the Enabling
Act, the Arizona Constitution, and Arizona Revised Statutes Title 37 which require that State
Trust Lands be managed in the best interests of the designated State Trust beneficiaries. As
such, certain elements of the Development Criteria may not have the same regulatory
compliance authority with regards to State Trust Lands as it does to land owned by others. The
principles, policies and practices contained within the Design Criteria provide a useful method
for insuring a consistent and comprehensive approach to floodplain management within the
Study area; therefore it is in the best interest of all land owners and jurisdictions to comply with
these Development Criteria to the fullest extent possible.
The Stakeholder Involvement program for this project was designed by C.L. Williams
Consulting, Inc. (CLW), and completed with the goal of maximizing implementation opportunities
for the Recommended Alternative of the LMWBMS. The results of the Stakeholder Involvement
and Implementation Strategy are summarized in the forthcoming accompanying Implementation
Plan (CLW, 2010), which is a separate volume of the LMWBMS. The Implementation Plan
LEE MOORE WASH BASIN MANAGEMENT STUDY – SUMMARY REPORT
7
details the Recommended Alternative by location, capital improvement costs, potential cost
sharing partner, participation interest, potential mechanism for participation and preliminary
timeline when ever possible. The Implementation Plan is being developed iteratively and in
cooperation with the affected stakeholders. It does not represent a binding legal agreement on
any partners, but does provide a solid summary of implementation efforts to date, as well as a
roadmap for the Pima County Regional Flood Control District implementation efforts once the
LMWBMS is adopted by the Board of Directors, and potentially by the City of Tucson and Town
of Sahuarita. Several of the Recommended Alternatives are connected with other agency
programs. The result is that often their schedule or funding will drive the implementation
timeline. Recognition of this fact by the District and planning for this in future follow through
efforts will allow for cost effective and efficient construction completion. If the coordination is not
continued after LMWBMS completion, it is possible that other agencies will move ahead with
their projects and not include Recommended Alternatives drainage improvements.
The Recommended Alternatives for this project are comprised of structural and non-structural
solutions at various locations. These locations are distributed throughout the project area and
include construction and non-construction activities that will ultimately be funded in one of three
ways:
1) Solely funded by the District.
2) Funded solely or in partnership among private and/or public agencies including the
District.
3) Funded solely or in partnership among private and/or public agencies not including
the District.
The Recommended Alternatives were developed after extensive technical review of the
drainage, infrastructure and land use conditions in the project area. Significant effort was also
put forth by the project team to involve the general public, as well as public and private sector
stakeholders, in development of the Recommended Alternatives. Included within the LMWBMS
report is documentation of the public and stakeholder activities and responses.
LEE MOORE WASH BASIN MANAGEMENT STUDY – SUMMARY REPORT
8
2.0 Introduction
This document presents a summary of multi-faceted studies (performed primarily by Stantec
Consulting, Inc., JE Fuller Hydrology and Geomorphology, Inc., and C.L. Williams Consulting,
Inc., and other specific specialty subconsultants) for the Lee Moore Wash Basin Management
Study (LMWBMS), a 198 square mile watershed situated within southeastern Pima County. The
Lee Moore watershed has been the subject of study in previous efforts performed by the County
in 1988 (PCDTFCD, 1988). The current study documents existing physiographic conditions
within the watershed, including geomorphology, hydrology, and floodplain characteristics, as
well as land use, infrastructure and flood incident areas. Future infrastructure needs and
anticipated areas of development were also identified. Based on constraints and issues
identified with these studies, a multitude of alternative solutions and programs were developed
in a workgroup environment, and a systematic, objective weighting approach was applied to
determine a suite of recommended alternatives. These alternatives were further evaluated from
a feasibility perspective, and a proposed set of solutions was developed intended to address
both existing issues and future planning concerns. In conjunction with these efforts, specific
development criteria were developed, along with a comprehensive implementation plan to
address both funding sources and schedule.
The following sections provide a brief description of the study area, project scope, and
objectives of the Lee Moore Wash Basin Management Study. Summary descriptions of specific
procedures and results comprise the subsequent sections of this report.
2.1 DESCRIPTION OF PROJECT AREA
The Lee Moore project area extends from the Santa Rita Mountains in the east/southeast
portion of the study area to the Lee Moore Wash and/or Santa Cruz River along the western
margin, with the studied watershed area comprising about 198 square miles. The watershed
east of the Lee Moore channel primarily consists of eight tributaries, with these watercourses
designated as Gunnery Range Wash, Sycamore Canyon Wash, Fagan Wash, Cuprite Wash,
Petty Ranch Wash, Flato Wash, Summit Wash, and Franco Wash. Headwaters of the larger
tributaries are situated to the southeast within the Santa Rita Mountains and/or associated
foothill areas, and watercourses generally drain west-northwest to the Lee Moore Wash. The

LEE MOORE WASH BASIN MANAGEMENT STUDY – SUMMARY REPORT
9
Summit Wash and Petty Ranch Wash are smaller tributaries situated within valley areas of the
northwestern portion of the Lee Moore watershed. The Lee Moore Wash channel discharges to
the Santa Cruz River just north of it’s confluence with Summit Wash. The northernmost
watercourse, Franco Wash, discharges directly to the Santa Cruz River north of the Lee Moore
Wash confluence. The referenced major watersheds and overall study area are displayed in
Figure 1.
The project area is characterized by a variety of landscapes common to the semi-arid areas of
the southwest, with the Santa Rita Mountains rising 3600 feet above the valley floor, and alluvial
fans situated along the base of the mountains that comprise the mountain foothills. Vegetation
consists of the typical array of southwest desert plant species, ranging from limited woodlands
in the higher elevations to desert shrub/scrub mix prevalent within the valley floor areas. The full
range of ephemeral stream types are exhibited within the drainage area’s channel system, from
steep gradient mountain streams characterized by coarse sediment loads to sand-bed washes
displaying a much less coarse sediment distribution within the lower gradient areas. The
dominant stream channel morphology within the study area, however, is a distributary channel
network comprised of numerous, ill-defined channels capable of flowing in multiple directions
during a given storm event. The unpredictable nature of these systems plays a major role in
both existing and future planning efforts for the Lee Moore study area.
The Lee Moore Wash Basin Management Study area is composed of six different jurisdictional
entities, including Pima County, City of Tucson, Town of Sahuarita, Santa Rita Experimental
Range, Coronado National Forest, and the Tohono O’Odham Nation (San Xavier District). The
unincorporated areas within the Pima County jurisdiction encompass the majority of the study
area. The majority of the land within the Lee Moore Wash Basin Management Study area is
managed by governmental entities and is presently undeveloped. The private land holdings that
are developed are typically rural residential, with limited areas of suburban residential land uses.
The suburban residential developments are concentrated near the intersection of Sahuarita
Road and Houghton Road.

FR
AN
CO
W
AS
HW
AT
ER
SH
ED
FAG
AN
WA
SH
W
AT
ER
SH
ED
FL
AT
O
WA
SH
W
AT
ER
SH
ED
SY
CA
MO
RE
C
AN
YO
N
WA
SH
W
AT
ER
SH
ED
GU
NN
ER
Y R
AN
GE
W
AS
H
WA
TE
RS
HE
D
CU
PR
ITE
WA
SH
W
AT
ER
SH
ED
PE
TT
Y R
AN
CH
WA
SH
WA
TE
RS
HE
D
SU
MM
IT
WA
SH
W
AT
ER
SH
ED
Le
e M
oo
re W
as
hB
asin
Ma
na
ge
me
nt
Stu
dy
Leg
en
d
Wa
ters
hed
Bo
unda
ries
·
Sta
ntec
Con
sulti
ng,
Inc
201
No
rth
Bon
ita A
venu
e S
te. 1
01Tu
cso
n, A
Z 8
5745
-299
9
Pima C
ounty
___
__
___
__
___
__
Fig
ure
1P
roje
ct
Are
a
File:
W:\ac
tive\1
8512
0071
\GIS(
direc
tory)\
altern
ative
s\WAT
ERSH
ED_M
AP.m
xd 1
/21/20
09
01
23
0.5
Mile
s

LEE MOORE WASH BASIN MANAGEMENT STUDY – SUMMARY REPORT
11
2.2 DESCRIPTION OF PROJECT
2.2.1 Project Objective
The purpose of the Lee Moore Wash Basin Management Study is to provide a comprehensive
flood control protection program and develop floodplain management protocol, while enhancing
public safety, fiscal responsibility, and habitat preservation through a balanced multi-objective
approach in managing the watersheds, floodplains and resources in the study area. The study is
intended to provide guidance and regulatory authority to manage development in flood prone
areas by minimizing encroachments into regional floodplains, while relying on interagency
coordination to preserve the hydrologic integrity and stormwater conveyance characteristics of
the regional watersheds. In addition, the study will ensure that the floodplain management
regulations/guidelines incorporate a multi-objective approach, which will balance the competing
community and private interests.
2.2.2 Project Scope
The general scope of work for the Lee Moore Wash Basin Management Study (LMWBMS) is to
identify flood and erosion hazard areas, drainage problems, and cost-effective solutions to
manage floodwaters in the Lee Moore study area. The study focus for the LMWBMS included
the following tasks: identification of drainage problems and the impact of development in the
area; hydrology; hydraulics; identification of flood and erosion hazard remediation solutions;
identification of preservation corridors; alternative development; development criteria;
implementation plan; stakeholder involvement; and public involvement and coordination. The
original scope for the LMWBMS was developed in conjunction with the staff at the PCRFCD,
and specific efforts have evolved over the span of the project that has encompassed more than
two years. These efforts included multi-duration storm distribution evaluations and expanded
two-dimensional modeling analyses (performed by subconsultant JE Fuller Hydrology &
Geomorphology, Inc.) that are incorporated in the study results presented in this report.
2.2.3 Project Participation
Development of the Lee Moore Wash Basin Management Study focus and direction involved
the participation of numerous agencies and entities from the project’s initiation. Monthly project
update meetings were held that included representatives of various staff from the Pima County
Regional Flood Control District (PCRFCD), Pima County Department of Transportation, City of
LEE MOORE WASH BASIN MANAGEMENT STUDY – SUMMARY REPORT
12
Tucson, Town of Sahuarita, Tucson Water, as well as the Arizona State Land Department.
Public and private stakeholder meetings were held at specific stages of the project intended to
update interested parties, as well as gather insight on the project from the attendees. Meetings
were also scheduled with the general public. Many of the representatives at the stakeholder and
project update meetings were also involved in workgroup and focus group sessions to develop
concepts and alternatives that ultimately served as recommended alternatives for the
LMWBMS. In this manner, the proposed direction of the study represents the result of a
collaborative effort of all stakeholder interests within the project area.

LEE MOORE WASH BASIN MANAGEMENT STUDY – SUMMARY REPORT
13
3.0 Existing Conditions
3.1 STUDY AREA (summarized from Stantec, 2008a)
The Lee Moore Wash watershed is situated within southeastern Pima County, with the
watershed headwaters lying within the upper elevations of the Santa Rita Mountains. The Santa
Cruz River runs along the western margin of the study area, and ultimately collects runoff from
all drainage areas within the Lee Moore Wash basin. The study area is generally composed of
six jurisdictional entities, with the unincorporated areas of Pima County encompassing the
majority of the area. The City of Tucson has annexed the northern portion of the study area,
while the Town of Sahuarita (currently occupying a limited area along the southwest margin of
the study area) plans to eventually expand easterly beyond current corporate limits. The
southern portions of the study are located within the Coronado National Forest and the Santa
Rita Experimental Range (SRER). A brief description of existing conditions documented with the
study is presented below. A more detailed discussion is provided in the Existing Conditions
Analysis Report (Stantec, 2008a), submitted as a separate document.
3.1.1 Land Development
The majority of the land within the Lee Moore Wash Basin Management Study area is managed
by governmental entities and is presently undeveloped. The U.S. government holds title to the
Coronado National Forest, while the U.S. Bureau of Land Management (BLM) ownership
includes about 2500 acres. About 900 acres of the area is comprised of the Tohono O’Odham
Nation lands (San Xavier District). The State of Arizona ownership includes about 62,000 acres
of state trust land, as well as the Santa Rita Experimental Range. The Arizona State Land
Department plans and manages the state trust lands, which over the long-term are sold at
public auction for residentially zoned properties, or leased for commercial parcels with proceeds
benefiting the public school system.
The private land holdings have developed as rural residential, with limited areas of suburban
residential land uses. The rural residential land uses typically consist of four acre-sized lots
within unrecorded ‘wildcat’ subdivisions dispersed throughout the study area. Suburban
residential land uses are concentrated near the intersection of Sahuarita Road and Houghton

LEE MOORE WASH BASIN MANAGEMENT STUDY – SUMMARY REPORT
14
Road in Corona de Tucson, as well as the New Tucson area situated to the east. Master
planned communities in the region include Santa Rita Ranch located southeast of the
Sahuarita/Houghton intersection, and Rancho Sahuarita situated immediately west of the study
area. Both master planned communities include various sized single-family detached
residential lots. One of the more intensely developed areas is located within the northwest
portion of the project area along the Nogales Highway corridor, and is generally known as the
Summit area. Many of the existing drainage problems within the project area are located within
unrecorded subdivisions, such as in the Summit area, as well as older recorded subdivisions
within the New Tucson and Corona de Tucson areas. Older unrecorded developments within
the Sahuarita area in the southwest portion of the watershed also experience existing flood-
related issues.
3.1.2 Environmental Setting
Environmentally sensitive lands, including riparian habitat resources, biological corridors,
historic and cultural sites within the Lee Moore Wash Basin Management Study area have been
designated for conservation purposes by various jurisdictional plans. The Pima County Sonoran
Desert Conservation Plan (SDCP) is a long-range conservation plan that seeks to protect and
enhance the natural and cultural environment. The planning efforts of the SDCP focused on six
elements, including Habitat Corridors, Cultural Resources, Mountain Parks, Ranch
Conservation and Riparian Protection. The County’s plan is structured to reflect the natural
system through the conservation of large landscape reserve areas, including parks, preserves
and riparian resources in order to provide protection of endangered and vulnerable species.
The Pima County Conservation Land System and Riparian Resources elements of the SDCP
identified biological resource areas and corridors throughout the Lee Moore Wash Basin Study
area. According to the Conservation Land System policies, Important Riparian Areas have the
highest level of biological resources and should retain 95% of their existing resources, while the
Biological Core Management Areas located primarily in the southeast portion of the study area
should retain 80% of their biological resources. Pima County’s Watercourse and Riparian
Habitat Protection ordinance has also designated and mapped ‘regulated riparian habitat’
including Important Riparian Areas and Xeroriparian habitats within the study area. Important
Riparian Areas are valued for their higher water availability, vegetation density and biological
corridors, whereas Xeroriparian habitats are generally associated with an ephemeral water
supply.
LEE MOORE WASH BASIN MANAGEMENT STUDY – SUMMARY REPORT
15
The City of Tucson in 2006 prepared the Preliminary Draft Habitat Conservation Plan (HCP) that
includes the Southlands sub-area, which represents 25,620 acres of city annexed land that is
situated within the Lee Moore Wash Basin Management Plan area. The City’s HCP is intended
to promote conservation of natural resources while providing for future growth, as well as
complement other regional conservation planning efforts such as Pima County’s SDCP. The
primary component of the HCP Southlands conservation program is the protection of habitat
within the Petty Ranch and Fagan watersheds.
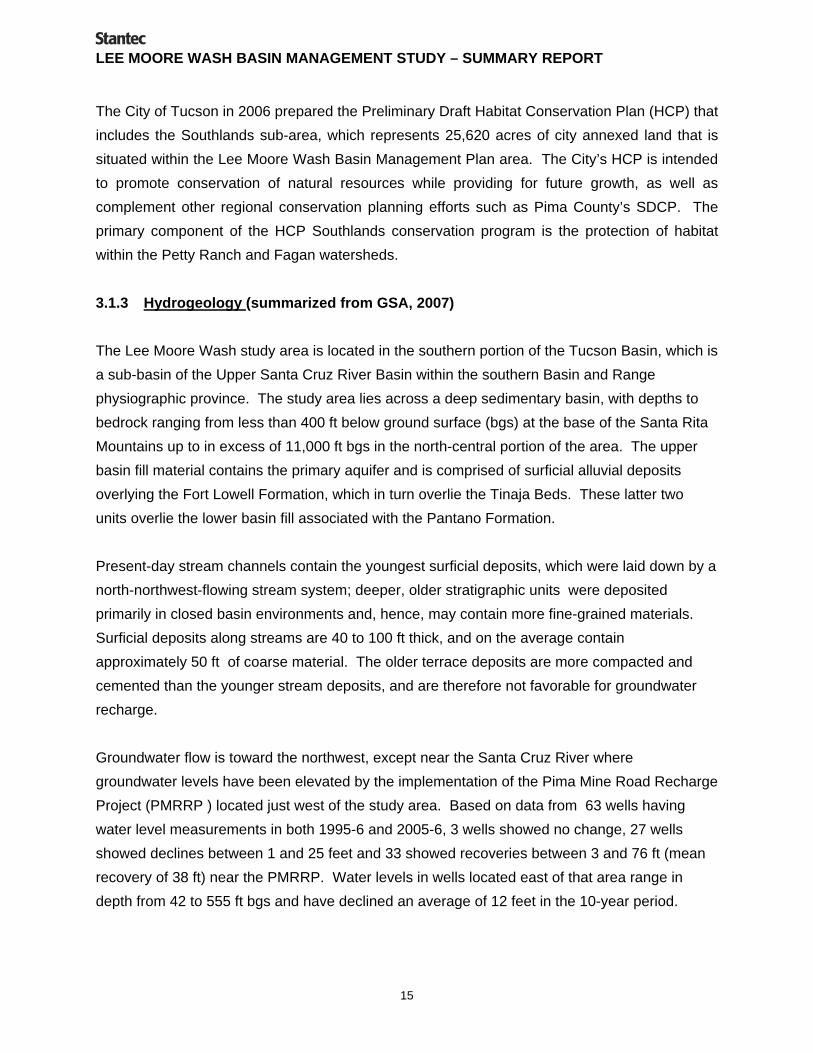
3.1.3 Hydrogeology (summarized from GSA, 2007)
The Lee Moore Wash study area is located in the southern portion of the Tucson Basin, which is
a sub-basin of the Upper Santa Cruz River Basin within the southern Basin and Range
physiographic province. The study area lies across a deep sedimentary basin, with depths to
bedrock ranging from less than 400 ft below ground surface (bgs) at the base of the Santa Rita
Mountains up to in excess of 11,000 ft bgs in the north-central portion of the area. The upper
basin fill material contains the primary aquifer and is comprised of surficial alluvial deposits
overlying the Fort Lowell Formation, which in turn overlie the Tinaja Beds. These latter two
units overlie the lower basin fill associated with the Pantano Formation.
Present-day stream channels contain the youngest surficial deposits, which were laid down by a
north-northwest-flowing stream system; deeper, older stratigraphic units were deposited
primarily in closed basin environments and, hence, may contain more fine-grained materials.
Surficial deposits along streams are 40 to 100 ft thick, and on the average contain
approximately 50 ft of coarse material. The older terrace deposits are more compacted and
cemented than the younger stream deposits, and are therefore not favorable for groundwater
recharge.
Groundwater flow is toward the northwest, except near the Santa Cruz River where
groundwater levels have been elevated by the implementation of the Pima Mine Road Recharge
Project (PMRRP ) located just west of the study area. Based on data from 63 wells having
water level measurements in both 1995-6 and 2005-6, 3 wells showed no change, 27 wells
showed declines between 1 and 25 feet and 33 showed recoveries between 3 and 76 ft (mean
recovery of 38 ft) near the PMRRP. Water levels in wells located east of that area range in
depth from 42 to 555 ft bgs and have declined an average of 12 feet in the 10-year period.

LEE MOORE WASH BASIN MANAGEMENT STUDY – SUMMARY REPORT
16
Regional groundwater levels below riparian habitat corridors identified by Pima County within
the study area are well below the maximum depth (10-30 feet bgs) typically used by facultative
phreatophytes, such as mesquite, which inhabit these zones. Although the groundwater
elevation data in some areas are sparse, these data indicate that the riparian species in these
areas are most likely supported by seasonal precipitation stored within the vadose zone (i.e.
perched water), and are not connected to the regional aquifer system.
3.1.4 Drainage
Existing drainage infrastructure within the area is limited, and was documented using a variety
of available sources, including locations identified from field survey. In addition to the existing
drainage infrastructure, over 100 locations of existing stock ponds and historic flow diversions
were identified by review of available existing aerial photography. Locations of all drainage
structures and stock ponds were located through the use of a GIS database, and base maps
developed for the project area.
Extensive drainage complaints within the Lee Moore Wash watershed have been recorded over
the last 10 years by Pima County. These complaints were sorted into three general categories
on the basis of each complaint’s primary drainage emphasis; flooding issues, roadway or
access issues, and conveyance or ponding issues. The locations of each complaint within the
Lee Moore watershed are also mapped through the use of a GIS database. In general, the
complaints relate flooding issues within the Lee Moore watershed predominantly to undersized
culvert crossings, limited access due to roadway flooding and shallow sheetflow flooding.
Newspaper articles from 2005-2006 document that monsoon rains had caused several flooding
incidents within the Lee Moore Wash watershed area, predominantly along Franco Wash and
associated areas near Old Nogales Highway and Old Vail Connection. This area, known as the
Summit area, has experienced significant population growth in recent years, and much of the
growth has occurred within ‘wildcat” development. These areas typically require little regulation
relative to permitting along floodprone areas. This circumstance combined with heavy rainfall
events in August of 2005 and 2006 led to flooding of mobile homes, along with access problems
along private and public roadways. Due to these issues, a more in-depth study was performed
in this area, and mitigation measures were evaluated in order to determine the feasibility of
providing flood relief to these areas as a joint effort between Pima County and existing residents
in the area. A summary of these efforts is presented in Section 3.3 of this report.
LEE MOORE WASH BASIN MANAGEMENT STUDY – SUMMARY REPORT
17
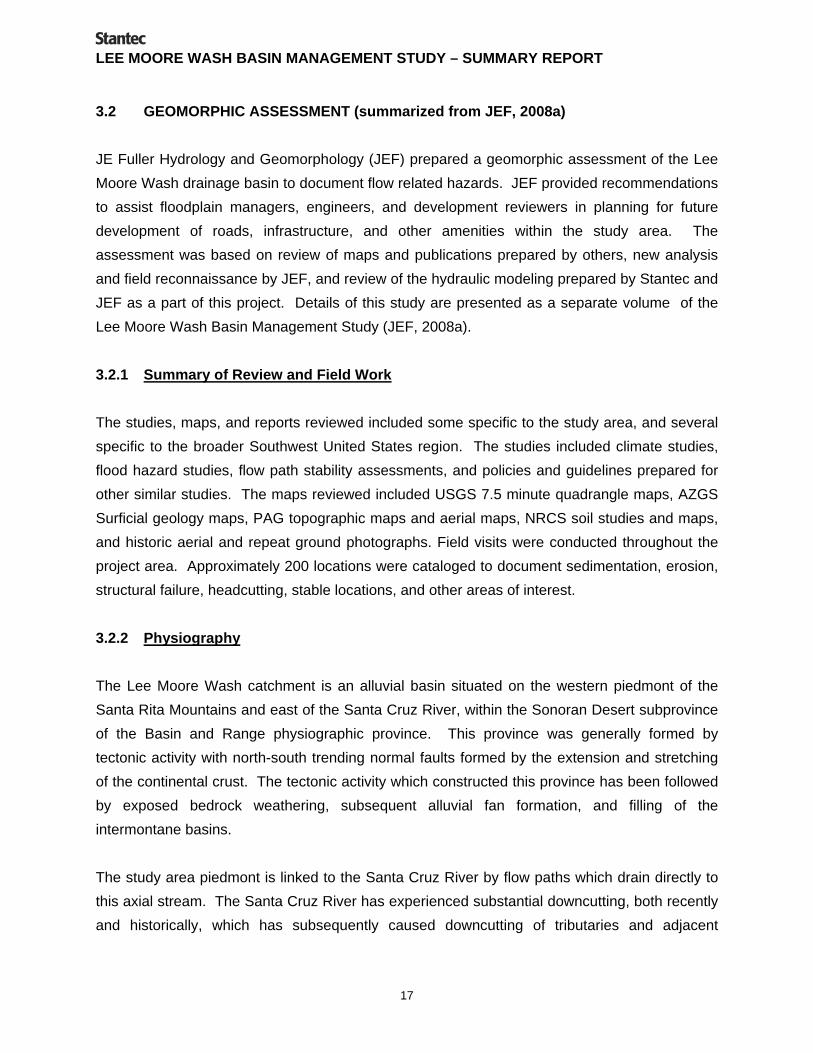
3.2 GEOMORPHIC ASSESSMENT (summarized from JEF, 2008a)
JE Fuller Hydrology and Geomorphology (JEF) prepared a geomorphic assessment of the Lee
Moore Wash drainage basin to document flow related hazards. JEF provided recommendations
to assist floodplain managers, engineers, and development reviewers in planning for future
development of roads, infrastructure, and other amenities within the study area. The
assessment was based on review of maps and publications prepared by others, new analysis
and field reconnaissance by JEF, and review of the hydraulic modeling prepared by Stantec and
JEF as a part of this project. Details of this study are presented as a separate volume of the
Lee Moore Wash Basin Management Study (JEF, 2008a).
3.2.1 Summary of Review and Field Work
The studies, maps, and reports reviewed included some specific to the study area, and several
specific to the broader Southwest United States region. The studies included climate studies,
flood hazard studies, flow path stability assessments, and policies and guidelines prepared for
other similar studies. The maps reviewed included USGS 7.5 minute quadrangle maps, AZGS
Surficial geology maps, PAG topographic maps and aerial maps, NRCS soil studies and maps,
and historic aerial and repeat ground photographs. Field visits were conducted throughout the
project area. Approximately 200 locations were cataloged to document sedimentation, erosion,
structural failure, headcutting, stable locations, and other areas of interest.
3.2.2 Physiography
The Lee Moore Wash catchment is an alluvial basin situated on the western piedmont of the
Santa Rita Mountains and east of the Santa Cruz River, within the Sonoran Desert subprovince
of the Basin and Range physiographic province. This province was generally formed by
tectonic activity with north-south trending normal faults formed by the extension and stretching
of the continental crust. The tectonic activity which constructed this province has been followed
by exposed bedrock weathering, subsequent alluvial fan formation, and filling of the
intermontane basins.
The study area piedmont is linked to the Santa Cruz River by flow paths which drain directly to
this axial stream. The Santa Cruz River has experienced substantial downcutting, both recently
and historically, which has subsequently caused downcutting of tributaries and adjacent

LEE MOORE WASH BASIN MANAGEMENT STUDY – SUMMARY REPORT
18
piedmonts. Fan surfaces which were once active and aggrading became isolated, and are
currently experiencing degradation.
Annual runoff within the study area is relatively low, less than 13 inches, and typical of the
southwest United States. A hydrologic year will usually have two peaks in precipitation, with
one in the winter and one in the summer. On average, July and August have the greatest total
rainfall depths of the year, and this combined volume can accumulate as much runoff as the rest
of the year. While rainfall is relatively rare throughout the year, intense rainfall can cause
important flash flood responses within the basin.
Drainage within the basin is towards the west and northwest, ultimately discharging to the Santa
Cruz River. The flow patterns vary within the basin; tributary flow occurs in the upper basin,
distributary flow within the lower to middle portion of the piedmont plain, and incised tributary
flow near the Santa Cruz River. The vegetation within the majority of the basin is Sonoran
Desert Scrub, however grassland areas are found within the higher elevations. Vegetation
within the basin is currently in good condition in most of the undeveloped areas.
3.2.3 One and Two Dimensional Flow Areas
JEF delineated a boundary between one-dimensional and two-dimensional flow modeling based
on field reconnaissance and review of topographic maps and aerial maps which determined
locations of flow divergences and confluences. Topography was analyzed for slope and contour
shape, namely crenulation indicating containment of flows. This boundary was used to support
the delineation of those areas which could be modeled with HEC-HMS and HEC-RAS versus
those which should be modeled with FLO-2D.
3.2.4 Flow Related Hazards
Flow related hazards include distributary flow, headcutting, lateral erosion and migration,
sedimentation, and localized scour. Headcutting and lateral erosion risks are greatest in the
northwest and furthest down-gradient parts of the basin. Locally induced headcutting occurs
basin wide and may be a result of upstream influences and human activity (discharge
concentration and/or sediment reduction). Lateral migration and distributary flow are found
throughout the lower piedmont. Sedimentation is limited to flow corridors, and primarily within
distributary flow areas.

LEE MOORE WASH BASIN MANAGEMENT STUDY – SUMMARY REPORT
19
3.2.5 Geomorphic Study Zones
The study area was divided into four broad geomorphic zones based upon similar land forms,
flow related hazards, and drainage characteristics. The purpose of delineating these zones was
to simplify the study and identify broad areas with similar geomorphic features and hazards. The
soils and surficial geologic units characterizing each zone were identified along with their
important characteristics. In addition, the lateral (flow containing) and longitudinal slopes were
evaluated along with their relation to flow patterns, and field reconnaissance within each zone
was performed. Zone-representative ground and aerial photographs, in addition to many
location specific photographs, document certain risks of flooding, erosion, sedimentation, lateral
migration, headward erosion, and notable drainage crossings.
Beginning up-gradient, the zones include the Pediment Zone and three piedmont plane
subdivisions: the Tributary Piedmont Zone, the Distributary Piedmont Zone, and the Incised
Zone. A brief description of each zone is provided below, and Figures 2 and 3 illustrate these
zones in profile and plan view as they pertain to the Lee Moore Wash drainage basin.
3.2.5.1 Pediment Zone
Sediment production occurs within this zone that is predominantly composed of weathered
bedrock and weathered bedrock covered with a relatively thin alluvium veneer. Drainage within
the Pediment Zone is contained within well-defined corridors with significant lateral relief.
Erosion is limited, confined between bedrock canyon walls and within floodplain corridors.
Sedimentation and headcutting are basically nonexistent in this zone.
3.2.5.2 Tributary Piedmont Zone
This zone represents a transition from sediment production to sediment transport. The
drainage, along with active erosion and sedimentation, are predominantly contained in well-
defined wash corridors. Erosion occurs on the isolated, relict alluvial fan surfaces, and lateral
migration is minimal due to the substantial lateral relief and vegetated bank lines. Headcutting
occurs in this zone, but at a reduced scale compared to the remaining piedmont plane zones.

LEE MOORE WASH BASIN MANAGEMENT STUDY – SUMMARY REPORT
20
Figure 2 - Geomorphic Zones Location Map

LEE MOORE WASH BASIN MANAGEMENT STUDY – SUMMARY REPORT
21
Figure 3 - General profile of study area with flow related hazards and geomorphic components

LEE MOORE WASH BASIN MANAGEMENT STUDY – SUMMARY REPORT
22
3.2.5.3 Distributary Piedmont Zone
Flow is not only contained in large wash corridors within this zone, but is also prevalent in the
smaller swales on the terraces along with uncontained flow on the terraces and floodplains.
Large washes and flow corridors provide sediment transport, while the adjacent distributary
areas provide transport accompanied by sedimentation. Active erosion, sedimentation, and
avulsion are found throughout the zone and are accelerated by human activity. There is a
significant potential for lateral migration and stream piracy within this zone. Headcutting
extends upstream from the Incised Zone into this zone, and may be the greatest hazard along
many flow paths. The Distributary Piedmont Zone includes large areas of isolated relict fan
surfaces which are developing internal drainage networks subject to erosive activity and
headcutting.
3.2.5.4 Incised Zone
This is a sediment transport zone significantly impacted and formed by system-wide
headcutting, driven in great part by the headward erosion emanating from the lowering of the
base level of the Santa Cruz River. The washes within this zone have developed into significant
flow corridors that typically contain flows. Sedimentation and lateral migration are limited
predominantly to the major wash corridors. The risk of these processes may be greatest at
stream confluences, with additional erosion and sedimentation risks present on the older
terraces.
3.2.6 Geomorphic Risk Areas
The four geomorphic study zones were further divided into areas with more homogenous flow
related hazards. Along with position within the watershed, the dominant characteristics used to
delineate the geomorphic risk areas were distributary versus tributary flow patterns, risk of
headcutting, and lateral erosion and migration hazards. Each zone was assigned a risk label for
headcutting, lateral erosion, and lateral migration. Other factors were documented individually
for each zone. Figure 4 illustrates the results of this analysis.

LEE MOORE WASH BASIN MANAGEMENT STUDY – SUMMARY REPORT
23
Risk Area 1 2 3 4 5 6 7 8 9 10 11 12 13 14 15 16 Headcutting Risk 5 5 4 4 3 4 3 3 3 2 2 1 2 2 1 0
Lateral Erosion Risk 4 5 4 4 3 4 3 3 3 2 2 1 2 1 1 0 Lateral Migration Risk 4 4 2 2 3 4 4 4 4 4 2 2 2 1 1 0
Code 0 1 2 3 4 5 Explanation Negligible Low Moderate High Very High Extreme
Figure 4 - Geomorphic risk areas

LEE MOORE WASH BASIN MANAGEMENT STUDY – SUMMARY REPORT
24
3.2.7 Significant Distributary Flow Corridors
Distributary flow corridors were delineated within the Distributary Piedmont Zone. These
corridors represent the portion of the flow area which is most important to maintain in order to
minimize disruption of fluvial geomorphic processes. The flood maps prepared by JEF and
Stantec were superimposed over the surficial geology maps, and corridors were drawn where
recent (Holocene) surficial geology units are within the delineated floodplains.
3.3 HYDROLOGIC AND HYDRAULIC ANALYSES
The Lee Moore drainage basin extends from the Santa Rita Mountains in the east/ southeast
portion of the project area to the Lee Moore Wash and Santa Cruz River along the western
margin of the watershed. The northernmost watersheds; Franco Wash, Flato Wash, and
Summit Wash, represent relatively well-defined drainage areas, and with the exception of
specific watercourse reaches, lent themselves to traditional one-dimensional hydrologic and
hydraulic modeling techniques. Hydrologic and hydraulic modeling associated with these areas
was performed by Stantec Consulting. The central portion of Flato Wash and areas south
display far less watershed definition and channel development, and were analyzed using two-
dimensional FLO-2D hydrologic and hydraulic modeling. The area modeled employing these
modeling efforts represents approximately 65% of the total Lee Moore watershed, and includes
the Cuprite Wash, Fagan Wash, Sycamore Canyon Wash and Gunnery Range Wash. The two-
dimensional modeling was performed by JE Fuller Hydrology & Geomorphology, Inc. The
following sections present summaries of the two modeling techniques and associated results as
they pertain to the Lee Moore Wash Basin Management Study. Detailed reports associated with
these studies are presented in separate report volumes (Stantec, 2008b; JEF, 2008b)
3.3.1 One-Dimensional Modeling Analyses (summarized from Stantec, 2008b)
Since a significant portion of existing development along with future planned development are
situated within the northern portion of the Lee Moore watershed, these areas were the initial
focus of study for the project. It was during these early efforts that it was identified that only a
limited portion of the Lee Moore watershed effectively lent itself to standard one-dimensional
hydrologic and hydraulic methodologies. Whereas watershed delineation and flow corridor
definition within the Franco Wash was relatively straightforward, watershed definition and
channel confinement becomes increasingly diminished to the south. Thus, it was evident upon
completion of watershed delineations within the Franco and Flato watersheds that it would be
LEE MOORE WASH BASIN MANAGEMENT STUDY – SUMMARY REPORT
25
inappropriate to apply one-dimensional modeling techniques in watershed areas further south.
In fact, as the project proceeded, a relatively significant portion of the Franco and Flato Wash
watershed areas were ultimately modeled utilizing the two-dimensional procedures, with the
results manually incorporated into the final one-dimensional models.
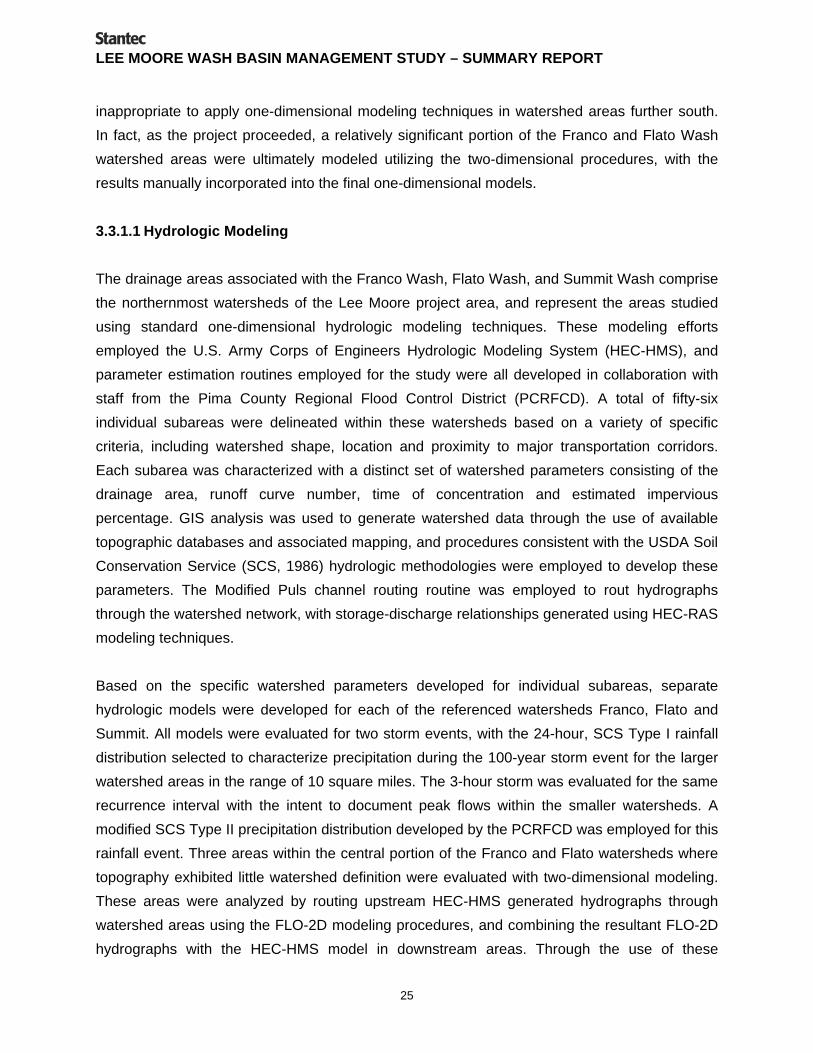
3.3.1.1 Hydrologic Modeling
The drainage areas associated with the Franco Wash, Flato Wash, and Summit Wash comprise
the northernmost watersheds of the Lee Moore project area, and represent the areas studied
using standard one-dimensional hydrologic modeling techniques. These modeling efforts
employed the U.S. Army Corps of Engineers Hydrologic Modeling System (HEC-HMS), and
parameter estimation routines employed for the study were all developed in collaboration with
staff from the Pima County Regional Flood Control District (PCRFCD). A total of fifty-six
individual subareas were delineated within these watersheds based on a variety of specific
criteria, including watershed shape, location and proximity to major transportation corridors.
Each subarea was characterized with a distinct set of watershed parameters consisting of the
drainage area, runoff curve number, time of concentration and estimated impervious
percentage. GIS analysis was used to generate watershed data through the use of available
topographic databases and associated mapping, and procedures consistent with the USDA Soil
Conservation Service (SCS, 1986) hydrologic methodologies were employed to develop these
parameters. The Modified Puls channel routing routine was employed to rout hydrographs
through the watershed network, with storage-discharge relationships generated using HEC-RAS
modeling techniques.
Based on the specific watershed parameters developed for individual subareas, separate
hydrologic models were developed for each of the referenced watersheds Franco, Flato and
Summit. All models were evaluated for two storm events, with the 24-hour, SCS Type I rainfall
distribution selected to characterize precipitation during the 100-year storm event for the larger
watershed areas in the range of 10 square miles. The 3-hour storm was evaluated for the same
recurrence interval with the intent to document peak flows within the smaller watersheds. A
modified SCS Type II precipitation distribution developed by the PCRFCD was employed for this
rainfall event. Three areas within the central portion of the Franco and Flato watersheds where
topography exhibited little watershed definition were evaluated with two-dimensional modeling.
These areas were analyzed by routing upstream HEC-HMS generated hydrographs through
watershed areas using the FLO-2D modeling procedures, and combining the resultant FLO-2D
hydrographs with the HEC-HMS model in downstream areas. Through the use of these

LEE MOORE WASH BASIN MANAGEMENT STUDY – SUMMARY REPORT
26
combined modeling techniques, existing 100-year peak flow estimates for each watershed were
generated at specific locations for planning purposes associated with the Lee Moore Wash
Basin Management Study.
3.3.1.2 Hydrologic Modeling Results
Figure 5 displays the three major watershed areas and the individual subarea delineations
employed in the one-dimensional hydrologic modeling analysis, and Table 1 presents a
summary of 100-year peak flows and drainage areas at key locations along the Franco Wash,
Table 1 Summary of 100-year Peak Discharges – One-Dimensional Modeling
Watershed General Location Drainage Area
(square mi.) 100-year Peak
Discharge (cfs)
Franco Wentworth Road 4.2 2188*
Franco Houghton Road - Fairgrounds 10.1 2586
Franco Wilmot Road 21.7 2782
Franco Swan Road. 22.7 2755
Franco Old Vail Connection 30.8 4449
Franco Nogales Highway 31.3 4394
Flato Sonoita Highway 3.4 2982*
Flato Wentworth road 14.2 5798
Flato Near Houghton Road 20 5694
Flato Wilmot Road 23.8 2106
Flato Near Swan Road 26.3 1979
Flato Nogales Highway 29.1 2193
Summit Old Nogales Highway 1.2 603*
Summit (tributary) Old Nogales Highway 1.1 470*
Summit Nogales Highway 2.4 1087*
Lee Moore Nogales Highway 142 20210
Lee Moore Santa Cruz River 178 21822
* Peak flow is based on the 3-hour storm. All others are based on the 24-hour

Legend
#* Location of FLO-2d Hydrograph/Cross-section
%, Junction Point of Combined Hydrographs
!. Subarea Concentration Point
Watershed Boundary
Cuprite Watershed
Flato Watershed
Franco Watershed
Summit Watershed
Unnamed Watershed
·Pima County
Vicinity Map
Figure 5______________Watershed Map
Displaying HEC-HMSSubareas
Stantec Consulting, Inc201 North Bonita Avenue Ste. 101
Tucson, AZ 85745-2999
Lee Moore WashBasin Management
Study
EE
E
FR1
FR2
FL3
FL1
FR6
FL11
FR3FR11
FR5
S1
FL2
FL20
S2
FL13
FL6
UN1
FR23
FL8
FR7
FL19
FL7
FR10FR4
FR17
FL9
FL18
FR20
FR26
FR22FR16
FL5
FR9
CU2
FL21
CU1FL4
FR25
FR19
FR21
FR14
FR23
FR8
FR13
FR18
FL12
FR12
S3
FR15UN2
UN3
FL10
S4
0 1 2 3
Miles
File
: W
:\a
ctiv
e\1
851
20
071
\GIS
(dire
cto
ry)\
pro
ject
\he
c-h
ms.
mxd
LEE MOORE WASH BASIN MANAGEMENT STUDY – SUMMARY REPORT
28
Flato Wash and Summit Wash. Peak flows for areas along the main flow corridors of Flato and
Franco typically represent values associated with the 24-hour storm, whereas peak flows for the
smaller watersheds are those estimated associated with the 3-hour storm event.
3.3.1.3 Hydraulic Modeling
Approximately 66 miles of 100-year floodplains were delineated through the use of the one-
dimensional U.S. Army Corps of Engineers River Analysis System (HEC-RAS) hydraulic
modeling routine. An additional 12-13 miles were mapped using two-dimensional FLO-2D
modeling in the areas previously noted. Generally, the threshold employed for these efforts
were watercourses experiencing a 100-year peak discharge of 1000 cfs or greater. However,
several channel reaches were mapped with peak flows less than this criterion, notably within the
Summit watershed and FLO-2D areas. For the one-dimensional HEC-RAS modeling, three-
dimensional surfaces were developed along designated flow corridors using available
topographic data and application of GEO HEC-RAS computer software. River cross-sections
were typically spaced at 500-foot intervals, however, cross-sections at 200-foot intervals were
evaluated along watercourses within the Summit area in order to evaluate potential flood
hazards in more detail. This area represents one of the more intensely developed areas within
the Lee Moore watershed, situated downstream of the Country Club Road alignment, and has
experienced significant flooding in recent years. Cross-sections were drawn along the channel
corridors developed with the GEO HEC-RAS software, and HEC-RAS hydraulic models were
developed from these data.
Since only the 100-year floodplains were evaluated, channel banks and roughness coefficients
were characterized assuming full-flow corridors, contrary to identifying low-flow channels that
play a larger role in characterizing floodplain areas of lesser storm events. Roughness
coefficients employed with the analyses are representative of typical values used in channel
investigations in other areas of Arizona, and were corroborated by literature references. Several
stock ponds and diversion berms were identified along many of the existing main channel
washes and tributaries evaluated, however, they were ignored in the modeling and mapping
efforts due to the potential failure of the structures. Therefore, floodplain limits developed within
the three-dimensional surfaces developed by GEO HEC-RAS software required editing to
eliminate potential model-interpreted effects associated with these structures, as well as
extraneous low-lying areas outside the potential flooding influence. Thus, the final mapping
efforts for the study represent a combination of the hydraulic modeling results, as well as
intuition and experience to assess situations outside the one-dimensional capabilities of the

LEE MOORE WASH BASIN MANAGEMENT STUDY – SUMMARY REPORT
29
HEC-RAS model. Generally speaking, the floodplain limits defined with the current study are
considered conservative, and intended for future planning efforts.
The 100-year peak flows generated for the major watersheds ranged from about 1100 cfs at the
mouth of the Summit watershed (3-hour storm) to an estimated 7500 cfs (24-hour storm) within
the Flato watershed along the main channel at the location that FLO-2D modeling was initiated.
The peak flow at the mouth of Flato Wash at Lee Moore Wash is estimated as approximately
2200 cfs, while the 100-year peak flow for Franco Wash at the Santa Cruz River is about 4300
cfs. Based on these flows, contiguous flood hazard areas were delineated from areas east of
Sonoita Highway within the Flato watershed to the Lee Moore Wash and Santa Cruz River.
Peak flows developed for the 24-hour storm event were employed for the floodplain mapping
along the main channel reaches where contributing watershed areas were in excess of 8-10
square miles, while peak flows generated from the 3-hour storm analyses were used to map
floodplains associated with smaller watershed areas. Floodplains ranged from fully-contained
channel flows to areas inundating several thousand feet in width within shallow sheetflow areas.
Figure 6 represents a composite map displaying the floodplains delineated with the HEC-RAS
modeling efforts, combined with the previously referenced three FLO-2D areas situated within
the central portion of the Franco and Flato watersheds. Several existing drainage structures
were evaluated with the HEC-RAS modeling, and results indicate that most major existing
culvert and bridge structures along the primary flow corridors have capacity to convey the 100-
year storm peak flows with nominal flooding impacts. A 100-year peak flow of 20,210 cfs is
estimated from the FLO-2D hydrologic modeling efforts for the Lee Moore watershed area,
representing cumulative runoff generated within areas south of the one-dimensional study area.
The specific concentration point of this peak flow is situated at the USPS railroad bridge located
north of Pima Mines Road in the western extent of the study area. A HEC-RAS model was
developed along the downstream channel of the Lee Moore channel, and indicates the existing
channel has marginal capacity to convey the 100-year peak flow within existing channel banks.
As displayed in Table 1, the estimated 100-year discharge of the Lee Moore Wash at the Santa
Cruz River for the 24-hour storm event is about 22,000 cfs, when combined with additional
tributary flows from the Flato watershed and Summit areas.

·Pima County
Vicinity Map
Figure 6______________
100-yr FloodplainsWithin One-Dimensional
Modeling Area
Stantec Consulting, Inc201 North Bonita Avenue Ste. 101
Tucson, AZ 85745-2999
Lee Moore WashBasin Management
Study
0 1 2 3
Miles
File
: W
:\a
ctiv
e\1
851
20
071
\GIS
(dire
cto
ry)\
pro
ject
\he
c-h
ms.
mxd
Legend
HEC-RAS Floodplain
FLO-2D Floodplain
LEE MOORE WASH BASIN MANAGEMENT STUDY – SUMMARY REPORT
31
3.3.2 Two-Dimensional FLO2D Modeling Analyses (summarized from JEF, 2008b)
As previously noted, during the hydrologic and geomorphic analyses, it was determined that a
relatively large portion of the study area is characterized by distributary flow to the extent that
standard watershed delineation and one-dimensional hydraulic modeling were deemed
ineffective. Therefore, a two-dimensional analysis of rainfall-runoff relationships within the
distributary flow areas of the Lee Moore Wash drainage basin was conducted by JE Fuller
Hydrology and Geomorphology (JEF) using the FLO-2D flood routing model (FLO-2D FRM).
The study area associated with these modeling efforts is shown in Figure 7.
3.3.2.1 Preliminary Modeling
In order to assure that the FLO-2D results are compatible with accepted Pima County hydrology
procedures, the SCS Curve Number (CN) procedure was incorporated into the FLO-2D FRM by
the authors of the FLO-2D program specifically for this project, based on the Pima County
Regional Flood Control District methodology for computing runoff. JEF verified that the FLO-2D
FRM generated acceptable and predictable results through a series of comparison tests, and
then proceeded with modeling approximately 136 square miles of the study area.
Given that the HEC-HMS model was employed for the remainder of the study area and
hydrographs would be shared between the models, JEF calibrated FLO-2D models to HEC-
HMS models by varying input and modeling parameters (within reasonable ranges), including
grid size, roughness coefficients, and roughness adjustment equation options. Following this,
JEF modeled the study area with 400-foot and 200-foot grid models to determine dominant flow
paths. Detailed modeling of the study area with 100-foot grid resolution was subsequently
performed, coupled with modeling of significant channels and berms within the FLO-2D model.
3.3.2.2 Detailed Models
The study area was sub-divided into seven sub-models to reduce individual model size and
runtime, and to allow for the use of two sources of elevation data. The elevation data utilized
were Digital Elevation Model (DEM) coverage and Digital Terrain Model (DTM) data from Pima
Association of Governments (PAG), in addition to USGS DEM data. The PAG coverage
includes most of the study area, from approximately 4 miles south of Sahuarita Road to beyond

LEE MOORE WASH BASIN MANAGEMENT STUDY – SUMMARY REPORT
32
Figure 7 - FLO-2D Modeling Area
the northern limits of the study area. To the south of the PAG coverage, USGS DEM data were
used. The USGS coverage is 10 meter resolution (compared to 8 foot for PAG). One 200-foot
grid model was prepared for the USGS DEM area, with output hydrographs input into the
downstream models as inflow. The areas with PAG coverage were modeled with six 100-foot
grid models. The previously prepared 200-foot grid model was used to determine major
watershed divide lines, which were then used to subdivide the model area. The model required

LEE MOORE WASH BASIN MANAGEMENT STUDY – SUMMARY REPORT
33
a total of 311,000 FLO-2D grid elements, including 650 with detailed channel sections and over
30 with levees.
Outflow was modeled at four locations:
1. Where the Lee Moore Wash channel crosses the Union Pacific Railroad Bridge.
2. The Flato Wash corridor at Wilmot Road.
3. In the Gunnery Range Wash area, north across Sahuarita Road.
4. The Gunnery Range Wash area, flowing west and about one mile south of Sahuarita
Rd.
Stantec incorporated Outflow Locations 1 and 2 into their HEC-HMS models, while locations 3
and 4 are considered breakout flow from the Lee Moore Wash watershed to the Santa Cruz
River. Inflow from the well-defined, upper reaches of the Flato and Cuprite watersheds was
modeled with hydrographs provided by Stantec that were generated with HEC-HMS models.
Flow paths break down between Wentworth Road and Houghton Road, therefore the HEC-HMS
modeling terminates and FLO-2D was used within the distributary areas of these watersheds.
3.3.2.3 Modeled Storm Events
Four storms were modeled, with the 100-year, 24-hour storm based on the SCS Type I rainfall
distribution modeled in the initial project phase. This model gave a satisfactory picture of the
overall basin response, including peak discharges in the significant flow corridors. However, it
was observed that discharges predicted in many of the smaller drainage paths were lower than
expected. Therefore, the model was rerun with the 100-year, 3-hour storm with a modified SCS
Type II rainfall distribution. This gave more appropriate discharges for the smaller drainage
areas, while over-predicting discharges in the primary flow corridors, especially the Flato and
Cuprite Wash corridors.
Since floodmaps were prepared documenting a single 100-year discharge and floodplain, it was
decided to report and delineate to the greater of the 3-hour and 24-hour storms up to a certain
threshold. Ten square miles of drainage area was determined to be a reasonable cutoff, as it is
unlikely that the 3-hour storm will be the dominant storm in watershed areas greater than this.

LEE MOORE WASH BASIN MANAGEMENT STUDY – SUMMARY REPORT
34
This approach provided a relatively clean delineation which includes the Flato Wash and the
Cuprite Wash, as well as the incised portions of the Gunnery Range Wash and Lee Moore
Wash. Thus, all reported peak discharges within these areas are based upon the 24-hour
model. Outside of these areas, the greater of the 3-hour or 24-hour discharges is reported.
A further goal of the project was to determine and delineate primary flow corridors. An initial
attempt was made by JEF to do this as a part of the geomorphic assessment by mapping the
youngest alluvial deposits. This generated flow corridors which were larger than what could be
reasonably regulated, and a more technical approach was desired. JEF therefore modeled the
10- and 25-year, 3-hour storms with the SCS Type II rainfall distribution. A small area was
mapped with both floodplains, and it was decided that the 10-year floodplain provides a
representative baseline for determining flow corridors.
3.3.2.4 Floodplain Mapping
Detailed flood mapping was conducted only within areas covered by PAG coverage. The flood
inundation maps were delineated by hand based upon the peak discharges predicted by the
FLO-2D model, and supported by normal depth modeling. Typically, floodplains were delineated
in areas where peak discharges in excess of 100 cfs were recorded, unless judgment indicated
either the FLO-2D runoff estimate may be low or no cross section was present, but runoff may
be over 100 cfs.
3.3.2.5 Summary Results
The final mapping indicates that approximately 48 square miles within areas with PAG coverage
(47 percent of said area) are prone to 100-year flood inundation of 100 cfs or more. The
predicted 100-year discharge within the Lee Moore Wash at the USPS (Union Pacific/Southern
Pacific) railroad crossing is 20,210 cfs. Peak discharges were recorded elsewhere at
approximately 1,900 other locations within distributary flow areas and along watercourses such
as the Gunnery Range Wash, Sycamore Wash, Fagan Wash, Cuprite Wash, Flato Wash, and
Petty Ranch Wash. Figures 8a through 8d show the locations of key concentration points within
the FLO-2D study area, and Table 2 provides their associated 100-year peak discharge.

LEE MOORE WASH BASIN MANAGEMENT STUDY – SUMMARY REPORT
35
Figure 8a – FLO-2D Area Key concentration points
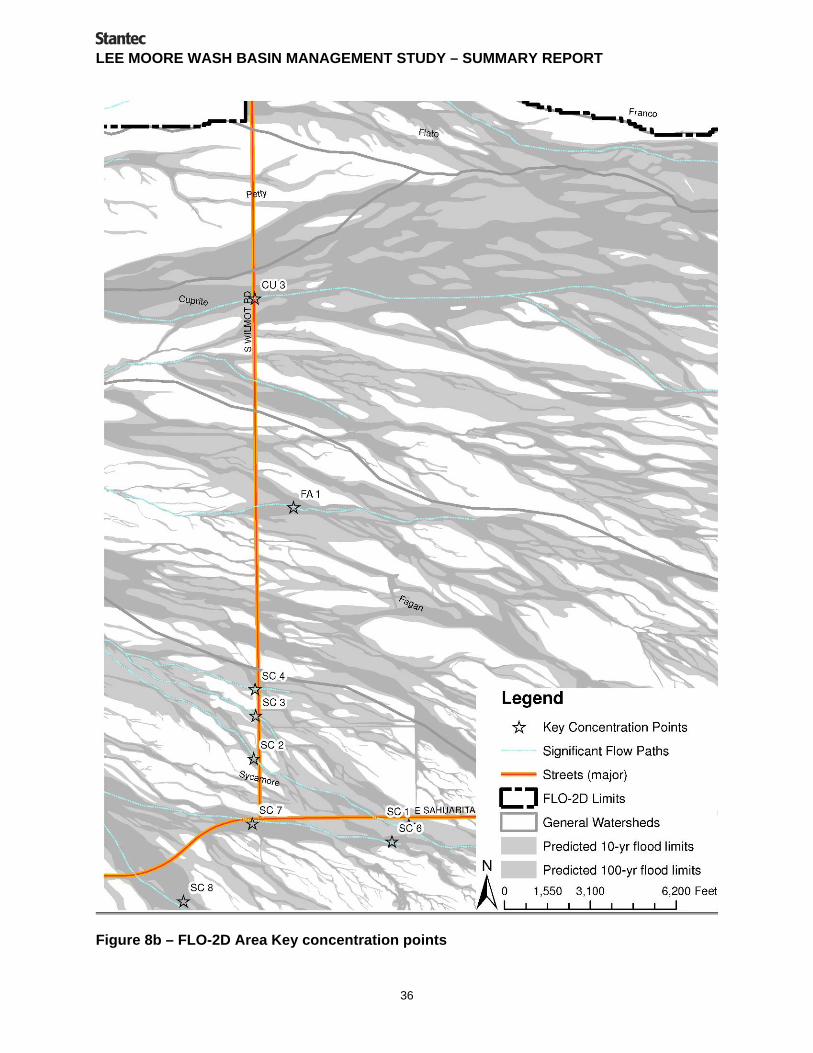
LEE MOORE WASH BASIN MANAGEMENT STUDY – SUMMARY REPORT
36
Figure 8b – FLO-2D Area Key concentration points

LEE MOORE WASH BASIN MANAGEMENT STUDY – SUMMARY REPORT
37
Figure 8c – FLO-2D Area Key concentration points

LEE MOORE WASH BASIN MANAGEMENT STUDY – SUMMARY REPORT
38
Figure 8d – FLO-2D Area Key concentration points

LEE MOORE WASH BASIN MANAGEMENT STUDY – SUMMARY REPORT
39
Table 2 - Summary of FLO-2D 100-year Peak Discharges
Concentration Point Reported Q-100
(cfs) Concentration Point Reported Q-100
(cfs) Breakout 1 4,480 GR 14 1,450 Breakout 2 4,020 LM 1 6,150 Breakout 3 10,420 LM 2 9,160 CU 1 1,240 LM 3 4,870 CU 2 4,260 LM 4 4,130 CU 3 2,290 LM 5 10,850 CU 4 6,750 LM 6 11,280 FA 1 2,560 LM 7 19,210 FA 2 3,100 LM 8 18,980 FA 3 9,810 LM 9 20,210 FA 4 2,760 PR 1 690 FA 5 7,390 PR 2 870 FA 6 6,760 PR 3 1,150 FL 1 5,780 PR 4 1,780 FL 2 1,840 SC 1 1,520 FL 3 5,690 SC 2 950 FL 4 2,120 SC 3 1,490 GR 1 1,560 SC 4 1,010 GR 2 400 SC 5 2,440 GR 3 1,930 SC 6 2,390 GR 4 1,290 SC 7 930 GR 5 1,070 SC 8 1,480 GR 6 140 SC 9 1,440 GR 7 400 SC 10 2,570 GR 8 470 SC 11 2,150 GR 9 420 SC 12 3,190 GR 10 1,200 SC 13 6,220 GR 11 2,860 SC 14 4,280 GR 12 4,480 SC 15 1,380 GR 13 430 SC 16 1,860
3.3.3 Summit Area Study
As previously noted, one of the more intensely developed areas is located within the northwest
portion of the Lee Moore Wash Basin Management Study project area along the Nogales
Highway corridor, and is generally known as the Summit area. This area is situated within the
downstream reach of the Franco Wash, and represents about a two-square mile residential area
bounded by Old Vail Connection Road and the Singing Cactus Lane alignment along the north

LEE MOORE WASH BASIN MANAGEMENT STUDY – SUMMARY REPORT
40
and south, respectively, and the Country Club Road alignment and Nogales Highway along the
east and west. The Summit Wash impacts the southern portion of the area. There are a few
small platted subdivisions within the area along with a limited number of County-maintained
roads, however, the vast majority of the development within the area are unplatted subdivisions
and lots. Many of the existing drainage problems reported within the LMWBMS project area are
experienced within the above-referenced unrecorded subdivisions. Given the nature of flooding
issues within the area, a more detailed study of the hydrology and hydraulics was authorized by
the PCRFCD as part of the Lee Moore Wash Basin Management Study in order to evaluate the
potential of developing site-specific drainage solutions. A summary of these efforts is presented
in the following discussion.
The intent of the study was to identify local watersheds that generate peak flows in excess of
100 cfs, the threshold defined by Pima County ordinance for regulatory 100-year floodplains.
Based on these criteria, each watershed within the Summit area in the range of 20 acres was
delineated, and 100-year peak flows were computed. The most recent version of the Pima
County Hydrology procedures, PC-Hydro Version 5 (PCRFCD, 2007), was utilized for these
calculations as per current Pima County ordinance. Since the Summit area is generally bisected
by the Franco Wash from southeast to northwest and the Summit Wash flows along the
southern section, many of the subareas identified with these efforts were generally small
tributary drainage areas flanking either side of these main washes. Additional areas that
discharge east toward Nogales Highway, as well as a larger tributary to Franco Wash (north of
the main Franco flow corridor) comprise the remainder of the watershed area impacting the
Summit residential areas. Figure 9 represents the watershed map generated with this study
along with 100-year peak flows at key locations. Peak discharge data sheets are provided within
the technical appendices for the LMWBMS Hydrology and Hydraulic Report.
Upon identification of watershed areas that generate peak flows meeting the regulatory
threshold, hydraulic models were developed using the USACE HEC-RAS computer model to
determine local regulatory 100-year floodplains within the Summit area. A map was generated
displaying these floodplain areas, as well as the regional floodplains for Franco Wash and
Summit Wash developed with the LMWBMS. The results of these efforts are presented in
Figure 10. Based on the data developed with this study, along with review of drainage
complaints and information gathered from meetings with residents, potential drainage solutions
to specific localized flooding areas were developed. The primary recommended alternatives
involved grading and/or clearing specific drainage paths in order to provide positive drainage
through the identified areas, as well as maintenance or upgrading of existing drainage culverts

·Pima County
Vicinity Map
Figure 9______________
Summit AreaWatershed Map
Stantec Consulting, Inc201 North Bonita Avenue Ste. 101
Tucson, AZ 85745-2999
Lee Moore WashBasin Management
Study
!.
!.
!.
!.
!.
!.
!.
!.
!.
!.
!.
!.
!.
!.
!.
!.!.
!.
!.
Q(100 )= 994cfs Q(100 )= 549cfs
Q(100 )= 427cfs
Q(100 )= 577cfs
Q(100 )= 217cfsQ(100 )= 259cfs
Q(100 )= 165cfs
Q(100 )= 315cfs
Q(100 )= 100cfs
Q(100 )= 125cfs
Q(100 )= 311cfs
Q(100 )= 341cfs
Q(100 )= 480cfs
Q(100 )= 239cfs
Q(100 )= 1178cfs
Q(100 )= 4,167cfs
Q(100 )= 4,187cfs
Q(100 )= 1,084cfs
Q(100 )= 4,129cfs
0 500 1,000 1,500
Feet
File
: W
:\a
ctiv
e\1
851
20
071
\GIS
(dire
cto
ry)\
pro
ject
\he
c-h
ms.
mxd
Legend
!. Concentration Point
Project Area
Watershed Delineation

·Pima County
Vicinity Map
Figure 10______________
Summit AreaLocal Floodplain Map
Stantec Consulting, Inc201 North Bonita Avenue Ste. 101
Tucson, AZ 85745-2999
Lee Moore WashBasin Management
Study
0 500 1,000 1,500
Feet
File
: W
:\a
ctiv
e\1
851
20
071
\GIS
(dire
cto
ry)\
pro
ject
\he
c-h
ms.
mxd
Legend
index
10' Contour Line
Project Area
Parcel Boundary
Regional Floodplain
Local Floodplain

LEE MOORE WASH BASIN MANAGEMENT STUDY – SUMMARY REPORT
43
The proposed conveyance swales would typically be 10-20 feet wide with a depth of about one
foot, and would convey flows associated with the smaller, frequent storms in a westerly,
northwesterly direction through the developed areas. Maps of the proposed location and
alignments of the conceptual improvements were generated, and are included in the Technical
Appendices (Stantec, 2008c) associated with the LMWBMS Hydrologic and Hydraulic Report.
The results of these efforts were presented to residents of the Summit area at public meetings.
However, due to private ownership conflicts, it was determined that implementation of the
proposed alternatives was not feasible at this time.
3.3.4 Santa Cruz River Study
The Santa Cruz River floodplain north of Pima Mine Road, an area that is adjacent to the
western margin of the LMWBMS study area and ultimately impacted to the north where the Lee
Moore channel discharges west underneath Nogales Highway, was investigated with the study.
The Santa Cruz River south of Pima Mine Road has been previously mapped in the FEMA FIS
study dated February 1999, however only a portion of the subject area north was mapped by
approximate methods, precluded because the area is situated predominantly within the Tohono
O’Odham reservation.
In the event that breakout flow from the Santa Cruz River would occur upstream of Pima Mine
Road as identified in a preliminary upstream study, it is apparent that flow from the south may
overflow both the Nogales Highway to the east and Pima Mine Road to the north. Review of
available aerial photography from the 1983 event indicates a situation similar to these
circumstances did occur during this flood event. The existing topography to the north of Pima
Mine Road and east presents several flow obstructions, and the flow distribution within the
eastern overbank of the Santa Cruz River under the given situation is complex, with several
areas of divided flow paths. These encroachments include an existing gravel pit northeast of the
Pima Mine Road and Nogales Highway intersection, and the Tucson Water recharge ponds to
the north and west of Nogales Highway. Thus, in order to estimate existing flood limits, several
different models were developed to evaluate hydraulic conditions surrounding these structures.
These models were all generated from identical cross-sections developed to characterize the
floodplain topography within these areas, with separate topographic constraints employed to
isolate specific areas and estimate flooding conditions. The following discussion provides a brief
description of the methods employed to separate each model and their base conditions. The
results are presented on a map in the Technical Appendices (Stantec, 2008c) of the LMWBMS

LEE MOORE WASH BASIN MANAGEMENT STUDY – SUMMARY REPORT
44
Hydrology and Hydraulic Report that displays the approximate flood limits associated with this
study, along with a more detailed discussion of the modeling efforts.
A three-dimensional surface and topography was generated for the study reach north of Pima
Mine Road using GEO HEC-RAS computer software, and strategic cross-sections identified and
employed with HEC-RAS modeling. Initial HEC-RAS modeling indicated five distinct areas of
divided flow, and separate models were developed for each specific reach. These reaches are
generally characterized as follows: the Santa Cruz River channel (Model 1), the ROB (right
overbank) between the river and Nogales Highway (Models 2 and 3), and the area east of
Nogales Highway (Models 4 and 5). In this manner, several different hydraulic conditions could
be efficiently evaluated, while providing reasonable estimates of potential flooding. The initial
modeling efforts also identified that each area of divided flow would have a distinct discharge,
predominantly dependent on the flow distribution upstream of Pima Mine Road. Since detailed
upstream modeling was not available, a simplified approach, along with an iterative process,
was utilized to determine the range of these potential discharges. On the basis of these
analyses and an estimated breakout flow of 36,000 cfs upstream of Pima Mine Road, it was
estimated that approximately 11,000 cfs would impact Pima Mine Road between the river and
Nogales Highway (Models 2 and 3), while a flow of 25,000 cfs flow is estimated to discharge to
the area east of Nogales Highway (Models 4 and 5). The Santa Cruz River channel flow was
estimated as 8800 cfs by the previously referenced study, and was employed along the main
river channel reach north of Pima Mine Road.
Flood limits along each reach associated with Models 1 to 5 were delineated, and are displayed
on the map previously referenced, along with the estimated discharges used with the modeling.
These results indicate that the majority of the area east of Nogales Highway and north of Pima
Mine Road may experience shallow flooding, as well as the areas west of the highway to the
Santa Cruz River. It is also worthy to note that the Lee Moore channel as studied in the overall
LMWBMS hydraulic analysis has marginal capacity for the estimated 100-year flow of 22,000
cfs generated by the Lee Moore Wash, however, the estimated 32,500 cfs associated with this
analysis may induce flooding within residential areas located along the Lee Moore overbank
areas to the north.

LEE MOORE WASH BASIN MANAGEMENT STUDY – SUMMARY REPORT
45
4.0 Public Involvement (summarized from CLW, 2009a)
The Public Involvement Plan for this project was designed to fulfill the promise of “consult” on
the International Association for Public Participation (IAP2) Spectrum of Public Participation: to
keep the public informed, listen to and acknowledge concerns and aspirations, and provide
feedback on how the public input was considered in the decision. The goal of the plan was to
bring more information into the study for consideration, along with providing additional
perspectives on alternatives in order to reach the best outcome, greater public understanding,
support and acceptance of the study and its final outcomes. The plan outlined 12 workgroup
meetings, 12 stakeholder meetings and six public meetings (three rounds of two meetings
each).
The actual effort materialized as seven workgroup meetings (three rounds of two meetings - one
for public agencies and one for private organizations; the final meeting combined both public
and private), seven stakeholder meetings (one each with Diamond Ventures, Pima Association
of Governments, Arizona State Land Department, Southern Arizona Home Builders Association
and Tucson Water, and two with City of Tucson staff), three rounds of two public meetings
(each round included a meeting on both the east and west sides of the study area, for a more
inclusive approach), and an additional public meeting was held in the Summit area to address
specific flooding and drainage needs in that area. Additionally, 10 focus group meetings were
held with staff from both public agencies and private organizations to collaboratively discuss and
edit the development criteria for the entire Lee Moore Wash Basin.
LEE MOORE WASH BASIN MANAGEMENT STUDY – SUMMARY REPORT
46
5.0 Alternative Identification Analysis
5.1 ALTERNATIVE DEVELOPMENT
One of the major components of the study, in conjunction with documenting existing drainage
conditions, was to identify specific alternatives and programs intended to mitigate existing
flooding problems. Additionally, these efforts also focused on preventing additional concerns
associated with future development anticipated within the project area. In order to develop
watershed-wide solutions, a comprehensive, systematic approach was employed intended to
evaluate the full range of potential alternatives in an objective manner, initially unrelated to cost
and viability. Rather, the alternatives were analyzed more on their merits in meeting
performance criteria identified by the project team. The five performance criteria are:
1. Public safety and flood hazard mitigation,
2. Implementation,
3. Environmental resources,
4. Sustainability, and
5. Planning and infrastructure
A weighted ranking hierarchy was developed among the five categories relative to their
importance when compared to each other. The weighting process was conducted using a
matched pair matrix with an interdisciplinary group of stakeholders. Workgroups for each of the
performance criteria were formed with project team members and stakeholders that were
knowledgable in each chosen discipline. These workgroups then developed a system of specific
criteria along with assigned weighting values for evaluation of the various alternatives.
Ultimately, recommended alternatives for the study were chosen on the basis of these
performance and specific criteria in the most objective manner as possible. The following
section provides a summary of the step-by-step process employed with this task.
5.1.1 Planning Areas
In order to effectively develop a program of recommended alternatives for the LMWBMS, it was
decided that the watershed area should be subdivided into smaller areas with similar hydrologic

LEE MOORE WASH BASIN MANAGEMENT STUDY – SUMMARY REPORT
47
and hydraulic characteristics, thus comparable issues. Additional watershed attributes such as
existing land use, future anticipated development and political jurisdiction were also taken into
consideration. Ultimately, the following four individual planning areas were identified;
1. Franco/Flato/Summit Wash watershed areas,
2. Cuprite/Fagan Wash watershed areas,
3. Sycamore Canyon/Gunnery Range Wash watershed areas, and
4. Area-Wide watershed.
The Franco, Flato and Summit watersheds were grouped into a single planning area since they
have the most defined riverine watercourses within their watersheds (see Section 3.1) and
display more existing development than areas to the south, thus presenting a distinct set of
flooding issues and existing problems.
The Cuprite and Fagan watersheds were identified as areas dominated by shallow, distributary
flow type watercourses, as were the Sycamore Canyon and Gunnery Range watersheds. These
planning areas were separated on the premise that the latter watersheds display less existing
development, and the southernmost portions of their drainage areas are comprised of
undevelopable government land associated with the Santa Rita Experimental Range and
Coronado National Forest.
The Area-Wide planning area was employed to assess problems generally consistent in all
areas associated with the LMWBMS. Figure 11 presents the watershed delineations of the three
major planning areas within the Lee Moore watershed. Based on the division of the watersheds
into separate planning areas, a comprehensive list of existing problem areas and associated
issues, both documented and/or evident from hydrologic and hydraulic analyses was compiled.
A similar list was developed for future issues within each planning area. This information was
combined into a single document (see Appendix) that ultimately served as the basis to develop
alternative solutions to address the concerns.

·Pima County
Vicinity Map
Figure 11______________
Lee Moore Wash Basin ManagementStudy Planning Areas
Stantec Consulting, Inc201 North Bonita Avenue Ste. 101
Tucson, AZ 85745-2999
Lee Moore WashBasin Management
Study
File
: W
:\a
ctiv
e\1
851
20
071
\GIS
(dire
cto
ry)\
pro
ject
\he
c-h
ms.
mxd
Franco/Flato/Summit
Cuprite/Fagan/Petty Ranch
Sycamore Canyon/Gunnery Range
TohonoO'Odham
Nation
City ofTucson
Sahuarita
Santa RitaExperimental Range
CoronadoNational Forest
PimaCounty
ApproximateSahuarita AFR
!"a$
!"d$
Sahuarita Rd
Ho
ug
hto
n R
d
Wil
mo
t R
d
Santa Rita Rd
No
ga
les
Hw
y
Legend
Planning Areas
0 2 41
Miles

LEE MOORE WASH BASIN MANAGEMENT STUDY – SUMMARY REPORT
49
5.1.2 Specific Criteria
As noted, the framework of the alternative analysis was based on the five performance criteria.
Stakeholder Workgroups were held to evaluate proposed alternatives within each of these five
performance criteria areas. The members of each workgroup were chosen on the basis of their
technical background, along with the intent to provide a representative cross-section of project
area stakeholders and team members. Workgroup meetings were scheduled, and specific
performance criteria were developed by group members. These specific criteria were
acknowledged as important indicators of how well an alternative achieved the given specific
criteria. These criteria were each assigned a value, or weighting factor, relative to their
importance on the basis of a total of 10, i.e. designating higher values associated with a higher
degree of importance. Finally, specific guidelines were developed in order to evaluate a
potential alternative’s success or failure to meet each of these performance criteria. These
criteria were also assigned numeric values in the range of 1 to 10, with a higher value indicating
the relative success of an alternative’s capacity to meet the functions defined by the
performance criteria. Ultimately, each alternative was judged using this process by the
workgroups, and assigned a total numeric value based on the product of the specific criteria
value and the specific performance criteria relative weighting, with a score of 100 representing
the highest score any alternative can attain within each workgroup.
5.1.3 Alternative Identification
Potential alternative solutions for the Lee Moore Wash Basin Management Study were
developed in a brainstorming session attended by members of the five performance criteria
workgroups. A GIS database was developed that included all existing data compiled to date,
including but not limited to mapped floodplains, riparian areas, infrastructure, jurisdictional
boundaries and future roadway alignments. The list of existing problem areas and future issues
were individually identified in each planning area, and a list of potential solutions was elicited
from workgroup members. Alternatives were developed from seed lists generated by the project
team, and generally were categorized as structural or non-structural options. As a part of the
brainstorming session, ideas were not evaluated on the basis of cost, feasibility or merit, rather,
all ideas were considered valid in order to develop a comprehensive suite of potential solutions.
A fatal flaw analysis was performed at a later date by members of the project team to eliminate
alternatives that were determined to be impractical or inappropriate for consideration, with the
final list (see Appendix) representing the alternatives chosen to be evaluated by the five
workgroups representing the major performance criteria.

LEE MOORE WASH BASIN MANAGEMENT STUDY – SUMMARY REPORT
50
5.1.4 Alternative Scoring
Each of the five workgroups; Public Safety, Implementation, Environmental Resources,
Sustainability and Planning/Infrastructure, were again assembled to evaluate each individual
alternative relative to the specific criteria previously determined by them. Maps were generated
that conceptually displayed the chosen alternatives, divided up into eight panels representing
the project area within the three different planning areas. These alternative exhibits were also
incorporated into the GIS database in order that alternatives could be spatially viewed, on an
as-needed basis, with respect to the variety of resources assembled on different map layers.
Workgroup members then evaluated each alternative on a case-by-case basis, assessing the
capacity of the proposed solution to meet the objectives of the performance requirements that
each workgroup had developed at their previous individual workgroup sessions, as outlined in
Section 4.1.2. Numeric values were assigned to each alternative on the basis of this analysis,
and were weighted per the performance criteria relative scale. A total score was then
developed by each workgroup leader for each alternative.
5.2 RECOMMENDED ALTERNATIVE ANALYSIS
5.2.1 Alternative Weighting
The total scores for each alternative developed by the five workgroups were employed in the
alternative weighting procedure to rank and compare each alternative on an objective basis. As
noted in Section 4.1, a ranking hierarchy for the five performance criteria was developed to rank
their relative importance in meeting the goals of the Lee Moore Wash Basin Management
Study. Similar to the specific performance criteria ranking within each workgroup, the weighting
factor was also based on a total value of ten, with the higher values representing increased
importance. These values were generated using a matrix analysis by comparing the relative
importance of each performance criteria to each other. The results of this analysis are
summarized in Table 3. These weighting factors were then applied to the total score for each
alternative from the individual workgroups, and a total score for all alternatives for each given
issue was computed. These scores were then tabulated relative to each other, and the top-
ranking scores were chosen for further evaluation.
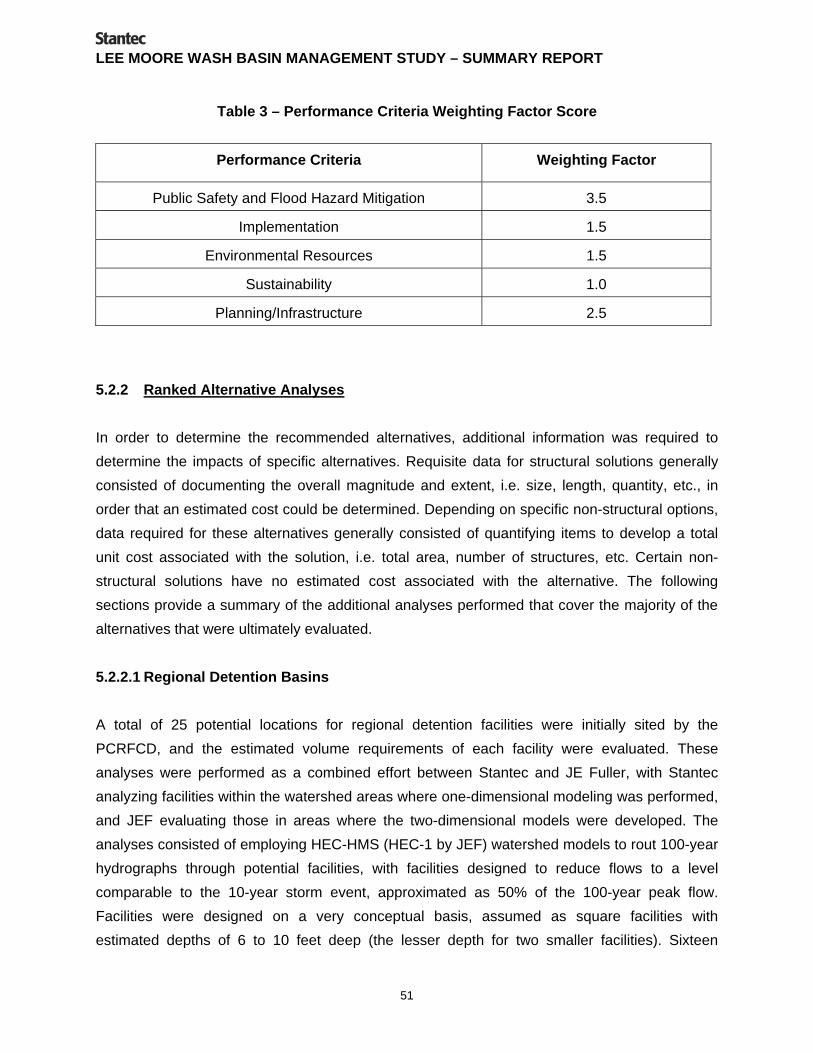
LEE MOORE WASH BASIN MANAGEMENT STUDY – SUMMARY REPORT
51
Table 3 – Performance Criteria Weighting Factor Score
Performance Criteria Weighting Factor
Public Safety and Flood Hazard Mitigation 3.5
Implementation 1.5
Environmental Resources 1.5
Sustainability 1.0
Planning/Infrastructure 2.5
5.2.2 Ranked Alternative Analyses
In order to determine the recommended alternatives, additional information was required to
determine the impacts of specific alternatives. Requisite data for structural solutions generally
consisted of documenting the overall magnitude and extent, i.e. size, length, quantity, etc., in
order that an estimated cost could be determined. Depending on specific non-structural options,
data required for these alternatives generally consisted of quantifying items to develop a total
unit cost associated with the solution, i.e. total area, number of structures, etc. Certain non-
structural solutions have no estimated cost associated with the alternative. The following
sections provide a summary of the additional analyses performed that cover the majority of the
alternatives that were ultimately evaluated.
5.2.2.1 Regional Detention Basins
A total of 25 potential locations for regional detention facilities were initially sited by the
PCRFCD, and the estimated volume requirements of each facility were evaluated. These
analyses were performed as a combined effort between Stantec and JE Fuller, with Stantec
analyzing facilities within the watershed areas where one-dimensional modeling was performed,
and JEF evaluating those in areas where the two-dimensional models were developed. The
analyses consisted of employing HEC-HMS (HEC-1 by JEF) watershed models to rout 100-year
hydrographs through potential facilities, with facilities designed to reduce flows to a level
comparable to the 10-year storm event, approximated as 50% of the 100-year peak flow.
Facilities were designed on a very conceptual basis, assumed as square facilities with
estimated depths of 6 to 10 feet deep (the lesser depth for two smaller facilities). Sixteen

LEE MOORE WASH BASIN MANAGEMENT STUDY – SUMMARY REPORT
52
facilities were evaluated assuming they would be constructed to mitigate existing flooding issues
in downstream locations, while nine facilities were evaluated assuming they might be installed
as future regional facilities to serve as part of a backbone drainage infrastructure for the Lee
Moore Wash Basin Management Study. The future condition facilities were evaluated based on
estimated hydrologic conditions assuming watershed areas were fully developed.
While regional detention facilities were a preferred alternative for many of the issue areas
identified within the planning areas, only four existing facilities ultimately were selected as
ranked alternatives. All of the future facilities were selected, as they were ranked together as an
individual alternative associated with developing drainage infrastructure for the Area-Wide
planning area. Based on these results, estimated costs associated with the construction of
these facilities were developed, with the basic criteria summarized in Section 4.2.2.3. All
facilities were assumed to provide multi-use benefits, such as recreational facilities and walking
trails, and facility sizes were consequently increased to account for these additional amenities.
5.2.2.2 Flow Corridors
The delineation and preservation of flow corridors throughout the Lee Moore Wash watershed
was also a preferred alternative to the majority of workgroups, thus resulting in the need to
quantify their impact. Since reduction of 100-year peaks to a 10-year discharge level was the
goal associated with the design of regional detention facilities, it was deemed appropriate to
consider the 10-year floodprone areas along significant watercourses as a zone to preserve as
a flow corridor. In this manner, frequent storms up to and including the 10-year event would flow
through the existing Lee Moore drainage network unimpeded, providing requisite water supply
to maintain riparian areas along with a balanced sediment transport regime. Thus, hydraulic
analyses were employed to delineate the 10-year floodplains, utilizing the HEC-RAS and FLO-
2D models within the representative areas associated with these modeling techniques. Since it
is proposed that the designated flow corridors be left natural and undisturbed for flow
conveyance, encroachment up to these limits may be allowed providing ordinance requirements
are met. Thus, the impact of this alternative was quantified by determining the total area to be
preserved, versus the total floodplain area, and assuming that the latter may serve as reclaimed
land potentially suitable for development. Thus, the estimated cost associated with this
alternative may be a resultant benefit to the private land owner.
LEE MOORE WASH BASIN MANAGEMENT STUDY – SUMMARY REPORT
53
5.2.2.3 Cost Estimates
An estimated cost was applied to all ranked alternatives where practical. Certain alternatives
represent solutions that would ultimately serve as guidelines and regulations, and thus have no
associated direct cost. The estimated costs were based on recent construction cost data
provided by the PCRFCD, while other costs were developed on the basis of past experience of
project team members with recent projects that were similar in nature. Additional cost data were
determined by review of internet databases as appropriate. These costs were utilized as a final
screening measure from which recommended alternatives were determined for the Lee Moore
Wash Basin Management Study.
5.3 RECOMMENDED ALTERNATIVES
5.3.1 Cost/Benefit Analysis
The final analysis employed to determine the recommended alternatives for the Lee Moore
Wash Basin Management Study involved developing a weighted score to compare alternatives
based upon their preference from the workgroups combined with their associated cost, similar to
a cost/benefit ratio analysis. This was performed by dividing the total score of each top-ranked
alternative by the estimated cost, thus providing the basis to compare each proposed solution
using all the data developed with these analyses. A final fatal flaw analysis was performed on
these data to eliminate alternatives that were outside the realm of practicality, as determined by
County staff and the project team. The remaining options were selected for further consideration
as the recommended alternatives for the study.
5.3.2 Summary of Recommended Alternatives
A total of sixteen different alternative solutions to the various identified drainage issues became
the final suite of recommended alternatives for the LMWBMS. The recommended alternatives
represent both structural and non-structural solutions, and several of the solutions are proposed
to mitigate issues in multiple locations. Sets of recommended alternatives were developed
separately to address problems identified within each planning area, as well distinct arrays of
alternatives for existing and future conditions. The detailed list of all the specific recommended
alternatives were tabulated in a final worksheet, and are presented in Tables 4 through 11 at the
end of this section. A brief summary of the chosen alternatives are discussed in the following
paragraphs.

LEE MOORE WASH BASIN MANAGEMENT STUDY – SUMMARY REPORT
54
Existing condition alternatives were generally specific in nature, as they were developed to
address distinct flooding-related circumstances. Structural alternatives intended to address
existing drainage issues ranged from the installation of new culverts, construction of channels
and/or bank stabilization and floodproofing of existing structures. Four locations were identified
where regional detention facilities may be considered to mitigate downstream flooding
problems. Non-structural alternatives would involve public education and outreach, roadway
access improvements, and potential implementation of the FLAP (Floodplain Land Acquisition
Program) and/or improvement districts. A program to evaluate and maintain issues associated
with the numerous stock ponds within the LMWBMS area is also a recommended alternative
related to the existing conditions analyses, but will be addressed with the adoption of the
Development Criteria generated with the future conditions alternatives discussed below.
Future recommended alternatives were much more broad-based in nature and, with the
exception of the construction of regional detention facilities aimed to serve as a backbone
drainage infrastructure, are generally non-structural in nature. In addition to generating the
above-noted Development Criteria, devoted toward providing regulations and guidelines for
future development within the area, the delineation of a network of flow corridors throughout the
study area was also a well-received recommended alternative to be implemented with future
growth. Public education and outreach, potential delineation of floodplains regulated by FEMA,
as well as recommended modifications and/or changes to future roadway alignments to avoid
floodprone areas were additional alternatives chosen with the future analyses. In addition to the
above-noted spreadsheet, the final recommended alternatives are also displayed spatially on
two sets of maps (existing and future) that accompany this report. A more detailed description of
the efforts associated with generating the Development Criteria for the LMWBMS is provided in
the following section of this report (Section 7.0)

Tab
le 4
Are
a-W
ide
Rec
om
men
ded
Alt
ern
ativ
es
Exi
stin
g C
on
dit
ion
s
Pla
nn
ing
A
rea
Alt
ern
ativ
e
Pu
blic
Saf
ety
and
Flo
od
H
azar
d
Mit
igat
ion
Imp
lem
enta
tio
nE
nvi
ron
men
tal
Res
ou
rces
Su
stai
nab
ility
Pla
nn
ing
an
d
Infr
astr
uct
ure
To
tal
Sco
re
Pro
bab
le
Co
nst
ruct
ion
C
ost
($)
To
tal S
core
d
ivid
ed b
y p
rob
able
co
nst
ruct
ion
co
stT
ota
l sco
re x
10
000
Wei
gh
ted
Val
ue
3.5
1.5
1.5
12.
510
Exi
stin
g P
rob
lem
Sta
tem
ent:
Flo
od
pro
ofi
ng
9790
7052
125
434
$180
,000
0.00
2412
24.1
Flo
od
pro
ofi
ng
9790
7052
125
434
$510
,000
0.00
0851
8.5
Flo
od
pro
ofi
ng
9790
7052
125
434
$240
,000
0.00
1808
18.1
En
sure
mai
nt
& o
per
atio
n o
f st
ock
po
nd
s/d
iver
sio
n
stru
ctu
res;
stu
dy
& a
nal
ysis
w
ith
fu
ture
dev
elo
pm
ent
5179
7368
158
428
$2,6
25,0
000.
0001
631.
6N
o A
ctio
n74
6870
4612
538
3
Pu
blic
Ed
uca
tio
n a
nd
O
utr
each
8311
270
5411
943
8$3
0,00
00.
0146
0014
6.0
Imp
rove
men
t D
istr
ict
113
8975
5014
347
0
Area Wide Alternatives
EX
IST
ING
PR
OB
LE
M A
RE
AS
25 d
rain
age
com
pla
ints
wit
hin
un
pla
tted
are
as n
ort
h o
f S
ahu
arit
a R
d;
60%
rel
ated
to
acc
ess
and
flo
od
ing
issu
es
20 d
rain
age
com
pla
ints
alo
ng
Wilm
ot
corr
ido
r u
np
latt
ed a
reas
; 35
% r
elat
ed t
o a
cces
s an
d f
loo
din
g is
sues
35 d
rain
age
com
pla
ints
wit
hin
un
pla
tted
are
as e
ast
of
Wilm
ot
Rd
; 40
% r
elat
ed t
o a
cces
s is
sues
Exi
stin
g S
tock
Po
nd
/Div
ersi
on
Str
uct
ure
s
En
han
ce P
ub
lic E
du
cati
on
an
d O
utr
each
Flo
od
ing
wit
hin
un
pla
tted
res
iden
tial
are
as

Tab
le 5
Fra
nco
/Fla
to/S
um
mit
Are
a R
eco
mm
end
ed A
lter
nat
ives
Exi
stin
g C
on
dit
ion
s
Pla
nn
ing
A
rea
Alt
ern
ativ
e
Pu
blic
Saf
ety
and
Flo
od
H
azar
d
Mit
igat
ion
Imp
lem
enta
tio
nE
nvi
ron
men
tal
Res
ou
rces
Su
stai
nab
ility
Pla
nn
ing
an
d
Infr
astr
uct
ure
To
tal
Sco
re
Pro
bab
le
Co
nst
ruct
ion
C
ost
($)
To
tal S
core
d
ivid
ed b
y p
rob
able
co
nst
ruct
ion
co
stT
ota
l sco
re x
10
000
Wei
gh
ted
Val
ue
3.5
1.5
1.5
12.
510
Exi
stin
g P
rob
lem
Sta
tem
ent:
Au
tom
atic
Bar
rica
de
Co
ntr
ol
8410
170
5411
942
7$3
00,0
000.
0014
2214
.2C
ulv
ert
8398
4142
150
414
$1,7
18,7
500.
0002
412.
4
Au
tom
atic
Bar
rica
de
Co
ntr
ol
8410
170
5411
942
7$3
00,0
000.
0014
2214
.2
Pu
blic
Ed
uca
tio
n a
nd
O
utr
each
8311
270
5411
943
8$3
0,00
00.
0146
0014
6.0
Pu
blic
Ed
uca
tio
n a
nd
O
utr
each
8311
270
5411
943
8$3
0,00
00.
0146
0014
6.0
Reg
ion
al d
eten
tio
n b
asin
118
8592
6098
452
$513
,110
0.00
0881
8.8
Pu
blic
Ed
uca
tio
n a
nd
O
utr
each
8311
270
5411
943
8$3
0,00
00.
0146
0014
6.0
Reg
ion
al d
eten
tio
n b
asin
118
8592
6098
452
$578
,920
0.00
0781
7.8
Pu
blic
Ed
uca
tio
n a
nd
O
utr
each
8311
270
5411
943
8$3
0,00
00.
0146
0014
6.0
FL
AP
256
6798
5714
562
3$1
,482
,000
0.00
0421
4.2
Ban
k S
tab
lizat
ion
132
9482
4617
052
4$3
,445
,200
0.00
0152
1.5
Franco/Flato/Summit Area Alternatives
EX
IST
ING
PR
OB
LE
M A
RE
AS
Old
Vai
l Ro
ad -
- F
ran
co W
ash
100
-yr
flo
w d
epth
7-8
fee
t
INS
TA
LL
BA
RR
ICA
DE
S A
S IN
TE
RIM
SO
LU
TIO
N -
CU
LV
ER
T P
OT
EN
TIA
L P
ER
MA
NE
NT
LO
NG
-TE
RM
ST
RA
TE
GY
FO
R A
LL
-WE
AT
HE
R A
CC
ES
SS
um
mit
Str
eet
-- F
ran
co W
ash
100
-yr
flo
w d
epth
3-4
ft
Flo
od
ing
alo
ng
Fra
nco
Was
h--
po
ten
tial
flo
od
ing
of
45-5
0 st
ruct
ure
s w
ith
in S
um
mit
Are
a
DE
VE
LO
P P
RO
GR
AM
TO
INF
OR
M &
ED
UC
AT
E R
ES
IDE
NT
S S
ITU
AT
ED
WIT
HIN
IDE
NT
IFIE
D L
OC
AL
FL
OO
DP
LA
INS
Flo
od
ing
alo
ng
Su
mm
it W
ash
--p
ote
nti
al f
loo
din
g o
f 30
-35
stru
ctu
res
fro
m C
ou
nty
Clu
b t
o N
og
ales
Hw
y
DE
VE
LO
P P
RO
GR
AM
TO
INF
OR
M &
ED
UC
AT
E R
ES
IDE
NT
S S
ITU
AT
ED
WIT
HIN
IDE
NT
IFIE
D L
OC
AL
FL
OO
DP
LA
INS
CO
ST
TO
BE
RE
-EV
AL
UA
TE
D T
O D
ET
ER
MIN
E IF
ES
TIM
AT
E M
AY
BE
LO
W
Ad
dit
ion
al f
loo
din
g a
lon
g F
ran
co T
rib
uta
ry s
ou
th o
f O
ld V
ail R
d
DE
VE
LO
P P
RO
GR
AM
TO
INF
OR
M &
ED
UC
AT
E R
ES
IDE
NT
S S
ITU
AT
ED
WIT
HIN
IDE
NT
IFIE
D L
OC
AL
FL
OO
DP
LA
INS
Flo
od
ing
alo
ng
Fla
to a
t O
ld N
og
ales
Hw
y
Mai
nte
nan
ce o
f L
ee M
oo
re C
han
nel
Ban
k P
rote
ctio
n/B
ank
Ero
sio
n
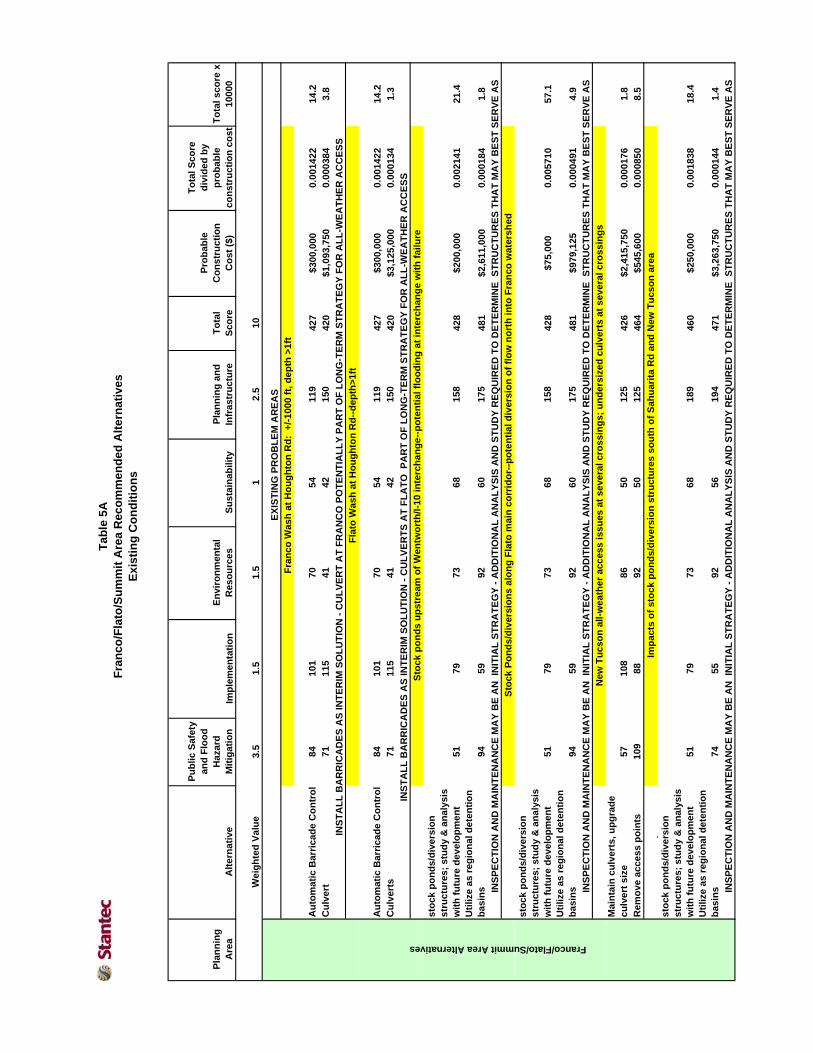
Tab
le 5
AF
ran
co/F
lato
/Su
mm
it A
rea
Rec
om
men
ded
Alt
ern
ativ
esE
xist
ing
Co
nd
itio
ns
Pla
nn
ing
A
rea
Alt
ern
ativ
e
Pu
blic
Saf
ety
and
Flo
od
H
azar
d
Mit
igat
ion
Imp
lem
enta
tio
nE
nvi
ron
men
tal
Res
ou
rces
Su
stai
nab
ility
Pla
nn
ing
an
d
Infr
astr
uct
ure
To
tal
Sco
re
Pro
bab
le
Co
nst
ruct
ion
C
ost
($)
To
tal S
core
d
ivid
ed b
y p
rob
able
co
nst
ruct
ion
co
stT
ota
l sco
re x
10
000
Wei
gh
ted
Val
ue
3.5
1.5
1.5
12.
510
Au
tom
atic
Bar
rica
de
Co
ntr
ol
8410
170
5411
942
7$3
00,0
000.
0014
2214
.2C
ulv
ert
7111
541
4215
042
0$1
,093
,750
0.00
0384
3.8
Au
tom
atic
Bar
rica
de
Co
ntr
ol
8410
170
5411
942
7$3
00,0
000.
0014
2214
.2C
ulv
erts
7111
541
4215
042
0$3
,125
,000
0.00
0134
1.3
pst
ock
po
nd
s/d
iver
sio
n
stru
ctu
res;
stu
dy
& a
nal
ysis
w
ith
fu
ture
dev
elo
pm
ent
5179
7368
158
428
$200
,000
0.00
2141
21.4
Uti
lize
as r
egio
nal
det
enti
on
b
asin
s94
5992
6017
548
1$2
,611
,000
0.00
0184
1.8
pst
ock
po
nd
s/d
iver
sio
n
stru
ctu
res;
stu
dy
& a
nal
ysis
w
ith
fu
ture
dev
elo
pm
ent
5179
7368
158
428
$75,
000
0.00
5710
57.1
Uti
lize
as r
egio
nal
det
enti
on
b
asin
s94
5992
6017
548
1$9
79,1
250.
0004
914.
9
Mai
nta
in c
ulv
erts
, up
gra
de
culv
ert
size
5710
886
5012
542
6$2
,415
,750
0.00
0176
1.8
Rem
ove
acc
ess
po
ints
109
8892
5012
546
4$5
45,6
000.
0008
508.
5
pst
ock
po
nd
s/d
iver
sio
n
stru
ctu
res;
stu
dy
& a
nal
ysis
w
ith
fu
ture
dev
elo
pm
ent
5179
7368
189
460
$250
,000
0.00
1838
18.4
Uti
lize
as r
egio
nal
det
enti
on
b
asin
s74
5592
5619
447
1$3
,263
,750
0.00
0144
1.4
Franco/Flato/Summit Area Alternatives
INS
TA
LL
BA
RR
ICA
DE
S A
S IN
TE
RIM
SO
LU
TIO
N -
CU
LV
ER
T A
T F
RA
NC
O P
OT
EN
TIA
LL
Y P
AR
T O
F L
ON
G-T
ER
M S
TR
AT
EG
Y F
OR
AL
L-W
EA
TH
ER
AC
CE
SS
Fra
nco
Was
h a
t H
ou
gh
ton
Rd
: +
/-10
00 f
t, d
epth
>1f
t
Fla
to W
ash
at
Ho
ug
hto
n R
d--
dep
th>
1ft
Sto
ck p
on
ds
up
stre
am o
f W
entw
ort
h/I-
10 in
terc
han
ge-
-po
ten
tial
flo
od
ing
at
inte
rch
ang
e w
ith
fai
lure
Imp
acts
of
sto
ck p
on
ds/
div
ersi
on
str
uct
ure
s so
uth
of
Sah
uar
ita
Rd
an
d N
ew T
ucs
on
are
a
INS
TA
LL
BA
RR
ICA
DE
S A
S IN
TE
RIM
SO
LU
TIO
N -
CU
LV
ER
TS
AT
FL
AT
O P
AR
T O
F L
ON
G-T
ER
M S
TR
AT
EG
Y F
OR
AL
L-W
EA
TH
ER
AC
CE
SS
INS
PE
CT
ION
AN
D M
AIN
TE
NA
NC
E M
AY
BE
AN
IN
ITIA
L S
TR
AT
EG
Y -
AD
DIT
ION
AL
AN
AL
YS
IS A
ND
ST
UD
Y R
EQ
UIR
ED
TO
DE
TE
RM
INE
ST
RU
CT
UR
ES
TH
AT
MA
Y B
ES
T S
ER
VE
AS
Sto
ck P
on
ds/
div
ersi
on
s al
on
g F
lato
mai
n c
orr
ido
r--p
ote
nti
al d
iver
sio
n o
f fl
ow
no
rth
into
Fra
nco
wat
ersh
ed
New
Tu
cso
n a
ll-w
eath
er a
cces
s is
sues
at
seve
ral c
ross
ing
s; u
nd
ersi
zed
cu
lver
ts a
t se
vera
l cro
ssin
gs
INS
PE
CT
ION
AN
D M
AIN
TE
NA
NC
E M
AY
BE
AN
IN
ITIA
L S
TR
AT
EG
Y -
AD
DIT
ION
AL
AN
AL
YS
IS A
ND
ST
UD
Y R
EQ
UIR
ED
TO
DE
TE
RM
INE
ST
RU
CT
UR
ES
TH
AT
MA
Y B
ES
T S
ER
VE
AS
INS
PE
CT
ION
AN
D M
AIN
TE
NA
NC
E M
AY
BE
AN
IN
ITIA
L S
TR
AT
EG
Y -
AD
DIT
ION
AL
AN
AL
YS
IS A
ND
ST
UD
Y R
EQ
UIR
ED
TO
DE
TE
RM
INE
ST
RU
CT
UR
ES
TH
AT
MA
Y B
ES
T S
ER
VE
AS
EX
IST
ING
PR
OB
LE
M A
RE
AS
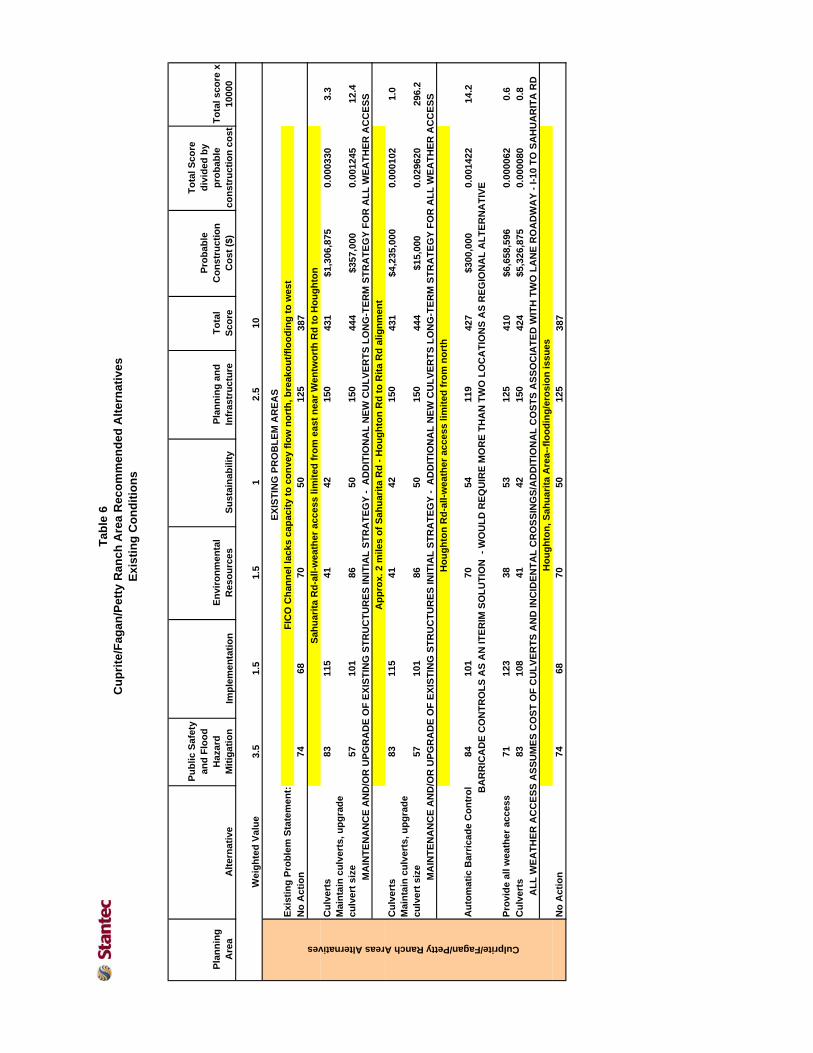
Tab
le 6
Cu
pri
te/F
agan
/Pet
ty R
anch
Are
a R
eco
mm
end
ed A
lter
nat
ives
Exi
stin
g C
on
dit
ion
s
Pla
nn
ing
A
rea
Alt
ern
ativ
e
Pu
blic
Saf
ety
and
Flo
od
H
azar
d
Mit
igat
ion
Imp
lem
enta
tio
nE
nvi
ron
men
tal
Res
ou
rces
Su
stai
nab
ility
Pla
nn
ing
an
d
Infr
astr
uct
ure
To
tal
Sco
re
Pro
bab
le
Co
nst
ruct
ion
C
ost
($)
To
tal S
core
d
ivid
ed b
y p
rob
able
co
nst
ruct
ion
co
stT
ota
l sco
re x
10
000
Wei
gh
ted
Val
ue
3.5
1.5
1.5
12.
510
Exi
stin
g P
rob
lem
Sta
tem
ent:
No
Act
ion
7468
7050
125
387
Cu
lver
ts83
115
4142
150
431
$1,3
06,8
750.
0003
303.
3M
ain
tain
cu
lver
ts, u
pg
rad
e cu
lver
t si
ze57
101
8650
150
444
$357
,000
0.00
1245
12.4
Cu
lver
ts83
115
4142
150
431
$4,2
35,0
000.
0001
021.
0M
ain
tain
cu
lver
ts, u
pg
rad
e cu
lver
t si
ze57
101
8650
150
444
$15,
000
0.02
9620
296.
2
Au
tom
atic
Bar
rica
de
Co
ntr
ol
8410
170
5411
942
7$3
00,0
000.
0014
2214
.2
Pro
vid
e al
l wea
ther
acc
ess
7112
338
5312
541
0$6
,658
,596
0.00
0062
0.6
Cu
lver
ts83
108
4142
150
424
$5,3
26,8
750.
0000
800.
8
No
Act
ion
7468
7050
125
387
EX
IST
ING
PR
OB
LE
M A
RE
AS
AL
L W
EA
TH
ER
AC
CE
SS
AS
SU
ME
S C
OS
T O
F C
UL
VE
RT
S A
ND
INC
IDE
NT
AL
CR
OS
SIN
GS
/AD
DIT
ION
AL
CO
ST
S A
SS
OC
IAT
ED
WIT
H T
WO
LA
NE
RO
AD
WA
Y -
I-10
TO
SA
HU
AR
ITA
RD
Culprite/Fagan/Petty Ranch Areas Alternatives
BA
RR
ICA
DE
CO
NT
RO
LS
AS
AN
ITE
RIM
SO
LU
TIO
N -
WO
UL
D R
EQ
UIR
E M
OR
E T
HA
N T
WO
LO
CA
TIO
NS
AS
RE
GIO
NA
L A
LT
ER
NA
TIV
E
FIC
O C
han
nel
lack
s ca
pac
ity
to c
on
vey
flo
w n
ort
h, b
reak
ou
t/fl
oo
din
g t
o w
est
Sah
uar
ita
Rd
-all-
wea
ther
acc
ess
limit
ed f
rom
eas
t n
ear
Wen
two
rth
Rd
to
Ho
ug
hto
n
Ap
pro
x. 2
mile
s o
f S
ahu
arit
a R
d -
Ho
ug
hto
n R
d t
o R
ita
Rd
alig
nm
ent
Ho
ug
hto
n R
d-a
ll-w
eath
er a
cces
s lim
ited
fro
m n
ort
h
Ho
ug
hto
n, S
ahu
arit
a A
rea-
-flo
od
ing
/ero
sio
n is
sues
MA
INT
EN
AN
CE
AN
D/O
R U
PG
RA
DE
OF
EX
IST
ING
ST
RU
CT
UR
ES
INIT
IAL
ST
RA
TE
GY
- A
DD
ITIO
NA
L N
EW
CU
LV
ER
TS
LO
NG
-TE
RM
ST
RA
TE
GY
FO
R A
LL
WE
AT
HE
R A
CC
ES
S
MA
INT
EN
AN
CE
AN
D/O
R U
PG
RA
DE
OF
EX
IST
ING
ST
RU
CT
UR
ES
INIT
IAL
ST
RA
TE
GY
- A
DD
ITIO
NA
L N
EW
CU
LV
ER
TS
LO
NG
-TE
RM
ST
RA
TE
GY
FO
R A
LL
WE
AT
HE
R A
CC
ES
S

Tab
le 7
Syc
amo
re C
anyo
n G
un
ner
y R
ang
e A
rea
Rec
om
men
ded
Alt
ern
ativ
esE
xist
ing
Co
nd
itio
ns
Pla
nn
ing
A
rea
Alt
ern
ativ
e
Pu
blic
Saf
ety
and
Flo
od
H
azar
d
Mit
igat
ion
Imp
lem
enta
tio
nE
nvi
ron
men
tal
Res
ou
rces
Su
stai
nab
ility
Pla
nn
ing
an
d
Infr
astr
uct
ure
To
tal
Sco
re
Pro
bab
le
Co
nst
ruct
ion
C
ost
($)
To
tal S
core
d
ivid
ed b
y p
rob
able
co
nst
ruct
ion
co
stT
ota
l sco
re x
10
000
Wei
gh
ted
Val
ue
3.5
1.5
1.5
12.
510
Cu
lver
ts83
115
4142
150
431
$8,8
55,6
250.
0000
490.
5M
ain
tain
cu
lver
ts, u
pg
rad
e cu
lver
t si
ze57
101
8650
150
444
$967
,500
0.00
0459
4.6
Mai
nta
in c
ulv
erts
, up
gra
de
culv
ert
size
5710
186
5012
541
9$2
7,00
00.
0155
3015
5.3
No
Act
ion
7468
7050
125
387
No
Act
ion
7468
7050
125
387
FL
AP
256
7086
5714
561
4$2
3,06
2,80
60.
0000
270.
3R
egio
nal
det
enti
on
bas
ins
4785
9260
175
459
$14,
881,
300
0.00
0031
0.3
Co
nst
ruct
100
-yea
r c
han
nel
5910
370
3813
840
7$2
,541
,000
0.00
0160
1.6
EX
IST
ING
PR
OB
LE
M A
RE
AS
Sycamore Canyon & Gunnery Range Areas Alternatives
Sah
uar
ita
Rd
-Rit
a R
d a
lign
men
t to
No
gal
es h
wy
Un
der
size
d/c
log
ged
cu
lver
ts in
Syc
amo
re C
anyo
n E
stat
es s
ou
th o
f S
ahu
arit
a R
d
Co
mp
lain
ts a
bo
ut
inte
gri
ty o
f b
erm
alo
ng
Co
lum
bu
s B
lvd
, no
rth
of
Daw
son
, eas
t o
f Ir
vin
g
Sah
uar
ita,
Del
gad
o, D
awso
n:
FIC
O c
han
nel
--la
ck o
f ca
pac
ity/
sed
imen
tati
on
cau
ses
resi
den
tial
flo
od
ing
CO
ST
AS
SU
ME
S F
AC
ILIT
IES
AT
TW
O L
OC
AT
ION
S
MA
INT
EN
AN
CE
AN
D/O
R U
PG
RA
DE
OF
EX
IST
ING
ST
RU
CT
UR
ES
INIT
IAL
ST
RA
TE
GY
- A
DD
ITIO
NA
L N
EW
CU
LV
ER
TS
LO
NG
-TE
RM
ST
RA
TE
GY
FO
R A
LL
WE
AT
HE
R A
CC
ES
S
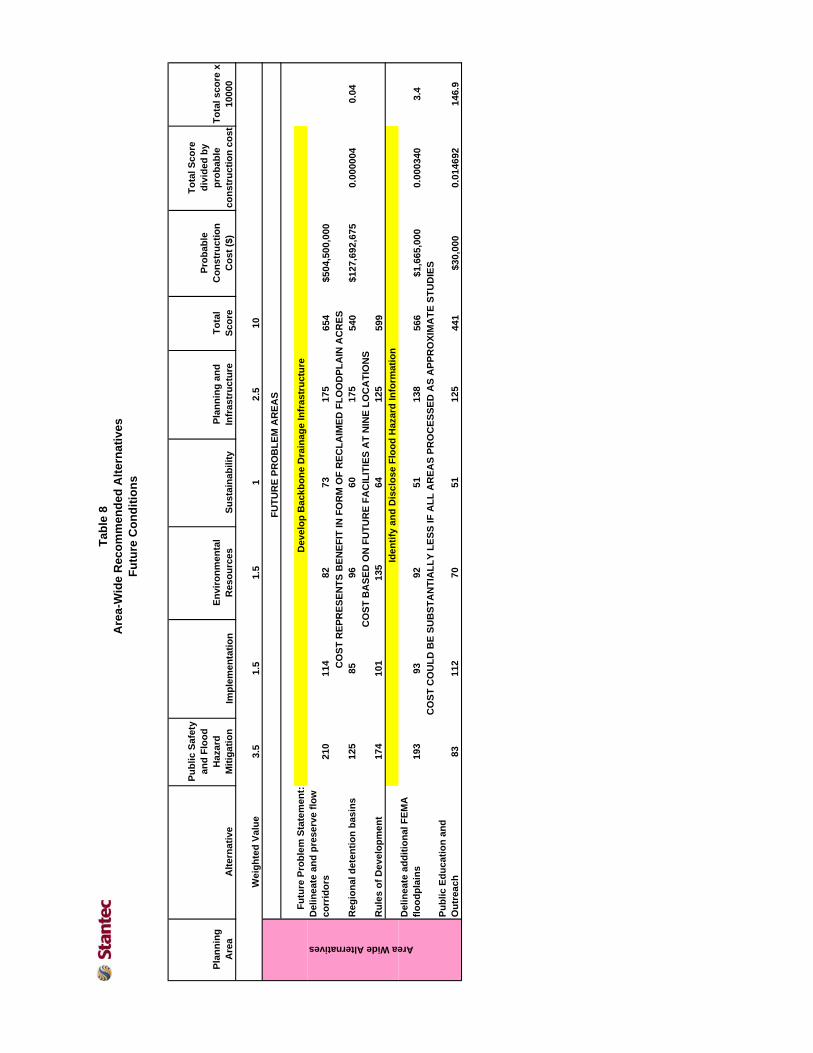
Tab
le 8
Are
a-W
ide
Rec
om
men
ded
Alt
ern
ativ
es
Fu
ture
Co
nd
itio
ns
Pla
nn
ing
A
rea
Alt
ern
ativ
e
Pu
blic
Saf
ety
and
Flo
od
H
azar
d
Mit
igat
ion
Imp
lem
enta
tio
nE
nvi
ron
men
tal
Res
ou
rces
Su
stai
nab
ility
Pla
nn
ing
an
d
Infr
astr
uct
ure
To
tal
Sco
re
Pro
bab
le
Co
nst
ruct
ion
C
ost
($)
To
tal S
core
d
ivid
ed b
y p
rob
able
co
nst
ruct
ion
co
stT
ota
l sco
re x
10
000
Wei
gh
ted
Val
ue
3.5
1.5
1.5
12.
510
Fu
ture
Pro
ble
m S
tate
men
t:D
elin
eate
an
d p
rese
rve
flo
w
corr
ido
rs21
011
482
7317
565
4$5
04,5
00,0
00
Reg
ion
al d
eten
tio
n b
asin
s12
585
9660
175
540
$127
,692
,675
0.00
0004
0.04
Ru
les
of
Dev
elo
pm
ent
174
101
135
6412
559
9
Del
inea
te a
dd
itio
nal
FE
MA
fl
oo
dp
lain
s19
393
9251
138
566
$1,6
65,0
000.
0003
403.
4
Pu
blic
Ed
uca
tio
n a
nd
O
utr
each
8311
270
5112
544
1$3
0,00
00.
0146
9214
6.9
CO
ST
CO
UL
D B
E S
UB
ST
AN
TIA
LL
Y L
ES
S IF
AL
L A
RE
AS
PR
OC
ES
SE
D A
S A
PP
RO
XIM
AT
E S
TU
DIE
S
Area Wide Alternatives
FU
TU
RE
PR
OB
LE
M A
RE
AS
Dev
elo
p B
ackb
on
e D
rain
age
Infr
astr
uct
ure
Iden
tify
an
d D
iscl
ose
Flo
od
Haz
ard
Info
rmat
ion
CO
ST
RE
PR
ES
EN
TS
BE
NE
FIT
IN F
OR
M O
F R
EC
LA
IME
D F
LO
OD
PL
AIN
AC
RE
S
CO
ST
BA
SE
D O
N F
UT
UR
E F
AC
ILIT
IES
AT
NIN
E L
OC
AT
ION
S

Tab
le 9
Fra
nco
/Fla
to/S
um
mit
Are
a R
eco
mm
end
ed A
lter
nat
ives
Fu
ture
Co
nd
itio
ns
Pla
nn
ing
A
rea
Alt
ern
ativ
e
Pu
blic
Saf
ety
and
Flo
od
H
azar
d
Mit
igat
ion
Imp
lem
enta
tio
nE
nvi
ron
men
tal
Res
ou
rces
Su
stai
nab
ility
Pla
nn
ing
an
d
Infr
astr
uct
ure
To
tal
Sco
re
Pro
bab
le
Co
nst
ruct
ion
C
ost
($)
To
tal S
core
d
ivid
ed b
y p
rob
able
co
nst
ruct
ion
co
stT
ota
l sco
re x
10
000
Wei
gh
ted
Val
ue
3.5
1.5
1.5
12.
510
Fu
ture
Pro
ble
m S
tate
men
t:R
ule
s o
f d
evel
op
men
t17
410
196
6412
556
0R
ealig
n W
ilmo
t R
d79
9996
5717
050
1-$
606,
061
-0.0
0082
7-8
.3
Ru
les
of
dev
elo
pm
ent
174
101
9664
125
560
Rea
lign
Co
un
try
Clu
b R
d79
9996
5717
050
1-$
1,06
0,60
6-0
.000
472
-4.7
Ru
les
of
dev
elo
pm
ent
174
101
9664
125
560
Rel
oca
te in
ters
ecti
on
6299
9155
158
463
$1,1
36,3
640.
0004
084.
1
CO
ST
RE
PR
ES
EN
TS
BE
NE
FIT
IN F
OR
M O
F R
ED
UC
ED
LE
NG
TH
& C
ON
SE
QU
EN
T R
OA
DW
AY
CO
ST
CO
ST
RE
PR
ES
EN
TS
IN
CR
EA
SE
D L
EN
GT
H
OF
RO
AD
WA
Y T
O A
VO
ID F
LO
D H
AZ
AR
D A
RE
A -
CO
ST
CO
UL
D B
E L
ES
S W
HE
N O
FF
SE
T B
Y R
ED
UC
ED
DR
EQ
UIS
ITE
DR
AIN
AG
E
Franco/Flato/Summit Area Alternatives
Co
un
try
Clu
b R
d a
lign
men
t im
pac
ted
by
mai
n f
low
co
rrid
ors
of
Fra
nco
Was
h a
nd
Fla
to W
ash
Acc
ess
to p
riva
te p
arce
l nea
r C
ou
ntr
y C
lub
/Pim
a M
ine
Rd
Inte
rsec
tio
n a
t D
awn
Rd
& I-
10 lo
cate
d w
ith
in f
loo
dp
ron
e ar
ea
CO
ST
RE
PR
ES
EN
TS
BE
NE
FIT
IN F
OR
M O
F R
ED
UC
ED
LE
NG
TH
& C
ON
SE
QU
EN
T R
OA
DW
AY
CO
ST
50%
of
Wilm
ot
Rd
& K
olb
Rd
alig
nm
ents
are
imp
acte
d b
y d
efin
ed f
loo
dp
lain
are
as
FU
TU
RE
PR
OB
LE
M A
RE
AS

Tab
le 1
0C
up
rite
/Fag
an/P
etty
Ran
ch A
rea
Rec
om
men
ded
Alt
ern
ativ
esF
utu
re C
on
dit
ion
s
Pla
nn
ing
A
rea
Alt
ern
ativ
e
Pu
blic
Saf
ety
and
Flo
od
H
azar
d
Mit
igat
ion
Imp
lem
enta
tio
nE
nvi
ron
men
tal
Res
ou
rces
Su
stai
nab
ility
Pla
nn
ing
an
d
Infr
astr
uct
ure
To
tal
Sco
re
Pro
bab
le
Co
nst
ruct
ion
C
ost
($)
To
tal S
core
d
ivid
ed b
y p
rob
able
co
nst
ruct
ion
co
stT
ota
l sco
re x
10
000
Wei
gh
ted
Val
ue
3.5
1.5
1.5
12.
510
Exi
stin
g P
rob
lem
Sta
tem
ent:
Ru
les
of
dev
elo
pm
ent
174
101
9664
125
560
Rea
lign
ro
adw
ay79
9910
161
170
510
-$75
7,57
6-0
.000
673
-6.7
Ru
les
of
dev
elo
pm
ent
174
101
9664
125
560
Rea
lign
Wilm
ot
Rd
7999
9057
170
495
-$3,
030,
303
-0.0
0016
3-1
.6
Rem
ove
ro
adw
ay s
ecti
on
7453
115
6563
370
-$10
,984
,848
-0.0
0003
4-0
.3
No
Act
ion
7468
6144
125
371
corr
ido
rs21
011
482
7317
064
9$2
8,90
0,00
0
Ru
les
of
dev
elo
pm
ent
174
101
9664
125
560
FU
TU
RE
PR
OB
LE
M A
RE
AS
Pro
po
sed
Daw
n R
d a
lign
men
t sw
ing
s so
uth
into
flo
od
haz
ard
are
a, +
/- 1
/3 m
ile f
low
dep
ths
>0.
5ft
60-6
5% o
f p
rop
ose
d W
ilmo
t R
d &
Rit
a R
d a
lign
men
ts im
pac
ted
by
def
ined
flo
od
pla
in a
reas
Cuprite/Fagan/Petty Ranch Areas Alternatives
Ho
ok
M R
anch
pro
per
ty--
40-5
0% o
f p
rop
erty
imp
acte
d b
y sh
allo
w s
hee
t fl
ow
CO
ST
RE
PR
ES
EN
TS
BE
NE
FIT
IN F
OR
M O
F R
EC
LA
IME
D F
LO
OD
PL
AIN
AC
RE
S
CO
ST
RE
PR
ES
EN
TS
BE
NE
FIT
IN F
OR
M O
F R
ED
UC
ED
LE
NG
TH
& C
ON
SE
QU
EN
T R
OA
DW
AY
CO
ST
CO
ST
RE
PR
ES
EN
TS
BE
NE
FIT
IN F
OR
M O
F R
ED
UC
ED
LE
NG
TH
& C
ON
SE
QU
EN
T R
OA
DW
AY
CO
ST
NO
AC
TIO
N A
SS
UM
ES
RO
AD
WA
Y B
UIL
T A
S P
RO
PO
SE
D IN
SE
AR
TE
RIA
L S
TU
DY
- D
RA
INA
GE
MA
INT
AIN
ED
PE
R E
XIS
TIN
G F
LO
W P
AT
TE
RN
S
CO
ST
RE
PR
ES
EN
TS
BE
NE
FIT
IN F
OR
M O
F R
ED
UC
ED
LE
NG
TH
& C
ON
SE
QU
EN
T R
OA
DW
AY
CO
ST
Sw
an R
d A
lign
men
t--s
itu
ated
wit
hin
sh
eet
flo
w a
rea
no
rth
of
Sah
uar
ita
Rd
Pim
a M
ine
Rd
--fr
om
Ho
ug
hto
n t
o W
ilmo
t is
wit
hin
sh
allo
w s
hee
t fl
ow
; d
iver
t fl
ow
to
Cu
pri
te w
ater
shed

Tab
le 1
1S
ycam
ore
Can
yon
Gu
nn
ery
Ran
ge
Are
a R
eco
mm
end
ed A
lter
nat
ives
Fu
ture
Co
nd
itio
ns
Pla
nn
ing
A
rea
Alt
ern
ativ
e
Pu
blic
Saf
ety
and
Flo
od
H
azar
d
Mit
igat
ion
Imp
lem
enta
tio
nE
nvi
ron
men
tal
Res
ou
rces
Su
stai
nab
ility
Pla
nn
ing
an
d
Infr
astr
uct
ure
To
tal
Sco
re
Pro
bab
le
Co
nst
ruct
ion
C
ost
($)
To
tal S
core
d
ivid
ed b
y p
rob
able
co
nst
ruct
ion
co
stT
ota
l sco
re x
10
000
Wei
gh
ted
Val
ue
3.5
1.5
1.5
12.
510
No
Act
ion
7468
4049
125
355
Del
inea
te a
nd
pre
serv
e fl
ow
co
rrid
ors
210
114
8273
170
649
Ru
les
of
dev
elo
pm
ent
174
101
9664
125
560
Sycamore Canyon & Gunnery Range Areas Alternatives
Syc
amo
re C
anyo
n B
lock
s C
-G--
pla
n p
latt
ed, c
urr
entl
y u
nd
evel
op
ed;
flo
od
haz
ard
are
as f
airl
y co
nta
ined
CO
ST
RE
PR
ES
EN
TS
BE
NE
FIT
IN F
OR
M O
F R
EC
LA
IME
D F
LO
OD
PL
AIN
AC
RE
S
Wilm
ot
Rd
& D
awso
n R
d p
rop
ose
d a
lign
men
ts s
itu
ated
in a
reas
do
min
ated
by
shal
low
sh
eet
flo
w
FU
TU
RE
PR
OB
LE
M A
RE
AS

LEE MOORE WASH BASIN MANAGEMENT STUDY – SUMMARY REPORT
64
6.0 Development Criteria (summarized from CLW, 2009b)
Historically, Arizona communities have developed floodplain management measures such as
floodplain ordinances, drainage ordinances, and development standards intended to mitigate
the flood impacts of urbanization. If these measures are not adequate or are not adequately
enforced, the consequences may include flooding of homes and businesses, displacement of
existing natural flood flows, increased flood depths, and flooding of lands previously not in a
floodplain. The adverse impacts of urbanization on drainage often include the following:
a. More Frequent Flooding. As the land area within a watershed is converted from
natural rangeland to rooftops and pavement, less rainfall infiltrates into the ground
and more rainfall becomes runoff. This results in more frequent runoff events and
increased nuisance flooding.
b. Larger Flood Peaks. The change from natural pervious land surfaces to urbanized
impervious surfaces also causes the size of floods to increase, as more runoff leaves
the watershed. Urbanized watersheds generate not only larger flood peaks, but also
greater flood volumes and floods of longer duration, both of which increase flood
damages. As flood peaks increase with urbanization, existing drainage structures
become inadequate and have a greater risk of failure.
c. Loss of Natural and Beneficial Floodplain Functions. Natural floodplains provide
important sociological, as well environmental and hydrologic benefits. These
sociological benefits include continuous linear open space, visual and aesthetic
beauty, multi-sensory relief from pervasive constructed hardscapes, and a sense of
community character tied to the natural setting.
d. Scour and Erosion. Because more land area is covered by homes, streets and
landscaping as a watershed urbanizes, the natural sediment supply to streams is
decreased, which causes floods to be more erosive. This erosion leads to loss of
homes and land due to riverine bank erosion, scour damage to bridges, and adverse
impacts to flood control facilities and natural river habitat.

LEE MOORE WASH BASIN MANAGEMENT STUDY – SUMMARY REPORT
65
e. Flow Diversion. Unmanaged development can block natural flow paths, diverting
runoff toward areas that were previously not flooded.
f. Flow Concentration. Development in riverine or distributary flow floodplains blocks
natural overland flow paths, concentrating runoff through narrower conveyance
corridors. Flow concentration leads to higher flood peaks, higher flood velocities, and
accelerated scour and erosion.
g. Expanded Floodplains. Increased flood peaks and flow diversion increase flood
water elevations and expand floodplain widths, inundating properties previously safe
from flooding and expanding the number of homes and business at risk for future
flood damage.
h. Reduced Surface Storage. Reducing surface storage areas by grading individual lots
to reduce ponding areas or soggy soils or by erecting structures within former
ponding and flood-prone areas increases both the peak flow and the volume of runoff
generated by a given storm, and may also result in a loss of vegetation that further
increases runoff rates.
i. Decreased Ground Water Recharge. Increased impervious surface area in an
urbanized watershed inhibits ground water recharge and reduces soil moisture, with
adverse consequences to long-term water supply, subsidence, and vegetation.
j. Loss of Riparian Habitat. Increased erosion due to increased flood peaks and
reduced sediment supply leads to degraded habitat along river corridors, with
adverse impacts to wildlife and public recreation.
In order to protect private and public property, and the health and general welfare of the public,
naturally occurring flood hazards and potential flood hazards related to development need to be
identified, and appropriate standards applied to safely manage new development.
Development Criteria are a work product of a Basin Management Plan (BMP). This plan
develops hydrology for a watershed, identifies potential flood prone areas and drainage
problems, and identifies alternatives for solving these problems. Adherence to these
development criteria will lessen the adverse impacts of urbanization and decrease the cost of
flooding for the public. The BMP takes the compiled information and analyzes the alternatives to
reach Recommended Alternatives (RA). The RA contains both structural (such as basins,

LEE MOORE WASH BASIN MANAGEMENT STUDY – SUMMARY REPORT
66
culverts and channels) and non-structural (such as development criteria, flood warning system,
and property acquisition) solutions.
The Lee Moore Wash study area is located in the southeast portion of Pima County including a
portion of the City of Tucson and Town of Sahuarita. The northern half of the study area lies
predominantly within the incorporated limits of the City of Tucson. The Town of Sahuarita
covers a small area in the southwestern portion of the study area. The majority of the central
portion of the study area is unincorporated Pima County.
Counties lack the regulatory authority to manage lot splits. As a result, these types of land
division are exempt from subdivision and/or other improvement requirements. Although impacts
from lot split development may appear relatively insignificant when viewed on the individual lot
basis, frequently the cumulative impact of such external impacts is much more significant.
Counties have greater ability to review residential subdivisions, multi-family, industrial and
commercial projects to address potential impacts on adjacent properties. Cities have the
authority to review and require compliance with development standards for the above projects,
as well as individual lots.
In reviewing these issues, it became apparent that Development Criteria would have a positive
effect on single-family development on individual lots within the LMWBMS study area.
Therefore, the analysis of the types of potential regulations was done with a focus on the nature
of single-family development on individual lots as well as master planned subdivisions.
LEE MOORE WASH BASIN MANAGEMENT STUDY – SUMMARY REPORT
67
7.0 Implementation Plan (summarized from CLW, 2010)
7.1 STAKEHOLDER INVOLVEMENT PROGRAM APPROACH
The Stakeholder Involvement program for this project was designed and completed with the
goal of maximizing implementation opportunities for the Recommended Alternatives of the
LMWBMS. To achieve this end, the “3 I’s” method which has been used successfully in other
similar projects was utilized. Simply put, the “3 I’s” method of Stakeholder Involvement is to
utilize a 3-Phase approach as identified in the Stakeholder Flowchart included in the
Implementation Plan, and described below in the following sections.
7.1.1 Phase 1
Inform the stakeholders of the project in the early stages to obtain any useful knowledge they
may have from a data collection standpoint, as well as to receive any initial input they may have
regarding the scope of work or process. This was accomplished through facilitated workgroups
of stakeholders with similar mandates, jurisdictions, and interests (i.e. transportation system
agencies, unincorporated area, etc.). Several individual meetings were also held for those
stakeholders with a unique interest (i.e. Southern Arizona Homebuilders Association, etc.).
Stakeholders and their anticipated preliminary concerns/interests were identified and compiled
into a spreadsheet, which was used as the baseline database for the rest of the stakeholder
involvement program.
7.1.2 Phase 2
Involve the stakeholders throughout the course of the study so that they stay informed and
interested in the project. This also allowed them to see the reasons why, or why not, their input
would be included in the development of alternatives. This was accomplished through the use
of workgroups, as well as individual meetings. An added benefit of maintaining contact through
the course of the project is that new staff members from the agencies were educated prior to
being shown the end product. Their involvement was documented in the matrices developed for
all of the alternatives evaluated at each site.

LEE MOORE WASH BASIN MANAGEMENT STUDY – SUMMARY REPORT
68
7.1.3 Phase 3
Include the stakeholders in the process of selection of the Recommended Alternatives. This
effort included information exchange and discussion of:
a) costs of capital improvements
b) costs of maintenance
c) conceptual cost sharing agreements for capital improvements
d) conceptual agreements on maintenance responsibilities
e) construction timelines coordinated with other agencies’ projects and budgets.
This was accomplished using a combination of workgroups and individual meetings because of
the iterative nature of these negotiations.
7.2 IMPLEMENTATION STRATEGY
The results of the Stakeholder Involvement and Implementation Strategy are discussed in more
detail in the forthcoming Implementation Plan. The Implementation Plan will detail the
Recommended Alternatives by location, capital improvement costs, potential cost sharing
partner, identified participation interest, mechanism for participation, method for jurisdictional
adoption of the LMWBMS and a preliminary timeline of appropriate activities. The
Implementation Plan will continue to be developed iteratively and in cooperation with the
affected stakeholders. It will not represent a binding legal agreement on any partners, but will
provide a solid summary of implementation strategies to date and a roadmap for the Pima
County Regional Flood Control District implementation efforts once the LMWBMS is adopted by
the Board of Directors. Many of the Recommended Alternatives are connected with other
agency programs. The result is that often their schedule or funding will drive the construction
and other non-structural measures timelines. Recognition of this fact by the District, and
planning for this in future follow through efforts, will allow for cost effective and efficient
Recommended Alternatives completion. If the coordination is not continued after completion of
the LMWBMS, it is possible that other agencies will move ahead with their projects and not
include the Recommended Alternatives.
LEE MOORE WASH BASIN MANAGEMENT STUDY – SUMMARY REPORT
69
The Recommended Alternatives, as described in Section 5.0 of this report, are comprised of
structural and non-structural solutions at various locations. These locations are distributed
throughout the project area, and include construction and non-construction activities that will
ultimately be funded in one of three ways:
1. Solely funded by the District.
2. Funded solely or in partnership among private and/or public agencies, including the District.
3. Funded solely or in partnership among private and/or public agencies, not including the District.
An outline of each of the Recommended Alternatives funding and implementation strategies will
be presented in the forthcoming Implementation Plan (CLW, 2010).

LEE MOORE WASH BASIN MANAGEMENT STUDY – SUMMARY REPORT
70
8.0 References
C.L. Williams Consulting, Inc., June 15, 2009a, Lee Moore Wash Basin Management Study - Public Involvement Report
C.L. Williams Consulting, Inc., (draft) August 21, 2009b, Lee Moore Wash Basin Management Study – Development Criteria
C.L. Williams Consulting, Inc., 2010, Lee Moore Wash Basin Management Study - Implementation Plan (in process)
Hydrogeologic Evaluation of the Lee Moore Wash Study Area, July 5, 2007, GeoSystems Analysis, Inc.
JE Fuller Hydrology & Geomorphology, Inc., August 2008a, Geomorphic Analysis Report for the Lee Moore Wash Basin Management Study, Pima County, Arizona
JE Fuller Hydrology & Geomorphology, Inc., December 2008b, Two-Dimensional Flow Analysis Report for the Lee Moore Wash Basin Management Study, Pima County, Arizona
Pima County Department of Transportation and Flood Control District, Planning Division, 1988, Hydrologic Investigation for the Lee Moore Wash Watershed, Pima County, Arizona
Pima County Regional Flood Control District, March 2007, PC-Hydro V.5, Pima County Hydrology Procedures - PC-Hydro User Guide
Soil Conservation Service (SCS), 1986, Urban Hydrology for Small Watersheds, Technical Release No. 55
Stantec Consulting Inc., February 2008a, Lee Moore Wash Basin Management Study - Existing Conditions Analysis
Stantec Consulting Inc., December 2008b, Lee Moore Wash Basin Management Study - Hydrologic and Hydraulic Analysis
U. S. Army Corps of Engineers, Hydrologic Engineering Center, July 1999, HEC-HMS Hydrologic Modeling System, Technical Reference Manual
U. S. Army Corps of Engineers, Hydrologic Engineering Center, Version 3.1, 2002, HEC-RAS User’s Manual
U. S. Army Corps of Engineers, Hydrologic Engineering Center, September 2005, HEC-GeoRAS User’s Manual
U. S. Army Corps of Engineers, Hydrologic Engineering Center, Version 3.0.1, April 2006, HEC-HMS User’s Manual
LEE MOORE WASH BASIN MANAGEMENT STUDY – SUMMARY REPORT
71
Appendix (CD)
ALTERNATIVES ANALYSIS DOCUMENTS
Alternative Development Process
Planning Area Problem ID Document
Specific Criteria Weighting Evaluation Spreadsheet
Performance Criteria Weighting Matrix
Alternatives Development Table
Final Alternative Weighting Score Sheet
Cost Estimate Assumptions
Cost Estimate Spreadsheet
Weighted Recommended Alternative Spreadsheet
Project Base Maps
Environmental Opportunities and Constraints Map
Riparian Habitat Map
Proposed Landuse Map
Physical Setting Map
Floodplains & Drainage Complaints Map
Recommended Alternatives Exhibits
Existing Conditions - Plates 1 to 8
Future Conditions - Plates 1 to 8
Recommended Alternative Concept Drawings
Flow Corridor Schematic for Riverine Areas
Flow Corridor Schematic for Distributary Flow Areas
Multi-Use Regional Detention Basin Concept - Plan View
Multi-Use Regional Detention Basin Concept - Section