le@fe g8:@=@: :figfi8k@fe )''- 8eel8c i
TRANSCRIPT


FINANCIAL HIGHLIGHTS
Millions of Dollars, Except Per Share Amounts and Ratios 2006 2005 2004
FOR THE YEAR
Operating Revenue $15,578 $13,578 $12,215
Operating Income 2,884 1,795 1,295
Net Income 1,606 1,026 604
Per Share — Basic: 5.96 3.89 2.33
Per Share — Diluted: 5.91 3.85 2.30
Dividends Declared Per Share 1.20 1.20 1.20
Capital Investments 2,242 2,169 1,876
Cash Provided by Operating Activities 2,880 2,595 2,257
Free Cash Flow (a) 516 234 215
AT YEAR-END
Total Assets $36,515 $35,620 $34,596
Total Debt 6,780 7,416 8,131
Common Shareholders’ Equity 15,312 13,707 12,655
Equity Per Common Share (b) 56.68 51.41 48.58
FINANCIAL RATIOS (%)
Operating Margin 18.5 13.2 10.6
Operating Ratio 81.5 86.8 89.4
Lease Adjusted Debt to Capital (c) 40.2 43.6 45.1
Return on Average Common Shareholders’ Equity 11.1 7.8 4.8
Return on Invested Capital (d) 8.2 6.4 4.7
(a) Free cash fl ow is defi ned as cash provided by operating activities less cash used in investing activities less dividends paid. Free cash fl ow is not considered a fi nancial measure under
accounting principles generally accepted in the United States (GAAP) by SEC Regulation G and Item 10 of SEC Regulation S-K. For a reconciliation to GAAP, please see Item 7 of
the 2006 Annual Report on Form 10-K. (b) Equity per common share is calculated as follows: common shareholders’ equity divided by common shares issued less treasury shares outstanding.
(c) Lease adjusted debt to capital is computed as follows: total debt plus net present value of operating leases divided by total debt plus equity plus net present value of operating leases.
Lease adjusted debt to capital is considered a non-GAAP fi nancial measure by SEC Regulation G and Item 10 of SEC Regulation S-K. For a reconciliation to GAAP, please see Item
7 of the 2006 Annual Report on Form 10-K.
(d) Union Pacifi c Corporation defi nes return on invested capital as follows: net income plus interest expense plus sale of receivables fees plus interest on present value of operating leases
less taxes on interest and fees divided by average equity plus average debt plus average value of sold receivables plus average present value of operating leases. Return on invested capital
is considered a non-GAAP fi nancial measure by SEC Regulation G and Item 10 of SEC Regulation S-K. For a reconciliation to GAAP, please see Item 7 of the 2006 Annual Report
on Form 10-K.
OPERATING REVENUEIn millions of dollars
OPERATING INCOMEIn millions of dollars
FREE CASH FLOW*
In millions of dollarsRETURN ON INVESTED CAPITAL*
Percentage
1,295
1,795
12,21513,578
215234
04 05 04 05 04 05
15,578
06
516
06
4.7
6.4
04 05
8.2
06
2,884
06
*Refer to (a) above *Refer to (d) above

Union Pacfic’s Growth Strategy
Our Company is growing. The records we set in 2006 created a platform to continue rewarding our shareholders in 2007 and beyond. Looking ahead, we see even greater growth opportunities. Customers need our investment in additional rail capacity so they can grow. We move the food, vehicles, plastics, coal, lumber and consumer goods that people use every day. Our communities are increasingly aware that UP’s rail network strengthens their local economies and connects them to the rest of the world.
Our strategy is to enhance the long-term value of our company by serving the nation’s growing need for quality transportation. We will achieve this strategy by providing valued service to our customers, improving the efficiency of our operations, leveraging our franchise diversity and making growth investments in corridors where we have a strategic advantage.
Strong 2006 Business Volumes
Lead Record Year
Our 2006 business volumes started out strong, growing 4 percent in the first quarter. Seven-day carloadings, a measure of our business volume, topped the 200,000 mark for the first time ever in June. Our busiest months generally are August through October, so setting the carloading record in June was significant. With such an early surge in our business, the normal fall peak shipping season was expected
to be even stronger. However, reduced housing starts, cuts in auto production and softness in the domestic intermodal market slowed the pace of our growth at year’s end.
Total carloads in 2006 were a record 9.9 million, up 3 percent versus 2005. This growth helped each of our six business groups set revenue records for the second straight year. Our Energy, Intermodal and Automotive groups also set individual volume records: • Coal-fired plants are the single largest generator of electricity in America today. We shipped 194 million tons of coal from the Southern Powder River Basin, an 8 percent increase, to support growing electrical demand. • Intermodal volumes grew 6 percent, driven by double- digit growth in the movement of steamship containers carrying consumer goods that Americans need in their daily lives. • UP’s automotive shipments grew 5 percent to a record 834,000 carloads. With U.S. light vehicle sales declining 3 percent in the year, growth in automotive is a testament to the strength of UP’s auto franchise. We also experienced record growth in two emerging Agricultural markets. Ethanol and dried distiller grain soluables (DDGS), an ethanol co-product used for livestock feed, grew nearly 50 percent during 2006. In total, we moved more than 1.1 billion gallons of ethanol and 1.6 million tons of DDGS.
1
Union Pacific today is a company that is committed to improving safety,
strengthening financial returns, increasing value to our customers, and
providing critical benefits to the economy of our country and the communities
where we operate. We achieved a number of milestones in 2006, highlighting
the value of our franchise and the dedication of our employees.
Fellow Shareholders:

Increasing Customer Value
Operating initiatives aimed at network simplification, technology and capital investments drove better service reliability and efficiency throughout 2006. Network fluidity, as measured by velocity, terminal dwell times and rail car inventory, improved across the board while we moved record volumes. Our customers recognized the service gains, rating us 8 points higher on their satisfaction surveys in 2006.
Customers also saw the benefits of improved service from our Customer Inventory Management System (CIMS). This technology solution increases terminal throughput without adding physical capacity, prevents congestion and enhances service reliability. By the end of 2006, CIMS monitored nearly 80 percent of our daily industry volumes. Final rollouts will occur in 2007, achieving 100 percent coverage.
We are increasing customer value through our capacity programs as well. Our investments are designed to promote safety, service, growth and efficiency. In 2007, we are planning a $3.2 billion capital program that primarily is targeted at growth. We are committed to grow with our customers if the investment is justified by the financial returns.
Safety
Freight railroads are one of the safest industries in America, and we’re committed to becoming even safer. During 2006, we made progress toward that goal.
One of the challenges the rail industry faces is the growth in both train and highway vehicle traffic, which in recent years has contributed to a nationwide increase in crossing accidents. We are working to reverse that trend with improved crossing visibility, technology and education. Both our new and current employees use locomotive simulators to help instill safe operating practices. We are addressing driver behavior through more than 7,000 public education classes, reaching over 425,000 citizens to promote greater crossing safety.
During 2006, rail shipments moved across our network more safely as we reduced the frequency of derailments 17 percent and the associated expense fell 13 percent. At the core of all these efforts is the safety of our employees, which improved 15 percent.
In 2007, we are continuing our partnership with Dow Chemical, Union Tank Car and the Federal Railroad Administration (FRA) on the “Next Generation Tank Car Project” to further improve the safety of chemical transportation through better tank car designs. We also are working with the FRA to conduct two pilot projects using Communications-Based Train Control. This technology enhances train safety and fuel efficiency through the use of GPS and onboard computers.
UP and the Environment
In addition to being one of the safest forms of transportation, rail is one of the most environmentally friendly. For example, railroads are generally three times more fuel efficient than trucks, and one intermodal train can take up to 280 trucks off our congested highways.
At UP, we are continually improving our fuel efficiency through better locomotive technology, engineer training and employee involvement programs, such as Fuel Masters. In 2006, we moved, on average, one ton of freight over 780 miles on a single gallon of diesel fuel – a nearly 30-mile improvement over the past two years. This improved fuel efficiency saved more than 50 million gallons of diesel in 2006.
In addition to promoting fuel conservation, greater fuel efficiency also reduces emissions. Today, we are teaming up with other rails, locomotive manufacturers and governmental authorities to develop low-emission technologies for application in new and existing models. This technology has the potential to reduce emissions in new switch locomotives by up to 80 percent.
Record Financial Results
Record demand, improved operational efficiency and enhanced network safety drove a financial performance in 2006 that, by nearly every key financial measure, was a “best ever” year: • Operating revenue increased nearly 15 percent to $15.6 billion. Core price improvement, fuel surcharges and record volume gains all contributed to the growth. • Operating income totaled $2.9 billion, up more than 60 percent.
2
• Net income increased 57 percent to $1.6 billion. • Operating ratio improved 5.3 points to 81.5 percent. • Free cash flow totaled $516 million after paying $322 million in dividends to our shareholders and voluntarily adding $150 million to fully fund our employee retirement plan.*
2007 Outlook
In January, we took additional steps to create value for our shareholders with an increased dividend and share repurchase program. Our Board of Directors approved a 17 percent quarterly dividend increase to $0.35 per share. The Board also authorized a repurchase of up to 20 million common shares to be completed by year-end 2009.
While we are somewhat cautious about the economic outlook at the start of 2007, we remain very optimistic about the long-term potential for our Company. We expect very strong demand for coal, international intermodal and ethanol, but slower housing and auto markets could offset some of the growth. Operationally, we expect to move increased tonnage across our network with greater efficiency.
Capacity expansion programs are needed to carry the record growth our customers are projecting. Our investments are targeted in corridors that support strong growth opportunities, primarily in coal and intermodal. They also allow us to enhance overall network fluidity and efficiency. Customers value the increased service reliability that results from more efficient operations. At the same time, they understand that today’s transportation rates must support investments for future growth.
We are confident that our business returns will support these investments. Our return on invested capital improved 2.5 points in 2006, to 8.2 percent, and we are focused on further improvement.*
Employees – A Strength of UP
UP’s employees are at the heart of our efforts to provide quality service, improve financial returns and support the communities in which we operate. This will continue to be true as our workforce changes over the next several years.
Roughly 25 percent of UP’s current employees are new to the Company since 2003. An ongoing priority for 2007 is recruiting top candidates with a diversity of experience, cultural backgrounds and interests to UP. Through efforts such as UP’s Operations Management Training program, the U.S. Army’s PaYS (Partnership for Youth Success), the Marine Civilian Development Program and college recruiting, we hired more than 6,400 new employees in 2006, and expect to hire another 4,500 in 2007. Recognition as a top employer by magazines such as G.I. Jobs, Working Mother and LATINA Style provides evidence that UP is an “Employer of Choice.”
Although many long-service employees retired from Union Pacific over the past year, most noteworthy was our Chairman, Dick Davidson. Dick began his career in 1960 as a brakeman working his way through college. His retirement from Union Pacific in January 2007 marks the end of a long and successful chapter in the Company’s history. We all owe Dick a huge debt of gratitude for his leadership and vision in helping create today’s Union Pacific. We wish him a long, healthy and happy retirement, which is well deserved.
I am pleased to welcome two new board members, Andrew Card and Thomas (Mack) McLarty. Their varied backgrounds and diverse experience will be valued additions to our board, and I look forward to working with them in the years ahead.
Coming off a record-setting year in 2006, expectations for 2007 are high. We will measure success by how well we increase shareholder returns, deliver customer value, enhance our reputation in the communities where we operate and instill employee pride. Our safety initiatives, growth strategy, capital investments, environmental initiatives and training programs all are directed at achieving these goals. Union Pacific has a great history, and we’re looking forward to a great future.
Jim YoungChairman, President and Chief Executive Officer
3
* For reconciliations to GAAP for our 2005 income tax adjusted return on invested capital and free cash flow calculations, please refer to the Union Pacific Web site under Investor Relations.

Andrew H. Card, Jr. Former White House Chief of Staff Board Committees: Corporate Governance and Nominating, Finance
Erroll B. Davis, Jr. Chancellor University System of Georgia Board Committees: Audit, Compensation and Benefits
Thomas J. Donohue President and Chief Executive Officer U.S. Chamber of Commerce Board Committees: Compensation and Benefits (Chair), Corporate Governance and Nominating
Archie W. Dunham Retired Chairman ConocoPhillips Board Committees: Finance (Chair), Corporate Governance and Nominating
Judith Richards Hope Distinguished Visitor from Practice and Professor of Law Georgetown University Law Center Board Committees: Audit (Chair), Finance
Charles C. Krulak General, USMC, Ret. Former Commandant of the United States Marine Corps Board Committees: Audit, Finance
Michael W. McConnell Managing Partner Brown Brothers Harriman & Co. Board Committees: Audit, Compensation and Benefits
Thomas F. McLarty III President Kissinger McLarty Associates Board Committee: Finance
Steven R. Rogel Chairman, President and Chief Executive Officer Weyerhaeuser Company Board Committees: Corporate Governance and Nominating (Chair), Compensation and Benefits
James R. Young* Chairman, President and Chief Executive Officer Union Pacific Corporation and Union Pacific Railroad Company
James R. Young* Chairman, President and Chief Executive Officer Union Pacific Corporation and Union Pacific Railroad Company
Dennis J. Duffy Executive Vice President–Operations Union Pacific Railroad Company
Charles R. Eisele Senior Vice President–Strategic Planning Union Pacific Corporation
Bernard R. Gutschewski Vice President–Taxes Union Pacific Corporation
J. Michael Hemmer Senior Vice President–Law and General Counsel Union Pacific Corporation
Mary Sanders Jones Vice President and Treasurer Union Pacific Corporation
Robert M. Knight, Jr. Executive Vice President–Finance and Chief Financial Officer Union Pacific Corporation
John J. Koraleski Executive Vice President– Marketing and Sales Union Pacific Railroad Company
Mary E. McAuliffe Vice President–External Relations Union Pacific Corporation
Richard J. Putz Vice President and Controller Union Pacific Corporation
Barbara W. Schaefer Senior Vice President–Human Resources and Secretary Union Pacific Corporation
Lynden L. Tennison Senior Vice President and Chief Information Officer Union Pacific Corporation
Robert W. Turner Senior Vice President–Corporate Relations Union Pacific Corporation
BOARd OF dIRECtORS
ExECUtIVE OFFICERS
4
*Elected Chairman effective February 1, 2007
dIRECtORS ANd ExECUtIVE OFFICERS

Job: 91327_002 Union Pacific Page: 1
UNITED STATESSECURITIES AND EXCHANGE COMMISSION
WASHINGTON, D.C. 20549
FORM 10-K(Mark One)
[X] ANNUAL REPORT PURSUANT TO SECTION 13 OR 15(d) OF THESECURITIES EXCHANGE ACT OF 1934
For the fiscal year ended December 31, 2006
OR
[ ] TRANSITION REPORT PURSUANT TO SECTION 13 OR 15(d) OF THESECURITIES EXCHANGE ACT OF 1934
For the transition period from to
Commission File Number 1-6075
UNION PACIFIC CORPORATION(Exact name of registrant as specified in its charter)
UTAH 13-2626465(State or other jurisdiction of
incorporation or organization)(I.R.S. Employer
Identification No.)
1400 DOUGLAS STREET, OMAHA, NEBRASKA(Address of principal executive offices)
68179(Zip Code)
(402) 544-5000(Registrant’s telephone number, including area code)
Securities registered pursuant to Section 12(b) of the Act:Title of each Class Name of each exchange on which registeredCommon Stock (Par Value $2.50 per share) New York Stock Exchange, Inc.
Indicate by check mark if the registrant is a well-known seasoned issuer, as defined in Rule 405 of the Securities Act.Yes X No
Indicate by check mark if the registrant is not required to file reports pursuant to Section 13 or Section 15(d) of the Act.Yes No X
Indicate by check mark whether the registrant (1) has filed all reports required to be filed by Section 13 or 15(d) of the Securities ExchangeAct of 1934 during the preceding 12 months (or for such shorter period that the registrant was required to file such reports), and (2) has beensubject to such filing requirements for the past 90 days.
Yes X No
Indicate by check mark if disclosure of delinquent filers pursuant to Item 405 of Regulation S-K is not contained herein, and will notbe contained, to the best of the registrant’s knowledge, in definitive proxy or information statements incorporated by reference in Part III ofthis Form 10-K or any amendment to this Form 10-K. X
Indicate by check mark whether the registrant is a large accelerated filer, an accelerated filer, or a non-accelerated filer (as defined inRule 12b-2 of the Act):
Large accelerated filer È Accelerated filer ‘ Non-accelerated filer ‘
Indicate by check mark whether the registrant is a shell company (as defined in Rule 12b-2 of the Act).Yes No X
As of June 30, 2006, the aggregate market value of the registrant’s Common Stock held by non-affiliates (using the New York StockExchange closing price) was $24.9 billion.
The number of shares outstanding of the registrant’s Common Stock as of January 31, 2007, was 270,752,306.

Documents Incorporated by Reference – Portions of the registrant’s definitive Proxy Statement for the AnnualMeeting of Shareholders to be held on May 3, 2007, are incorporated by reference into Part III of this report. Theregistrant’s Proxy Statement will be filed with the Securities and Exchange Commission pursuant toRegulation 14A.
TABLE OF CONTENTSUNION PACIFIC CORPORATION
PART I
Item 1. Business . . . . . . . . . . . . . . . . . . . . . . . . . . . . . . . . . . . . . . . . . . . . . . . . . . . . . . . . . . . . . . . . . . . . . 3
Item 1A. Risk Factors . . . . . . . . . . . . . . . . . . . . . . . . . . . . . . . . . . . . . . . . . . . . . . . . . . . . . . . . . . . . . . . . . . 6
Item 1B. Unresolved Staff Comments . . . . . . . . . . . . . . . . . . . . . . . . . . . . . . . . . . . . . . . . . . . . . . . . . . . . . 9
Item 2. Properties . . . . . . . . . . . . . . . . . . . . . . . . . . . . . . . . . . . . . . . . . . . . . . . . . . . . . . . . . . . . . . . . . . . . 9
Item 3. Legal Proceedings . . . . . . . . . . . . . . . . . . . . . . . . . . . . . . . . . . . . . . . . . . . . . . . . . . . . . . . . . . . . . . 10
Item 4. Submission of Matters to a Vote of Security Holders . . . . . . . . . . . . . . . . . . . . . . . . . . . . . . . . . . 12
Executive Officers of the Registrant and Principal Executive Officers of Subsidiaries . . . . . . . . 13
PART II
Item 5. Market for the Registrant’s Common Equity, Related Stockholder Matters, and IssuerPurchases of Equity Securities . . . . . . . . . . . . . . . . . . . . . . . . . . . . . . . . . . . . . . . . . . . . . . . . . . 14
Item 6. Selected Financial Data . . . . . . . . . . . . . . . . . . . . . . . . . . . . . . . . . . . . . . . . . . . . . . . . . . . . . . . . . 16
Item 7. Management’s Discussion and Analysis of Financial Condition and Results of Operations . . . 17
Critical Accounting Policies . . . . . . . . . . . . . . . . . . . . . . . . . . . . . . . . . . . . . . . . . . . . . . . . . . . . . 37
Cautionary Information . . . . . . . . . . . . . . . . . . . . . . . . . . . . . . . . . . . . . . . . . . . . . . . . . . . . . . . . 41
Item 7A. Quantitative and Qualitative Disclosures About Market Risk . . . . . . . . . . . . . . . . . . . . . . . . . . . 41
Item 8. Financial Statements and Supplementary Data . . . . . . . . . . . . . . . . . . . . . . . . . . . . . . . . . . . . . . 42
Report of Independent Registered Public Accounting Firm . . . . . . . . . . . . . . . . . . . . . . . . . . . . 43
Item 9. Changes in and Disagreements with Accountants on Accounting and Financial Disclosure . . . 71
Item 9A. Controls and Procedures . . . . . . . . . . . . . . . . . . . . . . . . . . . . . . . . . . . . . . . . . . . . . . . . . . . . . . . . 71
Management’s Annual Report on Internal Control Over Financial Reporting . . . . . . . . . . . . . . 72
Report of Independent Registered Public Accounting Firm . . . . . . . . . . . . . . . . . . . . . . . . . . . . 73
Item 9B. Other Information . . . . . . . . . . . . . . . . . . . . . . . . . . . . . . . . . . . . . . . . . . . . . . . . . . . . . . . . . . . . . 74
PART III
Item 10. Directors, Executive Officers, and Corporate Governance . . . . . . . . . . . . . . . . . . . . . . . . . . . . . . 75
Item 11. Executive Compensation . . . . . . . . . . . . . . . . . . . . . . . . . . . . . . . . . . . . . . . . . . . . . . . . . . . . . . . . 75
Item 12. Security Ownership of Certain Beneficial Owners and Management and Related StockholderMatters . . . . . . . . . . . . . . . . . . . . . . . . . . . . . . . . . . . . . . . . . . . . . . . . . . . . . . . . . . . . . . . . . . . . 75
Item 13. Certain Relationships and Related Transactions, and Director Independence . . . . . . . . . . . . . . 76
Item 14. Principal Accounting Fees and Services . . . . . . . . . . . . . . . . . . . . . . . . . . . . . . . . . . . . . . . . . . . . 76
PART IV
Item 15. Exhibits, Financial Statement Schedules . . . . . . . . . . . . . . . . . . . . . . . . . . . . . . . . . . . . . . . . . . . . 77
Signatures . . . . . . . . . . . . . . . . . . . . . . . . . . . . . . . . . . . . . . . . . . . . . . . . . . . . . . . . . . . . . . . . . . . . 78
Certifications . . . . . . . . . . . . . . . . . . . . . . . . . . . . . . . . . . . . . . . . . . . . . . . . . . . . . . . . . . . . . . . . . 88
2

PART I
Item 1. Business
GENERAL
Union Pacific Corporation owns one of America’s leading transportation companies. Its principal operatingcompany, Union Pacific Railroad Company, links 23 states in the western two-thirds of the country and serves thefastest-growing U.S. population centers. Union Pacific Railroad Company’s diversified business mix includesagricultural products, automotive, chemicals, energy, industrial products, and intermodal. It offers competitivelong-haul routes from all major West Coast and Gulf Coast ports to eastern gateways. Union Pacific RailroadCompany connects with Canada’s rail systems and is the only railroad serving all six major gateways to Mexico,making it North America’s premier rail franchise.
Union Pacific Corporation was incorporated in Utah in 1969 and maintains its principal executive offices at1400 Douglas Street, Omaha, NE 68179. The telephone number at that address is (402) 544-5000. The commonstock of Union Pacific Corporation is listed on the New York Stock Exchange (NYSE) under the symbol "UNP".
For purposes of this report, unless the context otherwise requires, all references herein to “UPC”,“Corporation”, “we”, “us”, and “our” shall mean Union Pacific Corporation and its subsidiaries, including UnionPacific Railroad Company, which we separately refer to as “UPRR” or the “Railroad”.
Available Information – Our Internet website is www.up.com. We make available free of charge on our website(under the “Investors” caption link) our annual reports on Form 10-K; our quarterly reports on Form 10-Q; ourcurrent reports on Form 8-K; our proxy statements; Forms 3, 4, and 5, filed on behalf of directors and executiveofficers; and amendments to such reports filed or furnished pursuant to the Securities Exchange Act of 1934, asamended (the Exchange Act), as soon as reasonably practicable after such material is electronically filed with, orfurnished to, the Securities and Exchange Commission (SEC). We also make available on our website previouslyfiled SEC reports and exhibits via a link to EDGAR on the SEC’s Internet site at www.sec.gov. Additionally, ourcorporate governance materials, including By-Laws, Board Committee charters, governance guidelines andpolicies, and codes of conduct and ethics for directors, officers, and employees are on our website. From time totime, the corporate governance materials on our website may be updated as necessary to comply with rules issuedby the SEC and the NYSE or as desirable to promote the effective and efficient governance of our company. Anysecurity holder wishing to receive, without charge, a copy of any of our SEC filings or corporate governancematerials should send a written request to: Secretary, Union Pacific Corporation, 1400 Douglas Street, Omaha,NE 68179.
We have included the CEO and CFO certifications regarding our public disclosure required by Section 302 ofthe Sarbanes-Oxley Act of 2002 as Exhibits 31(a) and (b) to this report. Additionally, we filed with the NYSE theCEO’s certification regarding our compliance with the NYSE’s Corporate Governance Listing Standards (ListingStandards) pursuant to Section 303A.12(a) of the Listing Standards, which was dated May 23, 2006, and indicatedthat the CEO was not aware of any violations of the Listing Standards by the Corporation.
References to our website address in this report, including references in Management’s Discussion andAnalysis of Financial Condition and Results of Operations, Item 7, are provided as a convenience and do notconstitute, and should not be deemed, an incorporation by reference of the information contained on, or availablethrough, the website. Therefore, such information should not be considered part of this report.
OPERATIONS
The Railroad, along with its subsidiaries and rail affiliates, is our one reportable operating segment. Althoughrevenue is analyzed by commodity group, we analyze the net financial results of the Railroad as one segment dueto the integrated nature of our rail network. Additional information regarding our operations is presented inSelected Financial Data, Item 6; Management’s Discussion and Analysis of Financial Condition and Results ofOperations, Item 7; and the Financial Statements and Supplementary Data, Item 8.
3

Operations – UPRR is a Class I railroad operating inthe United States. We have 32,339 route miles, linkingPacific Coast and Gulf Coast ports with the Midwestand eastern United States gateways and providingseveral corridors to key Mexican gateways. We serve thewestern two-thirds of the country and maintaincoordinated schedules with other rail carriers to movefreight to and from the Atlantic Coast, the PacificCoast, the Southeast, the Southwest, Canada, andMexico. Export and import traffic moves through GulfCoast and Pacific Coast ports and across the Mexicanand Canadian borders. UPRR’s freight traffic consistsof bulk, manifest, and premium business. Bulk traffic isprimarily coal, grain, rock, or soda ash in unit trains –trains transporting a single commodity from onesource to one destination. Manifest traffic is individualcarload or less than train-load business, includingcommodities such as lumber, steel, paper, and food.The transportation of finished vehicles and intermodalcontainers is part of the Railroad’s premium business.In 2006, the Railroad generated commodity revenuetotaling $14.9 billion from the following six commoditygroups:
2006 Commodity Revenue
Agricultural16%
Automotive10%
Chemicals14%
Energy20%
IndustrialProducts
21%
Intermodal19%
Agricultural – Transporting agricultural products, including whole grains, commodities produced from thesegrains, and food and beverage products, provided 16% of the Railroad’s 2006 commodity revenue. With access tomost major grain markets, the Railroad provides a critical link between the Midwest and western producing areasand export terminals in the Pacific Northwest (PNW) and Gulf ports, as well as Mexico. Unit trains of grainefficiently shuttle between producers and export terminals or domestic markets. UPRR also serves significantdomestic markets, including grain processors, animal feeders, and ethanol producers in the Midwest, West,South, and Rocky Mountain states. Primary food commodities consist of a variety of fresh and frozen fruits andvegetables, dairy products, and beverages, which are moved to major U.S. population centers for consumption.Express Lane and our recently inaugurated Produce Unit Train, our premium perishables services that movefruits and vegetables from the PNW and California with priority service to destinations in the East, compete withthe trucking industry. We transport frozen meat and poultry to the West Coast ports for export, while beverages,primarily beer, enter the U.S. from Mexico.
Automotive – UPRR is the largest automotive carrier west of the Mississippi River, serving seven vehicle assemblyplants and distributing imported vehicles from six West Coast ports and Houston. The Railroad off-loads finishedvehicles at 38 vehicle distribution centers for delivery by truck to all major western U.S. cities. In addition totransporting finished vehicles, UPRR provides expedited handling of automotive parts in both boxcars andintermodal containers to several assembly plants. The Railroad carries automotive materials bound for assemblyplants in Mexico, the U.S., and Canada and transports finished vehicles from manufacturing facilities in Mexico.In 2006, transportation of finished vehicles and automotive materials accounted for 10% of the Railroad’scommodity revenue.
Chemicals – Transporting chemicals provided 14% of the Railroad’s commodity revenue in 2006. The Railroad’sfranchise enables it to serve the chemical producing areas along the Gulf Coast, as well as the Rocky Mountainregion. Two-thirds of the chemicals business consists of liquid and dry chemicals, plastics, and liquid petroleumproducts. In addition to transporting plastics, customers also leverage UPRR’s storage-in-transit yards forintermediate storage of plastic resins. Soda ash shipments originate in southwestern Wyoming and Californiadestined primarily for glass producing markets in the East, the West, and abroad. Fertilizer movements originate
4
primarily in the Gulf Coast region, as well as the West and Canada, bound for major agricultural users in theMidwest and the western U.S.
Energy – Coal transportation accounted for 20% of the Railroad’s 2006 commodity revenue. The Railroad’sgeographic network allows it to transport coal destined for utilities and industrial facilities in 27 states, as well asto the Gulf and rail/barge/ship facilities on the Mississippi and Ohio Rivers and the Great Lakes. UPRR servesmines located in the Southern Powder River Basin of Wyoming (SPRB), Colorado, Utah, southern Wyoming, andsouthern Illinois. SPRB coal represents the largest growth segment of the market, as utilities continue to favor itslower cost and low-sulfur content.
Industrial Products – The Railroad’s extensive network enables the industrial products group to move numerouscommodities between thousands of origin and destination points throughout North America. Lumber shipmentsoriginate primarily in the PNW and Canada for destinations throughout the United States for new homeconstruction and repair and remodeling. Commercial and highway construction drives shipments of steel andconstruction products, consisting of rock, cement, and roofing materials. Paper and consumer goods, includingfurniture and appliances, are shipped to major metropolitan areas for consumers. Nonferrous metals andindustrial minerals are moved for industrial manufacturing. In addition, the Railroad provides efficient and safetransportation for government entities and waste companies. In 2006, transporting industrial products provided21% of the Railroad’s commodity revenue.
Intermodal – UPRR’s intermodal business, which represented 19% of the Railroad’s 2006 commodity revenue,includes international, domestic, and premium shipments. International business consists of imported containertraffic that arrives at West Coast ports via steamship for destinations throughout the United States. Domesticbusiness includes domestic container and trailer traffic for intermodal marketing companies (primarily shipperagents and consolidators) and truckload carriers. Less-than-truckload and package carriers with time-sensitivebusiness requirements account for the majority of our premium service.
Working Capital – We currently have, and historically have had, a working capital deficit, which is common inour industry and does not indicate a lack of liquidity or financial stability. We maintain adequate resources tomeet our daily cash requirements, and we have sufficient financial capacity to satisfy our current liabilities.
Competition – We are subject to competition from other railroads, motor carriers, and barge operators. Ourmain rail competitor is Burlington Northern Santa Fe Corporation. Its rail subsidiary, BNSF Railway Company(BNSF), operates parallel routes in many of our main traffic corridors. In addition, we operate in corridors servedby other railroads and motor carriers. Motor carrier competition is particularly strong for five of our sixcommodity groups. Because of the proximity of our routes to major inland and Gulf Coast waterways, bargecompetition can be particularly effective, especially for grain and bulk commodities. In addition to pricecompetition, we face competition with respect to transit times and quality and reliability of service. While wemust build or acquire and maintain our rail system, trucks and barges are able to use public rights-of-waymaintained by public entities. Any future improvements or expenditures materially increasing the quality orreducing the costs of these alternative modes of transportation, or legislation releasing motor carriers from theirsize or weight limitations, could have a material adverse effect on our results of operations, financial condition,and liquidity.
Equipment Suppliers – We depend on two key domestic suppliers of locomotives. Due to the capital intensivenature and sophistication of this equipment, high barriers to entry face potential new suppliers. Therefore, if oneof these domestic suppliers discontinues manufacturing locomotives, we could experience a significant costincrease and risk reduced availability of the locomotives that are necessary to our operations.
Employees – Approximately 87% of our 50,739 full-time-equivalent employees are represented by 14 major railunions. In January 2005, we began the current round of negotiations with the unions. Existing agreements remainin effect and will continue to remain in effect until new agreements are reached or the Railway Labor Act’s
5

procedures (which include mediation, cooling-off periods, and the possibility of Presidential intervention) areexhausted. Contract negotiations with the various unions generally take place over an extended period of time,and we rarely experience work stoppages during negotiations. The current agreements provide for periodic cost ofliving wage increases until new agreements are reached.
GOVERNMENTAL AND ENVIRONMENTAL REGULATION
Governmental Regulation – Our operations are subject to a variety of federal, state, and local regulations,generally applicable to all businesses (see also the discussion of certain regulatory proceedings in LegalProceedings, Item 3).
The operations of the Railroad are subject to the regulatory jurisdiction of the Surface Transportation Board(STB) of the United States Department of Transportation (DOT). The operations of the Railroad are also subjectto the regulations of the Federal Railroad Administration (FRA) of the DOT and other federal and state agencies.The STB has jurisdiction over rates charged on certain regulated rail traffic; freight car compensation; transfer,extension, or abandonment of rail lines; and acquisition of control of rail common carriers. On January 26, 2007,the STB issued a decision limiting the manner in which U.S. railroads can calculate fuel surcharges on trafficregulated by the STB.
DOT and the Occupational Safety and Health Administration, along with other federal agencies, havejurisdiction over certain aspects of safety, movement of hazardous materials, movement and disposal ofhazardous waste, emissions requirements, and equipment standards. Various state and local agencies havejurisdiction over disposal of hazardous waste and seek to regulate movement of hazardous materials in areas nototherwise preempted by federal law.
Environmental Regulation – We are subject to extensive federal and state environmental statutes and regulationspertaining to public health and the environment. The statutes and regulations are administered and monitored bythe Environmental Protection Agency (EPA) and by various state environmental agencies. The primary lawsaffecting our operations are the Resource Conservation and Recovery Act, regulating the management anddisposal of solid and hazardous wastes; the Comprehensive Environmental Response, Compensation, andLiability Act, regulating the cleanup of contaminated properties; the Clean Air Act, regulating air emissions; andthe Clean Water Act, regulating waste water discharges.
Information concerning environmental claims and contingencies and estimated remediation costs is set forthin Management’s Discussion and Analysis of Financial Condition and Results of Operations – Critical AccountingPolicies – Environmental, Item 7.
Item 1A. Risk Factors
The information set forth in this Item 1A should be read in conjunction with the rest of the information includedin this report, including Item 7, Management’s Discussion and Analysis of Financial Condition and Results ofOperations, and Item 8, Financial Statements and Supplementary Data.
We Must Manage Both Significant Demand for Our Services and Network Capacity – Due to continuing demand forrail service and capacity constraints, we may experience network difficulties, including congestion and reducedvelocity, which may compromise the level of service we provide to our customers. This level of demand maycompound the impact of weather and weather-related events on our operations and velocity. Although wecontinue to improve our transportation plan, add capacity, and improve operations at our yards and otherfacilities, we cannot be sure that these measures will fully or adequately address any service shortcomings.Additionally, ongoing maintenance, restoration, and improvements in the SPRB could adversely affect coalshipments during the year. We also cannot be sure that we will not experience other difficulties related to
6

network capacity, dramatic and unplanned increases of demand for rail service in one or more of our commoditygroups, or other events that could have a negative impact on our operational efficiency, any of which could have amaterial adverse effect on our results of operations, financial condition, and liquidity.
We May Be Subject to Various Claims and Lawsuits That Could Result in Significant Expenditures – The nature ofour business exposes us to the potential for various claims and litigation related to labor and employment,personal injury, property damage, environmental liability, and other matters. Any material changes to litigationtrends or a catastrophic rail accident or series of accidents involving any or all of property damage, personalinjury, and environmental liability could have a material adverse effect on our results of operations, financialcondition, and liquidity.
We Are Required to Transport Hazardous Materials – Federal laws require railroads, including UPRR, to transporthazardous materials. Any rail accident involving the release of hazardous materials could involve significant costsand claims for personal injury, property damage, and environmental penalties and remediation, which could havea material adverse effect on our results of operations, financial condition, and liquidity.
The Availability of Qualified Personnel Could Adversely Affect Our Operations – Changes in demographics, trainingrequirements, and the availability of qualified personnel, particularly engineers and trainmen, could negativelyimpact our ability to meet demand for rail service. Unpredictable increases in demand for rail services and a lackof network fluidity may exacerbate such risks, which could have a negative impact on our operational efficiencyand otherwise have a material adverse effect on our results of operations, financial condition, and liquidity.
We Are Subject to Significant Governmental Regulation – We are subject to governmental regulation by asignificant number of federal, state, and local authorities covering a variety of health, safety, labor, environmental(as discussed below), and other matters. Our failure to comply with applicable laws and regulations could have amaterial adverse effect on us. Governments may change the legislative or regulatory frameworks within which weoperate without providing us with any recourse for any adverse effects on our business. Economic re-regulation ofthe rail industry would negatively impact our ability to determine prices for rail services and reduce capitalspending on our rail network, resulting in a material adverse effect on our results of operations, financialcondition, and liquidity. Also, some laws and regulations require us to obtain and maintain various licenses,permits, and other authorizations, and we cannot guarantee that we will continue to be able to do so. In addition,one or more consolidations of Class I railroads could lead to future re-regulation of the rail industry.
Severe Weather Could Result in Significant Business Interruptions and Expenditures – Severe weather conditions,events, and other natural phenomena, including earthquakes, hurricanes, fires, floods, extreme temperatures, andsignificant precipitation may cause business interruptions, including line outages on our rail network that canadversely affect our entire rail network, and result in increased costs, increased liabilities, and decreased revenue,which could have a material adverse effect on our results of operations, financial condition, and liquidity.
Strikes or Work Stoppages Could Adversely Affect Our Operations as the Majority of Our Employees Belong to LaborUnions and Labor Agreements – We are a party to collective bargaining agreements with various labor unions. InJanuary 2005, we began the current round of negotiations with the unions. Disputes with regard to the terms ofthese agreements or our potential inability to negotiate acceptable contracts with these unions could result in,among other things, strikes, work stoppages, or other slowdowns by the affected workers. If unionized workerswere to engage in a strike, work stoppage, or other slowdown, or other employees were to become unionized, wecould experience a significant disruption of our operations or higher ongoing labor costs, either of which couldhave a material adverse effect on our results of operations, financial condition, and liquidity. Additionally, futurenational labor agreements, or renegotiation of labor agreements or provisions of labor agreements, couldcompromise our service reliability and significantly increase our costs for healthcare, wages, and other benefits,which could have a material adverse impact on our results of operations, financial condition, and liquidity.
7

We Rely on Technology and Technology Improvements in Our Business Operations – We rely on informationtechnology in all aspects of our business. If we do not have sufficient capital to acquire new technology or if we areunable to implement new technology, we may suffer a competitive disadvantage within the rail industry and withcompanies providing other modes of transportation service, which could have a material adverse effect on ourresults of operations, financial condition, and liquidity. Additionally, if we experience significant disruption orfailure of one or more of our information technology systems, including computer hardware, software, andcommunications equipment, we could experience a service interruption, safety failure, security breach, or otheroperational difficulties, which could have a material adverse impact on our results of operations, financialcondition, and liquidity.
We Are Subject to Significant Environmental Laws and Regulations – Our operations are subject to extensivefederal, state, and local environmental laws and regulations concerning, among other things, emissions to the air;discharges to waters; handling, storage, transportation, and disposal of waste and other materials; and hazardousmaterial or petroleum releases. We generate and transport hazardous and non-hazardous waste in our operations,and we did so in our former operations. Environmental liability can extend to previously owned or operatedproperties, leased properties, and properties owned by third parties, as well as to properties we currently own.Environmental liabilities have arisen and may also arise from claims asserted by adjacent landowners or otherthird parties in toxic tort litigation. We have been and may be subject to allegations or findings that we haveviolated, or are strictly liable under, these laws or regulations. We could incur significant costs as a result of any ofthe foregoing, and we may be required to incur significant expenses to investigate and remediate known,unknown, or future environmental contamination, which could have a material adverse effect on our results ofoperations, financial condition, and liquidity.
Rising or Elevated Fuel Costs and Whether We Are Able to Mitigate These Costs with Fuel Surcharges CouldMaterially and Adversely Affect Our Business – Fuel costs constitute a significant portion of our transportationexpenses. Diesel fuel prices are subject to dramatic fluctuations, and significant price increases could have amaterial adverse effect on our operating results. Although we currently are able to recover a significant amount ofour increased fuel expenses through revenue from fuel surcharges, we cannot be certain that we will always be ableto mitigate rising or elevated fuel costs through surcharges. Future market conditions or legislative or regulatoryactivities could adversely affect our ability to apply fuel surcharges or adequately recover increased fuel coststhrough fuel surcharges. International, political, and economic circumstances affect fuel prices and supplies.Weather can also affect fuel supplies and limit domestic refining capacity. If a fuel supply shortage were to arisefrom OPEC production curtailments, a disruption of oil imports, or other causes, higher fuel prices could, despiteour fuel surcharge programs, have a material adverse effect on our results of operations, financial condition, andliquidity.
We Face Competition from Other Railroads and Other Transportation Providers – We face competition from otherrailroads, motor carriers and, to a lesser extent, ships, barges, and pipelines. In addition to price competition, weface competition with respect to transit times and quality and reliability of service. While we must build or acquireand maintain our rail system, trucks and barges are able to use public rights-of-way maintained by public entities.Any future improvements or expenditures materially increasing the quality or reducing the cost of alternativemodes of transportation, or legislation releasing motor carriers from their size or weight limitations, could have amaterial adverse effect on our results of operations, financial condition, and liquidity. Additionally, any futureconsolidation of the rail industry could materially affect the competitive environment in which we operate.
We May Be Affected by General Economic Conditions – Prolonged negative changes in domestic and globaleconomic conditions affecting the producers and consumers of the commodities carried by us may have amaterial adverse effect on our results of operations, financial condition, and liquidity.
We Utilize Capital Markets – We rely on the capital markets to provide some of our capital requirements,including the issuance of commercial paper from time to time and the sale of certain of our receivables. Marketinstability or deterioration of our financial condition due to internal or external factors could restrict or prohibit
8
our access to commercial paper and reduce our credit ratings below investment grade, which would prohibit usfrom utilizing our sale of receivables program and significantly increase the cost of issuing debt.
We Are Dependent on Two Key Domestic Suppliers of Locomotives – Due to the capital intensive nature andsophistication of locomotive equipment, high barriers to entry face potential new suppliers. Therefore, if one ofthese domestic suppliers discontinues manufacturing locomotives, we could experience a significant cost increaseand risk reduced availability of the locomotives that are necessary to our operations.
We May Be Affected by Acts of Terrorism, War, or Risk of War – Our rail lines, facilities, and equipment, includingrail cars carrying hazardous materials, could be direct targets or indirect casualties of terrorist attacks. Terroristattacks, or other similar events, any government response thereto, and war or risk of war may adversely affect ourresults of operations, financial condition, and liquidity. In addition, insurance premiums for some or all of ourcurrent coverages could increase dramatically, or certain coverages may not be available to us in the future.
Item 1B. Unresolved Staff Comments
None.
Item 2. Properties
With operations in 23 states, we employ a variety of assets in the management and operation of our rail business.These assets include real estate, track and track structure, equipment, and facilities. We own and lease real estatethat we use in our operations, and we also own real estate that is not required for our business, which we sell fromtime to time. Our equipment includes owned and leased locomotives and rail cars; heavy maintenance equipmentand machinery; other equipment and tools in our shops, offices and facilities; and vehicles for maintenance,transportation of crews, and other activities. We operate numerous facilities, including terminals for intermodaland other freight; rail yards for train-building, switching, storage-in-transit (the temporary storage of customergoods in rail cars prior to shipment) and other activities; offices to administer and manage our operations;dispatch centers to direct traffic on our rail network; crew quarters to house train crews along our network; andshops and other facilities for fueling, maintenance, and repair of locomotives and repair and maintenance of railcars and other equipment. We spent approximately $2.2 billion in cash capital during 2006 for, among otherthings, building and maintaining track, structures and infrastructure; upgrading and augmenting equipment; andimplementing new technologies (see the capital investments table in Management’s Discussion and Analysis ofFinancial Condition and Results of Operations – Liquidity and Capital Resources – Financial Condition, Item 7).
Certain of our properties are subject to federal, state, and local laws and regulations governing the protectionof the environment (see discussion of environmental issues in Business – Governmental and EnvironmentalRegulation, Item 1, and Management’s Discussion and Analysis of Financial Condition and Results of Operations– Critical Accounting Policies – Environmental, Item 7).
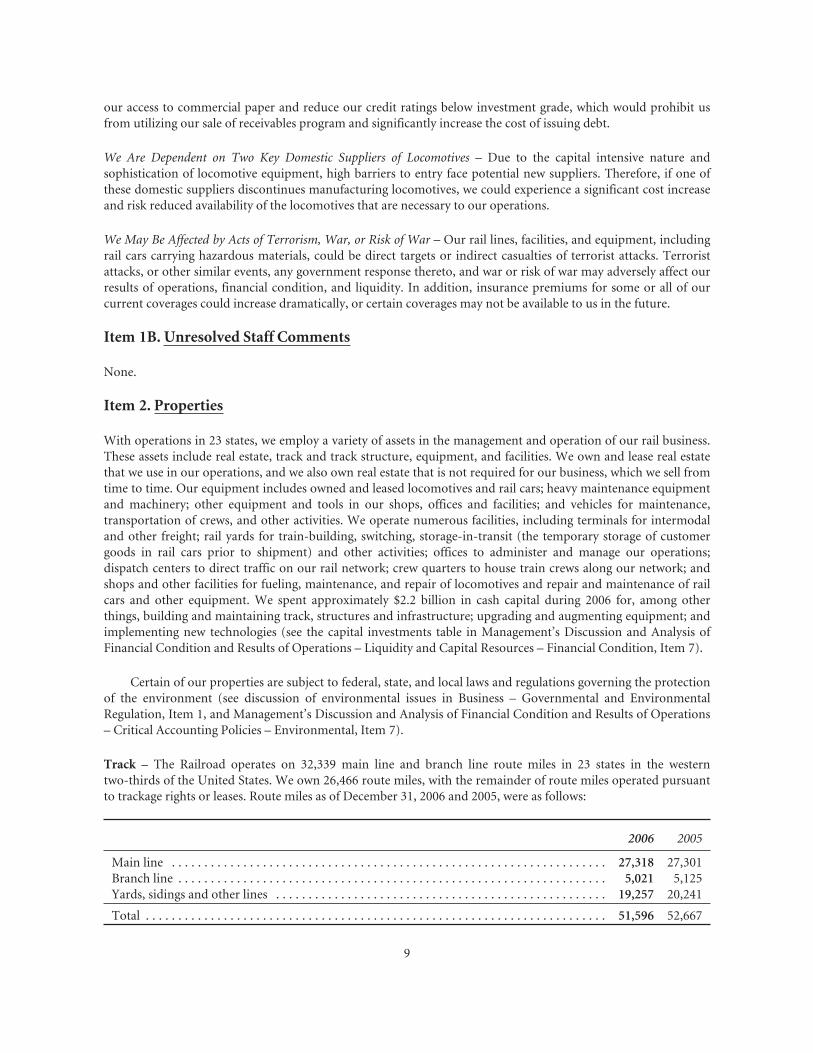
Track – The Railroad operates on 32,339 main line and branch line route miles in 23 states in the westerntwo-thirds of the United States. We own 26,466 route miles, with the remainder of route miles operated pursuantto trackage rights or leases. Route miles as of December 31, 2006 and 2005, were as follows:
2006 2005
Main line . . . . . . . . . . . . . . . . . . . . . . . . . . . . . . . . . . . . . . . . . . . . . . . . . . . . . . . . . . . . . . . . . . . 27,318 27,301Branch line . . . . . . . . . . . . . . . . . . . . . . . . . . . . . . . . . . . . . . . . . . . . . . . . . . . . . . . . . . . . . . . . . . 5,021 5,125Yards, sidings and other lines . . . . . . . . . . . . . . . . . . . . . . . . . . . . . . . . . . . . . . . . . . . . . . . . . . . 19,257 20,241
Total . . . . . . . . . . . . . . . . . . . . . . . . . . . . . . . . . . . . . . . . . . . . . . . . . . . . . . . . . . . . . . . . . . . . . . . 51,596 52,667
9

Rail and ties installed and replaced during the years ended December 31, 2006 and 2005 were as follows:
2006 2005
Track miles of rail:New . . . . . . . . . . . . . . . . . . . . . . . . . . . . . . . . . . . . . . . . . . . . . . . . . . . . . . . . . . . . . . . . . . . 632 661Used . . . . . . . . . . . . . . . . . . . . . . . . . . . . . . . . . . . . . . . . . . . . . . . . . . . . . . . . . . . . . . . . . . 361 312
Ties (000) . . . . . . . . . . . . . . . . . . . . . . . . . . . . . . . . . . . . . . . . . . . . . . . . . . . . . . . . . . . . . . . . . . 4,669 4,690
Equipment – Our primary rail equipment consisted of the following as of December 31, 2006 and 2005:
2006 2005
Owned or leased at year-end:Locomotives . . . . . . . . . . . . . . . . . . . . . . . . . . . . . . . . . . . . . . . . . . . . . . . . . . . . . . . . . . . . . . . . 8,475 8,226Freight cars:
Covered hoppers . . . . . . . . . . . . . . . . . . . . . . . . . . . . . . . . . . . . . . . . . . . . . . . . . . . . . . . . . 38,785 38,553Boxcars . . . . . . . . . . . . . . . . . . . . . . . . . . . . . . . . . . . . . . . . . . . . . . . . . . . . . . . . . . . . . . . . 24,342 26,770Open-top hoppers . . . . . . . . . . . . . . . . . . . . . . . . . . . . . . . . . . . . . . . . . . . . . . . . . . . . . . . 19,012 19,950Gondolas . . . . . . . . . . . . . . . . . . . . . . . . . . . . . . . . . . . . . . . . . . . . . . . . . . . . . . . . . . . . . . . 14,884 15,037Other . . . . . . . . . . . . . . . . . . . . . . . . . . . . . . . . . . . . . . . . . . . . . . . . . . . . . . . . . . . . . . . . . . 7,702 6,433
Work equipment and other . . . . . . . . . . . . . . . . . . . . . . . . . . . . . . . . . . . . . . . . . . . . . . . . . . . . 5,263 5,041
Item 3. Legal Proceedings
From time to time, the Corporation is involved in legal proceedings, claims, and litigation that occur inconnection with the Corporation’s business. Management routinely assesses the Corporation’s liabilities andcontingencies in connection with these matters based upon the latest information available. Consistent with SECrules and requirements, the Corporation describes below material pending legal proceedings (other than ordinaryroutine litigation incidental to the business of the Corporation), material proceedings known to be contemplatedby governmental authorities, other proceedings arising under federal, state, or local environmental laws andregulations (including governmental proceedings involving potential fines, penalties, or other monetary sanctionsin excess of $100,000) and such other pending matters that the Corporation may determine to be appropriate.
Environmental Matters
As we reported in our Quarterly Report on Form 10-Q for the quarter ended March 31, 2003, the San JoaquinCounty District Attorney filed an action against the Railroad on February 3, 2003, in the San Joaquin CountySuperior Court alleging claims under the California Business and Professions Code section 17200 (unfair businesspractices), Fish and Game Code section 5650 and 5650.1, California Health and Safety Code section 25189(d),and Public Nuisance, California Civil Code section 3480. The claims arise from a February 16, 2000, derailment inStockton, California, in which a locomotive struck an object on the tracks, puncturing a fuel tank. The DistrictAttorney alleged that diesel fuel from this spill entered waters of the State of California. The complaint alsoasserted claims under the above referenced statutes for any other diesel spill that may have occurred in the State ofCalifornia between 2000 and 2003, in which diesel may have passed into waters of the State of California. Itsought injunctive relief and civil penalties of $25,000 for the alleged February 16, 2000 diesel spill and totalpenalties of not less than $250,000 for all diesel spills that may have occurred since 2000. The District Attorneyfiled an amended complaint on April 10, 2003, which narrowed the claims to the incident of February 16, 2000.The amended complaint seeks both injunctive relief and daily penalties for each day that fuel was in the affectedwaterway, which could exceed $100,000.
As we reported in our Annual Report on Form 10-K for 2003, the District Attorneys of Merced, Madera, andStanislaus Counties in California filed a criminal case against the Railroad relating to a series of alleged releases of
10
calcium oxide (lime). The criminal case was dismissed in the last quarter of 2003 and was subsequently refiled as acivil action by several counties in the San Joaquin County Superior Court. The refiled suit sought civil penaltiesagainst the Railroad in connection with the release of lime from an unidentified rail car between Chowchilla andSacramento, California, on December 27, 2001, and another incident in which lime leaked from a rail car betweenChowchilla and Stockton, California, on February 21, 2002. The suit contended that regulatory violationsoccurred by virtue of the Railroad’s alleged failure to timely report the release of a “hazardous material,” itsalleged disposal of hazardous waste, and the alleged release of material into the waters of the State of California.On September 20, 2004, the Court dismissed the suit with prejudice. The State of California appealed thisdecision. On August 2, 2006, the Court of Appeals issued its decision, reversing the judgment and remanding thecase for further proceedings consistent with its opinion. The Court of Appeals held that the State of California’sclaims against the Railroad for civil penalties were preempted by the Hazardous Materials Transportation Act(HMTA), with the exception of those claims that were based upon the Railroad’s alleged failure to timely reportthe releases of calcium oxide to state and local authorities. With respect to these claims, the Court held that whilethey were not preempted by the HMTA on their face, it remained possible that those claims might ultimately bepreempted once the trial court developed a record. The Railroad and the State of California requested that theCalifornia Supreme Court review the decision of the Court of Appeals. The California Supreme Court deniedreview, and the case has been remanded to the Superior Court.
As we reported in our Quarterly Report on Form 10-Q for the quarter ended September 30, 2004, the IllinoisAttorney General’s office filed an Agreed Order and Complaint and a Complaint for Injunctive and Other Reliefon October 7, 2004, in the Circuit Court for the Twentieth Judicial Circuit (St. Clair County) against The Alton &Southern Railway Company, a wholly-owned subsidiary of the Railroad, as a result of a collision and derailmenton September 21, 2004. The State of Illinois seeks to enjoin The Alton & Southern Railway Company from furtherviolations, as well as a monetary penalty. The amount of the proposed penalty is uncertain but could exceed$100,000.
As we reported in our Annual Report on Form 10-K for 2005, we received information in 2001 indicatingEPA considered the Railroad a potentially responsible party for the Omaha Lead Site. The Omaha Lead Siteconsists of approximately 12,800 acres of residential property in the eastern part of Omaha, Nebraska, allegedlyimpacted by air emissions from two former lead smelters/refineries. One refinery was operated by ASARCO. EPAidentified the Railroad as a potentially responsible party because more than 60 years ago the Railroad owned landthat was leased to ASARCO. The Railroad disputes both the legal and technical base for EPA’s allegations. It hasnonetheless engaged in extensive negotiations with EPA. These negotiations have reached an apparent impasse.EPA issued a Unilateral Administrative Order with an effective date of December 16, 2005, directing the Railroadto implement an interim remedy at the site at an estimated cost of $50 million. Failure to comply with the orderwithout just cause could subject the Railroad to penalties of up to $32,500 per day and triple EPA’s costs inperforming the work. The Railroad believes it has just cause not to comply with the order, but it offered toperform some of the work specified in the order as a compromise. EPA rejected this offer. The Railroad willvigorously contest liability and the imposition of any penalties.
As we reported in our Annual Report on Form 10-K for 2005, the Illinois Attorney General’s office filed acomplaint in the Circuit Court for the Twenty-First Judicial Circuit (St. Clair County) seeking injunctive reliefand civil penalties against the Railroad relating to a collision between UPRR and Norfolk Southern RailwayCompany (NS) trains near Momence, Illinois, on November 24, 2005. The collision derailed approximately fivelocomotives and 30 railcars. Two of the UPRR locomotives and two of the NS locomotives caught fire and four ofthe locomotives released approximately 16,000 gallons of diesel fuel. Other cars carrying food products derailedand released an unknown amount of product. The Railroad promptly responded and remediation is ongoing. TheState of Illinois seeks a permanent injunction against the Railroad ordering UPRR to continue remediation. TheState of Illinois seeks to enjoin UPRR from further violations and a monetary penalty. The amount of theproposed penalty is uncertain.
As we reported in our Annual Report on Form 10-K for 2005, the Illinois Attorney General’s office filed acomplaint in the Circuit Court for the Twentieth Judicial Circuit (St. Clair County) for injunctive and other relief
11

on November 28, 2005, against the Railroad, alleging a diesel fuel spill from an above-ground storage tank in a railyard in Dupo, St. Clair County, Illinois. The State of Illinois seeks to enjoin UPRR from further violations and amonetary penalty. The amount of the proposed penalty is uncertain.
As we reported in our Annual Report on Form 10-K for 2003, the United States Attorney for the CentralDistrict of California notified the Railroad that the office intended to pursue criminal charges against the Railroadfor alleged violations of federal environmental laws, including the federal Clean Water Act, in connection withreleases of oil contaminated wastewater from our Taylor Yard in 2001 and 2003. On July 31, 2006, the UnitedStates Attorney filed criminal misdemeanor charges against us for these releases in the United States DistrictCourt for the Central District of California, and we received the Summons from the Court on August 8, 2006. Wewill vigorously defend the charges.
On October 23, 2006, the California Air Resources Board (ARB) notified the Railroad of its intent to imposecivil penalties as a result of the Railroad’s failure to perform and document annual opacity (smoke) testing for itsheavy duty diesel vehicle fleet. The ARB proposed that the Railroad pay $135,000 and agree to othernon-monetary conditions to settle these violations. Discussions between the Railroad and the ARB are continuing,and the ultimate amount of any penalty remains uncertain.
We received notices from EPA and state environmental agencies alleging that we are or may be liable underfederal or state environmental laws for remediation costs at various sites throughout the United States, includingsites on the Superfund National Priorities List or state superfund lists. We cannot predict the ultimate impact ofthese proceedings and suits because of the number of potentially responsible parties involved, the degree ofcontamination by various wastes, the scarcity and quality of volumetric data related to many of the sites, and thespeculative nature of remediation costs.
Information concerning environmental claims and contingencies and estimated remediation costs is set forthin Management’s Discussion and Analysis of Financial Condition and Results of Operations – Critical AccountingPolicies – Environmental, Item 7.
Other Matters
As we reported in our Quarterly Report on Form 10-Q for the quarter ended September 30, 2004, we werenotified that a qui tam, or private citizen, complaint was filed in the United States District Court for the CentralDistrict of California against, among other parties, the City of Long Beach, City of Long Beach HarborDepartment, Port of Long Beach (the Port), Union Pacific Corporation, Union Pacific Railroad Company, andUnion Pacific Resources Company, also known as Union Pacific Resources Group Inc. (Resources), a formersubsidiary of UPC. A private citizen filed the action because the federal government and the State of Californiaelected not to pursue the claims. The complaint alleges that the defendants violated the Federal Civil False ClaimsAct and the California False Claims Act by conspiring to use public funds to (1) shift environmental cleanupliability to the Port when Resources sold its Terminal Island oil field property to the Port in 1994 and (2) effect theacquisition by the Port of the Terminal Island property in which the Port (or the State of California) allegedlyalready held certain incidents of title. The complaint, which has not been served on us, seeks damages of $2.4billion, unspecified costs for remediating groundwater contamination, and triple damages and civil penalties of$10,000 per day. The plaintiff’s extended time to serve the complaint expired on April 4, 2005, and theCorporation filed a motion to dismiss for plaintiff’s failure to make timely service. However, the Court extendedthe plaintiff’s time to provide service. On December 7, 2005, we learned that a summons for service of thecomplaint had been issued, and we were served with the complaint during the fourth quarter of 2006. We disputethe factual and legal bases of the complaint. We notified Anadarko Petroleum Corporation (Anadarko), assuccessor to Resources after its acquisition in 2000, that an indemnification agreement between Resources and theCorporation obligates Anadarko to indemnify us for all damages, costs, and expenses related to the complaint.
Item 4. Submission of Matters to a Vote of Security Holders
No matters were submitted to a vote of security holders during the fourth quarter of 2006.
12

Executive Officers of the Registrant and Principal Executive Officers of Subsidiaries
Our executive officers generally are elected and designated annually by the Board of Directors at our first meetingheld after the Annual Meeting of Shareholders, and they hold office until their successors are elected. Executiveofficers also may be elected and designated throughout the year, as the Board of Directors considers appropriate.There are no family relationships among the officers, nor any arrangement or understanding between any officerand any other person pursuant to which the officer was selected. The following table sets forth certaininformation, as of February 16, 2007, relating to the executive officers.
Name Position Age
BusinessExperience
During Past FiveYears
James R. Young Chairman, President and Chief Executive Officer of UPCand the Railroad
54 (1)
Robert M. Knight, Jr. Executive Vice President – Finance and Chief FinancialOfficer of UPC and the Railroad
49 (2)
Charles R. Eisele Senior Vice President – Strategic Planning of UPC and theRailroad
57 Current Position
J. Michael Hemmer Senior Vice President – Law and General Counsel of UPCand the Railroad
57 (3)
Barbara W. Schaefer Senior Vice President – Human Resources and Secretary ofUPC and the Railroad
53 (4)
Lynden L. Tennison Senior Vice President and Chief Information Officer of UPCand the Railroad
47 (5)
Robert W. Turner Senior Vice President – Corporate Relations of UPC and theRailroad
57 Current Position
Bernard R. Gutschewski Vice President – Taxes of UPC and Vice President andGeneral Tax Counsel of the Railroad
56 Current Position
Mary E. McAuliffe Vice President – External Relations of UPC 60 Current Position
Richard J. Putz Vice President and Controller of UPC and Chief AccountingOfficer and Controller of the Railroad
59 Current Position
Mary Sanders Jones Vice President and Treasurer of UPC and Treasurer of theRailroad
54 Current Position
Dennis J. Duffy Executive Vice President – Operations of the Railroad 56 Current Position
John J. Koraleski Executive Vice President – Marketing and Sales of theRailroad
56 Current Position
(1) Mr. Young was elected Chief Executive Officer and President of UPC and the Railroad effective January 1, 2006. He was elected to theadditional position of Chairman effective February 1, 2007. He was elected President and Chief Operating Officer of the Railroad, effectiveFebruary 1, 2004, and he previously was Executive Vice President – Finance of UPC and Chief Financial Officer of the Railroad.
(2) Mr. Knight was elected to his current position effective February 1, 2004. He was elected Senior Vice President – Finance for UPC and theRailroad effective February 1, 2002, and he previously was Vice President and General Manager Automotive for the Railroad.
(3) Mr. Hemmer was elected to his current position effective June 1, 2004. Mr. Hemmer was elected Vice President – Law of the Railroad effectiveSeptember 1, 2002, and previously was a partner at the law firm of Covington & Burling in Washington, D.C.
(4) Mrs. Schaefer has held the position of Senior Vice President – Human Resources for the past five years. In addition, she was elected Secretary ofUPC and the Railroad effective June 1, 2004.
(5) Mr. Tennison was elected to his current position effective March 1, 2005. He previously was Vice President and Chief Technology Officer.
13

PART II
Item 5. Market for the Registrant’s Common Equity, Related Stockholder Matters, andIssuer Purchases of Equity Securities
Our common stock is traded on the NYSE under the symbol "UNP". The following table presents the dividendsdeclared and the high and low closing prices of our common stock for each of the indicated quarters.
2006 - Dollars Per Share Q1 Q2 Q3 Q4
Dividends . . . . . . . . . . . . . . . . . . . . . . . . . . . . . . . . . . . . . . . . . . . . . . . . . . . $ 0.30 $ 0.30 $ 0.30 $ 0.30Common stock price:
High . . . . . . . . . . . . . . . . . . . . . . . . . . . . . . . . . . . . . . . . . . . . . . . . . . . 93.73 97.49 92.96 96.16Low . . . . . . . . . . . . . . . . . . . . . . . . . . . . . . . . . . . . . . . . . . . . . . . . . . . . 77.62 83.83 78.65 86.27
2005 - Dollars Per Share
Dividends . . . . . . . . . . . . . . . . . . . . . . . . . . . . . . . . . . . . . . . . . . . . . . . . . . . $ 0.30 $ 0.30 $ 0.30 $ 0.30Common stock price:
High . . . . . . . . . . . . . . . . . . . . . . . . . . . . . . . . . . . . . . . . . . . . . . . . . . . 70.10 70.19 72.20 81.26Low . . . . . . . . . . . . . . . . . . . . . . . . . . . . . . . . . . . . . . . . . . . . . . . . . . . . 58.18 60.85 63.52 66.89
At January 31, 2007, there were 270,752,306 shares of outstanding common stock and 34,937 commonshareholders of record. At that date, the closing price of the common stock on the NYSE was $101.00. We havepaid dividends to our common shareholders during each of the past 107 years. We declared dividends totaling$323 million in 2006 and $316 million in 2005. On January 30, 2007, we increased the quarterly dividend to $0.35per share, payable beginning on April 2, 2007, to shareholders of record on February 28, 2007. We are subject tocertain restrictions regarding retained earnings with respect to the payment of cash dividends to our shareholders.The amount of retained earnings available for dividends increased to $7.8 billion at December 31, 2006, from $6.2billion at December 31, 2005.
Five-Year Performance Comparison – The following graph provides an indicator of cumulative total shareholderreturns for the Corporation as compared to a peer group index, comprised of Burlington Northern Sante FeCorporation, CSX Corporation, and Norfolk Southern Corporation; the Dow Jones Transportation Index (DowJones); and the Standard & Poor’s 500 Stock Index (S&P 500). The graph assumes that the value of the investmentin Union Pacific Corporation’s common stock and each index was $100 on December 31, 2001, and that alldividends were reinvested.
50
100
150
200
250
300
2001 2002 2003 2004 2005 2006
Val
ue
of $
100
Inve
stm
ent
UPC Peer Group DJ Trans S&P 500
Comparison of Five-Year Cumulative Returns
-
14

Comparison Over One- and Three-Year Periods – The following table presents the cumulative total shareholderreturns, assuming reinvested dividends, over one- and three-year periods for the Corporation, a peer group index(as described above), the Dow Jones, and the S&P 500.
Period UPCPeer
GroupDowJones S&P 500
1 Year . . . . . . . . . . . . . . . . . . . . . . . . . . . . . . . . . . . . . . . . . . . . . . . . . . . . . . . . . . 15.9% 10.8% 9.7% 15.8%3 Year . . . . . . . . . . . . . . . . . . . . . . . . . . . . . . . . . . . . . . . . . . . . . . . . . . . . . . . . . . 39.4 125.8 56.5 34.8
Purchases of Equity Securities – The purchased shares presented below relate solely to our equity compensationplans described in note 8 to the Financial Statements and Supplementary Data, Item 8. During the first ninemonths of 2006, 307,867 shares of our common stock were repurchased at an average price per share of $89.21.The following table presents common stock repurchases during each month for the fourth quarter of 2006:
Period
TotalNumberof Shares
Purchased
AveragePrice
Paid perShare
Total Number of SharesPurchased as Part of a
Publicly AnnouncedPlan or Program
Maximum Number ofShares That May YetBe Purchased Underthe Plan or Program
Oct. 1 through Oct. 31Employee transactions [a] . . . . . . . . . . 72,599 $90.31 N/A N/A
Nov. 1 through Nov. 30Employee transactions [a] . . . . . . . . . . 34,921 91.87 N/A N/A
Dec. 1 through Dec. 31Employee transactions [a] . . . . . . . . . . 12,699 95.38 N/A N/A
Total . . . . . . . . . . . . . . . . . . . . . . . . . . . . . 120,219 $91.30 N/A N/A
[a] Includes shares delivered or attested to UPC to pay stock option exercise prices or to satisfy tax withholding obligations for stock option exercisesor vesting of retention shares or units.
On January 30, 2007, our Board of Directors authorized us to repurchase up to 20 million shares of ourcommon stock through December 31, 2009. We may make these repurchases on the open market or throughother transactions. Our management will have sole discretion with respect to determining the timing and amountof these transactions (subject to the restrictions described above).
15

Job: 91327_002 Union Pacific Page: 16
Item 6. Selected Financial Data
The following table presents as of, and for the years ended, December 31, our selected financial data for each ofthe last five years. The selected financial data should be read in conjunction with Management’s Discussion andAnalysis of Financial Condition and Results of Operations, Item 7, and with the Financial Statements andSupplementary Data, Item 8. The information below is not necessarily indicative of the results of futureoperations.
Millions of Dollars, Except per Share Amounts,Carloads, Employee Statistics, and Ratios 2006 2005[a] 2004[b] 2003[c] 2002[d]
For the Year Ended December 31Operating revenue [e] . . . . . . . . . . . . . . . . . . . . . . . . . . . . . . . . $15,578 $13,578 $12,215 $11,551 $11,159Operating income . . . . . . . . . . . . . . . . . . . . . . . . . . . . . . . . . . . 2,884 1,795 1,295 2,133 2,253Income from continuing operations . . . . . . . . . . . . . . . . . . . . 1,606 1,026 604 1,056 1,265Net income . . . . . . . . . . . . . . . . . . . . . . . . . . . . . . . . . . . . . . . . 1,606 1,026 604 1,585 1,341Per share – basic:
Income from continuing operations . . . . . . . . . . . . . . . . . . 5.96 3.89 2.33 4.15 5.02Net income . . . . . . . . . . . . . . . . . . . . . . . . . . . . . . . . . . . . . . 5.96 3.89 2.33 6.23 5.32
Per share – diluted:Income from continuing operations . . . . . . . . . . . . . . . . . . 5.91 3.85 2.30 4.07 4.78Net income . . . . . . . . . . . . . . . . . . . . . . . . . . . . . . . . . . . . . . 5.91 3.85 2.30 6.04 5.05
Dividends declared per share . . . . . . . . . . . . . . . . . . . . . . . . . . 1.20 1.20 1.20 0.99 0.83Cash provided by operating activities . . . . . . . . . . . . . . . . . . . . 2,880 2,595 2,257 2,443 2,237
At December 31Total assets . . . . . . . . . . . . . . . . . . . . . . . . . . . . . . . . . . . . . . . . . $36,515 $35,620 $34,596 $33,496 $32,772Debt due after one year . . . . . . . . . . . . . . . . . . . . . . . . . . . . . . . 6,000 6,760 7,981 7,822 7,428Convertible preferred securities . . . . . . . . . . . . . . . . . . . . . . . . - - - - 1,500Common shareholders’ equity . . . . . . . . . . . . . . . . . . . . . . . . . 15,312 13,707 12,655 12,354 10,651Equity per common share [f] . . . . . . . . . . . . . . . . . . . . . . . . . . 56.68 51.41 48.58 47.85 41.99
Additional DataCommodity revenue [e] . . . . . . . . . . . . . . . . . . . . . . . . . . . . . . $14,862 $12,957 $11,692 $11,041 $10,663Carloads (000) . . . . . . . . . . . . . . . . . . . . . . . . . . . . . . . . . . . . . . 9,852 9,544 9,458 9,239 9,131Operating margin (%) [g] . . . . . . . . . . . . . . . . . . . . . . . . . . . . . 18.5 13.2 10.6 18.5 20.2Operating ratio (%) [g] . . . . . . . . . . . . . . . . . . . . . . . . . . . . . . . 81.5 86.8 89.4 81.5 79.8Average employees (000) . . . . . . . . . . . . . . . . . . . . . . . . . . . . . 50.7 49.7 48.3 46.4 47.3Operating revenue per employee (000) . . . . . . . . . . . . . . . . . . $ 307.2 $ 273.2 $ 252.9 $ 248.9 $ 235.9
Financial Ratios (%)Debt to capital [h] . . . . . . . . . . . . . . . . . . . . . . . . . . . . . . . . . . . 30.7 35.1 39.1 39.3 46.4Return on average common shareholders’ equity . . . . . . . . . . 11.1 7.8 4.8 13.8 13.3
[a] 2005 net income includes a $118 million tax expense reduction to reflect a reduction in the estimated deferred income tax liability.[b] 2004 operating income and net income includes a $247 million pre-tax ($154 million after-tax) charge for unasserted asbestos-related claims.[c] Net income and total assets include the effects of the acquisitions of Motor Cargo as of November 30, 2002, and reflect the disposition of all of
our trucking interests in 2003.[d] 2002 net income includes $214 million pre-tax ($133 million after-tax) gains on asset dispositions. In addition, net income includes a reduction
of income tax expense of $67 million related to tax adjustments for prior years’ income tax examinations.[e] Includes fuel surcharge revenue of $1,619 million, $963 million, $292 million, $93 million, and $7 million for 2006, 2005, 2004, 2003, and
2002, respectively.[f] Equity per common share is calculated as follows: common shareholders’ equity divided by common shares issued less treasury shares
outstanding.[g] Operating margin is defined as operating income divided by operating revenue. Operating ratio is defined as operating expenses divided by
operating revenue.[h] Debt to capital is determined as follows: total debt plus convertible preferred securities divided by total debt plus convertible preferred securities
plus equity.
16

Item 7. Management’s Discussion and Analysis of Financial Condition and Results ofOperations
The following discussion should be read in conjunction with the Consolidated Financial Statements andapplicable notes to the Financial Statements and Supplementary Data, Item 8, and other information in thisreport, including Risk Factors set forth in Item 1A and Critical Accounting Policies and Cautionary Informationat the end of this Item 7.
The Railroad, along with its subsidiaries and rail affiliates, is our one reportable operating segment. Althoughrevenue is analyzed by commodity group, we analyze the net financial results of the Railroad as one segment dueto the integrated nature of our rail network.
EXECUTIVE SUMMARY
2006 Results
Š Safety – Overall, safety results improved during 2006. The employee injury incident rate per 200,000man-hours dropped to its lowest level, which also reduced the number of lost workdays. A continued focuson derailment prevention in 2006 resulted in a 17% reduction in incidents with associated costs declining13%. In the area of public safety, we closed 410 grade crossings to reduce exposure and have video camerasin approximately 1,900, or 30%, of our road locomotive fleet to better analyze grade crossing incidents,thereby increasing safety for our employees and the public. The number of grade crossing incidents,however, increased 5% during the year, driven in part by the combination of increasing highway and railtraffic and urban expansion.
Š Financial Performance – In 2006, we generated record operating income of $2.9 billion. Solid demand, yieldincreases, and improved operational efficiency drove the 61% increase in operating income. Our operatingratio was 81.5% for the year, a 5 point improvement compared to 2005. Net income of $1.6 billion alsotopped our previous milestone, translating into $5.91 diluted earnings per share.
Š Commodity Revenue Growth – Our commodity revenue grew 15% year-over-year to $14.9 billion, thehighest level in our history. We achieved record revenue levels in all of our six commodity groups, primarilydriven by better pricing and fuel surcharges. Since 2004, we repriced approximately two-thirds of ourbusiness. Volume increased 3% to record levels in 2006, despite softening markets in some sectors in thesecond half of 2006.
Š Network Improvement – In 2006, the fluidity and efficiency of our transportation network improvedsubstantially, which allowed us to handle record volume levels. Continued focus on increasing velocity,eliminating work events, improving asset utilization, and expanding capacity were key drivers of ouroperational improvement. With ongoing enhancements to our Unified Plan and implementation of terminalprocessing initiatives, productivity improved, as demonstrated by 5% lower average terminal dwell time, a4% improvement in car utilization, and a 1% increase in average train speed. We continued implementationof an operational productivity initiative called CIMS (Customer Inventory Management System), whichcomplements the Unified Plan by reducing the number of cars in our terminals without adding capacity. Bythe end of 2006, CIMS managed the flow of almost 80% of the daily interchange of both loaded and emptyrailcars with our customers. We also expanded capacity and continued to use industrial engineeringtechniques to further improve network fluidity, ease capacity constraints, and improve asset utilization. Ourcustomers rated us higher on their satisfaction surveys during 2006, an indication that efforts to improvenetwork operations translated into better customer service.
Š Fuel Prices – Fuel prices increased again in 2006 for the fourth consecutive year, raising our average systemfuel price by 16% and adding $393 million of operating expenses compared to 2005. After a fairly stable firstquarter, fuel prices increased dramatically during the spring and summer months, as crude oil pricesaveraged over $70 per barrel during the second and third quarters. July and August fuel prices were alsoaffected by high diesel conversion spreads and large, regional spreads mainly driven by new government
17

regulations that imposed certain usage restrictions on high sulfur diesel fuel. Many refineries ceasedproducing high sulfur diesel fuel and many pipelines stopped transporting high sulfur diesel fuel in ouroperating areas, which drove up the conversion and regional spreads. Despite some moderation during thefourth quarter, fuel prices were still higher than the beginning of the year. Our fuel surcharge programshelped offset the impact of these higher fuel prices in the form of higher revenue, recovering approximately90% of the additional expense incurred above our base fuel price of $0.75 per gallon for the year. In addition,our fuel conservation efforts allowed us to handle a 3% increase in gross ton-miles while improving ourconsumption rate by 2%. Simulator training, operating practices, and technology are all driving thisimprovement, saving us roughly 17 million gallons in 2006.
Š Free Cash Flow – Cash generated by operating activities totaled a record $2.9 billion, yielding free cash flowof $516 million in 2006. Free cash flow is defined as cash provided by operating activities, less cash used ininvesting activities and dividends paid.
Free cash flow is not considered a financial measure under accounting principles generally accepted in theUnited States (GAAP) by SEC Regulation G and Item 10 of SEC Regulation S-K. We believe free cash flow isimportant in evaluating our financial performance and measures our ability to generate cash without additionalexternal financings. Free cash flow should be considered in addition to, rather than as a substitute for, cashprovided by operating activities. The following table reconciles cash provided by operating activities (GAAPmeasure) to free cash flow (non-GAAP measure):
Millions of Dollars 2006 2005 2004
Cash provided by operating activities . . . . . . . . . . . . . . . . . . . . . . . . . . . . . . . . . . . . . . . $ 2,880 $ 2,595 $ 2,257Cash used in investing activities . . . . . . . . . . . . . . . . . . . . . . . . . . . . . . . . . . . . . . . . . . . (2,042) (2,047) (1,732)Dividends paid . . . . . . . . . . . . . . . . . . . . . . . . . . . . . . . . . . . . . . . . . . . . . . . . . . . . . . . . (322) (314) (310)
Free cash flow . . . . . . . . . . . . . . . . . . . . . . . . . . . . . . . . . . . . . . . . . . . . . . . . . . . . . . . . . $ 516 $ 234 $ 215
2007 Outlook
Š Safety – Operating a safe railroad benefits our employees, our customers, our shareholders, and the public.We will continue using a multi-faceted approach to safety, using technology, risk assessment, quality control,and training and education for our new and existing employees. From a public safety standpoint, we willcontinue our efforts to upgrade and close crossings, install video cameras on locomotives, and educate thepublic about crossing safety through various internal and industry programs, along with other activities.Additionally, we are working with private and public partners to develop better tank cars for transportationof chemicals.
Š Commodity Revenue Growth – We expect record revenue levels to continue in 2007 based on currenteconomic indicators, forecasted demand, and additional repricing opportunities. We established a target foryear-over-year commodity revenue growth of 6% to 7%. We are projecting yield increases in all of our majorcommodity groups and volume growth ranging from 2% to 3%. We expect volume growth primarily fromthe energy and intermodal commodity groups. We will continue to monitor the market for changingconditions and adjust our plan accordingly.
Š Transportation Plan – In 2007, we will continue to evaluate traffic flows and network logistic patterns toidentify additional opportunities to simplify operations and improve network efficiency. We plan tomaintain adequate manpower and locomotives, improve productivity using industrial engineeringtechniques, and improve our operating margins.
Š Fuel Prices – We expect that fuel prices will remain volatile, with crude oil prices and conversion andregional spreads fluctuating throughout the year. To reduce the impact of fuel price on earnings, we willcontinue to seek recovery from our customers through our fuel surcharge programs and expand our fuelconservation efforts. As indicated in Item 1 of this report, the STB issued a decision limiting the manner in
18

which U.S. railroads can calculate fuel surcharges on traffic regulated by the STB. Currently, we do notbelieve this decision will prevent us from using fuel surcharges or adversely affect our ability to use fuelsurcharges to mitigate the impact of rising or elevated fuel prices on most or all of our traffic.
Š Capital Plan – In 2007, we expect to make capital investments of approximately $3.2 billion, which mayinclude long-term leases. These investments will be used to maintain track and structures; continue capacityexpansions on our main lines in constrained corridors; remove bottlenecks; upgrade and augmentequipment, including locomotives and railcars, to better meet customer needs; build and improve facilitiesand terminals; and develop and implement new technologies. We designed these investments to maintaininfrastructure for safety, enhance customer service, promote growth, and improve operational fluidity.Major capital projects in 2007 include adding more double track on the Sunset Corridor and related linecapacity; investing in new and existing facilities and terminals in Phoenix, Tucson, the LA Basin, SanAntonio, Dallas/Fort Worth, and Houston; continuing improvements of the SPRB Joint Line; andcontinuing installation of centralized track control across Iowa and Nebraska, which enables us to increaseproductivity on these rail lines. We expect to fund our 2007 cash capital investments through cash generatedfrom operations, the sale or lease of various operating and non-operating properties, and cash on hand atDecember 31, 2006. This focused capital plan is designed to help us improve network velocity and facilitaterevenue growth.
Š Financial Expectations – We are somewhat cautious about the economic environment; however, weanticipate revenue growth and continued network improvement in 2007, with financial results exceeding2006 levels. Our expectations include generating earnings growth of 10% to 15% and an operating ratiobelow 80%.
RESULTS OF OPERATIONS
Operating Revenue
Millions of Dollars 2006 2005 2004% Change
2006 v 2005% Change
2005 v 2004
Commodity revenue . . . . . . . . . . . . . . . . . . . . . . . . . $14,862 $12,957 $11,692 15% 11%Other revenue . . . . . . . . . . . . . . . . . . . . . . . . . . . . . . 716 621 523 15 19
Total . . . . . . . . . . . . . . . . . . . . . . . . . . . . . . . . . . . . . . $15,578 $13,578 $12,215 15% 11%
Operating revenue includes commodity revenue and other revenue. Other revenue consists primarily of revenueearned by our subsidiaries, revenue from our commuter rail operations, and accessorial revenue, which we earnwhen customers retain equipment owned or controlled by us. We recognize commodity revenue on apercentage-of-completion basis as freight moves from origin to destination. We allocate commodity revenuebetween reporting periods based on the relative transit time in each reporting period and recognize expenses aswe incur them. We recognize other revenue as service is performed or contractual obligations are met. Customerincentives, which are primarily provided for shipping a specified cumulative volume or shipping to/from specificlocations, are recorded as a reduction to revenue based on actual or projected future customer shipments.
All six commodity groups experienced double digit revenue growth during 2006, with particularly stronggrowth of over 20% in agricultural commodity revenue. Price increases, fuel surcharges, and index-based contractescalators, which are formulas in our shipping contracts that correlate price adjustments to certain economicindices, all contributed to higher average revenue per car (ARC). Our fuel surcharge programs (excluding index-based contract escalators that contain some provision for fuel) generated an additional $656 million incommodity revenue compared to 2005, contributing 5% to commodity revenue growth. Volume increased 3%during the year led by solid growth in intermodal and energy shipments, which was partially offset by lowershipments of industrial products and chemicals. The year-over-year growth was also partially attributable to lowervolume in 2005 due to the January West Coast storm, SPRB Joint Line disruptions, Hurricane Rita, and theKansas washouts.
19

Commodity revenue improved in all six business groups during 2005, with double-digit growth in theagricultural, industrial products, and intermodal commodity groups. Fuel surcharges, price increases, and index-based contract escalators all contributed to higher ARC. Our fuel surcharge programs (excluding index-basedcontract escalators that contain some provision for fuel) generated an additional $671 million in commodityrevenue compared to 2004, which represents approximately 70% of the additional expense incurred above thebase fuel price for our fuel surcharge programs (currently, $0.75 per gallon). Although volume grew 1% for theyear, the severe weather and maintenance and restoration on the SPRB Joint Line constrained volume growth.
Other revenue increased in 2006, mainly driven by higher volumes. In addition, we generated highersubsidiary revenue from Bay Pacific Financial L.L.C. (Bay Pacific), an intermodal leasing entity, following theacquisition of our joint venture partner’s interest in Bay Pacific during the third quarter of 2005. Subsidiary andaccessorial revenue increased other revenue in 2005, mainly driven by higher volumes and the acquisition of BayPacific.
The following tables summarize the year-over-year changes in commodity revenue, revenue carloads, andaverage revenue per car by commodity group.
Commodity RevenueMillions of Dollars 2006 2005 2004
% Change2006 v 2005
% Change2005 v 2004
Agricultural . . . . . . . . . . . . . . . . . . . . . . . . . . . . . . . . $ 2,395 $ 1,971 $ 1,675 22% 18%Automotive . . . . . . . . . . . . . . . . . . . . . . . . . . . . . . . . 1,438 1,273 1,235 13 3Chemicals . . . . . . . . . . . . . . . . . . . . . . . . . . . . . . . . . 2,098 1,848 1,719 13 8Energy . . . . . . . . . . . . . . . . . . . . . . . . . . . . . . . . . . . . 2,953 2,578 2,404 15 7Industrial Products . . . . . . . . . . . . . . . . . . . . . . . . . . 3,173 2,819 2,419 13 17Intermodal . . . . . . . . . . . . . . . . . . . . . . . . . . . . . . . . 2,805 2,468 2,240 14 10
Total . . . . . . . . . . . . . . . . . . . . . . . . . . . . . . . . . . . . . $14,862 $12,957 $11,692 15% 11%
Revenue CarloadsThousands 2006 2005 2004
% Change2006 v 2005
% Change2005 v 2004
Agricultural . . . . . . . . . . . . . . . . . . . . . . . . . . . . . . . . 923 883 883 5% -%Automotive . . . . . . . . . . . . . . . . . . . . . . . . . . . . . . . . 834 797 826 5 (4)Chemicals . . . . . . . . . . . . . . . . . . . . . . . . . . . . . . . . . 896 912 935 (2) (2)Energy . . . . . . . . . . . . . . . . . . . . . . . . . . . . . . . . . . . . 2,296 2,178 2,172 5 -Industrial Products . . . . . . . . . . . . . . . . . . . . . . . . . . 1,451 1,508 1,515 (4) -Intermodal . . . . . . . . . . . . . . . . . . . . . . . . . . . . . . . . 3,452 3,266 3,127 6 4
Total . . . . . . . . . . . . . . . . . . . . . . . . . . . . . . . . . . . . . 9,852 9,544 9,458 3% 1%
Average Revenueper Car 2006 2005 2004
% Change2006 v 2005
% Change2005 v 2004
Agricultural . . . . . . . . . . . . . . . . . . . . . . . . . . . . . . . . $2,595 $2,233 $1,895 16% 18%Automotive . . . . . . . . . . . . . . . . . . . . . . . . . . . . . . . . 1,724 1,598 1,496 8 7Chemicals . . . . . . . . . . . . . . . . . . . . . . . . . . . . . . . . . 2,342 2,026 1,839 16 10Energy . . . . . . . . . . . . . . . . . . . . . . . . . . . . . . . . . . . . 1,286 1,184 1,107 9 7Industrial Products . . . . . . . . . . . . . . . . . . . . . . . . . . 2,187 1,868 1,597 17 17Intermodal . . . . . . . . . . . . . . . . . . . . . . . . . . . . . . . . 813 755 716 8 5
Total . . . . . . . . . . . . . . . . . . . . . . . . . . . . . . . . . . . . . $1,509 $1,358 $1,236 11% 10%
20
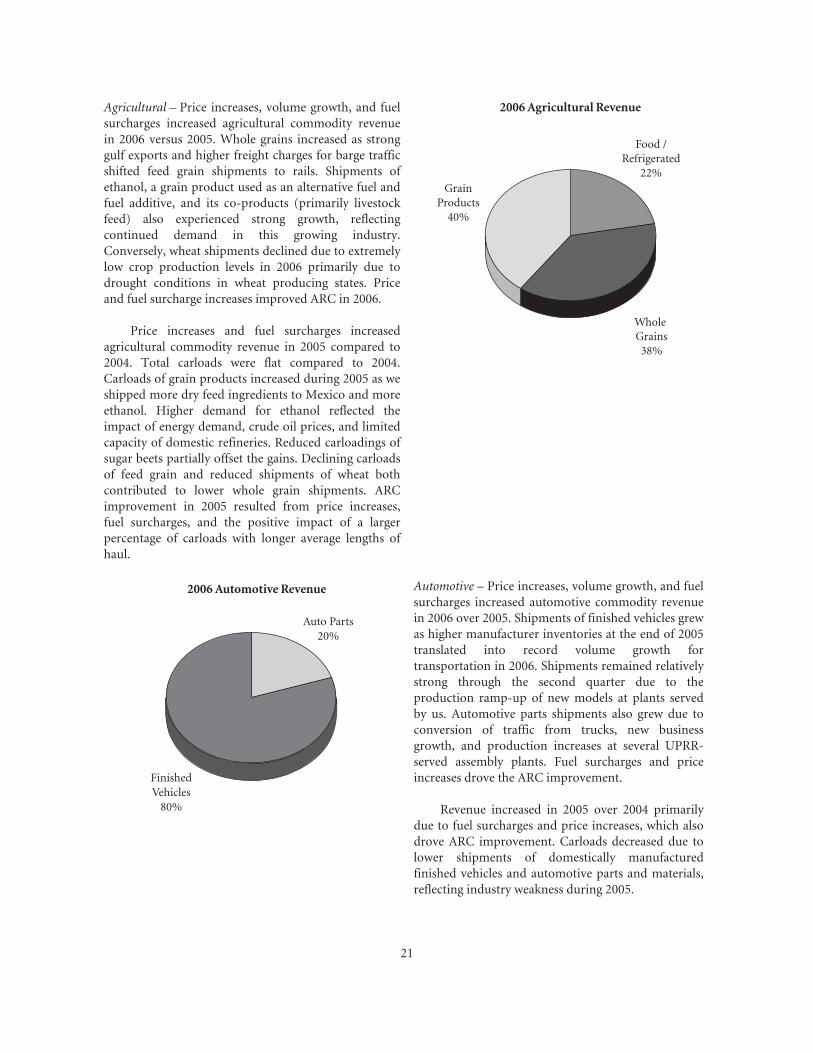
Agricultural – Price increases, volume growth, and fuelsurcharges increased agricultural commodity revenuein 2006 versus 2005. Whole grains increased as stronggulf exports and higher freight charges for barge trafficshifted feed grain shipments to rails. Shipments ofethanol, a grain product used as an alternative fuel andfuel additive, and its co-products (primarily livestockfeed) also experienced strong growth, reflectingcontinued demand in this growing industry.Conversely, wheat shipments declined due to extremelylow crop production levels in 2006 primarily due todrought conditions in wheat producing states. Priceand fuel surcharge increases improved ARC in 2006.
Price increases and fuel surcharges increasedagricultural commodity revenue in 2005 compared to2004. Total carloads were flat compared to 2004.Carloads of grain products increased during 2005 as weshipped more dry feed ingredients to Mexico and moreethanol. Higher demand for ethanol reflected theimpact of energy demand, crude oil prices, and limitedcapacity of domestic refineries. Reduced carloadings ofsugar beets partially offset the gains. Declining carloadsof feed grain and reduced shipments of wheat bothcontributed to lower whole grain shipments. ARCimprovement in 2005 resulted from price increases,fuel surcharges, and the positive impact of a largerpercentage of carloads with longer average lengths ofhaul.
Food /Refrigerated
22%
Whole Grains38%
GrainProducts
40%
2006 Agricultural Revenue
Auto Parts20%
FinishedVehicles
80%
2006 Automotive Revenue Automotive – Price increases, volume growth, and fuelsurcharges increased automotive commodity revenuein 2006 over 2005. Shipments of finished vehicles grewas higher manufacturer inventories at the end of 2005translated into record volume growth fortransportation in 2006. Shipments remained relativelystrong through the second quarter due to theproduction ramp-up of new models at plants servedby us. Automotive parts shipments also grew due toconversion of traffic from trucks, new businessgrowth, and production increases at several UPRR-served assembly plants. Fuel surcharges and priceincreases drove the ARC improvement.
Revenue increased in 2005 over 2004 primarilydue to fuel surcharges and price increases, which alsodrove ARC improvement. Carloads decreased due tolower shipments of domestically manufacturedfinished vehicles and automotive parts and materials,reflecting industry weakness during 2005.
21

Chemicals – Price increases, fuel surcharges, and index-based contract escalators drove the increase in revenueand ARC in 2006 versus 2005. Fewer fertilizershipments largely drove the volume decrease. Wetweather conditions in the Midwest led to weak demandduring the fall fertilizer season. In addition, softerexport markets for potash, a fertilizer product, also ledto reduced volumes. Business interruptions in the thirdquarter of 2005, primarily attributable to HurricaneRita, reduced chemicals shipments leading to favorablevolume comparisons in 2006.
Price increases, fuel surcharges, and highershipments of potash from Canada to Portland via theEastport, Idaho gateway for overseas export all droverevenue growth in 2005 versus 2004. Declines in liquidand dry chemicals, plastics, and petroleum shipments,in part due to the business interruptions caused byHurricane Rita, reduced volume. In addition, liquidand dry chemical shipments and plastic shipments werelower due to a weak export market, plant closures formaintenance, and the impact of an agreement with theBNSF for access to certain facilities in the Bayport,Texas area. ARC improved in 2005 due to priceincreases and fuel surcharges.
2006 Chemicals Revenue
Soda Ash18%
Plastics21%
Fertilizer13%
Petroleum& Other
23%
Liquid & DryChemicals
25%
2006 Energy Revenue
SPRB68%
Other8%
Colorado /Utah24%
Energy – Price increases, fuel surcharges, and index-based contract escalators primarily drove the increasesin revenue and ARC in 2006 over 2005. Volumeincreases also contributed to revenue growth as coalshipments from the SPRB mines improved 8% duringthe year. These increases in 2006 partially reflect lowervolume levels in 2005, as SPRB Joint Line disruptions,network disruptions resulting from Hurricane Rita,and the October Kansas washouts hampered coalshipments in 2005. Conversely, shipments from theColorado and Utah mines declined 6% in 2006 due tomine shutdowns during the first quarter of 2006,along with the impact of mining production problemsand network maintenance throughout the thirdquarter of 2006.
Revenue growth in 2005 over 2004 reflects higherprices, fuel surcharges, and index-based contractescalators. Although volume grew in the first quarter,carloads for 2005 were flat as a result of the extensivemaintenance and restoration work on the SPRB JointLine during the second, third, and fourth quarters, theimpact of Hurricane Rita, the Kansas washouts, andtemporary outages at mines in Colorado and Utahduring the fourth quarter of 2005. ARC was higherdue to price increases, higher fuel surcharges, andindex-based contract escalators.
22

Job: 91327_002 Union Pacific Page: 23
Industrial Products – Price increases and fuel surchargesimproved revenue and ARC in 2006 over 2005. Volumelevels declined due to lower lumber, paper, andnewsprint shipments, which were partially offset byhigher steel shipments. The softening of the housingmarket, lower production levels, and general marketuncertainty drove the reduction in lumber shipments.Conversely, strong domestic markets throughout mostof the year drove the increase in construction-relatedsteel material and pipe, particularly those materials usedin oil and gas drilling. Hurricane Rita reduced shipmentvolumes of industrial products in 2005, which favorablyaffected volume comparisons with 2006.
Price increases and fuel surcharges generatedrevenue growth in 2005 versus 2004. In particular,lumber shipments contributed to this growth due tosolid pricing gains and fuel surcharges. Revenue fromstone shipments increased revenue from constructionproducts due to strong construction demand, largertrain sizes, and improved car cycle times. Car cycle timeis defined as the amount of time that a car spends on oursystem measured from the origin of the loaded or emptymove until arrival at final destination. Overall carloadswere flat compared to 2004. Partially offsettingsubstantial volume growth of stone shipments werereduced paper moves, primarily newsprint and fiber, andfewer shipments of government materials, steel, andcement, resulting from softening markets, cementshortages in certain markets, and higher inventories.Price increases and fuel surcharges drove ARC increases.
2006 Industrial Products Revenue
Paper14%
Non-Ferrous14%Steel
18%
Other11%
Lumber25%
ConstructionProducts
18%
2006 Intermodal Revenue
International57%
Premium7%
Domestic36%
Intermodal – Record volume growth, fuel surcharges,price increases, and index-based contract escalatorscombined to improve revenue in 2006 over 2005 inaddition to the favorable impact from weaker intermodalrevenue during 2005 due to the January West Coaststorm. Carloadings grew due to strong imports,primarily from Asia, partially offset by decreaseddomestic traffic. ARC improved due to price increases,fuel surcharges, and contract escalators.
Revenue in 2005 improved over 2004 due to strongimports, primarily from China and the rest of Asia.However, business interruptions during the first quarterof 2005 due to the January West Coast storm limitedfull-year revenue growth. ARC improved due to priceincreases, fuel surcharges, and contract escalators.
Mexico Business – Each commodity group discussed above includes revenue from shipments to and from Mexico.Revenue from Mexico business increased 23% to $1.4 billion in 2006 compared to 2005. Price increases, fuelsurcharges, and shipments of finished vehicles, automotive parts, import beer, dry feed ingredients, and
23

intermodal drove revenue growth in 2006. Volume declines in coal, newsprint, and sulfur shipments partiallyoffset the increases.
In 2005, revenue from Mexico grew 15% to $1.1 billion, resulting primarily from price increases and fuelsurcharges. Carloads were flat versus 2004, as fewer automotive parts, energy, and intermodal shipments offsethigher agricultural and industrial shipments.
Operating Expenses
Millions of Dollars 2006 2005 2004% Change
2006 v 2005% Change
2005 v 2004
Salaries, wages, and employee benefits . . . . . . . . . . . $ 4,599 $ 4,375 $ 4,167 5% 5%Fuel and utilities . . . . . . . . . . . . . . . . . . . . . . . . . . . . 3,012 2,562 1,816 18 41Equipment and other rents . . . . . . . . . . . . . . . . . . . 1,455 1,402 1,374 4 2Depreciation . . . . . . . . . . . . . . . . . . . . . . . . . . . . . . . 1,237 1,175 1,111 5 6Materials and supplies . . . . . . . . . . . . . . . . . . . . . . . 691 546 488 27 12Casualty costs . . . . . . . . . . . . . . . . . . . . . . . . . . . . . . 410 411 694 - (41)Purchased services and other costs . . . . . . . . . . . . . . 1,290 1,312 1,270 (2) 3
Total . . . . . . . . . . . . . . . . . . . . . . . . . . . . . . . . . . . . . $12,694 $11,783 $10,920 8% 8%
Operating expenses increased $911 million in 2006.Higher fuel prices, which rose 16% during the period,accounted for $393 million of the increase. Our fuelsurcharge programs helped offset these expenses in theform of higher revenue, recovering approximately 90%of the additional expense incurred above our base fuelprice of $0.75 per gallon for the year. We base amajority of our fuel surcharges on the average U.S.diesel fuel price effective two months prior. Ourrecovery percentage improved from the first part of2006 due to the timing impact of our surcharges.Surcharge revenue began to recover higher fuel costsearlier in the year, and the two-month price lag caughtup with declining fuel prices during the fourth quarterof 2006. Conversely, fuel surcharge revenue during thefirst quarter of 2007 will decline as lower fourth quarterfuel prices will reduce most of our surcharges.
Wages, benefits, and materials and suppliesinflation; a larger workforce; volume-related expenses;and higher locomotive and freight car maintenance andlease expenses accounted for most of the additionalincrease in 2006. Settlement of all remaining insuranceclaims related to the 2005 January West Coast storm,an improved fuel consumption rate, and improved carcycle times (which reduced freight car rental expense)partially offset the cost increases. Additional clean-upand restoration costs for the 2005 January West Coaststorm favorably affects comparison of 2005 operatingexpenses with those in 2006.
2006 Operating Expenses
Materials5%
Equipment &Other12%
PurchasedServices &
Other10%Salaries &
Benefits36%
Casualty3%
Depreciation10%
Fuel &Utilities
24%
24

Operating expenses increased $863 million in 2005 versus 2004. Excluding the asbestos charge of $247million (pre-tax) in 2004, operating expenses increased $1.1 billion, or 10%. Significantly higher locomotive fuelprices accounted for $740 million of this increase (our fuel surcharge programs helped offset these expenses in theform of higher revenue). Inflation in wages, benefits, materials, and services, as well as a larger workforce, resultedin most of the additional increase. Also driving higher operating expenses were increased contract services andclean-up and restoration costs associated with the 2005 January West Coast storm.
Salaries, Wages, and Employee Benefits – General wage and benefit inflation increased expenses in 2006, reflectinghigher salaries and wages and the impact of higher healthcare costs and other benefit costs. A larger workforce,driven by higher volume levels, and stock option expense required by new accounting rules also contributed tohigher expenses. Conversely, reduced protection costs and operational improvements, boosted by networkmanagement initiatives and investment in capacity, partially offset these increases. Protection costs represent thedifferential payment when the wage earned for active employment is lower than an employee’s protected rate ofpay. An individual’s protected rate is imposed by the STB for employees adversely affected by a merger or isestablished by collective bargaining agreements with our labor unions in certain cases. Additionally, we incurredhigher labor expenses in 2005 for clean-up and restoration of property damaged by the January West Coast storm.
Several factors drove higher employment expenses in 2005. General wage and benefit inflation increasedexpenses, reflecting higher salaries and wages and the year-over-year impact of higher healthcare and otherbenefits costs. We also incurred higher expenses for management bonuses in 2005, as executive bonuses were notawarded for 2004 and bonuses for the professional workforce were significantly reduced in 2004. A 3% increase inour workforce and higher demand during 2005 also contributed to the increases. Additionally, labor expenses, inthe form of higher train crew costs and labor incurred for repair and clean-up activities, increased due to thehurricanes in the third quarter and the West Coast storm in the first quarter. Reduced severance and relocationcosts, increased network efficiency, and reduced training expenses partially offset these increases. Transferringvarious support personnel to Omaha, Nebraska, resulted in higher severance and relocation costs in 2004.
Fuel and Utilities
Millions of Dollars 2006 2005 2004% Change
2006 v 2005% Change
2005 v 2004
Locomotive fuel expense . . . . . . . . . . . . . . . . . . . . . $2,821 $2,393 $1,684 18% 42%Fuel surcharge revenue . . . . . . . . . . . . . . . . . . . . . . . 1,619 963 292 68 230
Fuel and utilities include locomotive fuel, utilities other than telephone, and gasoline and other fuels. Higherdiesel fuel prices, which averaged $2.06 per gallon (including taxes and transportation costs) in 2006 compared to$1.77 per gallon in 2005, increased expenses by $393 million. A 3% increase in gross ton-miles resulted in $63million of additional expenses, which was partially offset by a 2% improvement in our fuel consumption rate dueto the use of newer, more fuel-efficient locomotives and our fuel conservation programs. As noted above (anddescribed in this Item 7), we offset a significant portion of increased locomotive fuel expenses through revenuefrom fuel surcharges. Gasoline, utilities, and propane and other fuel expenses increased $20 million in 2006 due tohigher prices and increased usage.
In 2005, diesel fuel prices averaged $1.77 per gallon compared to $1.22 per gallon in 2004, increasingexpenses by $740 million. A 1% increase in gross ton-miles resulted in $8 million of additional expenses. Weoffset $39 million of these increases with a 2% improvement in our consumption rate in 2005 versus 2004. TheRailroad had no fuel hedges in place during 2005, whereas we hedged 120 million gallons of fuel in 2004.Gasoline, utilities, and propane expenses increased $37 million in 2005 versus 2004 due to higher prices.
Equipment and Other Rents – Equipment and other rents primarily includes rental expense the Railroad pays forfreight cars owned by other railroads or private companies; freight car, intermodal, and locomotive leases; other
25

specialty equipment leases; and office and other rentals. Lease expense increased in 2006 compared to 2005 as weleased more locomotives and freight cars. Growth in automotive and intermodal shipments also increased ourshort-term freight car rental expense. Improved car-cycle times driven by network management initiativespartially offset this increase.
In 2005, the number of leased locomotives and freight cars increased, resulting in higher lease expense.Carload volume growth also increased 2005 expenses. Improved car-cycle times partially offset these increaseswhich lowered our short-term freight car rental expense.
Depreciation – The majority of depreciation relates to track structure, including rail, ties, and other track material.A higher depreciable asset base, reflecting higher capital spending in recent years, and increased usage of ourassets combined for higher depreciation expense in 2006 and 2005.
Materials and Supplies – Materials used to maintain the Railroad’s lines, structures, and equipment are theprincipal components of materials and supplies expense. This expense item also includes small tools, officesupplies, other materials, and the costs of freight services to ship Railroad supplies and materials. We used morerepair materials at higher component costs to repair and maintain freight cars and our fleet of locomotives in2006, including a growing number of units not covered by warranties. In addition, we performed moremaintenance on locomotives that were maintained internally and not subject to maintenance contracts withthird-party contractors compared to 2005.
During 2005, materials and supplies expense increased, primarily due to locomotive and freight carmaintenance. We used more repair materials to maintain a larger fleet of locomotives, including a growingnumber of units not covered by warranties. Additionally, we incurred higher costs for car wheel sets, tractionmotors, and lube oil. Conversely, we incurred lower freight charges for shipping Railroad materials, and stationeryand office supplies.
Casualty Costs – Personal injury costs, freight and property damage, insurance, and environmental expense arethe primary components of casualty costs. Costs were flat in 2006 compared to 2005 as lower bad debt expenses,lower freight damage expenses, and lower expenses for destruction of foreign or leased equipment all offsetpersonal injury costs and higher settlement expenses.
In 2005, casualty costs were lower than the previous year primarily due to higher expenses incurred in 2004for an asbestos charge, a costly derailment near San Antonio, and a large jury verdict – affirmed in 2004 – for a1998 crossing accident. Lower freight and property damage expense and lower costs for destruction of foreign orleased equipment also reduced casualty costs. Conversely, we incurred higher insurance costs and increased costsfor third-party personal injuries and damages related to environmental exposures.
Purchased Services and Other Costs – Purchased services and other costs include the costs of services purchasedfrom outside contractors, state and local taxes, net costs of operating facilities jointly used by UPRR and otherrailroads, transportation and lodging for train crew employees, trucking and contracting costs for intermodalcontainers, leased automobile maintenance expenses, telephone and cellular expense, employee travel expense,and computer and other general expenses. Volume-related expenses, including crew transportation and lodgingcosts, increased in 2006 driven by 3% growth of carloads. Higher state and local taxes (primarily sales and usetaxes related to higher diesel fuel prices) also increased expenses in 2006 compared to 2005. Conversely, lowerlocomotive contract maintenance costs and lower expenses associated with jointly-owned operating facilitiesreduced expenses in 2006 compared to 2005. Settlement of all remaining insurance claims related to the2005 January West Coast storm and the gain from the sale of two airplanes also reduced expenses in 2006. Finally,clean-up and restoration costs related to the January West Coast storm increased expenses in 2005, which alsocontributed to lower year-over-year expenses in 2006.
Expenses increased in 2005 versus 2004 because we experienced higher volume-related costs for freight carand locomotive contract maintenance and crew transportation and lodging. Although our intermodal carloadings
26

increased over 4% in 2005, costs for trucking services provided by intermodal carriers remained flat as wesubstantially reduced expenses associated with network inefficiencies. Higher diesel fuel prices increased sales anduse taxes in 2005, which resulted in higher state and local taxes. Other contract expenses for equipmentmaintenance and other services increased in 2005. The 2005 January West Coast storm and Hurricanes Katrinaand Rita also contributed to higher expenses in 2005 (net of insurance settlements received). Partially offsettingthese increases was a reduction in relocation expenses as we incurred higher relocation costs associated withmoving support personnel to Omaha, Nebraska during 2004.
Non-Operating Items
Millions of Dollars 2006 2005 2004% Change
2006 v 2005% Change
2005 v 2004
Other income . . . . . . . . . . . . . . . . . . . . . . . . . . . . . . . $ 118 $ 145 $ 88 (19)% 65%Interest expense . . . . . . . . . . . . . . . . . . . . . . . . . . . . . (477) (504) (527) (5) (4)Income taxes . . . . . . . . . . . . . . . . . . . . . . . . . . . . . . . (919) (410) (252) 124 63
Other Income – Lower net gains from non-operating asset sales and higher expenses due to rising interest ratesassociated with our sale of receivables program resulted in a reduction in other income in 2006, which waspartially offset by higher rental income for the use of our right-of-way (including 2006 settlements of rate disputesfrom prior years) and cash investment returns due to higher interest rates.
In 2005, other income increased largely as a result of higher gains from real estate sales partially offset byhigher expenses due to rising interest rates associated with our sale of receivables program.
Interest Expense – Lower interest expense in 2006 and 2005 was primarily due to declining weighted-average debtlevels of $7.1 billion, $7.8 billion, and $8.1 billion in 2006, 2005, and 2004, respectively. A higher effective interestrate of 6.7% in 2006, compared to 6.5% in both 2005 and 2004, partially offset the effects of the declining debtlevel.
Income Taxes – Income tax expense was $509 million higher in 2006 than 2005. Higher pre-tax income resulted inadditional taxes of $414 million and $118 million of the increase resulted from the one-time reduction in 2005described below. Our effective tax rate was 36.4% and 28.6% in 2006 and 2005, respectively.
Income taxes were greater in 2005 than 2004 due to higher pre-tax income partially offset by a previouslyreported reduction in income tax expense. In our Quarterly Report on Form 10-Q for the quarter ended June 30,2005, we reported that the Corporation analyzed the impact that final settlements of pre-1995 tax years had onpreviously recorded estimates of deferred tax assets and liabilities. The completed analysis of the final settlementsfor pre-1995 tax years, along with Internal Revenue Service Examination Reports for tax years 1995 through 2002were considered, among other things, in a review and re-evaluation of the Corporation’s estimated deferred taxassets and liabilities as of September 30, 2005, resulting in an income tax expense reduction of $118 million in2005.
27

OPERATING AND FINANCIAL STATISTICS
Railroad Performance Measures
We report key Railroad performance measures weekly to the Association of American Railroads, includingcarloads, average daily inventory of rail cars on our system, average train speed, and average terminal dwell time.This operating data is available on our website at www.up.com/investors/reports/index.shtml.
Operating Statistics
2006 2005 2004% Change
2006 v 2005% Change
2005 v 2004
Average train speed (miles per hour) . . . . . . . . . . . . 21.4 21.1 21.4 1% (1)%Average terminal dwell time (hours) . . . . . . . . . . . . 27.2 28.7 30.5 (5) (6)Gross ton-miles (billions) . . . . . . . . . . . . . . . . . . . . . 1,072.5 1,043.9 1,037.5 3 1Revenue ton-miles (billions) . . . . . . . . . . . . . . . . . . . 565.2 548.8 546.3 3 -Average full-time equivalent employees . . . . . . . . . . 50,739 49,747 48,329 2 3
Average Train Speed – Average train speed is calculated by dividing train miles by hours operated on our mainlines between terminals. Ongoing network management initiatives and capacity expansion allowed us to move 3%more carloads in 2006 and improve average train speed 1%. In 2005, the January West Coast storm, disruptionson the SPRB Joint Line, business interruptions caused by Hurricane Rita, and the Kansas washouts in Octoberhampered efforts to improve our average train speed.
Average Terminal Dwell Time – Average terminal dwell time is the average time that a rail car spends at ourterminals. Lower average terminal dwell time is favorable. Average terminal dwell improved 5% and 6% in 2006and 2005, respectively, as a result of ongoing management initiatives and directed efforts to more timely deliverrail cars offline to our interchange partners and customers.
Gross and Revenue Ton-Miles – Gross ton-miles are calculated by multiplying the weight of loaded or emptyfreight cars by the number of miles hauled. Revenue ton-miles are calculated by multiplying the weight of freightby the number of tariff miles. In 2006, gross and revenue ton-miles grew 3% in relation to the 3% increase incarloadings as volume was balanced between the higher and lower density commodities. In 2005, gross ton-milesgrew 1%, in relation to a 1% increase of carloadings. Revenue ton-miles were flat in 2005.
Average Full-Time Equivalent Employees – Higher employee levels in 2006 and 2005 included more people tomaintain our larger locomotive and freight car fleet, the addition of employees needed to complete increased trackrepair and replacement programs, the hiring of operations management personnel, including an expandedmanagement training program, and train and engine personnel to manage current demand.
28

Return on Invested Capital
Millions of Dollars, Except Percentages 2006 2005 2004
Net income . . . . . . . . . . . . . . . . . . . . . . . . . . . . . . . . . . . . . . . . . . . . . . . . $ 1,606 $ 1,026 $ 604Add: Interest expense . . . . . . . . . . . . . . . . . . . . . . . . . . . . . . . . . . . . . . . . 477 504 527Add: Sale of receivables fees . . . . . . . . . . . . . . . . . . . . . . . . . . . . . . . . . . . 33 23 11Add: Interest on present value of operating leases . . . . . . . . . . . . . . . . . . 268 218 172Less: Taxes on interest and fees . . . . . . . . . . . . . . . . . . . . . . . . . . . . . . . . (283) (213) (209)
Net operating profit after taxes as adjusted (a) . . . . . . . . . . . . . . . . . . . . $ 2,101 $ 1,558 $ 1,105
Average equity . . . . . . . . . . . . . . . . . . . . . . . . . . . . . . . . . . . . . . . . . . . . . . $14,510 $13,181 $12,505Add: Average debt . . . . . . . . . . . . . . . . . . . . . . . . . . . . . . . . . . . . . . . . . . . 7,098 7,774 8,060Add: Average value of sold receivables . . . . . . . . . . . . . . . . . . . . . . . . . . . 600 595 590Add: Average present value of operating leases . . . . . . . . . . . . . . . . . . . . 3,349 2,729 2,147
Average invested capital as adjusted (b) . . . . . . . . . . . . . . . . . . . . . . . . . . $25,557 $24,279 $23,302
Return on invested capital as adjusted (a/b) . . . . . . . . . . . . . . . . . . . . . . 8.2% 6.4% 4.7%
Return on invested capital (ROIC) is considered a non-GAAP financial measure by SEC Regulation G andItem 10 of SEC Regulation S-K. We believe this measure is important in evaluating the efficiency and effectivenessof the Corporation’s long-term capital investments, and we currently use ROIC as a performance criteria indetermining certain elements of compensation for our executive officers and senior management. ROIC shouldbe considered in addition to, rather than as a substitute for, other information provided in accordance withGAAP. A comparable GAAP measure is Return on Equity, which is included in Selected Financial Data, Item 6.
Debt to Capital/Lease Adjusted Debt to Capital
Millions of Dollars, Except Percentages 2006 2005 2004
Debt (a) . . . . . . . . . . . . . . . . . . . . . . . . . . . . . . . . . . . . . . . . . . . . . . . . . . . $ 6,780 $ 7,416 $ 8,131Equity . . . . . . . . . . . . . . . . . . . . . . . . . . . . . . . . . . . . . . . . . . . . . . . . . . . . 15,312 13,707 12,655
Capital (b) . . . . . . . . . . . . . . . . . . . . . . . . . . . . . . . . . . . . . . . . . . . . . . . . . $22,092 $21,123 $20,786
Debt to capital (a/b) . . . . . . . . . . . . . . . . . . . . . . . . . . . . . . . . . . . . . . . . . 30.7% 35.1% 39.1%
Millions of Dollars, Except Percentages 2006 2005 2004
Debt . . . . . . . . . . . . . . . . . . . . . . . . . . . . . . . . . . . . . . . . . . . . . . . . . . . . . . $ 6,780 $ 7,416 $ 8,131Net present value of operating leases . . . . . . . . . . . . . . . . . . . . . . . . . . . . 3,513 3,185 2,273
Lease adjusted debt (a) . . . . . . . . . . . . . . . . . . . . . . . . . . . . . . . . . . . . . . . $10,293 $10,601 $10,404Equity . . . . . . . . . . . . . . . . . . . . . . . . . . . . . . . . . . . . . . . . . . . . . . . . . . . . 15,312 13,707 12,655
Lease adjusted capital (b) . . . . . . . . . . . . . . . . . . . . . . . . . . . . . . . . . . . . . $25,605 $24,308 $23,059
Lease adjusted debt to capital (a/b) . . . . . . . . . . . . . . . . . . . . . . . . . . . . . 40.2% 43.6% 45.1%
Lease adjusted debt to capital is considered a non-GAAP financial measure by SEC Regulation G and Item 10 ofSEC Regulation S-K. We believe this measure is important in evaluating the total amount of leverage in ourcapital structure including off-balance sheet lease obligations. We monitor the ratio of lease adjusted debt tocapital as we manage our capital structure to balance cost effective and efficient access to the capital markets withthe Corporation’s overall cost of capital. Lease adjusted debt to capital should be considered in addition to, ratherthan as a substitute for, debt to capital. The table above provides support for the lease adjusted debt to capitalcalculation. Our debt to capital ratios improved as a result of a $636 million reduction in debt from December 31,2005, and an increase in retained earnings due to higher net income in 2006.
29

LIQUIDITY AND CAPITAL RESOURCES
As of December 31, 2006, our principal sources of liquidity included cash, cash equivalents, the sale of receivables,and our revolving credit facilities, as well as the availability of commercial paper and other sources of financingthrough the capital markets. We had $2 billion of committed credit facilities available, of which there were noborrowings outstanding as of December 31, 2006, and we did not make any short-term borrowings under thesefacilities during the year. The value of the outstanding undivided interest held by investors under the sale ofreceivables program was $600 million as of December 31, 2006. The sale of receivables program is subject tocertain requirements, including the maintenance of an investment grade bond rating. If our bond rating were todeteriorate, it could have an adverse impact on our liquidity. Access to commercial paper is dependent on marketconditions. Deterioration of our operating results or financial condition due to internal or external factors couldnegatively impact our ability to utilize commercial paper as a source of liquidity. Liquidity through the capitalmarkets is also dependent on our financial stability.
At both December 31, 2006 and 2005, we had a working capital deficit of approximately $1.1 billion. Aworking capital deficit is common in our industry and does not indicate a lack of liquidity. We maintain adequateresources to meet our daily cash requirements, and we have sufficient financial capacity to satisfy our currentliabilities.
Financial Condition
Cash FlowsMillions of Dollars 2006 2005 2004
Cash provided by operating activities . . . . . . . . . . . . . . . . . . . . . . . . . . . . . . . . . . . . $ 2,880 $ 2,595 $ 2,257Cash used in investing activities . . . . . . . . . . . . . . . . . . . . . . . . . . . . . . . . . . . . . . . . (2,042) (2,047) (1,732)Cash used in financing activities . . . . . . . . . . . . . . . . . . . . . . . . . . . . . . . . . . . . . . . . (784) (752) (75)
Net change in cash and cash equivalents . . . . . . . . . . . . . . . . . . . . . . . . . . . . . . . . . $ 54 $ (204) $ 450
Cash Provided by Operating Activities – Higher income in 2006 generated the increased cash provided by operatingactivities, which was partially offset by higher income tax payments, $150 million in voluntary pensioncontributions, higher material and supply inventories, and higher management incentive payments in 2006.Higher income, lower management incentive payments in 2005 (executive bonuses, which would have been paidto individuals in 2005, were not awarded based on company performance in 2004 and bonuses for theprofessional workforce that were paid out in 2005 were significantly reduced), and working capital performancegenerated higher cash from operating activities in 2005. A voluntary pension contribution of $100 million in 2004also augmented the positive year-over-year variance in 2005 as no pension contribution was made in 2005. Thisimprovement was partially offset by cash received in 2004 for income tax refunds.
Cash Used in Investing Activities – An insurance settlement for the 2005 January West Coast storm and lowerbalances for work in process decreased the amount of cash used in investing activities in 2006. Higher capitalinvestments and lower proceeds from asset sales partially offset this decrease. Increased capital spending, partiallyoffset by higher proceeds from asset sales, increased the amount of cash used in investing activities in 2005compared to 2004.
Cash Used in Financing Activities – The increase in cash used in financing activities primarily resulted from lowernet proceeds from equity compensation plans ($189 million in 2006 compared to $262 million in 2005). Theincrease in 2005 results from debt issuances in 2004 and higher debt repayments in 2005. We did not issue debt in2005 versus $745 million of debt issuances in 2004, and we repaid $699 million of debt in 2005 compared to $588million in 2004. The higher outflows in 2005 were partially offset by higher net proceeds from equitycompensation plans ($262 million in 2005 compared to $80 million in 2004).
30

The table below details cash capital investments for the years ended December 31, 2006, 2005, and 2004.
Millions of Dollars 2006 2005 2004
Track . . . . . . . . . . . . . . . . . . . . . . . . . . . . . . . . . . . . . . . . . . . . . . . . . . . . . . . . . . . . . . . $1,487 $1,472 $1,328Capacity and commercial facilities . . . . . . . . . . . . . . . . . . . . . . . . . . . . . . . . . . . . . . . . 510 509 347Locomotives and freight cars . . . . . . . . . . . . . . . . . . . . . . . . . . . . . . . . . . . . . . . . . . . . 135 98 125Other . . . . . . . . . . . . . . . . . . . . . . . . . . . . . . . . . . . . . . . . . . . . . . . . . . . . . . . . . . . . . . . 110 90 76
Total . . . . . . . . . . . . . . . . . . . . . . . . . . . . . . . . . . . . . . . . . . . . . . . . . . . . . . . . . . . . . . . . $2,242 $2,169 $1,876
In 2007, we expect our total capital investments to be approximately $3.2 billion, which may include long-term leases. These investments will be used to maintain track and structures, continue capacity expansions on ourmain lines in constrained corridors, remove bottlenecks, upgrade and augment equipment to better meetcustomer needs, build and improve facilities and terminals, and develop and implement new technologies. Wedesigned these investments to maintain infrastructure for safety, enhance customer service, promote growth, andimprove operational fluidity. We expect to fund our 2007 cash capital investments through cash generated fromoperations, the sale or lease of various operating and non-operating properties, and cash on hand at December 31,2006. We expect that these sources will continue to provide sufficient funds to meet our expected capitalrequirements for 2007.
For the years ended December 31, 2006, 2005, and 2004, our ratio of earnings to fixed charges was 4.4, 2.9,and 2.1, respectively. The increases in 2006 and 2005 were driven by higher net income. The ratio of earnings tofixed charges was computed on a consolidated basis. Earnings represent income from continuing operations, lessequity earnings net of distributions, plus fixed charges and income taxes. Fixed charges represent interest charges,amortization of debt discount, and the estimated amount representing the interest portion of rental charges. SeeExhibit 12 for the calculation of the ratio of earnings to fixed charges.
Financing Activities
Credit Facilities – On December 31, 2006, we had $2 billion in revolving credit facilities available, including $1billion under a five-year facility expiring in March 2009 and $1 billion under a five-year facility expiring in March2010 (collectively, the "facilities"). The facilities are designated for general corporate purposes and support theissuance of commercial paper. Neither of the facilities were drawn on in 2006. Commitment fees and interest ratespayable under the facilities are similar to fees and rates available to comparably rated investment-grade borrowers.These facilities allow for borrowings at floating rates based on London Interbank Offered Rates, plus a spread,depending upon our senior unsecured debt ratings. The facilities require the maintenance of a minimum networth and a debt to net worth coverage ratio. At December 31, 2006, we were in compliance with these covenants.The facilities do not include any other financial restrictions, credit rating triggers (other than rating-dependentpricing), or any other provision that could require the posting of collateral.
In addition to our revolving credit facilities, we had $150 million in uncommitted lines of credit available,including $75 million that expires in March 2007 and $75 million expiring in May 2007. Neither of these lines ofcredit were used as of December 31, 2006. We must have equivalent credit available under our five-year facilitiesto draw on these $75 million lines.
Dividends – On January 30, 2007, we increased the quarterly dividend to $0.35 per share, payable beginning onApril 2, 2007, to shareholders of record on February 28, 2007. We expect to fund the increase in the quarterlydividend through cash generated from operations, the sale or lease of various operating and non-operatingproperties, and cash on hand at December 31, 2006.
Dividend Restrictions – We are subject to certain restrictions related to the payment of cash dividends to ourshareholders due to minimum net worth requirements under our credit facilities. Retained earnings available
31

for dividends increased to $7.8 billion at December 31, 2006, from $6.2 billion at December 31, 2005. We do notexpect that these restrictions will have a material adverse effect on our consolidated results of operations, financialcondition, or liquidity.
Common Stock Repurchases – On January 30, 2007, our Board of Directors authorized us to repurchase up to20 million shares of our common stock through December 31, 2009. We may make these repurchases on the openmarket or through other transactions. Our management will have sole discretion with respect to determining thetiming and amount of these transactions. We expect to fund our common stock repurchases through cashgenerated from operations, the sale or lease of various operating and non-operating properties, and cash on handat December 31, 2006.
Shelf Registration Statement – Under a current shelf registration statement, we may issue any combination ofdebt securities, preferred stock, common stock, or warrants for debt securities or preferred stock in one or moreofferings. At December 31, 2006, we had $500 million remaining for issuance under the current shelf registrationstatement. We have no immediate plans to issue any securities; however, we routinely consider and evaluateopportunities to replace existing debt or access capital through issuances of debt securities under this shelfregistration, and, therefore, we may issue debt securities at any time.
Operating Lease Activities
As of December 31, 2006, our contractual obligations for operating leases totaled approximately $5.5 billion.Discounted at 8%, the present value of this obligation was approximately $3.5 billion. The Railroad, as lessee,entered into long-term operating lease arrangements during 2006 to finance the majority of its new equipmentacquisitions. In 2006, the lessors under these lease arrangements purchased 200 locomotives and 2,100 freight carsfrom the Corporation through various financing transactions with a total equipment cost of approximately $523million and a present value of $427 million. These new lease arrangements provide for minimum total rentalpayments of approximately $777 million and are reflected in the contractual obligations table as of December 31,2006.
The lessors financed the purchase of the locomotives and freight cars, in part, by the issuance of equipmentnotes that are non-recourse to the Railroad and are secured by an assignment of the underlying leases and asecurity interest in the various types of equipment. Neither the Railroad nor UPC guarantees payment of theequipment notes. The Railroad’s obligations to make operating lease payments under the leases are recourseobligations and are not recorded in the Consolidated Statements of Financial Position.
The Railroad has certain renewal and purchase options with respect to the locomotives and freight cars. Ifthe Railroad does not exercise any such options, the equipment will be returned to the lessors at the end of thelease term.
Contractual Obligations and Commitments
As described in the notes to the Financial Statements and Supplementary Data, Item 8, and as referenced in thetables below, we have contractual obligations and commercial commitments that may affect our financialcondition. However, based on our assessment of the underlying provisions and circumstances of our contractualobligations and commercial commitments, including material sources of off-balance sheet and structured financearrangements, there is no known trend, demand, commitment, event, or uncertainty that is reasonably likely tooccur that would have a material adverse effect on our consolidated results of operations, financial condition, orliquidity. In addition, the commercial obligations, financings, and commitments made by us are customarytransactions that are similar to those of other comparable corporations, particularly within the transportationindustry.
32

The following tables identify material obligations and commitments as of December 31, 2006:
Payments Due by Period
Contractual ObligationsMillions of Dollars Total 2007 2008 2009 2010 2011
After2011
Debt [a] . . . . . . . . . . . . . . . . . . . . . . . . . . . . . $ 9,102 $1,035 $ 880 $ 693 $ 606 $ 656 $ 5,232Operating leases . . . . . . . . . . . . . . . . . . . . . . . 5,457 624 546 498 456 419 2,914Capital lease obligations [b] . . . . . . . . . . . . . 1,916 180 173 168 148 157 1,090Purchase obligations [c] . . . . . . . . . . . . . . . . 4,516 1,362 573 502 248 199 1,632Other post retirement benefits [d] . . . . . . . . 298 27 28 29 31 31 152
Total contractual obligations . . . . . . . . . . . . . $21,289 $3,228 $2,200 $1,890 $1,489 $1,462 $11,020
[a] Excludes capital lease obligations of $1,236 million, unamortized discount of $103 million, and market value adjustments of $14 million fordebt with qualifying hedges that are recorded as liabilities on the Consolidated Statements of Financial Position. Includes an interestcomponent of $3,441 million.
[b] Represents total obligations, including interest component of $680 million.[c] Purchase obligations include locomotive maintenance contracts; purchase commitments for locomotives, ties, ballast, and track; and agreements
to purchase other goods and services.[d] Includes estimated other postretirement, medical, and life insurance payments and payments made under the unfunded pension plan for the
next ten years. No amounts are included for funded pension as no contributions are currently required.
Amount of Commitment Expiration per Period
Other Commercial CommitmentsMillions of Dollars Total 2007 2008 2009 2010 2011
After2011
Credit facilities [a] . . . . . . . . . . . . . . . . . . . . . $2,000 $ - $ - $1,000 $1,000 $ - $ -Sale of receivables [b] . . . . . . . . . . . . . . . . . . . 600 600 - - - - -Guarantees [c] . . . . . . . . . . . . . . . . . . . . . . . . 464 5 6 18 45 75 315Standby letters of credit [d] . . . . . . . . . . . . . . 37 12 25 - - - -
Total commercial commitments . . . . . . . . . . $3,101 $617 $31 $1,018 $1,045 $75 $315
[a] None of the credit facilities were used as of December 31, 2006.[b] $600 million of the sale of receivables program was utilized at December 31, 2006.[c] Includes guaranteed obligations related to our headquarters building, equipment financings, and affiliated operations.[d] None of the letters of credit were drawn upon as of December 31, 2006.
Off-Balance Sheet Arrangements
Sale of Receivables – The Railroad transfers most of its accounts receivable to Union Pacific Receivables, Inc.(UPRI), a bankruptcy-remote subsidiary, as part of a sale of receivables facility. UPRI sells, without recourse on a364-day revolving basis, an undivided interest in such accounts receivable to investors. The total capacity to sellundivided interests to investors under the facility was $600 million at both December 31, 2006 and 2005. Thevalue of the outstanding undivided interest held by investors under the facility was $600 million at bothDecember 31, 2006 and 2005, respectively. The value of the outstanding undivided interest held by investors is notincluded in our Consolidated Financial Statements. The value of the undivided interest held by investors wassupported by $1,158 million and $1,226 million of accounts receivable held by UPRI at December 31, 2006 and2005, respectively. At December 31, 2006 and 2005, the value of the interest retained by UPRI was $558 millionand $626 million, respectively. This retained interest is included in accounts receivable in our ConsolidatedFinancial Statements. The interest sold to investors is sold at carrying value, which approximates fair value, andthere is no gain or loss recognized from the transaction.
33

The value of the outstanding undivided interest held by investors could fluctuate based upon the availabilityof eligible receivables and is directly affected by changing business volumes and credit risks, including default anddilution. If default or dilution percentages were to increase one percentage point, the amount of eligiblereceivables would decrease by $6 million. Should our credit rating fall below investment grade, the value of theoutstanding undivided interest held by investors would be reduced, and, in certain cases, the investors would havethe right to discontinue the facility.
The Railroad services the sold receivables; however, the Railroad does not recognize any servicing asset orliability as the servicing fees adequately compensate the Railroad for its responsibilities. The Railroad collectedapproximately $15.5 billion and $13.4 billion during the years ended December 31, 2006 and 2005, respectively.UPRI used certain of these proceeds to purchase new receivables under the facility.
The costs of the sale of receivables program are included in other income and were $33 million, $23 million,and $11 million for 2006, 2005, and 2004, respectively. The costs include interest, program fees paid to banks,commercial paper issuing costs, and fees for unused commitment availability.
The investors have no recourse to the Railroad’s other assets except for customary warranty and indemnityclaims. Creditors of the Railroad have no recourse to the assets of UPRI. In August 2006, the sale of receivablesprogram was renewed for an additional 364-day period without any significant changes in terms.
Guarantees – At December 31, 2006, we were contingently liable for $464 million in guarantees. We haverecognized a $6 million liability for the fair value of these obligations as of December 31, 2006. We entered intothese contingent guarantees in the normal course of business, and they include guaranteed obligations related toour headquarters building, equipment financings, and affiliated operations. The final guarantee expires in 2022.We are not aware of any existing event of default that would require us to satisfy these guarantees. We do notexpect that these guarantees will have a material adverse effect on our consolidated financial condition, results ofoperations, or liquidity.
OTHER MATTERS
Inflation – The cumulative effect of long periods of inflation significantly increases asset replacement costs forcapital-intensive companies. As a result, assuming that we replace all operating assets at current price levels,depreciation charges (on an inflation-adjusted basis) would be substantially greater than historically reportedamounts.
Derivative Financial Instruments – We may use derivative financial instruments in limited instances for otherthan trading purposes to assist in managing our overall exposure to fluctuations in interest rates and fuel prices.We are not a party to leveraged derivatives and, by policy, do not use derivative financial instruments forspeculative purposes. Derivative financial instruments qualifying for hedge accounting must maintain a specifiedlevel of effectiveness between the hedging instrument and the item being hedged, both at inception andthroughout the hedged period. We formally document the nature and relationships between the hedginginstruments and hedged items, as well as our risk-management objectives, strategies for undertaking the varioushedge transactions, and method of assessing hedge effectiveness. Changes in the fair market value of derivativefinancial instruments that do not qualify for hedge accounting are charged to earnings. We may use swaps, collars,futures, and/or forward contracts to mitigate the risk of adverse movements in interest rates and fuel prices;however, the use of these derivative financial instruments may limit future benefits from favorable pricemovements.
Market and Credit Risk – We address market risk related to derivative financial instruments by selectinginstruments with value fluctuations that highly correlate with the underlying hedged item. Credit risk related toderivative financial instruments, which is minimal, is managed by requiring high credit standards forcounterparties and periodic settlements. At December 31, 2006 and 2005, we were not required to providecollateral, nor had we received collateral, relating to our hedging activities.
34

Determination of Fair Value – We determined the fair values of our derivative financial instrument positions atDecember 31, 2006 and 2005 based upon current fair values as quoted by recognized dealers or developed basedupon the present value of expected future cash flows.
Sensitivity Analyses – The sensitivity analyses that follow illustrate the economic effect that hypothetical changes ininterest rates could have on our results of operations and financial condition. These hypothetical changes do notconsider other factors that could impact actual results.
Interest Rate Fair Value Hedges – We manage our overall exposure to fluctuations in interest rates by adjusting theproportion of fixed and floating rate debt instruments within our debt portfolio over a given period. We generallymanage the mix of fixed and floating rate debt through the issuance of targeted amounts of each as debt maturesor as we require incremental borrowings. We employ derivatives, primarily swaps, as one of the tools to obtain thetargeted mix. In addition, we also obtain flexibility in managing interest costs and the interest rate mix within ourdebt portfolio by evaluating the issuance of and managing outstanding callable fixed-rate debt securities.
Swaps allow us to convert debt from fixed rates to variable rates and thereby hedge the risk of changes in thedebt’s fair value attributable to the changes in interest rates. We account for swaps as fair value hedges using theshort-cut method pursuant to Financial Accounting Standards Board (FASB) Statement No. 133, Accounting forDerivative Instruments and Hedging Activities; therefore, we do not record any ineffectiveness within ourConsolidated Financial Statements. As of December 31, 2006 and 2005, we had interest rate swaps hedging debt of$500 million and $750 million, respectively.
At December 31, 2006 and 2005, we had variable-rate debt representing approximately 7% and 10%,respectively, of our total debt. If variable interest rates average one percentage point higher in 2007 than ourDecember 31, 2006 variable rate, which was approximately 8%, our interest expense would increase byapproximately $5 million. If variable interest rates averaged one percentage point higher in 2006 than ourDecember 31, 2005 variable rate, which was approximately 7%, our interest expense would have increased byapproximately $7 million. These amounts were determined by considering the impact of the hypothetical interestrates on the balances of our variable-rate debt at December 31, 2006 and 2005, respectively.
Market risk for fixed-rate debt is estimated as the potential increase in fair value resulting from ahypothetical one percentage point decrease in interest rates as of December 31, 2006, and amounts toapproximately $462 million at December 31, 2006. Market risk resulting from a hypothetical one percentage pointdecrease in interest rates as of December 31, 2005, amounted to approximately $535 million at December 31,2005. We estimated the fair values of our fixed-rate debt by considering the impact of the hypothetical interestrates on quoted market prices and current borrowing rates.
Interest Rate Cash Flow Hedges – We report changes in the fair value of cash flow hedges in accumulated othercomprehensive loss until the hedged item affects earnings. At December 31, 2006, we had a reduction of $5million recorded as an accumulated other comprehensive loss that is being amortized on a straight-line basisthrough September 30, 2014. As of December 31, 2006 and 2005, we had no interest rate cash flow hedgesoutstanding.
Fuel Cash Flow Hedges – Fuel costs are a significant portion of our total operating expenses. In 2006 and 2005, ourprimary means of mitigating the impact of adverse fuel price changes was our fuel surcharge programs. However,we may use swaps, collars, futures and/or forward contracts to further mitigate the impact of adverse fuel pricechanges. We did not have any fuel hedges in place during 2006 or 2005. We hedged 120 million gallons of fuelduring 2004 using collars with average cap, floor, and ceiling prices of $0.74, $0.64, and $0.86 per gallon,respectively.
Fuel Swaps – We entered into two fuel basis swaps for the period August 2006 through July 2008, which cover atotal of 151 million gallons of diesel fuel. These commodity basis swaps require us to make payments to,
35

or receive payments from, the counterparty based on the difference between certain price indices. Changes in thefair value of these swaps are reflected in fuel expense. We reported a derivative asset of approximately $2 millionat December 31, 2006, which represents the fair value of the swaps. The swaps reduced fuel expense for 2006 by $3million, which included monthly net settlements with the counterparty and the fair value recognition atDecember 31, 2006.
Accounting Pronouncements – In June 2006, the FASB issued Interpretation No. 48, Accounting for Uncertaintyin Income Taxes, an interpretation of FASB Statement No. 109 (FIN 48). Under the interpretation, we willrecognize tax benefits only for tax positions that are more likely than not to be sustained upon examination by taxauthorities. The amount recognized will be measured as the largest amount of benefit that is greater than 50percent likely of being realized upon ultimate settlement. The interpretation is effective for us beginning in thefirst quarter of 2007. The cumulative effect of adopting FIN 48 will be a one-time reduction in the January 1, 2007balance of retained earnings. Future changes in uncertain tax positions will be included in income tax expense.We do not expect that the cumulative effect of adopting FIN 48 will have a material impact on our ConsolidatedFinancial Statements.
In September 2006, the FASB issued Statement No. 157, Fair Value Measurement (FAS 157). While thisstatement does not require new fair value measurements, it provides guidance on applying fair value and expandsrequired disclosures. FAS 157 is effective for us beginning in the first quarter of 2008. We are currently assessingthe impact FAS 157 may have on our Consolidated Financial Statements.
In September 2006, the FASB issued Statement No. 158, Employers’ Accounting for Defined Benefit Pensionand Other Postretirement Plans (FAS 158). FAS 158 required us to recognize the funded status of our pension andpostretirement plans in the balance sheet, along with a corresponding noncash, after-tax adjustment toshareholders’ equity. Funded status is determined as the difference between the fair value of plan assets and thebenefit obligation. Changes in the funded status will be recognized in other comprehensive loss. We adopted FAS158 at the end of 2006 and have disclosed the impact of the adoption in note 7 of the Financial Statements andSupplementary Data, Item 8.
In September 2006, the SEC issued Staff Accounting Bulletin No. 108, Considering the Effects of Prior YearMisstatements when Quantifying Misstatements in Current Year Financial Statements (SAB 108). SAB 108 providesinterpretive guidance on how the effects of prior-year uncorrected misstatements should be considered whenquantifying misstatements in the current-year financial statements. SAB 108 requires registrants to quantifymisstatements using both an income statement and balance sheet approach and then evaluate whether eitherapproach results in a misstatement that, when all relevant quantitative and qualitative factors are considered, ismaterial. If prior-year errors that had been previously considered immaterial are now considered material basedon either approach, no restatement is required so long as management properly applied its previous approach andall relevant facts and circumstances were considered. If prior-year’s financial statements are not restated, thecumulative effect adjustment is recorded in opening accumulated earnings (deficit) as of the beginning of thefiscal year of adoption. SAB 108 was effective for us at the end of 2006. The adoption of SAB 108 did not have anyimpact on our Consolidated Financial Statements.
In February 2007, the FASB issued Statement No. 159, The Fair Value Option for Financial Assets andFinancial Liabilities (FAS 159). This statement, which is expected to expand fair value measurement, permitsentities to choose to measure many financial instruments and certain other items at fair value. FAS 159 is effectivefor us beginning in the first quarter of 2008. We are currently assessing the impact FAS 159 may have on ourConsolidated Financial Statements.
Asserted and Unasserted Claims – Various claims and lawsuits are pending against us and certain of oursubsidiaries. It is not possible at this time for us to determine fully the effect of all unasserted claims on ourconsolidated results of operations, financial condition, or liquidity; however, to the extent possible, whereunasserted claims are considered probable and where such claims can be reasonably estimated, we have recorded
36

a liability. We do not expect that any known lawsuits, claims, environmental costs, commitments, contingentliabilities, or guarantees will have a material adverse effect on our consolidated results of operations, financialcondition, or liquidity after taking into account liabilities previously recorded for these matters.
Indemnities – Our maximum potential exposure under indemnification arrangements, including certain taxindemnifications, can range from a specified dollar amount to an unlimited amount, depending on the nature ofthe transactions and the agreements. Due to uncertainty as to whether claims will be made or how they will beresolved, we cannot reasonably determine the probability of an adverse claim or reasonably estimate any adverseliability or the total maximum exposure under these indemnification arrangements. We do not have any reason tobelieve that we will be required to make any material payments under these indemnity provisions.
Insurance Subsidiaries – We have two consolidated, wholly-owned subsidiaries that provide insurance coveragefor certain risks, including physical loss or property damage and certain other claims that are subject toreinsurance.
CRITICAL ACCOUNTING POLICIES
Our Consolidated Financial Statements have been prepared in accordance with GAAP. The preparation of thesefinancial statements requires estimation and judgment that affect the reported amounts of revenue, expenses,assets, and liabilities. We base our estimates on historical experience and on various other assumptions that arebelieved to be reasonable under the circumstances, the results of which form the basis for making judgmentsabout the carrying values of assets and liabilities that are not readily apparent from other sources. The followingcritical accounting policies are a subset of our significant accounting policies described in note 1 to the FinancialStatements and Supplementary Data, Item 8. These critical accounting policies affect significant areas of ourfinancial statements and involve judgment and estimates. If these estimates differ significantly from actual results,the impact on our Consolidated Financial Statements may be material.
Asbestos – We are a defendant in a number of lawsuits in which current and former employees allege exposure toasbestos. During 2004, we engaged a third party with extensive experience in estimating resolution costs forasbestos-related claims to assist us in assessing our potential liability. As a result of this assessment, we increasedour liability in 2004 for resolving both asserted and unasserted asbestos-related claims through 2034. This liabilityexcludes future defense and processing costs. The liability for resolving both asserted and unasserted claims wasbased on the following assumptions:
• The number of future claims received would be consistent with historical averages.
• The number of claims filed against us will decline each year.
• The average settlement values for asserted and unasserted claims will be equivalent to historicalaverages.
• The percentage of claims dismissed in the future will be equivalent to historical averages.
Our asbestos-related liabilities were $302 million and $311 million at December 31, 2006 and 2005,respectively. The current portion of asbestos-related liabilities was $13 million and $16 million, respectively.Approximately 16% of the recorded liability related to asserted claims and approximately 84% related tounasserted claims. These claims are expected to be paid out over the next 28 years. We have insurance coveragefor a portion of the costs incurred to resolve asbestos-related claims, and, as a result of the 2004 assessment, weincreased our receivable for insurance recoveries related to asbestos during 2004. We have recognized an asset forestimated insurance recoveries at December 31, 2006 and 2005.
37

Our asbestos-related claims activity was as follows:
Claims Activity 2006 2005 2004
Open claims, beginning balance . . . . . . . . . . . . . . . . . . . . . . . . . . . . . . . . . . . . . . . . . . 2,435 2,316 2,560New claims . . . . . . . . . . . . . . . . . . . . . . . . . . . . . . . . . . . . . . . . . . . . . . . . . . . . . . . . . . 316 741 474Settled or dismissed claims . . . . . . . . . . . . . . . . . . . . . . . . . . . . . . . . . . . . . . . . . . . . . . (474) (622) (718)
Open claims, ending balance at December 31 . . . . . . . . . . . . . . . . . . . . . . . . . . . . . . . 2,277 2,435 2,316
During 2006 and 2005 our third-party consultants assisted us in reviewing our actual asbestos claimexperience compared to the assumptions used in the 2004 estimate, and we determined that no adjustment wasnecessary. We will continue to review actual experience and adjust our estimate as warranted.
We believe that our liability for asbestos-related claims and the estimated insurance recoveries reflectreasonable and probable estimates. The amounts recorded for asbestos-related liabilities and related insurancerecoveries were based on currently known facts. However, future events, such as the number of new claims to befiled each year, average settlement costs, and insurance coverage issues could cause the actual costs and insurancerecoveries to be higher or lower than the projected amounts. Estimates may also vary due to changes to strategies,activities, and outcomes of asbestos litigation, federal and state law governing litigation and compensation ofasbestos claimants, and the level of payments made to claimants by other defendants.
Environmental – We are subject to federal, state, and local environmental laws and regulations. We identified 367sites at which we are or may be liable for remediation costs associated with alleged contamination or for violationsof environmental requirements. This includes 44 sites that are the subject of actions taken by the U.S.government, 25 of which are currently on the Superfund National Priorities List. Certain federal legislationimposes joint and several liability for the remediation of identified sites; consequently, our ultimateenvironmental liability may include costs relating to activities of other parties, in addition to costs relating to ourown activities at each site.
Our environmental site activity was as follows:
Site Activity 2006 2005 2004
Open sites, beginning balance . . . . . . . . . . . . . . . . . . . . . . . . . . . . . . . . . . . . . . . . . . . 370 384 417New sites . . . . . . . . . . . . . . . . . . . . . . . . . . . . . . . . . . . . . . . . . . . . . . . . . . . . . . . . . . . . 50 56 59Closed sites . . . . . . . . . . . . . . . . . . . . . . . . . . . . . . . . . . . . . . . . . . . . . . . . . . . . . . . . . . (53) (70) (92)
Open sites, ending balance at December 31 . . . . . . . . . . . . . . . . . . . . . . . . . . . . . . . . . 367 370 384
When we identify an environmental issue with respect to property owned, leased, or otherwise used in theconduct of our business, we and our consultants perform environmental assessments on the property. Weexpense the cost of the assessments as incurred. We accrue the cost of remediation where our obligation isprobable and we can reasonably estimate such costs. We do not discount our environmental liabilities when thetiming of the anticipated cash payments is not fixed or readily determinable.
Environmental expense for the years ended December 31, 2006, 2005, and 2004 were $39 million, $45million, and $46 million, respectively. As of December 31, 2006 and 2005, we had a liability of $210 million and$213 million, respectively, accrued for future environmental costs, of which $54 million and $46 million,respectively, were recorded in current liabilities as accrued casualty costs. The liability includes future costs forremediation and restoration of sites, as well as ongoing monitoring costs, but excludes any anticipated recoveriesfrom third parties. Cost estimates are based on information available for each site, financial viability of other
38

potentially responsible parties, and existing technology, laws, and regulations. The ultimate liability forremediation is difficult to determine because of the number of potentially responsible parties involved, site-specific cost sharing arrangements with other potentially responsible parties, the degree of contamination byvarious wastes, the scarcity and quality of volumetric data related to many of the sites, and the speculative natureof remediation costs. Current obligations are not expected to have a material adverse effect on our consolidatedresults of operations, financial condition, or liquidity.
Personal Injury – The cost of personal injuries to employees and others related to our activities is charged toexpense based on estimates of the ultimate cost and number of incidents each year. We use third-party actuariesto assist us with measuring the expense and liability, including unasserted claims. The Federal Employers’ LiabilityAct (FELA) governs compensation for work-related accidents. Under FELA, damages are assessed based on afinding of fault through litigation or out-of-court settlements. We offer a comprehensive variety of services andrehabilitation programs for employees who are injured at work. Annual expenses for personal injury-relatedevents were $240 million in 2006, $247 million in 2005, and $288 million in 2004. As of December 31, 2006 and2005, we had accrued liabilities of $631 million and $619 million for future personal injury costs, respectively, ofwhich $233 million and $274 million was recorded in current liabilities as accrued casualty costs, respectively. Ourpersonal injury liability is discounted to present value using applicable U.S. Treasury rates. Approximately 87% ofthe recorded liability related to asserted claims, and approximately 13% related to unasserted claims. Estimatescan vary over time due to evolving trends in litigation.
Our personal injury claims activity was as follows:
Claims Activity 2006 2005 2004
Open claims, beginning balance . . . . . . . . . . . . . . . . . . . . . . . . . . . . . . . . . . . . . . . . . 4,197 4,028 4,085New claims . . . . . . . . . . . . . . . . . . . . . . . . . . . . . . . . . . . . . . . . . . . . . . . . . . . . . . . . . . 4,190 4,584 4,366Settled or dismissed claims . . . . . . . . . . . . . . . . . . . . . . . . . . . . . . . . . . . . . . . . . . . . . . (4,261) (4,415) (4,423)
Open claims, ending balance at December 31 . . . . . . . . . . . . . . . . . . . . . . . . . . . . . . . 4,126 4,197 4,028
Depreciation – The railroad industry is capital intensive. Properties are carried at cost. Provisions fordepreciation are computed principally on the straight-line method based on estimated service lives of depreciableproperty. The lives are calculated using a separate composite annual percentage rate for each depreciable propertygroup, based on the results of internal depreciation studies. We are required to submit a report on depreciationstudies and proposed depreciation rates to the STB for review and approval every three years for equipmentproperty and every six years for road property. The cost (net of salvage) of depreciable railroad property retired orreplaced in the ordinary course of business is charged to accumulated depreciation, and no gain or loss isrecognized. A gain or loss is recognized in other income for all other property upon disposition because the gainor loss is not part of rail operations. The cost of internally developed software is capitalized and amortized over afive-year period.
Significant capital spending in recent years increased the total value of our depreciable assets. Cash capitalspending totaled $2.2 billion for the year ended December 31, 2006. For the year ended December 31, 2006,depreciation expense was $1.2 billion. We use various methods to estimate useful lives for each group ofdepreciable property. Due to the capital intensive nature of the business and the large base of depreciable assets,variances to those estimates could have a material effect on our Consolidated Financial Statements. If theestimated useful lives of all depreciable assets were increased by one year, annual depreciation expense woulddecrease by approximately $43 million. If the estimated useful lives of all assets to be depreciated were decreasedby one year, annual depreciation expense would increase by approximately $45 million.
Income Taxes – As required under FASB Statement No. 109, Accounting for Income Taxes, we account for incometaxes by recording taxes payable or refundable for the current year and deferred tax assets and liabilities for thefuture tax consequences of events that have been recognized in our financial statements or tax returns. These
39

expected future tax consequences are measured based on provisions of tax law as currently enacted; the effects offuture changes in tax laws are not anticipated. Future tax law changes, such as a change in the corporate tax rate,could have a material impact on our financial condition or results of operations. For example, a 1% increase inthe federal income tax rate would increase our deferred tax liability by approximately $245 million.
When appropriate, we record a valuation allowance against deferred tax assets to offset future tax benefitsthat may not be realized. In determining whether a valuation allowance is appropriate, we consider whether it ismore likely than not that all or some portion of our deferred tax assets will not be realized, based in part onmanagement’s judgments regarding the best available evidence about future events. Based on that analysis, werecorded a valuation allowance of $5 million against certain deferred tax assets as of December 31, 2005. Therewas no valuation allowance as of December 31, 2006.
Pension and Other Postretirement Benefits – We use third-party actuaries to assist us in properly measuring theliabilities and expenses associated with providing pension and defined contribution medical and life insurancebenefits (OPEB) to eligible employees. In order to use actuarial methods to value the liabilities and expenses wemust make several assumptions. The critical assumptions used to measure pension obligations and expenses arethe discount rate and expected rate of return on pension assets. For OPEB, the critical assumptions are thediscount rate and healthcare cost trend rate.
We evaluate our critical assumptions at least annually, and selected assumptions are based on the followingfactors:
• Discount rate is based on a hypothetical portfolio of high quality corporate bonds (rated AA by arecognized rating agency) for which the timing and amount of cash flows matches our plan’s expectedbenefit payments.
• Expected return on plan assets is based on our asset allocation mix and our historical return, taking intoconsideration current and expected market conditions.
• Healthcare cost trend rate is based on our historical rates of inflation and expected market conditions.
The following tables present the key assumptions used to measure pension and OPEB expense for 2006 andthe estimated impact on 2006 pension and OPEB expense relative to a change in those assumptions:
Assumptions Pension OPEB
Discount rate . . . . . . . . . . . . . . . . . . . . . . . . . . . . . . . . . . . . . . . . . . . . . . . . . . . . . . . . . . . . . . . 5.75% 5.75%Salary increase . . . . . . . . . . . . . . . . . . . . . . . . . . . . . . . . . . . . . . . . . . . . . . . . . . . . . . . . . . . . . . 2.75% N/AExpected return on plan assets . . . . . . . . . . . . . . . . . . . . . . . . . . . . . . . . . . . . . . . . . . . . . . . . . 8.00% N/AHealthcare cost trend rate:
Current . . . . . . . . . . . . . . . . . . . . . . . . . . . . . . . . . . . . . . . . . . . . . . . . . . . . . . . . . . . . . . . N/A 9.00%Level in 2010 . . . . . . . . . . . . . . . . . . . . . . . . . . . . . . . . . . . . . . . . . . . . . . . . . . . . . . . . . . . N/A 5.00%
SensitivitiesIncrease
in Expense
Millions of Dollars Pension OPEB
0.25% decrease in discount rate . . . . . . . . . . . . . . . . . . . . . . . . . . . . . . . . . . . . . . . . . . . . . . . . . . $ 6 $ —0.25% increase in salary scale . . . . . . . . . . . . . . . . . . . . . . . . . . . . . . . . . . . . . . . . . . . . . . . . . . . . $ 1 N/A0.25% decrease in expected return on plan assets . . . . . . . . . . . . . . . . . . . . . . . . . . . . . . . . . . . . $ 4 N/A1% increase in healthcare cost trend rate . . . . . . . . . . . . . . . . . . . . . . . . . . . . . . . . . . . . . . . . . . . N/A $ 5
40

CAUTIONARY INFORMATION
Certain statements in this report, and statements in other reports or information filed or to be filed with the SEC(as well as information included in oral statements or other written statements made or to be made by us), are, orwill be, forward-looking statements as defined by the Securities Act of 1933 and the Securities Exchange Act of1934. These forward-looking statements include, without limitation, statements and information set forth underthe caption “2007 Outlook” in this Item 7, and any other statements or information in this report (includinginformation incorporated herein by reference) regarding: expectations as to operational or service improvements;expectations regarding the effectiveness of steps taken or to be taken to improve operations, service, infrastructureimprovements, transportation plan modifications, and management of customer traffic on the system to meetdemand; expectations as to cost savings, revenue growth, and earnings; the time by which goals, targets, orobjectives will be achieved; projections, predictions, expectations, estimates, or forecasts as to our business,financial and operational results, future economic performance, and general economic conditions; proposed newproducts and services; estimates of costs relating to environmental remediation and restoration; expectations thatclaims, litigation, environmental costs, commitments, contingent liabilities, labor negotiations or agreements, orother matters will not have a material adverse effect on our consolidated results of operations, financial condition,or liquidity and any other similar expressions concerning matters that are not historical facts.
Forward-looking statements should not be read as a guarantee of future performance or results, and will notnecessarily be accurate indications of the times that, or by which, such performance or results will be achieved.Forward-looking information is subject to risks and uncertainties that could cause actual performance or resultsto differ materially from those expressed in the statements.
Forward-looking statements and information reflect the good faith consideration by management ofcurrently available information, and may be based on underlying assumptions believed to be reasonable under thecircumstances. However, such information and assumptions (and, therefore, such forward-looking statementsand information) are or may be subject to variables or unknown or unforeseeable events or circumstances overwhich management has little or no influence or control. The Risk Factors in Item 1A of this report could affectour future results and could cause those results or other outcomes to differ materially from those expressed orimplied in the forward-looking statements.
Forward-looking statements speak only as of the date the statement was made. We assume no obligation toupdate forward-looking information to reflect actual results, changes in assumptions or changes in other factorsaffecting forward-looking information. If we do update one or more forward-looking statements, no inferenceshould be drawn that we will make additional updates with respect thereto or with respect to other forward-looking statements.
Item 7A. Quantitative and Qualitative Disclosures about Market Risk
Information concerning market risk sensitive instruments is set forth under Management’s Discussion andAnalysis of Financial Condition and Results of Operations — Other Matters, Item 7.
****************************************
41

Item 8. Financial Statements and Supplementary Data
Index to Consolidated Financial Statements Page
Report of Independent Registered Public Accounting Firm . . . . . . . . . . . . . . . . . . . . . . . . . . . . . . . . . . . . . . 43
Consolidated Statements of IncomeFor the Years Ended December 31, 2006, 2005, and 2004 . . . . . . . . . . . . . . . . . . . . . . . . . . . . . . . . . . . . . . 44
Consolidated Statements of Financial PositionAt December 31, 2006 and 2005 . . . . . . . . . . . . . . . . . . . . . . . . . . . . . . . . . . . . . . . . . . . . . . . . . . . . . . . . . . 45
Consolidated Statements of Cash FlowsFor the Years Ended December 31, 2006, 2005, and 2004 . . . . . . . . . . . . . . . . . . . . . . . . . . . . . . . . . . . . . . 46
Consolidated Statements of Changes in Common Shareholders’ EquityFor the Years Ended December 31, 2006, 2005, and 2004 . . . . . . . . . . . . . . . . . . . . . . . . . . . . . . . . . . . . . . 47
Notes to the Consolidated Financial Statements . . . . . . . . . . . . . . . . . . . . . . . . . . . . . . . . . . . . . . . . . . . . . . . 48
42

REPORT OF INDEPENDENT REGISTERED PUBLIC ACCOUNTING FIRM
Union Pacific Corporation, its Directors, and Shareholders:
We have audited the accompanying consolidated statements of financial position of Union Pacific Corporationand Subsidiary Companies (the Corporation) as of December 31, 2006 and 2005, and the related consolidatedstatements of income, changes in common shareholders’ equity, and cash flows for each of the three years in theperiod ended December 31, 2006. Our audits also included the financial statement schedule listed in the Table ofContents at Part IV, Item 15. These consolidated financial statements and financial statement schedule are theresponsibility of the Corporation’s management. Our responsibility is to express an opinion on the consolidatedfinancial statements and financial statement schedule based on our audits.
We conducted our audits in accordance with the standards of the Public Company Accounting OversightBoard (United States). Those standards require that we plan and perform the audit to obtain reasonable assuranceabout whether the financial statements are free of material misstatement. An audit includes examining, on a testbasis, evidence supporting the amounts and disclosures in the financial statements. An audit also includesassessing the accounting principles used and significant estimates made by management, as well as evaluating theoverall financial statement presentation. We believe that our audits provide a reasonable basis for our opinion.
In our opinion, such consolidated financial statements present fairly, in all material respects, the financialposition of Union Pacific Corporation and Subsidiary Companies as of December 31, 2006 and 2005, and theresults of their operations and their cash flows for each of the three years in the period ended December 31, 2006,in conformity with accounting principles generally accepted in the United States of America. Also, in our opinion,such financial statement schedule, when considered in relation to the basic consolidated financial statementstaken as a whole, presents fairly, in all material respects, the information set forth therein.
As discussed in Note 7 to the consolidated financial statements, in 2006 the Corporation adopted Statementof Financial Accounting Standard No. 158, Employers’ Accounting for Defined Benefit Pension and OtherPostretirement Plans.
We have also audited, in accordance with the standards of the Public Company Accounting Oversight Board(United States), the effectiveness of the Corporation’s internal control over financial reporting as of December 31,2006, based on the criteria established in Internal Control – Integrated Framework issued by the Committee ofSponsoring Organizations of the Treadway Commission and our report dated February 16, 2007 expressed anunqualified opinion on management’s assessment of the effectiveness of the Corporation’s internal control overfinancial reporting and an unqualified opinion on the effectiveness of the Corporation’s internal control overfinancial reporting.
Omaha, NebraskaFebruary 16, 2007
43

CONSOLIDATED STATEMENTS OF INCOMEUnion Pacific Corporation and Subsidiary Companies
Millions, Except Per Share Amounts,for the Years Ended December 31, 2006 2005 2004
Operating revenue . . . . . . . . . . . . . . . . . . . . . . . . . . . . . . . . . . . . . . . . . . . . . $15,578 $13,578 $12,215Operating expenses:
Salaries, wages, and employee benefits . . . . . . . . . . . . . . . . . . . . . . . . . . . 4,599 4,375 4,167Fuel and utilities . . . . . . . . . . . . . . . . . . . . . . . . . . . . . . . . . . . . . . . . . . . . 3,012 2,562 1,816Equipment and other rents . . . . . . . . . . . . . . . . . . . . . . . . . . . . . . . . . . . . 1,455 1,402 1,374Depreciation . . . . . . . . . . . . . . . . . . . . . . . . . . . . . . . . . . . . . . . . . . . . . . . 1,237 1,175 1,111Materials and supplies . . . . . . . . . . . . . . . . . . . . . . . . . . . . . . . . . . . . . . . . 691 546 488Casualty costs . . . . . . . . . . . . . . . . . . . . . . . . . . . . . . . . . . . . . . . . . . . . . . 410 411 694Purchased services and other costs . . . . . . . . . . . . . . . . . . . . . . . . . . . . . . 1,290 1,312 1,270
Total operating expenses . . . . . . . . . . . . . . . . . . . . . . . . . . . . . . . . . . . . . . . . 12,694 11,783 10,920
Operating income . . . . . . . . . . . . . . . . . . . . . . . . . . . . . . . . . . . . . . . . . . . . . 2,884 1,795 1,295Other income . . . . . . . . . . . . . . . . . . . . . . . . . . . . . . . . . . . . . . . . . . . . . . . . . 118 145 88Interest expense . . . . . . . . . . . . . . . . . . . . . . . . . . . . . . . . . . . . . . . . . . . . . . . (477) (504) (527)
Income before income taxes . . . . . . . . . . . . . . . . . . . . . . . . . . . . . . . . . . . . . 2,525 1,436 856Income taxes . . . . . . . . . . . . . . . . . . . . . . . . . . . . . . . . . . . . . . . . . . . . . . . . . (919) (410) (252)
Net income . . . . . . . . . . . . . . . . . . . . . . . . . . . . . . . . . . . . . . . . . . . . . . . . . . $ 1,606 $ 1,026 $ 604
Share and Per Share:Earnings per share – basic . . . . . . . . . . . . . . . . . . . . . . . . . . . . . . . . . . . . . $ 5.96 $ 3.89 $ 2.33Earnings per share – diluted . . . . . . . . . . . . . . . . . . . . . . . . . . . . . . . . . . . $ 5.91 $ 3.85 $ 2.30Weighted average number of shares – basic . . . . . . . . . . . . . . . . . . . . . . . 269.4 263.4 259.1Weighted average number of shares – diluted . . . . . . . . . . . . . . . . . . . . . 272.0 266.5 262.2
Dividends declared per share . . . . . . . . . . . . . . . . . . . . . . . . . . . . . . . . . . . . $ 1.20 $ 1.20 $ 1.20
The accompanying notes are an integral part of these Consolidated Financial Statements.
44

CONSOLIDATED STATEMENTS OF FINANCIAL POSITIONUnion Pacific Corporation and Subsidiary Companies
Millions of Dollars, as of December 31, 2006 2005
AssetsCurrent assets:
Cash and cash equivalents . . . . . . . . . . . . . . . . . . . . . . . . . . . . . . . . . . . . . . . . . . . . . . $ 827 $ 773Accounts receivable, net . . . . . . . . . . . . . . . . . . . . . . . . . . . . . . . . . . . . . . . . . . . . . . . . 679 747Materials and supplies . . . . . . . . . . . . . . . . . . . . . . . . . . . . . . . . . . . . . . . . . . . . . . . . . 395 331Current deferred income taxes . . . . . . . . . . . . . . . . . . . . . . . . . . . . . . . . . . . . . . . . . . . 319 304Other current assets . . . . . . . . . . . . . . . . . . . . . . . . . . . . . . . . . . . . . . . . . . . . . . . . . . . 191 170
Total current assets . . . . . . . . . . . . . . . . . . . . . . . . . . . . . . . . . . . . . . . . . . . . . . . . . . . . . . 2,411 2,325
Investments:Investments in and advances to affiliated companies . . . . . . . . . . . . . . . . . . . . . . . . . 865 789Other investments . . . . . . . . . . . . . . . . . . . . . . . . . . . . . . . . . . . . . . . . . . . . . . . . . . . . 12 17
Total investments . . . . . . . . . . . . . . . . . . . . . . . . . . . . . . . . . . . . . . . . . . . . . . . . . . . . . . . 877 806
Properties:Road . . . . . . . . . . . . . . . . . . . . . . . . . . . . . . . . . . . . . . . . . . . . . . . . . . . . . . . . . . . . . . . 35,634 33,812Equipment . . . . . . . . . . . . . . . . . . . . . . . . . . . . . . . . . . . . . . . . . . . . . . . . . . . . . . . . . . 7,637 7,675Other . . . . . . . . . . . . . . . . . . . . . . . . . . . . . . . . . . . . . . . . . . . . . . . . . . . . . . . . . . . . . . . 177 210
Total cost . . . . . . . . . . . . . . . . . . . . . . . . . . . . . . . . . . . . . . . . . . . . . . . . . . . . . . . . . 43,448 41,697Accumulated depreciation . . . . . . . . . . . . . . . . . . . . . . . . . . . . . . . . . . . . . . . . . . . . (10,575) (9,722)
Net properties . . . . . . . . . . . . . . . . . . . . . . . . . . . . . . . . . . . . . . . . . . . . . . . . . . . . . . . . . . 32,873 31,975
Other assets . . . . . . . . . . . . . . . . . . . . . . . . . . . . . . . . . . . . . . . . . . . . . . . . . . . . . . . . . . . . 354 514
Total assets . . . . . . . . . . . . . . . . . . . . . . . . . . . . . . . . . . . . . . . . . . . . . . . . . . . . . . . . . . . . $ 36,515 $35,620
Liabilities and Common Shareholders’ EquityCurrent liabilities:
Accounts payable . . . . . . . . . . . . . . . . . . . . . . . . . . . . . . . . . . . . . . . . . . . . . . . . . . . . . $ 684 $ 783Accrued wages and vacation . . . . . . . . . . . . . . . . . . . . . . . . . . . . . . . . . . . . . . . . . . . . . 412 415Accrued casualty costs . . . . . . . . . . . . . . . . . . . . . . . . . . . . . . . . . . . . . . . . . . . . . . . . . 409 478Income and other taxes . . . . . . . . . . . . . . . . . . . . . . . . . . . . . . . . . . . . . . . . . . . . . . . . 279 212Dividends and interest . . . . . . . . . . . . . . . . . . . . . . . . . . . . . . . . . . . . . . . . . . . . . . . . . 238 252Debt due within one year . . . . . . . . . . . . . . . . . . . . . . . . . . . . . . . . . . . . . . . . . . . . . . . 780 656Equipment rents payable . . . . . . . . . . . . . . . . . . . . . . . . . . . . . . . . . . . . . . . . . . . . . . . 108 130Other current liabilities . . . . . . . . . . . . . . . . . . . . . . . . . . . . . . . . . . . . . . . . . . . . . . . . 629 458
Total current liabilities . . . . . . . . . . . . . . . . . . . . . . . . . . . . . . . . . . . . . . . . . . . . . . . . . . . 3,539 3,384
Debt due after one year . . . . . . . . . . . . . . . . . . . . . . . . . . . . . . . . . . . . . . . . . . . . . . . . . . . 6,000 6,760Deferred income taxes . . . . . . . . . . . . . . . . . . . . . . . . . . . . . . . . . . . . . . . . . . . . . . . . . . . 9,696 9,482Accrued casualty costs . . . . . . . . . . . . . . . . . . . . . . . . . . . . . . . . . . . . . . . . . . . . . . . . . . . 868 876Retiree benefits obligation . . . . . . . . . . . . . . . . . . . . . . . . . . . . . . . . . . . . . . . . . . . . . . . . 504 855Other long-term liabilities . . . . . . . . . . . . . . . . . . . . . . . . . . . . . . . . . . . . . . . . . . . . . . . . 596 556Commitments and contingencies (note 10) . . . . . . . . . . . . . . . . . . . . . . . . . . . . . . . . . .
Total liabilities . . . . . . . . . . . . . . . . . . . . . . . . . . . . . . . . . . . . . . . . . . . . . . . . . . . . . . . . . 21,203 21,913
Common shareholders’ equity:Common shares, par value $2.50 per share, 500,000,000 shares authorized;
275,962,411 and 275,798,611 shares issued, respectively . . . . . . . . . . . . . . . . . . . . 690 689Paid-in-surplus . . . . . . . . . . . . . . . . . . . . . . . . . . . . . . . . . . . . . . . . . . . . . . . . . . . . . . . 3,943 3,915Retained earnings . . . . . . . . . . . . . . . . . . . . . . . . . . . . . . . . . . . . . . . . . . . . . . . . . . . . . 11,215 9,932Treasury stock . . . . . . . . . . . . . . . . . . . . . . . . . . . . . . . . . . . . . . . . . . . . . . . . . . . . . . . . (394) (599)Accumulated other comprehensive loss . . . . . . . . . . . . . . . . . . . . . . . . . . . . . . . . . . . . (142) (230)
Total common shareholders’ equity . . . . . . . . . . . . . . . . . . . . . . . . . . . . . . . . . . . . . . . . 15,312 13,707
Total liabilities and common shareholders’ equity . . . . . . . . . . . . . . . . . . . . . . . . . . . . . $ 36,515 $35,620
The accompanying notes are an integral part of these Consolidated Financial Statements.
45

CONSOLIDATED STATEMENTS OF CASH FLOWSUnion Pacific Corporation and Subsidiary Companies
Millions of Dollars, for the Years Ended December 31, 2006 2005 2004
Operating ActivitiesNet income . . . . . . . . . . . . . . . . . . . . . . . . . . . . . . . . . . . . . . . . . . . . . . . . . . . . . . . $ 1,606 $ 1,026 $ 604Adjustments to reconcile net income to cash provided by operating activities:
Depreciation . . . . . . . . . . . . . . . . . . . . . . . . . . . . . . . . . . . . . . . . . . . . . . . . . . . . 1,237 1,175 1,111Deferred income taxes . . . . . . . . . . . . . . . . . . . . . . . . . . . . . . . . . . . . . . . . . . . . 235 320 359Stock-based compensation expense . . . . . . . . . . . . . . . . . . . . . . . . . . . . . . . . . . 35 21 21Net gain from asset sales . . . . . . . . . . . . . . . . . . . . . . . . . . . . . . . . . . . . . . . . . . . (72) (135) (69)Other operating activities, net . . . . . . . . . . . . . . . . . . . . . . . . . . . . . . . . . . . . . . (175) 37 135Changes in current assets and liabilities, net . . . . . . . . . . . . . . . . . . . . . . . . . . . 14 151 96
Cash provided by operating activities . . . . . . . . . . . . . . . . . . . . . . . . . . . . . . . . . . 2,880 2,595 2,257
Investing ActivitiesCapital investments . . . . . . . . . . . . . . . . . . . . . . . . . . . . . . . . . . . . . . . . . . . . . . . . (2,242) (2,169) (1,876)Proceeds from asset sales . . . . . . . . . . . . . . . . . . . . . . . . . . . . . . . . . . . . . . . . . . . . 133 185 145Acquisition of equipment pending financing . . . . . . . . . . . . . . . . . . . . . . . . . . . . (536) (872) (674)Proceeds from completed equipment financings . . . . . . . . . . . . . . . . . . . . . . . . . 536 872 674Other investing activities, net . . . . . . . . . . . . . . . . . . . . . . . . . . . . . . . . . . . . . . . . . 67 (63) (1)
Cash used in investing activities . . . . . . . . . . . . . . . . . . . . . . . . . . . . . . . . . . . . . . . (2,042) (2,047) (1,732)
Financing ActivitiesDividends paid . . . . . . . . . . . . . . . . . . . . . . . . . . . . . . . . . . . . . . . . . . . . . . . . . . . . (322) (314) (310)Debt repaid . . . . . . . . . . . . . . . . . . . . . . . . . . . . . . . . . . . . . . . . . . . . . . . . . . . . . . . (657) (699) (588)Debt issued . . . . . . . . . . . . . . . . . . . . . . . . . . . . . . . . . . . . . . . . . . . . . . . . . . . . . . . - - 745Net proceeds from equity compensation plans . . . . . . . . . . . . . . . . . . . . . . . . . . . 160 262 80Excess tax benefits from equity compensation plans . . . . . . . . . . . . . . . . . . . . . . . 29 - -Other financing activities, net . . . . . . . . . . . . . . . . . . . . . . . . . . . . . . . . . . . . . . . . 6 (1) (2)
Cash used in financing activities . . . . . . . . . . . . . . . . . . . . . . . . . . . . . . . . . . . . . . (784) (752) (75)
Net change in cash and cash equivalents . . . . . . . . . . . . . . . . . . . . . . . . . . . . . . . . 54 (204) 450Cash and cash equivalents at beginning of year . . . . . . . . . . . . . . . . . . . . . . . . . . . 773 977 527
Cash and cash equivalents at end of year . . . . . . . . . . . . . . . . . . . . . . . . . . . . . . . . $ 827 $ 773 $ 977
Changes in Current Assets and Liabilities, Net of AcquisitionsAccounts receivable, net . . . . . . . . . . . . . . . . . . . . . . . . . . . . . . . . . . . . . . . . . . . . . $ 68 $ (201) $ (40)Materials and supplies . . . . . . . . . . . . . . . . . . . . . . . . . . . . . . . . . . . . . . . . . . . . . . (64) (22) (42)Other current assets . . . . . . . . . . . . . . . . . . . . . . . . . . . . . . . . . . . . . . . . . . . . . . . . (21) 12 101Accounts, wages, and vacation payable . . . . . . . . . . . . . . . . . . . . . . . . . . . . . . . . . (102) 224 100Other current liabilities . . . . . . . . . . . . . . . . . . . . . . . . . . . . . . . . . . . . . . . . . . . . . 133 138 (23)
Total . . . . . . . . . . . . . . . . . . . . . . . . . . . . . . . . . . . . . . . . . . . . . . . . . . . . . . . . . . . . $ 14 $ 151 $ 96
Supplemental Cash Flow InformationNon-cash investing activities:
Capital investments accrued but not yet paid . . . . . . . . . . . . . . . . . . . . . . . . $ 106 $ 103 $ 82Non-cash financing activity, cash dividends declared but not yet paid . . . . . . 80 78 76Cash (paid) received during the year for:
Interest . . . . . . . . . . . . . . . . . . . . . . . . . . . . . . . . . . . . . . . . . . . . . . . . . . . . . . (492) (510) (517)Income taxes, net . . . . . . . . . . . . . . . . . . . . . . . . . . . . . . . . . . . . . . . . . . . . . . (549) (29) 187
The accompanying notes are an integral part of these Consolidated Financial Statements.
46

CONSOLIDATED STATEMENTS OF CHANGES IN COMMON SHAREHOLDERS’ EQUITYUnion Pacific Corporation and Subsidiary Companies
Accumulated OtherComp Income/(Loss)
Millions of DollarsThousands of Shares
CommonShares
TreasuryShares
CommonShares
Paid-in-Surplus
RetainedEarnings
TreasuryStock
DefinedBenefit
Plans
ForeignCurr.
Trans.FAS133 Total
Balance at Jan. 1, 2004 . . . . . . . . . . . . 275,693 (17,532) $689 $3,936 $ 8,930 $(1,077) $(109) $(18) $ 3 $12,354
Comprehensive income/(loss):Net income . . . . . . . . . . . . . . . . . . . - - 604 - - - - 604Other comp. income/(loss) [a] . . . . - - - - (103) - (10) (113)
Total comprehensiveincome/(loss) . . . . . . . . . . . . . . . - - 604 - (103) - (10) 491
Conversion, exercises of stockoptions, forfeitures, and other . . . . 2 2,357 - (19) - 141 - - - 122
Dividends declared ($1.20 pershare) . . . . . . . . . . . . . . . . . . . . . . . . - - - - (312) - - - - (312)
Balance at Dec. 31, 2004 . . . . . . . . . . . 275,695 (15,175) $689 $3,917 $ 9,222 $ (936) $(212) $(18) $ (7) $12,655
Comprehensive income/(loss):Net income . . . . . . . . . . . . . . . . . . . - - 1,026 - - - - 1,026Other comp. income/(loss) [a] . . . . - - - - 1 5 1 7
Total comprehensiveincome/(loss) . . . . . . . . . . . . . . . - - 1,026 - 1 5 1 1,033
Conversion, exercises of stockoptions, forfeitures, and other . . . . 104 6,011 - (2) - 337 - - - 335Dividends declared ($1.20 per
share) . . . . . . . . . . . . . . . . . . . . . . - - - - (316) - - - - (316)
Balance at Dec. 31, 2005 . . . . . . . . . . . 275,799 (9,164) $689 $3,915 $ 9,932 $ (599) $(211) $(13) $ (6) $13,707
Comprehensive income/(loss):Net income . . . . . . . . . . . . . . . . . . . - - 1,606 - - - - 1,606Other comp. income/(loss) [a] . . . . - - - - 170 (4) 1 167
Total comprehensiveincome/(loss) . . . . . . . . . . . . . . . - - 1,606 - 170 (4) 1 1,773
FAS 158 adoption (note 7) [b] . . . . . . - - - - (79) - - (79)Conversion, exercises of stock
options, forfeitures, and other . . . . 163 3,374 1 28 - 205 - - - 234Dividends declared ($1.20 per
share) . . . . . . . . . . . . . . . . . . . . . . . . - - - - (323) - - - - (323)
Balance at Dec. 31, 2006 . . . . . . . . . . . 275,962 (5,790) $690 $3,943 $11,215 $ (394) $(120) $(17) $ (5) $15,312
[a] Net of deferred taxes of $102, $5, and $(69) in 2006, 2005, and 2004, respectively.[b] Net of deferred taxes of $(94).
The accompanying notes are an integral part of these Consolidated Financial Statements.
47

NOTES TO THE CONSOLIDATED FINANCIAL STATEMENTSUnion Pacific Corporation and Subsidiary Companies
For purposes of this report, unless the context otherwise requires, all references herein to the “Corporation”,“UPC”, “we”, “us”, and “our” mean Union Pacific Corporation and its subsidiaries, including Union PacificRailroad Company, which will be separately referred to herein as “UPRR” or the “Railroad”.
1. Significant Accounting Policies
Principles of Consolidation – The Consolidated Financial Statements include the accounts of Union PacificCorporation and all of its subsidiaries. Investments in affiliated companies (20% to 50% owned) are accountedfor using the equity method of accounting. All significant intercompany transactions are eliminated. TheCorporation evaluates its less than majority-owned investments for consolidation pursuant to FinancialAccounting Standards Board (FASB) Interpretation No. 46 (Revised 2003), Consolidation of Variable InterestEntities, an Interpretation of Accounting Research Bulletin No. 51 (FIN 46(R)). We currently have no less thanmajority-owned investments that require consolidation under FIN 46(R).
Cash and Cash Equivalents – Cash equivalents consist of investments with original maturities of three months orless.
Materials and Supplies – Materials and supplies are carried at the lower of average cost or market.
Property and Depreciation – Properties are carried at cost. Provisions for depreciation are computed principallyon the straight-line method based on estimated service lives of depreciable property. The cost (net of salvage) ofdepreciable rail property retired or replaced in the ordinary course of business is charged to accumulateddepreciation, and no gain or loss is recognized. A gain or loss is recognized in other income for all other propertyupon disposition because the gain or loss is not part of rail operations. The cost of internally developed software iscapitalized and amortized over a five-year period.
Impairment of Long-lived Assets – We review long-lived assets, including identifiable intangibles, forimpairment when events or changes in circumstances indicate that the carrying amount of an asset may not berecoverable. If impairment indicators are present and the estimated future undiscounted cash flows are less thanthe carrying value of the long-lived assets, the carrying value is reduced to the estimated fair value as measured bythe discounted cash flows.
Revenue Recognition – We recognize commodity revenue on a percentage-of-completion basis as freight movesfrom origin to destination. The allocation of revenue between reporting periods is based on the relative transittime in each reporting period with expenses recognized as incurred. Other revenue is recognized as service isperformed or contractual obligations are met. Customer incentives, which are primarily provided for shipping aspecified cumulative volume or shipping to/from specific locations, are recorded as a reduction to revenue basedon actual or projected future customer shipments.
Translation of Foreign Currency – Our portion of the assets and liabilities related to foreign investments aretranslated into U.S. dollars at the exchange rates in effect at the balance sheet date. Revenue and expenses aretranslated at the average rates of exchange prevailing during the year. Unrealized adjustments are reflected withincommon shareholders’ equity as accumulated other comprehensive income or loss.
Financial Instruments – The carrying value of our non-derivative financial instruments approximates fair value.The fair value of financial instruments is generally determined by reference to market values as quoted byrecognized dealers or developed based upon the present value of expected future cash flows.
We periodically use derivative financial instruments, for other than trading purposes, to manage risk relatedto changes in fuel prices and interest rates.
48
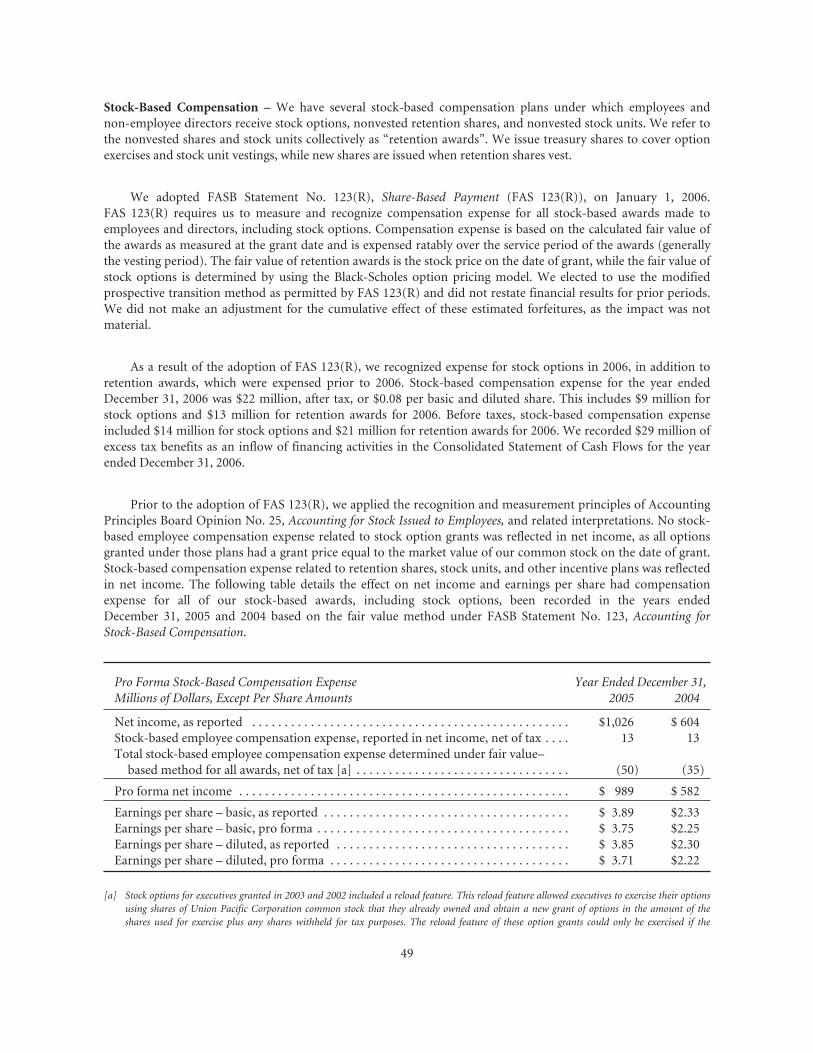
Stock-Based Compensation – We have several stock-based compensation plans under which employees andnon-employee directors receive stock options, nonvested retention shares, and nonvested stock units. We refer tothe nonvested shares and stock units collectively as “retention awards”. We issue treasury shares to cover optionexercises and stock unit vestings, while new shares are issued when retention shares vest.
We adopted FASB Statement No. 123(R), Share-Based Payment (FAS 123(R)), on January 1, 2006.FAS 123(R) requires us to measure and recognize compensation expense for all stock-based awards made toemployees and directors, including stock options. Compensation expense is based on the calculated fair value ofthe awards as measured at the grant date and is expensed ratably over the service period of the awards (generallythe vesting period). The fair value of retention awards is the stock price on the date of grant, while the fair value ofstock options is determined by using the Black-Scholes option pricing model. We elected to use the modifiedprospective transition method as permitted by FAS 123(R) and did not restate financial results for prior periods.We did not make an adjustment for the cumulative effect of these estimated forfeitures, as the impact was notmaterial.
As a result of the adoption of FAS 123(R), we recognized expense for stock options in 2006, in addition toretention awards, which were expensed prior to 2006. Stock-based compensation expense for the year endedDecember 31, 2006 was $22 million, after tax, or $0.08 per basic and diluted share. This includes $9 million forstock options and $13 million for retention awards for 2006. Before taxes, stock-based compensation expenseincluded $14 million for stock options and $21 million for retention awards for 2006. We recorded $29 million ofexcess tax benefits as an inflow of financing activities in the Consolidated Statement of Cash Flows for the yearended December 31, 2006.
Prior to the adoption of FAS 123(R), we applied the recognition and measurement principles of AccountingPrinciples Board Opinion No. 25, Accounting for Stock Issued to Employees, and related interpretations. No stock-based employee compensation expense related to stock option grants was reflected in net income, as all optionsgranted under those plans had a grant price equal to the market value of our common stock on the date of grant.Stock-based compensation expense related to retention shares, stock units, and other incentive plans was reflectedin net income. The following table details the effect on net income and earnings per share had compensationexpense for all of our stock-based awards, including stock options, been recorded in the years endedDecember 31, 2005 and 2004 based on the fair value method under FASB Statement No. 123, Accounting forStock-Based Compensation.
Pro Forma Stock-Based Compensation Expense Year Ended December 31,Millions of Dollars, Except Per Share Amounts 2005 2004
Net income, as reported . . . . . . . . . . . . . . . . . . . . . . . . . . . . . . . . . . . . . . . . . . . . . . . . . $1,026 $ 604Stock-based employee compensation expense, reported in net income, net of tax . . . . 13 13Total stock-based employee compensation expense determined under fair value–
based method for all awards, net of tax [a] . . . . . . . . . . . . . . . . . . . . . . . . . . . . . . . . . (50) (35)
Pro forma net income . . . . . . . . . . . . . . . . . . . . . . . . . . . . . . . . . . . . . . . . . . . . . . . . . . . $ 989 $ 582
Earnings per share – basic, as reported . . . . . . . . . . . . . . . . . . . . . . . . . . . . . . . . . . . . . . $ 3.89 $2.33Earnings per share – basic, pro forma . . . . . . . . . . . . . . . . . . . . . . . . . . . . . . . . . . . . . . . $ 3.75 $2.25Earnings per share – diluted, as reported . . . . . . . . . . . . . . . . . . . . . . . . . . . . . . . . . . . . $ 3.85 $2.30Earnings per share – diluted, pro forma . . . . . . . . . . . . . . . . . . . . . . . . . . . . . . . . . . . . . $ 3.71 $2.22
[a] Stock options for executives granted in 2003 and 2002 included a reload feature. This reload feature allowed executives to exercise their optionsusing shares of Union Pacific Corporation common stock that they already owned and obtain a new grant of options in the amount of theshares used for exercise plus any shares withheld for tax purposes. The reload feature of these option grants could only be exercised if the
49

price of our common stock increased at least 20% from the price at the time of the reload grant. During the year ended December 31, 2005,reload option grants represented $19 million of the pro forma expense noted above. There were no reload options exercised during 2004 and nopro forma expense for reload option grants in 2004. There were no reload option grants during 2006 as stock options exercised after January 1,2006 are not eligible for the reload feature.
Earnings Per Share – Basic earnings per share are calculated on the weighted-average number of common sharesoutstanding during each period. Diluted earnings per share include shares issuable upon exercise of outstandingstock options and stock-based awards where the conversion of such instruments would be dilutive.
Use of Estimates – Our Consolidated Financial Statements include estimates and assumptions regarding certainassets, liabilities, revenue, and expenses and the disclosure of certain contingent assets and liabilities. Actual futureresults may differ from such estimates.
Income Taxes – As required under FASB Statement No. 109, Accounting for Income Taxes, we account for incometaxes by recording taxes payable or refundable for the current year and deferred tax assets and liabilities for thefuture tax consequences of events that have been recognized in our financial statements or tax returns. Theseexpected future tax consequences are measured based on provisions of tax law as currently enacted; the effects offuture changes in tax laws are not anticipated. Future tax law changes, such as a change in the corporate tax rate,could have a material impact on our financial condition or results of operations.
When appropriate, we record a valuation allowance against deferred tax assets to offset future tax benefitsthat may not be realized. In determining whether a valuation allowance is appropriate, we consider whether it ismore likely than not that all or some portion of our deferred tax assets will not be realized, based in part onmanagement’s judgments regarding the best available evidence about future events.
Pension and Postretirement Benefits – We incur certain employment-related expenses associated with pensionsand postretirement health benefits. In order to measure the expense associated with these benefits, we must makevarious assumptions including discount rates used to value certain liabilities, expected return on plan assets usedto fund these expenses, salary increases, employee turnover rates, anticipated mortality rates, and expected futurehealthcare costs. The assumptions used by us are based on our historical experience as well as current facts andcircumstances. We use third-party actuaries to assist us in properly measuring the expense and liability associatedwith these benefits.
Personal Injury – The cost of injuries to employees and others on our property is charged to expense based onestimates of the ultimate cost and number of incidents each year. We use third-party actuaries to assist us inproperly measuring the expense and liability. Our personal injury liability is discounted to present value usingapplicable U.S. Treasury rates. Legal fees and incidental costs are expensed as incurred.
Environmental – When environmental issues have been identified with respect to property currently or formerlyowned, leased, or otherwise used in the conduct of our business, we and our consultants perform environmentalassessments on such property. We expense the cost of the assessments as incurred. We accrue the cost ofremediation where our obligation is probable and such costs can be reasonably estimated. We do not discount ourenvironmental liabilities when the timing of the anticipated cash payments is not fixed or readily determinable.Legal fees and incidental costs are expensed as incurred.
Asbestos – We estimate a liability for asserted and unasserted asbestos-related claims based on an assessment ofthe number and value of those claims. We use an external consulting firm to assist us in properly measuring theexpense and liability. Our liability for asbestos-related claims is not discounted to present value due to theuncertainty surrounding the timing of future payments. Legal fees and incidental costs are expensed as incurred.
50

Job: 91327_002 Union Pacific Page: 51
2. Operations and Segmentation
The Railroad, along with its subsidiaries and rail affiliates, is our one reportable operating segment. Althoughrevenue is analyzed by commodity group, we analyze the net financial results of the Railroad as one segment dueto the integrated nature of our rail network.
UPRR is a Class I railroad that operates in the United States. We have 32,339 route miles, linking PacificCoast and Gulf Coast ports with the Midwest and eastern United States gateways and providing several corridorsto key Mexican gateways. We serve the western two-thirds of the country and maintain coordinated scheduleswith other rail carriers for the handling of freight to and from the Atlantic Coast, the Pacific Coast, the Southeast,the Southwest, Canada, and Mexico. Export and import traffic is moved through Gulf Coast and Pacific Coastports and across the Mexican and Canadian borders.
3. Financial Instruments
Strategy and Risk – We may use derivative financial instruments in limited instances for other than tradingpurposes to assist in managing our overall exposure to fluctuations in interest rates and fuel prices. We are not aparty to leveraged derivatives and, by policy, do not use derivative financial instruments for speculative purposes.Derivative financial instruments qualifying for hedge accounting must maintain a specified level of effectivenessbetween the hedging instrument and the item being hedged, both at inception and throughout the hedged period.We formally document the nature and relationships between the hedging instruments and hedged items, as wellas our risk-management objectives, strategies for undertaking the various hedge transactions, and method ofassessing hedge effectiveness. Changes in the fair market value of derivative financial instruments that do notqualify for hedge accounting are charged to earnings. We may use swaps, collars, futures, and/or forwardcontracts to mitigate the risk of adverse movements in interest rates and fuel prices; however, the use of thesederivative financial instruments may limit future benefits from favorable price movements.
Market and Credit Risk – We address market risk related to derivative financial instruments by selectinginstruments with value fluctuations that highly correlate with the underlying hedged item. Credit risk related toderivative financial instruments, which is minimal, is managed by requiring high credit standards forcounterparties and periodic settlements. At December 31, 2006 and 2005, we were not required to providecollateral, nor had we received collateral, relating to our hedging activities.
Determination of Fair Value – We determined the fair values of our derivative financial instrument positions atDecember 31, 2006 and 2005 based upon current fair values as quoted by recognized dealers or developed basedupon the present value of expected future cash flows.
Interest Rate Fair Value Hedges – We manage our overall exposure to fluctuations in interest rates by adjustingthe proportion of fixed and floating rate debt instruments within our debt portfolio over a given period. Wegenerally manage the mix of fixed and floating rate debt through the issuance of targeted amounts of each as debtmatures or as we require incremental borrowings. We employ derivatives, primarily swaps, as one of the tools toobtain the targeted mix. In addition, we also obtain flexibility in managing interest costs and the interest rate mixwithin our debt portfolio by evaluating the issuance of and managing outstanding callable fixed-rate debtsecurities.
Swaps allow us to convert debt from fixed rates to variable rates and thereby hedge the risk of changes in thedebt’s fair value attributable to the changes in interest rates. We account for swaps as fair value hedges using theshort-cut method pursuant to FASB Statement No. 133, Accounting for Derivative Instruments and HedgingActivities; therefore, we do not record any ineffectiveness within our Consolidated Financial Statements. As ofDecember 31, 2006 and 2005, we had interest rate swaps hedging debt of $500 million and $750 million,respectively.
51

The following is a summary of our interest rate derivatives qualifying as fair value hedges:
Interest Rate Fair Value HedgesMillions of Dollars, Except Percentages 2006 2005
Amount of debt hedged . . . . . . . . . . . . . . . . . . . . . . . . . . . . . . . . . . . . . . . . . . . . . . . . . . . . . . . $500 $750Percentage of total debt portfolio . . . . . . . . . . . . . . . . . . . . . . . . . . . . . . . . . . . . . . . . . . . . . . . 7% 10%Gross fair value liability position . . . . . . . . . . . . . . . . . . . . . . . . . . . . . . . . . . . . . . . . . . . . . . . . $ (16) $(17)
Interest Rate Cash Flow Hedges – We report changes in the fair value of cash flow hedges in accumulated othercomprehensive loss until the hedged item affects earnings. At December 31, 2006, we had a reduction of $5million recorded as an accumulated other comprehensive loss that is being amortized on a straight-line basisthrough September 30, 2014. As of December 31, 2006 and 2005, we had no interest rate cash flow hedgesoutstanding.
Fuel Cash Flow Hedges – Fuel costs are a significant portion of our total operating expenses. In 2006 and 2005,our primary means of mitigating the impact of adverse fuel price changes were our fuel surcharge programs.However, we may use swaps, collars, futures and/or forward contracts to further mitigate the impact of adversefuel price changes. We did not have any fuel hedges in place during 2006 or 2005. We hedged 120 million gallonsof fuel during 2004 using collars with average cap, floor, and ceiling prices of $0.74, $0.64, and $0.86 per gallon,respectively.
Fuel Swaps – We entered into two fuel basis swaps for the period August 2006 through July 2008, which cover atotal of 151 million gallons of diesel fuel. These commodity basis swaps require us to make payments to, or receivepayments from, the counterparty based on the difference between certain price indices. Changes in the fair valueof these swaps are reflected in fuel expense. We reported a derivative asset of approximately $2 million atDecember 31, 2006, which represents the fair value of the swaps. The swaps reduced fuel expense for 2006 by $3million, which included monthly net settlements with the counterparty and the fair value recognition atDecember 31, 2006.
Earnings Impact – Our use of derivative financial instruments had the following impact on pre-tax income forthe years ended December 31:
Millions of Dollars 2006 2005 2004
(Increase)/decrease in interest expense from interest rate hedging . . . . . . . . . . . . . . $(8) $5 $24Decrease in fuel expense from fuel derivatives . . . . . . . . . . . . . . . . . . . . . . . . . . . . . . 3 - 14
Increase/(decrease) in pre-tax income . . . . . . . . . . . . . . . . . . . . . . . . . . . . . . . . . . . . $(5) $5 $38
Fair Value of Debt Instruments – The fair value of our short- and long-term debt was estimated using quotedmarket prices, where available, or current borrowing rates. At December 31, 2006 and 2005, the fair value of totaldebt exceeded the carrying value by approximately $273 million and $460 million, respectively. At December 31,2006 and 2005, approximately $165 million and $169 million, respectively, of fixed-rate debt securities containedcall provisions that allowed us to retire the debt instruments prior to final maturity, with the payment of fixed callpremiums, or in certain cases, at par.
Sale of Receivables – The Railroad transfers most of its accounts receivable to Union Pacific Receivables, Inc.(UPRI), a bankruptcy-remote subsidiary, as part of a sale of receivables facility. UPRI sells, without recourse on a364-day revolving basis, an undivided interest in such accounts receivable to investors. The total capacity to sellundivided interests to investors under the facility was $600 million at both December 31, 2006 and 2005. Thevalue of the outstanding undivided interest held by investors under the facility was $600 million at both
52

Job: 91327_002 Union Pacific Page: 53
December 31, 2006 and 2005, respectively. The value of the outstanding undivided interest held by investors is notincluded in our Consolidated Financial Statements. The value of the undivided interest held by investors wassupported by $1,158 million and $1,226 million of accounts receivable held by UPRI at December 31, 2006 and2005, respectively. At December 31, 2006 and 2005, the value of the interest retained by UPRI was $558 millionand $626 million, respectively. This retained interest is included in accounts receivable in our ConsolidatedFinancial Statements. The interest sold to investors is sold at carrying value, which approximates fair value, andthere is no gain or loss recognized from the transaction.
The value of the outstanding undivided interest held by investors could fluctuate based upon the availabilityof eligible receivables and is directly affected by changing business volumes and credit risks, including default anddilution. If default or dilution percentages were to increase one percentage point, the amount of eligiblereceivables would decrease by $6 million. Should our credit rating fall below investment grade, the value of theoutstanding undivided interest held by investors would be reduced, and, in certain cases, the investors would havethe right to discontinue the facility.
The Railroad services the sold receivables; however, the Railroad does not recognize any servicing asset orliability as the servicing fees adequately compensate the Railroad for its responsibilities. The Railroad collectedapproximately $15.5 billion and $13.4 billion during the years ended December 31, 2006 and 2005, respectively.UPRI used certain of these proceeds to purchase new receivables under the facility.
The costs of the sale of receivables program are included in other income and were $33 million, $23 million,and $11 million for 2006, 2005, and 2004, respectively. The costs include interest, program fees paid to banks,commercial paper issuing costs, and fees for unused commitment availability.
The investors have no recourse to the Railroad’s other assets except for customary warranty and indemnityclaims. Creditors of the Railroad have no recourse to the assets of UPRI. In August 2006, the sale of receivablesprogram was renewed for an additional 364-day period without any significant changes in terms.
4. Income Taxes
Components of income tax expense were as follows for the years ended December 31:
Millions of Dollars 2006 2005 2004
Current income tax expense (benefit):Federal . . . . . . . . . . . . . . . . . . . . . . . . . . . . . . . . . . . . . . . . . . . . . . . . . . . . . . . . . . . $630 $ 57 $ (99)State . . . . . . . . . . . . . . . . . . . . . . . . . . . . . . . . . . . . . . . . . . . . . . . . . . . . . . . . . . . . . 54 33 (8)
Total current income tax expense (benefit) . . . . . . . . . . . . . . . . . . . . . . . . . . . . . . . . 684 90 (107)
Deferred income tax expense (benefit):Federal . . . . . . . . . . . . . . . . . . . . . . . . . . . . . . . . . . . . . . . . . . . . . . . . . . . . . . . . . . . 205 293 407State . . . . . . . . . . . . . . . . . . . . . . . . . . . . . . . . . . . . . . . . . . . . . . . . . . . . . . . . . . . . . 30 27 (48)
Total deferred income tax expense . . . . . . . . . . . . . . . . . . . . . . . . . . . . . . . . . . . . . . . 235 320 359
Total . . . . . . . . . . . . . . . . . . . . . . . . . . . . . . . . . . . . . . . . . . . . . . . . . . . . . . . . . . . . . . . $919 $410 $ 252
53
For the years ended December 31, reconciliation between statutory and effective tax rates is as follows:
Tax Rate Percentages 2006 2005 2004
Federal statutory tax rate . . . . . . . . . . . . . . . . . . . . . . . . . . . . . . . . . . . . . . . . . . . . . . . 35.0% 35.0% 35.0%State statutory rates, net of federal benefits . . . . . . . . . . . . . . . . . . . . . . . . . . . . . . . . . 2.9 2.9 2.9Deferred tax adjustments . . . . . . . . . . . . . . . . . . . . . . . . . . . . . . . . . . . . . . . . . . . . . . . (0.5) (8.2) (2.9)Tax credits . . . . . . . . . . . . . . . . . . . . . . . . . . . . . . . . . . . . . . . . . . . . . . . . . . . . . . . . . . (1.0) (1.2) (5.6)Other . . . . . . . . . . . . . . . . . . . . . . . . . . . . . . . . . . . . . . . . . . . . . . . . . . . . . . . . . . . . . . - 0.1 -
Effective tax rate . . . . . . . . . . . . . . . . . . . . . . . . . . . . . . . . . . . . . . . . . . . . . . . . . . . . . . 36.4% 28.6% 29.4%
Deferred income tax liabilities (assets) were comprised of the following at December 31:
Millions of Dollars 2006 2005
Net current deferred income tax asset . . . . . . . . . . . . . . . . . . . . . . . . . . . . . . . . . . . . . . . . . . . . $ (319) $ (304)
Property . . . . . . . . . . . . . . . . . . . . . . . . . . . . . . . . . . . . . . . . . . . . . . . . . . . . . . . . . . . . . . . . . . . 9,356 9,216State taxes, net . . . . . . . . . . . . . . . . . . . . . . . . . . . . . . . . . . . . . . . . . . . . . . . . . . . . . . . . . . . . . . 617 592Other . . . . . . . . . . . . . . . . . . . . . . . . . . . . . . . . . . . . . . . . . . . . . . . . . . . . . . . . . . . . . . . . . . . . . . (277) (326)
Net long-term deferred income tax liability . . . . . . . . . . . . . . . . . . . . . . . . . . . . . . . . . . . . . . . 9,696 9,482
Net deferred income tax liability . . . . . . . . . . . . . . . . . . . . . . . . . . . . . . . . . . . . . . . . . . . . . . . . $9,377 $9,178
All federal income tax years prior to 1995 are closed. Federal income tax liabilities for tax years 1986 through1994 have been resolved. Interest calculations for these years are in process and may take several years to resolvewith the Internal Revenue Service (IRS). The IRS is examining the Corporation’s federal income tax returns fortax years 2003 and 2004 and should complete their exam in 2007. The IRS has completed its examinations andissued notices of deficiency for tax years 1995 through 2002, and we are in the IRS Appeals process for these years.As previously reported, among their proposed adjustments is the disallowance of tax deductions claimed inconnection with certain donations of property. In the fourth quarter of 2005, the IRS National Office issued aTechnical Advice Memorandum that left unresolved whether the deductions were proper, pending further factualdevelopment. We continue to dispute the donation issue, as well as many of the other proposed adjustments, andwill contest the associated tax deficiencies through the IRS Appeals process, and, if necessary, litigation. We do notexpect that the ultimate resolution of these examinations will have a material adverse effect on our ConsolidatedFinancial Statements.
As reported in the Corporation’s Forms 10-Q for the quarters ended June 30, 2005, and September 30, 2005,the final settlements for pre-1995 tax years, along with the IRS Examination Reports for tax years 1995 through2002, among other things, were considered in a review and re-evaluation of the Corporation’s estimated deferredtax assets and liabilities. This review resulted in a reduction of deferred income tax liabilities and income taxexpense of $118 million in the third quarter of 2005.
54

5. Debt
Total debt as of December 31, 2006 and 2005, including interest rate swaps designated as hedges, is summarizedbelow:
Millions of Dollars 2006 2005
Notes and debentures, 3.0% to 7.4% due through 2054 [a] . . . . . . . . . . . . . . . . . . . . . . . . . . . . $4,803 $5,303Capitalized leases, 4.7% to 9.3% due through 2026 . . . . . . . . . . . . . . . . . . . . . . . . . . . . . . . . . . 1,236 1,318Medium-term notes, 6.8% to 10.0% due through 2020 . . . . . . . . . . . . . . . . . . . . . . . . . . . . . . . 362 372Equipment obligations, 6.6% to 10.2% due through 2019 . . . . . . . . . . . . . . . . . . . . . . . . . . . . . 232 270Mortgage bonds, 4.8% due through 2030 . . . . . . . . . . . . . . . . . . . . . . . . . . . . . . . . . . . . . . . . . . 59 60Tax-exempt financings, 4.4% to 5.7% due through 2026 . . . . . . . . . . . . . . . . . . . . . . . . . . . . . 191 197Unamortized discount . . . . . . . . . . . . . . . . . . . . . . . . . . . . . . . . . . . . . . . . . . . . . . . . . . . . . . . . . (103) (104)
Total debt [a] . . . . . . . . . . . . . . . . . . . . . . . . . . . . . . . . . . . . . . . . . . . . . . . . . . . . . . . . . . . . . . . . 6,780 7,416Less current portion [b] . . . . . . . . . . . . . . . . . . . . . . . . . . . . . . . . . . . . . . . . . . . . . . . . . . . . . . . . (780) (656)
Total long-term debt . . . . . . . . . . . . . . . . . . . . . . . . . . . . . . . . . . . . . . . . . . . . . . . . . . . . . . . . . . $6,000 $6,760
[a] 2006 and 2005 include a collective write-down of $14 million and $16 million, respectively, due to market value adjustments for debt withqualifying hedges that are recorded on the Consolidated Statements of Financial Position.
[b] 2006 includes a write-down of $4 million due to short-term market value adjustments for debt with qualifying hedges that are recorded on theConsolidated Statements of Financial Position.
Debt Maturities – The following table presents aggregate debt maturities as of December 31, 2006, excludingmarket value adjustments.
Millions of Dollars
2007 . . . . . . . . . . . . . . . . . . . . . . . . . . . . . . . . . . . . . . . . . . . . . . . . . . . . . . . . . . . . . . . . . . . . . . . . . . . . . . . $ 7842008 . . . . . . . . . . . . . . . . . . . . . . . . . . . . . . . . . . . . . . . . . . . . . . . . . . . . . . . . . . . . . . . . . . . . . . . . . . . . . . . 6832009 . . . . . . . . . . . . . . . . . . . . . . . . . . . . . . . . . . . . . . . . . . . . . . . . . . . . . . . . . . . . . . . . . . . . . . . . . . . . . . . 5322010 . . . . . . . . . . . . . . . . . . . . . . . . . . . . . . . . . . . . . . . . . . . . . . . . . . . . . . . . . . . . . . . . . . . . . . . . . . . . . . . 4532011 . . . . . . . . . . . . . . . . . . . . . . . . . . . . . . . . . . . . . . . . . . . . . . . . . . . . . . . . . . . . . . . . . . . . . . . . . . . . . . . 542Thereafter . . . . . . . . . . . . . . . . . . . . . . . . . . . . . . . . . . . . . . . . . . . . . . . . . . . . . . . . . . . . . . . . . . . . . . . . . . 3,800
Total debt . . . . . . . . . . . . . . . . . . . . . . . . . . . . . . . . . . . . . . . . . . . . . . . . . . . . . . . . . . . . . . . . . . . . . . . . . . $6,794
Mortgaged Properties – Equipment with a carrying value of approximately $2.8 billion and $3.0 billion atDecember 31, 2006 and 2005, respectively, serves as collateral for capital leases and other types of equipmentobligations in accordance with the secured financing arrangements utilized to acquire such railroad equipment.
As a result of the merger of Missouri Pacific Railroad Company (MPRR) with and into UPRR on January 1,1997, and pursuant to the underlying indentures for the MPRR mortgage bonds, UPRR must maintain the samevalue of assets after the merger in order to comply with the security requirements of the mortgage bonds. As ofthe merger date, the value of the MPRR assets that secured the mortgage bonds was approximately $6.0 billion. Inaccordance with the terms of the indentures, this collateral value must be maintained during the entire term ofthe mortgage bonds irrespective of the outstanding balance of such bonds.
Credit Facilities – On December 31, 2006, we had $2 billion in revolving credit facilities available, including $1billion under a five-year facility expiring in March 2009 and $1 billion under a five-year facility expiring in March2010 (collectively, the “facilities”). The facilities are designated for general corporate purposes and support theissuance of commercial paper. Neither of the facilities were drawn on in 2006. Commitment fees and interest ratespayable under the facilities are similar to fees and rates available to comparably rated investment-grade borrowers.These facilities allow for borrowings at floating rates based on London Interbank Offered Rates, plus a spread,
55

depending upon our senior unsecured debt ratings. The facilities require the maintenance of a minimum networth and a debt to net worth coverage ratio. At December 31, 2006, we were in compliance with these covenants.The facilities do not include any other financial restrictions, credit rating triggers (other than rating-dependentpricing), or any other provision that could require the posting of collateral.
In addition to our revolving credit facilities, we had $150 million in uncommitted lines of credit available,including $75 million that expires in March 2007 and $75 million expiring in May 2007. Neither of these lines ofcredit were used as of December 31, 2006. We must have equivalent credit available under our five-year facilitiesto draw on these $75 million lines.
Dividend Restrictions – We are subject to certain restrictions related to the payment of cash dividends to ourshareholders due to minimum net worth requirements under the credit facilities referred to above. The amount ofretained earnings available for dividends was $7.8 billion and $6.2 billion at December 31, 2006 and 2005,respectively. We do not expect that these restrictions will have a material adverse effect on our consolidatedfinancial condition, results of operations, or liquidity. We declared dividends of $323 million in 2006 and $316million in 2005.
Shelf Registration Statement – Under a current shelf registration statement, we may issue any combination ofdebt securities, preferred stock, common stock, or warrants for debt securities or preferred stock in one or moreofferings. At December 31, 2006, we had $500 million remaining for issuance under the current shelf registrationstatement. We have no immediate plans to issue any securities; however, we routinely consider and evaluateopportunities to replace existing debt or access capital through issuances of debt securities under this shelfregistration, and, therefore, we may issue debt securities at any time.
6. Leases
We lease certain locomotives, freight cars, and other property. Future minimum lease payments for operating andcapital leases with initial or remaining non-cancelable lease terms in excess of one year as of December 31, 2006were as follows:
Millions of DollarsOperating
LeasesCapital
Leases
2007 . . . . . . . . . . . . . . . . . . . . . . . . . . . . . . . . . . . . . . . . . . . . . . . . . . . . . . . . . . . . . . . . . . . . . $ 624 $ 1802008 . . . . . . . . . . . . . . . . . . . . . . . . . . . . . . . . . . . . . . . . . . . . . . . . . . . . . . . . . . . . . . . . . . . . . 546 1732009 . . . . . . . . . . . . . . . . . . . . . . . . . . . . . . . . . . . . . . . . . . . . . . . . . . . . . . . . . . . . . . . . . . . . . 498 1682010 . . . . . . . . . . . . . . . . . . . . . . . . . . . . . . . . . . . . . . . . . . . . . . . . . . . . . . . . . . . . . . . . . . . . . 456 1482011 . . . . . . . . . . . . . . . . . . . . . . . . . . . . . . . . . . . . . . . . . . . . . . . . . . . . . . . . . . . . . . . . . . . . . 419 157Later Years . . . . . . . . . . . . . . . . . . . . . . . . . . . . . . . . . . . . . . . . . . . . . . . . . . . . . . . . . . . . . . . . 2,914 1,090
Total minimum lease payments . . . . . . . . . . . . . . . . . . . . . . . . . . . . . . . . . . . . . . . . . . . . . . . $5,457 $1,916
Amount representing interest . . . . . . . . . . . . . . . . . . . . . . . . . . . . . . . . . . . . . . . . . . . . . . . . . N/A (680)
Present value of minimum lease payments . . . . . . . . . . . . . . . . . . . . . . . . . . . . . . . . . . . . . . N/A $1,236
Rent expense for operating leases with terms exceeding one month was $798 million in 2006, $728 million in2005, and $651 million in 2004. When cash rental payments are not made on a straight-line basis, we recognizevariable rental expense on a straight-line basis over the lease term. Contingent rentals and sub-rentals are notsignificant.
56

7. Retirement Plans
Pension and Other Postretirement Benefits
Pension Plans – We provide defined benefit retirement income to eligible non-union employees through qualifiedand non-qualified (supplemental) pension plans. Qualified and non-qualified pension benefits are based on yearsof service and the highest compensation during the latest years of employment, with specific reductions made forearly retirements.
Other Postretirement Benefits (OPEB) – We provide defined contribution medical and life insurance benefits foreligible retirees. These benefits are funded as medical claims and life insurance premiums are paid.
New Accounting Standard
We adopted FASB Statement No. 158, Employers’ Accounting for Defined Benefit Pension and Other PostretirementPlans (FAS 158), at the end of 2006, which required us to separately recognize the overfunded or underfundedstatus of our pension and OPEB plans as an asset or liability. The funded status is measured as the differencebetween the fair value of plan assets and our projected benefit obligations to current and retired employees.
The adoption of FAS 158 at December 31, 2006 decreased other assets and total assets by $207 million,decreased retiree benefits obligation by $34 million, decreased deferred income tax liabilities by $94 million,decreased total liabilities by $128 million, and resulted in an accumulated other comprehensive loss and reductionin total common shareholders’ equity of $79 million. These changes to our financial statements were non-cashand will have no impact on existing debt covenants, credit ratings, or financial flexibility.
The adoption of FAS 158 had no impact on years prior to 2006, as retrospective application was not allowed.This new standard does not change how pension or OPEB expense is computed, nor does it have any impact oncash funding requirements. The impact of the adoption of FAS 158 noted above does not include our equitymethod investees, which are not required to adopt FAS 158 until 2007 because they do not have publicly tradedsecurities. The impact of this adoption in 2007 by our equity method investees is not expected to be significant.
Funded Status
The funded status represents the difference between the projected benefit obligation (PBO) and the fair value ofthe plan assets. The PBO is the present value of benefits earned to date by plan participants, including the effect ofassumed future salary increases. The PBO of the OPEB plan is equal to the accumulated benefit obligation, as thepresent value of the OPEB liabilities is not affected by salary increases. Plan assets are measured at fair value. Weuse a December 31 measurement date for plan assets and obligations for all our retirement plans.
57

Changes in our PBO and plan assets are as follows for the years ended December 31:
Millions of Dollars
Pension OPEB
2006 2005 2006 2005
Projected Benefit ObligationProjected benefit obligation at beginning of year . . . . . . . . . . . . $2,065 $2,058 $ 476 $ 453Service cost . . . . . . . . . . . . . . . . . . . . . . . . . . . . . . . . . . . . . . . . . . 35 28 4 4Interest cost . . . . . . . . . . . . . . . . . . . . . . . . . . . . . . . . . . . . . . . . . 117 115 21 25Plan amendments . . . . . . . . . . . . . . . . . . . . . . . . . . . . . . . . . . . . . - - (38) (42)Actuarial loss (gain) . . . . . . . . . . . . . . . . . . . . . . . . . . . . . . . . . . . 16 (18) (58) 70Gross benefits paid . . . . . . . . . . . . . . . . . . . . . . . . . . . . . . . . . . . . (120) (118) (31) (34)
Projected benefit obligation at end of year . . . . . . . . . . . . . . . . . $2,113 $2,065 $ 374 $ 476
Plan AssetsFair value of plan assets at beginning of year . . . . . . . . . . . . . . . . $1,707 $1,693 $ - $ -Actual return on plan assets . . . . . . . . . . . . . . . . . . . . . . . . . . . . . 243 123 - -Voluntary funded pension plan contributions . . . . . . . . . . . . . . 150 - - -Non-qualified plan benefit payments . . . . . . . . . . . . . . . . . . . . . 9 9 31 34Gross benefits paid . . . . . . . . . . . . . . . . . . . . . . . . . . . . . . . . . . . . (120) (118) (31) (34)
Fair value of plan assets at end of year . . . . . . . . . . . . . . . . . . . . . $1,989 $1,707 $ - $ -
Funded status at end of year . . . . . . . . . . . . . . . . . . . . . . . . . . . . . . . . $ (124) $ (358) $(374) $(476)
Unrecognized net actuarial losses . . . . . . . . . . . . . . . . . . . . . . . . N/A 362 N/A 194Unrecognized prior service cost (credit) . . . . . . . . . . . . . . . . . . . N/A 31 N/A (156)
Net amounts recognized at end of year . . . . . . . . . . . . . . . . . . . . . . . . $ (124) $ 35 $(374) $(438)
Amounts recognized in the statement of financial position as of December 31, 2006 and 2005 consist of:
Amounts Recognized at December 31, 2006Millions of Dollars
Pension OPEB
2006 2005 2006 2005
Other assets . . . . . . . . . . . . . . . . . . . . . . . . . . . . . . . . . . . . . . . . . . . . . . $ 45 N/A $ - N/AOther current liabilities . . . . . . . . . . . . . . . . . . . . . . . . . . . . . . . . . . . . (12) N/A (27) N/ARetiree benefits obligation . . . . . . . . . . . . . . . . . . . . . . . . . . . . . . . . . . (157) N/A (347) N/A
Net amounts recognized at end of year . . . . . . . . . . . . . . . . . . . . . . . . $(124) N/A $(374) N/A
Amounts Recognized at December 31, 2005
Prepaid benefit cost . . . . . . . . . . . . . . . . . . . . . . . . . . . . . . . . . . . . . . . N/A $ 122 N/A $ -Accrued benefit cost . . . . . . . . . . . . . . . . . . . . . . . . . . . . . . . . . . . . . . . N/A (86) N/A (438)Additional minimum liability . . . . . . . . . . . . . . . . . . . . . . . . . . . . . . . N/A (369) N/A -Intangible assets . . . . . . . . . . . . . . . . . . . . . . . . . . . . . . . . . . . . . . . . . . N/A 31 N/A -Accumulated other comprehensive income . . . . . . . . . . . . . . . . . . . . N/A 337 N/A -
Net amounts recognized at end of year . . . . . . . . . . . . . . . . . . . . . . . . N/A $ 35 N/A $(438)
After-tax amounts recognized in accumulated other comprehensive income (loss) as of December 31, 2006consist of:
Millions of Dollars Pension OPEB Total
Prior service (cost) credit . . . . . . . . . . . . . . . . . . . . . . . . . . . . . . . . . . . . . . . . . . . . . . . $ (15) $ 99 $ 84Net actuarial (loss) . . . . . . . . . . . . . . . . . . . . . . . . . . . . . . . . . . . . . . . . . . . . . . . . . . . . . (154) (50) (204)
Total . . . . . . . . . . . . . . . . . . . . . . . . . . . . . . . . . . . . . . . . . . . . . . . . . . . . . . . . . . . . . . . . $(169) $ 49 $(120)
58

Underfunded Accumulated Benefit Obligation – The accumulated benefit obligation (ABO) is the present value ofbenefits earned to date, assuming no future salary growth. The underfunded accumulated benefit obligationrepresents the difference between the ABO and the fair value of plan assets. At December 31, 2006, the onlypension plan that was underfunded was our non-qualified (supplemental) plan, which is not funded by design.The non-qualified (supplemental) plan is funded with cash from operations as benefits are paid to planparticipants. Each of our qualified plans was fully funded at December 31, 2006. The PBO, ABO, and fair value ofplan assets for pension plans with accumulated benefit obligations in excess of the fair value of the plan assetswere as follows for the years ended December 31:
Underfunded Accumulated Benefit ObligationMillions of Dollars 2006 2005
Projected benefit obligation . . . . . . . . . . . . . . . . . . . . . . . . . . . . . . . . . . . . . . . . . . . . . . . . . . . . $(169) $(2,044)
Accumulated benefit obligation . . . . . . . . . . . . . . . . . . . . . . . . . . . . . . . . . . . . . . . . . . . . . . . . . $(168) $(2,026)Fair value of plan assets . . . . . . . . . . . . . . . . . . . . . . . . . . . . . . . . . . . . . . . . . . . . . . . . . . . . . . . - 1,685
Underfunded accumulated benefit obligation . . . . . . . . . . . . . . . . . . . . . . . . . . . . . . . . . . . . . . $(168) $ (341)
The ABO for all defined benefit pension plans was $2.1 billion at December 31, 2006 and $2.0 billion atDecember 31, 2005.
Assumptions – The weighted-average actuarial assumptions used to determine benefit obligations at December 31:
Pension OPEB
Percentages 2006 2005 2004 2006 2005 2004
Discount rate . . . . . . . . . . . . . . . . . . . . . . . . . . . . 6.00% 5.75% 6.00% 6.00% 5.75% 6.00%Salary increase . . . . . . . . . . . . . . . . . . . . . . . . . . . 3.00 2.75 3.00 N/A N/A N/A
The following table presents assumed health care cost trend rates used to determine benefit obligations andOPEB expense:
Percentages 2006 2005 2004
Assumed health care cost trend rate for next year . . . . . . . . . . . . . . . . . . . . . . . . . . . 8.0% 9.0% 10.0%Rate to which health care cost trend rate is expected to decline and remain . . . . . . . 5.0% 5.0% 5.0%Year that the rate reaches the ultimate trend rate . . . . . . . . . . . . . . . . . . . . . . . . . . . . 2010 2010 2010
Expense
Both pension and OPEB expense are determined based upon the annual service cost of benefits (the actuarial costof benefits earned during a period) and the interest cost on those liabilities, less the expected return on plan assets.The expected long-term rate of return on plan assets is applied to a calculated value of plan assets that recognizeschanges in fair value over a five-year period. This practice is intended to reduce year-to-year volatility in pensionexpense, but it can have the effect of delaying the recognition of differences between actual returns on assets andexpected returns based on long-term rate of return assumptions. Differences in actual experience in relation toassumptions are not recognized in net income immediately, but are deferred and, if necessary, amortized aspension or OPEB expense.
59

The components of our net periodic pension and OPEB costs were as follows for the years endedDecember 31:
Pension OPEB
Millions of Dollars 2006 2005 2004 2006 2005 2004
Net Periodic Benefit Cost:Service cost . . . . . . . . . . . . . . . . . . . . . . . . . . $ 35 $ 28 $ 30 $ 4 $ 4 $ 5Interest cost . . . . . . . . . . . . . . . . . . . . . . . . . 117 115 120 21 25 31Expected return on plan assets . . . . . . . . . . (134) (134) (137) - - -Amortization of:
Transition obligation . . . . . . . . . . . . . . - - (2) - - -Prior service cost (credit) . . . . . . . . . . 7 7 8 (33) (30) (24)Actuarial loss . . . . . . . . . . . . . . . . . . . . 21 5 3 13 14 18
Net periodic benefit cost . . . . . . . . . . . . . . . . . . . $ 46 $ 21 $ 22 $ 5 $ 13 $ 30
The estimated actuarial loss and prior service cost for the pension plans that will be amortized, on a pre-taxbasis, from accumulated other comprehensive loss into net periodic benefit cost during 2007 will be $17 millionand $6 million, respectively. The estimated actuarial loss and prior service credit for the OPEB plans that will beamortized, on a pre-tax basis, from accumulated other comprehensive loss into net periodic benefit cost during2007 will be $10 million and $32 million, respectively.
Assumptions – The weighted-average actuarial assumptions used to determine expense were as follows for theyears ended December 31:
Pension OPEB
Percentages 2006 2005 2004 2006 2005 2004
Discount rate . . . . . . . . . . . . . . . . . . . . . . . . . . . . 5.75% 6.00% 6.50% 5.75% 6.00% 6.50%Expected return on plan assets . . . . . . . . . . . . . . 8.00 8.00 8.00 N/A N/A N/ASalary increase . . . . . . . . . . . . . . . . . . . . . . . . . . . 2.75 3.00 3.50 N/A N/A N/A
The discount rate is based on a hypothetical portfolio of high quality corporate bonds with cash flowsmatching our plans’ expected benefit payments. The expected return on plan assets is based on our assetallocation mix and our historical return, taking into account current and expected market conditions. The actualreturn on pension plan assets, net of fees, was approximately 14% in 2006, 7% in 2005, and 12% in 2004. Ourhistorical annualized ten-year rate of return on plan assets is approximately 9%.
Assumed healthcare cost trend rates have a significant effect on the expense and liabilities reported forhealthcare plans. The assumed healthcare cost trend rate is based on historical rates and expected marketconditions. A one-percentage point change in the assumed healthcare cost trend rates would have the followingeffects on OPEB:
Millions of DollarsOne % pt.
IncreaseOne % pt.
Decrease
Effect on total service and interest cost components . . . . . . . . . . . . . . . . . . . . . . . . . . . $ 3 $ (2)Effect on accumulated benefit obligation . . . . . . . . . . . . . . . . . . . . . . . . . . . . . . . . . . . . 31 (26)
60

Cash Contributions
The following table details our cash contributions for the years ended December 31, 2006 and 2005, and theexpected contributions for 2007:
Pension
Millions of Dollars Qualified Non-qualified OPEB
2005 . . . . . . . . . . . . . . . . . . . . . . . . . . . . . . . . . . . . . . . . . . . . . . . . . . . . . . . . . . $ - $ 9 $342006 . . . . . . . . . . . . . . . . . . . . . . . . . . . . . . . . . . . . . . . . . . . . . . . . . . . . . . . . . . 150 9 312007 . . . . . . . . . . . . . . . . . . . . . . . . . . . . . . . . . . . . . . . . . . . . . . . . . . . . . . . . . . - 12 27
In 2006, the Pension Protection Act of 2006 (the Act) was signed into law. The Act changes the method ofvaluing assets and liabilities for funding purposes, as well as the timing of required contributions. Our pensionplans continue to meet all funding requirements and we do not expect the Act to significantly impact our resultsof operations, financial condition, or liquidity.
Our policy with respect to funding the qualified plans is to fund at least the minimum required by the Actand not more than the maximum amount deductible for tax purposes. All contributions made to the qualifiedpension plans in 2006 were voluntary and were made with cash generated from operations. In 2006, wevoluntarily contributed $50 million in January and $100 million in December to the qualified pension plan. AtDecember 31, 2006, our qualified pension plans were fully funded. No required contributions are expected in2007.
The OPEB plans are not funded and are not subject to any minimum regulatory funding requirements.Benefit payments for each year represent claims paid for medical and life insurance, and we anticipate our 2007OPEB payments will be made from cash generated from operations.
Benefit Payments
The following table details expected benefit payments for the years 2007 though 2016:
Millions of Dollars Pension OPEB
2007 . . . . . . . . . . . . . . . . . . . . . . . . . . . . . . . . . . . . . . . . . . . . . . . . . . . . . . . . . . . . . . . . . . . . . . . $124 $ 272008 . . . . . . . . . . . . . . . . . . . . . . . . . . . . . . . . . . . . . . . . . . . . . . . . . . . . . . . . . . . . . . . . . . . . . . . 126 282009 . . . . . . . . . . . . . . . . . . . . . . . . . . . . . . . . . . . . . . . . . . . . . . . . . . . . . . . . . . . . . . . . . . . . . . . 129 292010 . . . . . . . . . . . . . . . . . . . . . . . . . . . . . . . . . . . . . . . . . . . . . . . . . . . . . . . . . . . . . . . . . . . . . . . 133 302011 . . . . . . . . . . . . . . . . . . . . . . . . . . . . . . . . . . . . . . . . . . . . . . . . . . . . . . . . . . . . . . . . . . . . . . . 139 31Years 2012 – 2016 . . . . . . . . . . . . . . . . . . . . . . . . . . . . . . . . . . . . . . . . . . . . . . . . . . . . . . . . . . . . 776 152
Asset Allocation Strategy
Our pension plan asset allocation at December 31, 2006 and 2005, and target allocation for 2007, are as follows:
TargetAllocation
2007
Percentage ofPlan Assets
December 31,
2006 2005
Equity securities . . . . . . . . . . . . . . . . . . . . . . . . . . . . . . . . . . . . . . . . . . . . . . . . . 60% to 70% 70% 75%Debt securities . . . . . . . . . . . . . . . . . . . . . . . . . . . . . . . . . . . . . . . . . . . . . . . . . . 20% to 30% 26 24Real estate . . . . . . . . . . . . . . . . . . . . . . . . . . . . . . . . . . . . . . . . . . . . . . . . . . . . . . 4% to 6% 2 1Commodities . . . . . . . . . . . . . . . . . . . . . . . . . . . . . . . . . . . . . . . . . . . . . . . . . . . 4% to 6% 2 -
Total . . . . . . . . . . . . . . . . . . . . . . . . . . . . . . . . . . . . . . . . . . . . . . . . . . . . . . . . . . 100% 100%
61

The investment strategy for pension plan assets is to maintain a broadly diversified portfolio designed toachieve our target of an average long-term rate of return of 8%. While we believe we can achieve a long-termaverage rate of return of 8%, we cannot be certain that the portfolio will perform to our expectations. Assets arestrategically allocated among equity, debt, and other instruments in order to achieve a diversification level thatmitigates wide swings in investment returns. Asset allocation target ranges for equity, debt, and other portfoliosare evaluated at least every three years with the assistance of an independent external consulting firm. Actual assetallocations are monitored monthly, and rebalancing actions are executed at least quarterly, if needed.
The majority of the plan’s assets are invested in equity securities, because equity portfolios have historicallyprovided higher returns than debt and other asset classes over extended time horizons, and are expected to do soin the future. Correspondingly, equity investments also entail greater risks than other investments. The risk of lossin the plan’s equity portfolio is mitigated by investing in a broad range of equity types. Equity diversificationincludes large-capitalization and small-capitalization companies, growth-oriented and value-orientedinvestments, and U.S. and non-U.S. securities.
Equity risks are further balanced by investing a significant portion of the plan’s assets in high quality debtsecurities. The average quality rating of the debt portfolio exceeded AA as of December 31, 2006 and 2005. Thedebt portfolio is also broadly diversified and invested primarily in U.S. Treasury, mortgage, and corporatesecurities with an intermediate average maturity. The weighted-average maturity of the debt portfolio was 6.4years and 6.5 years at December 31, 2006 and 2005, respectively.
The investment of pension plan assets in our securities is specifically prohibited for both the equity and debtportfolios, other than through index fund holdings.
Other Retirement Programs
Thrift Plan – We provide a defined contribution plan (thrift plan) to eligible non-union employees and makematching contributions to the thrift plan. We match 50 cents for each dollar contributed by employees up to thefirst six percent of compensation contributed. Our thrift plan contributions were $13 million in 2006, and $12million in both 2005 and 2004.
Railroad Retirement System – All Railroad employees are covered by the Railroad Retirement System (the System).Contributions made to the System are expensed as incurred and amounted to approximately $615 million in2006, $595 million in 2005, and $569 million in 2004.
Collective Bargaining Agreements – Under collective bargaining agreements, we provide certain postretirementhealthcare and life insurance benefits for eligible union employees. Premiums under the plans are expensed asincurred and amounted to $40 million in 2006, $41 million in 2005, and $30 million in 2004.
8. Stock Options and Other Stock Plans
We have 1,254,304 options outstanding under the 1993 Stock Option and Retention Stock Plan of Union PacificCorporation (1993 Plan). There are 3,570 restricted shares outstanding under the 1992 Restricted Stock Plan forNon-Employee Directors of Union Pacific Corporation. We no longer grant options or awards of retention sharesand units under these plans.
The UP Shares Stock Option Plan of Union Pacific Corporation (UP Shares Plan) was approved by ourBoard of Directors on April 30, 1998. The UP Shares Plan reserved 12,000,000 shares of our common stock forissuance. The UP Shares Plan was a broad-based option program that granted options to purchase 200 shares ofour common stock at $55.00 per share to eligible active employees on April 30, 1998. All options granted were
62

Job: 91327_002 Union Pacific Page: 63
non-qualified options that became exercisable on May 1, 2001, and remain exercisable until April 30, 2008. If anoptionee’s employment terminates for any reason, the option remains exercisable for a period of one year afterthe date of termination, but no option is exercisable after April 30, 2008. No further options may be grantedunder the UP Shares Plan. As of December 31, 2006, there were 1,119,910 options outstanding under the UPShares Plan.
In April 2000, the shareholders approved the Union Pacific Corporation 2000 Directors Plan (DirectorsPlan) whereby 550,000 shares of our common stock were reserved for issuance to our non-employee directors.Under the Directors Plan, each non-employee director, upon his or her initial election to the Board of Directors,receives a grant of 1,000 shares of retention shares or retention stock units. Additionally, each non-employeedirector receives annually an option to purchase at fair value a number of shares of our common stock, not toexceed 5,000 shares during any calendar year, determined by dividing 60,000 by 1/3 of the fair market value of oneshare of our common stock on the date of such Board of Directors meeting, with the resulting quotient roundedup or down to the nearest 50 shares. As of December 31, 2006, 7,000 restricted shares were outstanding under theDirectors Plan and 159,450 options were outstanding under the Directors Plan.
The Union Pacific Corporation 2001 Stock Incentive Plan (2001 Plan) was approved by the shareholders inApril 2001. The 2001 Plan reserved 12,000,000 shares of our common stock for issuance to eligible employees ofthe Corporation and its subsidiaries in the form of non-qualified options, incentive stock options, retentionshares, stock units, and incentive bonus awards. Non-employee directors were not eligible for awards under the2001 Plan. As of December 31, 2006, 4,224,402 options and 339,537 retention shares and stock units wereoutstanding under the 2001 Plan. We no longer grant any stock options or other stock or unit awards under thisplan.
The Union Pacific Corporation 2004 Stock Incentive Plan (2004 Plan) was approved by shareholders in April2004. The 2004 Plan reserved 21,000,000 shares of our common stock for issuance, plus any shares subject toawards made under the 2001 Plan and the 1993 Plan that were outstanding on April 16, 2004, and becameavailable for regrant pursuant to the terms of the 2004 Plan. Under the 2004 Plan, non-qualified options, stockappreciation rights, retention shares, stock units, and incentive bonus awards may be granted to eligibleemployees of the Corporation and its subsidiaries. Non-employee directors are not eligible for awards under the2004 Plan. As of December 31, 2006, 3,286,461 options and 561,875 retention shares and stock units wereoutstanding under the 2004 Plan.
Pursuant to the above plans, 19,544,245; 20,695,817; and 21,571,309 shares of our common stock wereauthorized and available for grant at December 31, 2006, 2005, and 2004, respectively.
Stock Options – We estimate the fair value of our stock option awards using the Black-Scholes option pricingmodel. Groups of employees and non-employee directors that have similar historical and expected exercisebehavior are considered separately for valuation purposes. The table below shows the year-to-date weighted-average of the assumptions used when valuing these separate groups:
Weighted-Average Assumptions 2006 2005 2004
Risk-free interest rate . . . . . . . . . . . . . . . . . . . . . . . . . . . . . . . . . . . . . . . . . . . . . . . . . . 4.5% 3.8% 3.3%Dividend yield . . . . . . . . . . . . . . . . . . . . . . . . . . . . . . . . . . . . . . . . . . . . . . . . . . . . . . . 1.4% 1.9% 1.7%Expected life (years) . . . . . . . . . . . . . . . . . . . . . . . . . . . . . . . . . . . . . . . . . . . . . . . . . . . 6.0 4.8 5.6Volatility . . . . . . . . . . . . . . . . . . . . . . . . . . . . . . . . . . . . . . . . . . . . . . . . . . . . . . . . . . . . 25.3% 20.6% 25.9%
Weighted-average grant-date fair value of options granted . . . . . . . . . . . . . . . . . . . . $24.97 $12.92 $16.38
The risk-free rate is based on the U.S. Treasury yield curve in effect at the time of grant; the dividend yield iscalculated as the ratio of dividends paid per share of common stock to the stock price on the date of grant; the
63

expected life is based on historical and expected exercise behavior; and volatility is based on the historicalvolatility of our stock price, over a time period that is consistent with the expected life of the option.
A summary of stock option activity during 2006 is presented below:
Shares
Weighted-Average
Exercise Price
Weighted-Average
RemainingContractual Term
AggregateIntrinsic Value
(millions)
Outstanding at January 1, 2006 . . . . . . . . . . . 12,436,209 $59.41 N/A N/AGranted . . . . . . . . . . . . . . . . . . . . . . . . . . . . . . 1,402,200 86.04 N/A N/AExercised . . . . . . . . . . . . . . . . . . . . . . . . . . . . . (3,740,732) 56.39 N/A N/AForfeited or expired . . . . . . . . . . . . . . . . . . . . (53,150) 65.64 N/A N/A
Outstanding at December 31, 2006 . . . . . . . . 10,044,527 $64.22 6.0 yrs. $279
Vested or expected to vestat December 31, 2006 . . . . . . . . . . . . . . . . . 10,001,242 $64.13 6.0 yrs. $279
Options exercisable at December 31, 2006 . . 8,601,677 $60.75 5.5 yrs. $269
Stock options are granted at market price on the date of grant, have ten-year contractual terms, and vest nolater than three years from the date of grant. None of the stock options outstanding at December 31, 2006 aresubject to performance or market-based vesting conditions.
At December 31, 2006, there was $22 million of unrecognized compensation expense related to nonvestedstock options, which is expected to be recognized over a weighted-average period of 1.8 years. Additionalinformation regarding stock option exercises appears in the table below:
Millions of Dollars 2006 2005 2004
Aggregate grant-date fair value of stock options vested [a] . . . . . . . . . . . . . . . . . . . . . $ 26 $ 62 $ 36Intrinsic value of stock options exercised . . . . . . . . . . . . . . . . . . . . . . . . . . . . . . . . . . . 124 142 51Cash received from option exercises . . . . . . . . . . . . . . . . . . . . . . . . . . . . . . . . . . . . . . . 177 296 102Tax benefit realized from option exercises . . . . . . . . . . . . . . . . . . . . . . . . . . . . . . . . . . 44 55 17
[a] Stock options for executives granted in 2003 and 2002 included a reload feature. This reload feature allowed executives to exercise their optionsusing shares of Union Pacific Corporation common stock that they already owned and obtain a new grant of options with immediate vesting inthe amount of the shares used for exercise plus any shares withheld for tax purposes. The reload feature of these option grants could only beexercised if the price of our common stock increased at least 20% from the price at the time of the reload grant. During the year endedDecember 31, 2005, reload option grants represented $31 million of the aggregate grant-date fair value of stock options vested. There were noreload options exercised during 2004. There were no reload option grants during 2006 as stock options exercised after January 1, 2006 are noteligible for the reload feature.
Retention Awards – The fair value of retention awards is based on the market price of the stock at the grant date.
Changes in our retention awards during 2006 were as follows:
SharesWeighted-Average
Grant-Date Fair Value
Nonvested at January 1, 2006 . . . . . . . . . . . . . . . . . . . . . . . . . . . . . . . . . . . . . 1,005,276 $58.88Granted . . . . . . . . . . . . . . . . . . . . . . . . . . . . . . . . . . . . . . . . . . . . . . . . . . . . . . 328,150 86.04Vested . . . . . . . . . . . . . . . . . . . . . . . . . . . . . . . . . . . . . . . . . . . . . . . . . . . . . . . (539,453) 56.53Forfeited . . . . . . . . . . . . . . . . . . . . . . . . . . . . . . . . . . . . . . . . . . . . . . . . . . . . . (16,199) 71.21
Nonvested at December 31, 2006 . . . . . . . . . . . . . . . . . . . . . . . . . . . . . . . . . . 777,774 $71.72
64
Retention awards, which we grant at no cost to the employee or non-employee director, vest over periodslasting up to four years. At December 31, 2006, there was $26 million of total unrecognized compensation expenserelated to nonvested retention awards, which is expected to be recognized over a weighted-average period of 1.6years.
Performance Retention Awards – In January 2006, our Board of Directors approved a new long-term plan(LTP). Under the LTP, selected employees were awarded stock units subject to continued employment throughJanuary 2009 and the attainment of certain levels of return on invested capital (ROIC) as defined in the LTP. Wewill expense the fair value (grant-date stock price) of the units that are probable of being earned based on ourforecasted ROIC over the 3-year performance period.
Changes in our performance retention awards during 2006 were as follows:
SharesWeighted-Average
Grant-Date Fair Value
Nonvested at January 1, 2006 . . . . . . . . . . . . . . . . . . . . . . . . . . . . . . . . . . . . . . . - $ -Granted . . . . . . . . . . . . . . . . . . . . . . . . . . . . . . . . . . . . . . . . . . . . . . . . . . . . . . . . 122,400 86.05Vested . . . . . . . . . . . . . . . . . . . . . . . . . . . . . . . . . . . . . . . . . . . . . . . . . . . . . . . . . - -Forfeited . . . . . . . . . . . . . . . . . . . . . . . . . . . . . . . . . . . . . . . . . . . . . . . . . . . . . . . - -
Nonvested at December 31, 2006 . . . . . . . . . . . . . . . . . . . . . . . . . . . . . . . . . . . . 122,400 $86.05
At December 31, 2006, there was $7 million of total unrecognized compensation expense related tononvested performance retention awards, which is expected to be recognized over a weighted-average period of 2years. A portion of this expense is subject to achievement of the performance criteria under the LTP.
9. Earnings Per Share
The following table provides a reconciliation between basic and diluted earnings per share for the years endedDecember 31:
Millions of Dollars, Except Per Share Amounts 2006 2005 2004
Net income . . . . . . . . . . . . . . . . . . . . . . . . . . . . . . . . . . . . . . . . . . . . . . . . . . . . . . . . . . $1,606 $1,026 $ 604
Weighted-average number of shares outstanding:Basic . . . . . . . . . . . . . . . . . . . . . . . . . . . . . . . . . . . . . . . . . . . . . . . . . . . . . . . . . . . . 269.4 263.4 259.1Dilutive effect of stock options . . . . . . . . . . . . . . . . . . . . . . . . . . . . . . . . . . . . . . . 2.1 1.5 1.2Dilutive effect of retention shares and units . . . . . . . . . . . . . . . . . . . . . . . . . . . . 0.5 1.6 1.9
Diluted . . . . . . . . . . . . . . . . . . . . . . . . . . . . . . . . . . . . . . . . . . . . . . . . . . . . . . . . . . . . . . 272.0 266.5 262.2
Earnings per share – basic . . . . . . . . . . . . . . . . . . . . . . . . . . . . . . . . . . . . . . . . . . . . . . . $ 5.96 $ 3.89 $ 2.33Earnings per share – diluted . . . . . . . . . . . . . . . . . . . . . . . . . . . . . . . . . . . . . . . . . . . . . $ 5.91 $ 3.85 $ 2.30
Common stock options totaling 1.4 million, 1.4 million, and 3.3 million for 2006, 2005, and 2004,respectively, were excluded from the computation of diluted earnings per share because the exercise prices ofthese options exceeded the average market price of our common stock for the respective periods, and the effect oftheir inclusion would be anti-dilutive.
10. Commitments and Contingencies
Asserted and Unasserted Claims – Various claims and lawsuits are pending against us and certain of oursubsidiaries. It is not possible at this time for us to determine fully the effect of all unasserted claims on our
65

consolidated results of operations, financial condition, or liquidity; however, to the extent possible, whereunasserted claims are considered probable and where such claims can be reasonably estimated, we have recordeda liability. We do not expect that any known lawsuits, claims, environmental costs, commitments, contingentliabilities, or guarantees will have a material adverse effect on our consolidated results of operations, financialcondition, or liquidity after taking into account liabilities previously recorded for these matters.
Personal Injury – The cost of personal injuries to employees and others related to our activities is charged toexpense based on estimates of the ultimate cost and number of incidents each year. We use third-party actuariesto assist us in measuring the expense and liability, including unasserted claims. Compensation for work-relatedaccidents is governed by the Federal Employers’ Liability Act (FELA). Under FELA, damages are assessed based ona finding of fault through litigation or out-of-court settlements.
Our personal injury liability activity was as follows:
Millions of Dollars 2006 2005 2004
Beginning balance . . . . . . . . . . . . . . . . . . . . . . . . . . . . . . . . . . . . . . . . . . . . . . . . . . . . . $ 619 $ 639 $ 619Accruals . . . . . . . . . . . . . . . . . . . . . . . . . . . . . . . . . . . . . . . . . . . . . . . . . . . . . . . . . . . . . 240 247 288Payments . . . . . . . . . . . . . . . . . . . . . . . . . . . . . . . . . . . . . . . . . . . . . . . . . . . . . . . . . . . . (228) (267) (268)
Ending balance at December 31 . . . . . . . . . . . . . . . . . . . . . . . . . . . . . . . . . . . . . . . . . . $ 631 $ 619 $ 639
Current portion, ending balance at December 31 . . . . . . . . . . . . . . . . . . . . . . . . . . . . $ 233 $ 274 $ 274
Our personal injury liability is discounted to present value using applicable U.S. Treasury rates.Approximately 87% of the recorded liability related to asserted claims, and approximately 13% related tounasserted claims. Personal injury accruals were higher in 2004 due to a 1998 crossing accident verdict upheld in2004 and a 2004 derailment near San Antonio.
Asbestos – We are a defendant in a number of lawsuits in which current and former employees allege exposure toasbestos. Additionally, we have received claims for asbestos exposure that have not been litigated. The claims andlawsuits (collectively referred to as “claims”) allege occupational illness resulting from exposure to asbestos-containing products. In most cases, the claimants do not have credible medical evidence of physical impairmentresulting from the alleged exposures. Additionally, most claims filed against us do not specify an amount ofalleged damages.
During 2004, we engaged a third party with extensive experience in estimating resolution costs for asbestos-related claims to assist us in assessing the number and value of these unasserted claims through 2034, based onour average claims experience over a multi-year period. As a result, we increased our liability in 2004 for asbestos-related claims in the fourth quarter of 2004. The liability for resolving both asserted and unasserted claims wasbased on the following assumptions:
• The number of future claims received would be consistent with historical averages.
• The number of claims filed against us will decline each year.
• The average settlement values for asserted and unasserted claims will be equivalent to historicalaverages.
• The percentage of claims dismissed in the future will be equivalent to historical averages.
66

Our asbestos-related liability activity was as follows:
Millions of Dollars 2006 2005 2004
Beginning balance . . . . . . . . . . . . . . . . . . . . . . . . . . . . . . . . . . . . . . . . . . . . . . . . . . . . . $311 $324 $ 51Accruals . . . . . . . . . . . . . . . . . . . . . . . . . . . . . . . . . . . . . . . . . . . . . . . . . . . . . . . . . . . . . - - 287Payments . . . . . . . . . . . . . . . . . . . . . . . . . . . . . . . . . . . . . . . . . . . . . . . . . . . . . . . . . . . . (9) (13) (14)
Ending balance at December 31 . . . . . . . . . . . . . . . . . . . . . . . . . . . . . . . . . . . . . . . . . . $302 $311 $324
Current portion, ending balance at December 31 . . . . . . . . . . . . . . . . . . . . . . . . . . . . $ 13 $ 16 $ 17
Our liability for asbestos-related claims is not discounted to present value due to the uncertaintysurrounding the timing of future payments. Approximately 16% of the recorded liability related to assertedclaims, and approximately 84% related to unasserted claims. These claims are expected to be paid out over thenext 28 years. During 2006 and 2005, our third-party consultants assisted us in reviewing our actual asbestosclaim experience compared to the assumptions used in the 2004 estimate, and we determined that no adjustmentto our estimate was necessary. We will continue to review actual experience and adjust our estimate as warranted.
We have insurance coverage for a portion of the costs incurred to resolve asbestos-related claims, and, as aresult of the 2004 assessment, we increased our receivable for insurance recoveries related to asbestos during 2004.We have recognized an asset for estimated insurance recoveries at December 31, 2006 and 2005.
We believe that our liability estimates for asbestos-related claims and the estimated insurance recoveriesreflect reasonable and probable estimates. The amounts recorded for asbestos-related liabilities and relatedinsurance recoveries were based on currently known facts. However, future events, such as the number of newclaims to be filed each year, average settlement costs, and insurance coverage issues, could cause the actual costsand insurance recoveries to be higher or lower than the projected amounts. Estimates may also vary due tochanges in the litigation environment, federal and state law governing compensation of asbestos claimants, andthe level of payments made to claimants by other defendants.
Environmental Costs – We are subject to federal, state, and local environmental laws and regulations. We haveidentified approximately 367 sites at which we are or may be liable for remediation costs associated with allegedcontamination or for violations of environmental requirements. This includes 44 sites that are the subject ofactions taken by the U.S. government, 25 of which are currently on the Superfund National Priorities List. Certainfederal legislation imposes joint and several liability for the remediation of identified sites; consequently, ourultimate environmental liability may include costs relating to activities of other parties, in addition to costsrelating to our own activities at each site.
When an environmental issue has been identified with respect to the property owned, leased, or otherwiseused in the conduct of our business, we and our consultants perform environmental assessments on the property.We expense the cost of the assessments as incurred. We accrue the cost of remediation where our obligation isprobable and such costs can be reasonably estimated. We do not discount our environmental liabilities when thetiming of the anticipated cash payments is not fixed or readily determinable.
Our environmental liability activity was as follows:
Millions of Dollars 2006 2005 2004
Beginning balance . . . . . . . . . . . . . . . . . . . . . . . . . . . . . . . . . . . . . . . . . . . . . . . . . . . . . $213 $201 $187Accruals . . . . . . . . . . . . . . . . . . . . . . . . . . . . . . . . . . . . . . . . . . . . . . . . . . . . . . . . . . . . . 39 45 46Payments . . . . . . . . . . . . . . . . . . . . . . . . . . . . . . . . . . . . . . . . . . . . . . . . . . . . . . . . . . . . (42) (33) (32)
Ending balance at December 31 . . . . . . . . . . . . . . . . . . . . . . . . . . . . . . . . . . . . . . . . . . $210 $213 $201
Current portion, ending balance at December 31 . . . . . . . . . . . . . . . . . . . . . . . . . . . . $ 54 $ 46 $ 50
67

The environmental liability includes costs for remediation and restoration of sites, as well as for ongoingmonitoring costs, but excludes any anticipated recoveries from third parties. Cost estimates are based oninformation available for each site, financial viability of other potentially responsible parties, and existingtechnology, laws, and regulations. We believe that we have adequately accrued for our ultimate share of costs atsites subject to joint and several liability. However, the ultimate liability for remediation is difficult to determinebecause of the number of potentially responsible parties involved, site-specific cost sharing arrangements withother potentially responsible parties, the degree of contamination by various wastes, the scarcity and quality ofvolumetric data related to many of the sites, and the speculative nature of remediation costs. Estimates may alsovary due to changes in federal, state, and local laws governing environmental remediation. We do not expectcurrent obligations to have a material adverse effect on our results of operations or financial condition.
Guarantees – At December 31, 2006, we were contingently liable for $464 million in guarantees. We haverecorded a liability of $6 million for the fair value of these obligations as of December 31, 2006. We entered intothese contingent guarantees in the normal course of business, and they include guaranteed obligations related toour headquarters building, equipment financings, and affiliated operations. The final guarantee expires in 2022.We are not aware of any existing event of default that would require us to satisfy these guarantees. We do notexpect that these guarantees will have a material adverse effect on our consolidated financial condition, results ofoperations, or liquidity.
Indemnities – Our maximum potential exposure under indemnification arrangements, including certain taxindemnifications, can range from a specified dollar amount to an unlimited amount, depending on the nature ofthe transactions and the agreements. Due to uncertainty as to whether claims will be made or how they will beresolved, we cannot reasonably determine the probability of an adverse claim or reasonably estimate any adverseliability or the total maximum exposure under these indemnification arrangements. We do not have any reason tobelieve that we will be required to make any material payments under these indemnity provisions.
Income Taxes – As previously reported in our Form 10-Q for the quarter ended September 30, 2005, the IRS hascompleted its examinations and issued notices of deficiency for tax years 1995 through 2002. Among theirproposed adjustments is the disallowance of tax deductions claimed in connection with certain donations ofproperty. In the fourth quarter of 2005, the IRS National Office issued a Technical Advice Memorandum whichleft unresolved whether the deductions were proper, pending further factual development. We continue todispute the donation issue, as well as many of the other proposed adjustments, and will contest the associated taxdeficiencies through the IRS Appeals process, and, if necessary, litigation. In addition, the IRS is examining theCorporation’s federal income tax returns for tax years 2003 and 2004 and should complete their exam in 2007.We do not expect that the ultimate resolution of these examinations will have a material adverse effect on ourConsolidated Financial Statements.
11. Other Income
Other income included the following for the years ended December 31:
Millions of Dollars 2006 2005 2004
Rental income . . . . . . . . . . . . . . . . . . . . . . . . . . . . . . . . . . . . . . . . . . . . . . . . . . . . . . . . $ 83 $ 59 $ 55Net gain on non-operating asset dispositions . . . . . . . . . . . . . . . . . . . . . . . . . . . . . . . . 72 135 69Interest income . . . . . . . . . . . . . . . . . . . . . . . . . . . . . . . . . . . . . . . . . . . . . . . . . . . . . . . 29 17 10Sale of receivables fees . . . . . . . . . . . . . . . . . . . . . . . . . . . . . . . . . . . . . . . . . . . . . . . . . . (33) (23) (11)Non-operating environmental costs and other . . . . . . . . . . . . . . . . . . . . . . . . . . . . . . (33) (43) (35)
Total . . . . . . . . . . . . . . . . . . . . . . . . . . . . . . . . . . . . . . . . . . . . . . . . . . . . . . . . . . . . . . . . $118 $145 $ 88
68

12. Accounting Pronouncements
In June 2006, the FASB issued Interpretation No. 48, Accounting for Uncertainty in Income Taxes, an interpretationof FASB Statement No. 109 (FIN 48). Under FIN 48, we will recognize tax benefits only for tax positions that aremore likely than not to be sustained upon examination by tax authorities. The amount recognized will bemeasured as the largest amount of benefit that is greater than 50 percent likely of being realized upon ultimatesettlement. The interpretation is effective for us beginning in the first quarter of 2007. The cumulative effect ofadopting FIN 48 will be a one-time reduction in the January 1, 2007 balance of retained earnings. Future changesin uncertain tax positions will be included in income tax expense. We do not expect that the cumulative effect ofadopting FIN 48 will have a material impact on our Consolidated Financial Statements.
In September 2006, the FASB issued Statement No. 157, Fair Value Measurement (FAS 157). While thisstatement does not require new fair value measurements, it provides guidance on applying fair value and expandsrequired disclosures. FAS 157 is effective for us beginning in the first quarter of 2008. We are currently assessingthe impact FAS 157 may have on our Consolidated Financial Statements.
In September 2006, the FASB issued FAS 158. FAS 158 required us to recognize the funded status of ourpension and postretirement plans in the balance sheet, along with a corresponding noncash, after-tax adjustmentto shareholders’ equity. Funded status is determined as the difference between the fair value of plan assets and thebenefit obligation. Changes in the funded status will be recognized in other comprehensive loss. We adopted FAS158 at the end of 2006 and have disclosed the impact of the adoption in note 7.
In September 2006, the Securities and Exchange Commission (SEC) issued Staff Accounting BulletinNo. 108, Considering the Effects of Prior Year Misstatements when Quantifying Misstatements in Current YearFinancial Statements (SAB 108), which provides interpretive guidance on how the effects of prior-yearuncorrected misstatements should be considered when quantifying misstatements in the current-year financialstatements. SAB 108 requires registrants to quantify misstatements using both an income statement and balancesheet approach and then evaluate whether either approach results in a misstatement that, when all relevantquantitative and qualitative factors are considered, is material. If prior-year errors that had been previouslyconsidered immaterial are now considered material based on either approach, no restatement is required so longas management properly applied its previous approach and all relevant facts and circumstances were considered.If prior-year’s financial statements are not restated, the cumulative effect adjustment is recorded in openingaccumulated earnings (deficit) as of the beginning of the fiscal year of adoption. SAB 108 was effective for us atthe end of 2006. The adoption of SAB 108 did not have any impact on our Consolidated Financial Statements.
In February 2007, the FASB issued Statement No. 159, The Fair Value Option for Financial Assets andFinancial Liabilities (FAS 159). This statement, which is expected to expand fair value measurement, permitsentities to choose to measure many financial instruments and certain other items at fair value. FAS 159 is effectivefor us beginning in the first quarter of 2008. We are currently assessing the impact FAS 159 may have on ourConsolidated Financial Statements.
69

13. Selected Quarterly Data (Unaudited)
Millions of Dollars, Except Per Share Amounts
2006 Mar. 31 June 30 Sep. 30 Dec. 31
Operating revenue . . . . . . . . . . . . . . . . . . . . . . . . . . . . . . . . . . . . . . . $3,710 $3,923 $3,983 $3,962Operating income . . . . . . . . . . . . . . . . . . . . . . . . . . . . . . . . . . . . . . . 605 717 752 810Net income . . . . . . . . . . . . . . . . . . . . . . . . . . . . . . . . . . . . . . . . . . . . 311 390 420 485Net income per share
Basic . . . . . . . . . . . . . . . . . . . . . . . . . . . . . . . . . . . . . . . . . . . . . . . . 1.16 1.45 1.56 1.79Diluted . . . . . . . . . . . . . . . . . . . . . . . . . . . . . . . . . . . . . . . . . . . . . . 1.15 1.44 1.54 1.78
2005 Mar. 31 June 30 Sep. 30[a] Dec. 31
Operating revenue . . . . . . . . . . . . . . . . . . . . . . . . . . . . . . . . . . . . . . . $3,152 $3,344 $3,461 $3,621Operating income . . . . . . . . . . . . . . . . . . . . . . . . . . . . . . . . . . . . . . . 313 468 481 533Net income . . . . . . . . . . . . . . . . . . . . . . . . . . . . . . . . . . . . . . . . . . . . 128 233 369 296Net income per share
Basic . . . . . . . . . . . . . . . . . . . . . . . . . . . . . . . . . . . . . . . . . . . . . . . . 0.49 0.89 1.40 1.11Diluted . . . . . . . . . . . . . . . . . . . . . . . . . . . . . . . . . . . . . . . . . . . . . . 0.48 0.88 1.38 1.10
[a] Net income includes a $118 million tax expense reduction to reflect a reduction in the estimated deferred income tax liability.
****************************************
70
Item 9. Changes in and Disagreements with Accountants on Accounting and FinancialDisclosure
None.
Item 9A. Controls and Procedures
As of the end of the period covered by this report, the Corporation carried out an evaluation, under thesupervision and with the participation of the Corporation’s management, including the Corporation’s ChiefExecutive Officer (CEO) and Executive Vice President – Finance and Chief Financial Officer (CFO), of theeffectiveness of the design and operation of the Corporation’s disclosure controls and procedures pursuant toExchange Act Rules 13a-15 and 15d-15. In designing and evaluating the disclosure controls and procedures,management recognized that any controls and procedures, no matter how well designed and operated, canprovide only reasonable assurance of achieving the desired control objectives. Based upon that evaluation, theCEO and the CFO concluded that, as of the end of the period covered by this report, the Corporation’s disclosurecontrols and procedures were effective to provide reasonable assurance that information required to be disclosedin our Exchange Act reports is recorded, processed, summarized and reported within the time periods specified bythe SEC, and that such information is accumulated and communicated to management, including the CEO andCFO, as appropriate, to allow timely decisions regarding required disclosure.
Additionally, the CEO and CFO determined that there have been no changes to the Corporation’s internalcontrol over financial reporting (as defined in Exchange Act Rules 13a-15(f) and 15d-15(f)) during the last fiscalquarter that have materially affected, or are reasonably likely to materially affect, the Corporation’s internalcontrol over financial reporting.
71

MANAGEMENT’S ANNUAL REPORT ON INTERNAL CONTROL OVER FINANCIALREPORTING
The management of Union Pacific Corporation and Subsidiary Companies (the Corporation) is responsible forestablishing and maintaining adequate internal control over financial reporting (as defined in Exchange Act Rules13a-15(f) and 15d-15(f)). The Corporation’s internal control system was designed to provide reasonableassurance to the Corporation’s management and Board of Directors regarding the preparation and fairpresentation of published financial statements.
All internal control systems, no matter how well designed, have inherent limitations. Therefore, even thosesystems determined to be effective can provide only reasonable assurance with respect to financial statementpreparation and presentation.
The Corporation’s management assessed the effectiveness of the Corporation’s internal control over financialreporting as of December 31, 2006. In making this assessment, it used the criteria set forth by the Committee ofSponsoring Organizations of the Treadway Commission (COSO) in Internal Control – Integrated Framework.Based on our assessment management believes that, as of December 31, 2006, the Corporation’s internal controlover financial reporting is effective based on those criteria.
The Corporation’s independent registered public accounting firm has issued an attestation report on ourassessment of the Corporation’s internal control over financial reporting. This report appears on page 73.
February 15, 2007
72

REPORT OF INDEPENDENT REGISTERED PUBLIC ACCOUNTING FIRM
Union Pacific Corporation, its Directors, and Shareholders:
We have audited management’s assessment, included in the accompanying Management’s Annual Report onInternal Control Over Financial Reporting, that Union Pacific Corporation and Subsidiary Companies (theCorporation) maintained effective internal control over financial reporting as of December 31, 2006, based oncriteria established in Internal Control – Integrated Framework issued by the Committee of Sponsoring Organizationsof the Treadway Commission. The Corporation’s management is responsible for maintaining effective internalcontrol over financial reporting and for its assessment of the effectiveness of internal control over financial reporting.Our responsibility is to express an opinion on management’s assessment and an opinion on the effectiveness of theCorporation’s internal control over financial reporting based on our audit.
We conducted our audit in accordance with the standards of the Public Company Accounting Oversight Board(United States). Those standards require that we plan and perform the audit to obtain reasonable assurance aboutwhether effective internal control over financial reporting was maintained in all material respects. Our audit includedobtaining an understanding of internal control over financial reporting, evaluating management’s assessment, testingand evaluating the design and operating effectiveness of internal control, and performing such other procedures aswe considered necessary in the circumstances. We believe that our audit provides a reasonable basis for our opinions.
A company’s internal control over financial reporting is a process designed by, or under the supervision of, thecompany’s principal executive and principal financial officers, or persons performing similar functions, and effectedby the company’s board of directors, management, and other personnel to provide reasonable assurance regardingthe reliability of financial reporting and the preparation of financial statements for external purposes in accordancewith generally accepted accounting principles. A company’s internal control over financial reporting includes thosepolicies and procedures that (1) pertain to the maintenance of records that, in reasonable detail, accurately and fairlyreflect the transactions and dispositions of the assets of the company; (2) provide reasonable assurance thattransactions are recorded as necessary to permit preparation of financial statements in accordance with generallyaccepted accounting principles, and that receipts and expenditures of the company are being made only inaccordance with authorizations of management and directors of the company; and (3) provide reasonable assuranceregarding prevention or timely detection of unauthorized acquisition, use, or disposition of the company’s assets thatcould have a material effect on the financial statements.
Because of the inherent limitations of internal control over financial reporting, including the possibility ofcollusion or improper management override of controls, material misstatements due to error or fraud may not beprevented or detected on a timely basis. Also, projections of any evaluation of the effectiveness of the internal controlover financial reporting to future periods are subject to the risk that the controls may become inadequate because ofchanges in conditions, or that the degree of compliance with the policies or procedures may deteriorate.
In our opinion, management’s assessment that the Corporation maintained effective internal control overfinancial reporting as of December 31, 2006, is fairly stated, in all material respects, based on the criteria establishedin Internal Control – Integrated Framework issued by the Committee of Sponsoring Organizations of the TreadwayCommission. Also in our opinion, the Corporation maintained, in all material respects, effective internal controlover financial reporting as of December 31, 2006, based on the criteria established in Internal Control – IntegratedFramework issued by the Committee of Sponsoring Organizations of the Treadway Commission.
We have also audited, in accordance with the standards of the Public Company Accounting Oversight Board(United States), the consolidated financial statements and financial statement schedule as of and for the year endedDecember 31, 2006 of the Corporation and our report dated February 16, 2007 expressed an unqualified opinion onthose consolidated financial statements and financial statement schedule and included an explanatory paragraphregarding the Corporation’s adoption, in 2006, of Statement of Financial Accounting Standard No. 158, Employers’Accounting for Defined Benefit Pension and Other Postretirement Plans.
Omaha, NebraskaFebruary 16, 2007
73

Item 9B. Other Information
None.
74

PART III
Item 10. Directors, Executive Officers, and Corporate Governance
(a) Directors of Registrant.
Information as to the names, ages, positions and offices with UPC, terms of office, periods of service,business experience during the past five years and certain other directorships held by each director or personnominated to become a director of UPC is set forth in the Election of Directors segment of the ProxyStatement and is incorporated herein by reference.
Information concerning our Audit Committee and the independence of its members, along withinformation about the audit committee financial expert(s) serving on the Audit Committee, is set forth inthe Audit Committee segment of the Proxy Statement and is incorporated herein by reference.
(b) Executive Officers of Registrant.
Information concerning the executive officers of UPC and its subsidiaries is presented in Part I of this reportunder Executive Officers of the Registrant and Principal Executive Officers of Subsidiaries.
(c) Section 16(a) Compliance.
Information concerning compliance with Section 16(a) of the Securities Exchange Act of 1934 is set forth inthe Section 16(a) Beneficial Ownership Reporting Compliance segment of the Proxy Statement and isincorporated herein by reference.
(d) Code of Ethics for Chief Executive Officer and Senior Financial Officers of Registrant.
The Board of Directors of UPC has adopted the UPC Code of Ethics for the Chief Executive Officer andSenior Financial Officers (the Code). A copy of the Code may be found on the Internet at our websitewww.up.com/investors. We intend to disclose any amendments to the Code or any waiver from a provisionof the Code on our website.
Item 11. Executive Compensation
Information concerning compensation received by our directors and our named executive officers is presented inthe Compensation Discussion and Analysis, Summary Compensation Table, Grants of Plan-Based Awards inFiscal Year 2006, Outstanding Equity Awards at 2006 Fiscal Year-End, Option Exercises and Stock Vested in FiscalYear 2006, Pension Benefits at 2006 Fiscal Year-End, Nonqualified Deferred Compensation at 2006 Fiscal Year-End, Potential Payments Upon Termination or Change in Control and Director Compensation in Fiscal Year2006 segments of the Proxy Statement and is incorporated herein by reference. Additional information regardingcompensation of directors, including Board committee members, is set forth in the By-Laws of UPC and theStock Unit Grant and Deferred Compensation Plan for the Board of Directors, both of which are included asexhibits to this report. Information regarding the Compensation Committee is set forth in the CompensationCommittee Interlocks and Insider Participation and Compensation Committee Report segments of the ProxyStatement and is incorporated herein by reference.
Item 12. Security Ownership of Certain Beneficial Owners and Management and RelatedStockholder Matters
Information as to the number of shares of our equity securities beneficially owned by each of our directors andnominees for director, our named executive officers, our directors and executive officers as a group, and certain
75

beneficial owners is set forth in the Security Ownership of Certain Beneficial Owners and Management segmentof the Proxy Statement and is incorporated herein by reference.
The following table summarizes the equity compensation plans under which Union Pacific Corporationcommon stock may be issued as of December 31, 2006.
Plan Category
Number of securitiesto be issued upon
exercise ofoutstanding options,warrants and rights
(a)
Weighted-averageexercise price of
outstandingoptions, warrants
and rights(b)
Number of securitiesremaining available for
future issuance underequity compensation plans
(excluding securitiesreflected in column (a))
(c)
Equity compensation plans approvedby security holders . . . . . . . . . . . . . 9,389,429[1] $65.37[2] 18,096,434
Equity compensation plans notapproved by security holders [3] . . 1,119,910 55.00 -
Total . . . . . . . . . . . . . . . . . . . . . . . . . . 10,509,339 $64.22 18,096,434
[1] Includes 464,812 retention units that do not have an exercise price. Does not include 447,170 retention shares that are actually issued andoutstanding.
[2] Does not include the retention units or retention shares described above in footnote [1].[3] The UP Shares Stock Option Plan (UP Shares Plan) is the only equity compensation plan not approved by shareholders. The UP Shares Plan
was approved by the Company’s Board of Directors on April 30, 1998 and reserved 12,000,000 shares of common stock for issuance. The UPShares Plan was a broad-based option program that granted each active employee on April 30, 1998 non-qualified options to purchase 200shares of common stock at $55.00 per share. Options became exercisable on May 1, 2001 and expire on April 30, 2008. If an optionee’semployment terminates for any reason, the option remains exercisable for a period of one year after the date of termination, but no option isexercisable after April 30, 2008. No further options may be granted under the UP Shares Plan.
Item 13. Certain Relationships and Related Transactions, and Director Independence
Information on related transactions is set forth in the Certain Relationships and Related Transactions andCompensation Committee Interlocks and Insider Participation segments of the Proxy Statement and isincorporated herein by reference. We do not have any relationship with any outside third party that would enablesuch a party to negotiate terms of a material transaction that may not be available to, or available from, otherparties on an arm’s-length basis.
Information regarding the independence of our directors is set forth in the Director Independence segment of theProxy Statement and is incorporated herein by reference.
Item 14. Principal Accounting Fees and Services
Information concerning the fees billed by our independent registered public accounting firm and the nature ofservices comprising the fees for each of the two most recent fiscal years in each of the following categories:(i) audit fees, (ii) audit—related fees, (iii) tax fees, and (iv) all other fees, is set forth in the Independent RegisteredPublic Accounting Firm’s Fees and Services segment of the Proxy Statement and is incorporated herein byreference.
Information concerning our Audit Committee’s policies and procedures pertaining to pre-approval of audit andnon-audit services rendered by our independent registered public accounting firm is set forth in the AuditCommittee segment of the Proxy Statement and is incorporated herein by reference.
76

PART IV
Item 15. Exhibits, Financial Statement Schedules
(a) Financial Statements, Financial Statement Schedules, and Exhibits:
(1) Financial Statements
The financial statements filed as part of this filing are listed on the index to the Financial Statements andSupplementary Data, Item 8, on page 42.
(2) Financial Statement Schedules
Schedule II—Valuation and Qualifying Accounts
Schedules not listed above have been omitted because they are not applicable or not required or theinformation required to be set forth therein is included in the Financial Statements and SupplementaryData, Item 8, or notes thereto.
(3) Exhibits
Exhibits are listed in the exhibit index beginning on page 80. The exhibits include managementcontracts, compensatory plans and arrangements required to be filed as exhibits to the Form 10-K byItem 601 (10) (iii) of Regulation S-K.
77
SIGNATURES
Pursuant to the requirements of Section 13 or 15(d) of the Securities Exchange Act of 1934, the registrant has dulycaused this report to be signed on its behalf by the undersigned, thereunto duly authorized, on this 23rd day ofFebruary, 2007.
UNION PACIFIC CORPORATION
By /s/ James R. Young
James R. Young,Chairman, President,Chief Executive Officer, and Director
Pursuant to the requirements of the Securities Exchange Act of 1934, this report has been signed below, on this23rd day of February, 2007, by the following persons on behalf of the registrant and in the capacities indicated.
PRINCIPAL EXECUTIVE OFFICERAND DIRECTOR:
/s/ James R. Young
James R. Young,Chairman, President,Chief Executive Officer, and Director
PRINCIPAL FINANCIAL OFFICER:
/s/ Robert M. Knight, Jr.
Robert M. Knight, Jr.,Executive Vice President—Finance and ChiefFinancial Officer
PRINCIPAL ACCOUNTING OFFICER:
/s/ Richard J. Putz
Richard J. Putz,Vice President and Controller
DIRECTORS:
Andrew H. Card, Jr.* Judith Richards Hope*Erroll B. Davis, Jr.* Charles C. Krulak*Thomas J. Donohue* Michael W. McConnell*Archie W. Dunham* Steven R. Rogel*
* By /s/ Thomas E. Whitaker
Thomas E. Whitaker, Attorney-in-fact
78

SCHEDULE II—VALUATION AND QUALIFYING ACCOUNTSUnion Pacific Corporation and Subsidiary Companies
Millions of Dollars, for the Years Ended December 31, 2006 2005 2004
Allowance for doubtful accounts:Balance, beginning of period . . . . . . . . . . . . . . . . . . . . . . . . . . . . . . . . . . . . . . . . . . $ 126 $ 107 $ 101Charges/(reduction) to expense . . . . . . . . . . . . . . . . . . . . . . . . . . . . . . . . . . . . . . . . (7) 2 11Net recoveries / (write-offs) . . . . . . . . . . . . . . . . . . . . . . . . . . . . . . . . . . . . . . . . . . . (20) 17 (5)
Balance, end of period . . . . . . . . . . . . . . . . . . . . . . . . . . . . . . . . . . . . . . . . . . . . . . . . . $ 99 $ 126 $ 107
Allowance for doubtful accounts are presented in the Consolidated Statements ofFinancial Position as follows:
Current . . . . . . . . . . . . . . . . . . . . . . . . . . . . . . . . . . . . . . . . . . . . . . . . . . . . . . . . . $ 6 $ 16 $ 19Long-term . . . . . . . . . . . . . . . . . . . . . . . . . . . . . . . . . . . . . . . . . . . . . . . . . . . . . . . 93 110 88
Balance, end of period . . . . . . . . . . . . . . . . . . . . . . . . . . . . . . . . . . . . . . . . . . . . . . . . . $ 99 $ 126 $ 107
Accrued casualty costs:Balance, beginning of period . . . . . . . . . . . . . . . . . . . . . . . . . . . . . . . . . . . . . . . . . . $1,354 $1,303 $ 989Charges to expense . . . . . . . . . . . . . . . . . . . . . . . . . . . . . . . . . . . . . . . . . . . . . . . . . . 417 409 683Cash payments and other reductions . . . . . . . . . . . . . . . . . . . . . . . . . . . . . . . . . . . . (494) (358) (369)
Balance, end of period . . . . . . . . . . . . . . . . . . . . . . . . . . . . . . . . . . . . . . . . . . . . . . . . . $1,277 $1,354 $1,303
Accrued casualty costs are presented in the Consolidated Statements of FinancialPosition as follows:
Current . . . . . . . . . . . . . . . . . . . . . . . . . . . . . . . . . . . . . . . . . . . . . . . . . . . . . . . . . $ 409 $ 478 $ 419Long-term . . . . . . . . . . . . . . . . . . . . . . . . . . . . . . . . . . . . . . . . . . . . . . . . . . . . . . . 868 876 884
Balance, end of period . . . . . . . . . . . . . . . . . . . . . . . . . . . . . . . . . . . . . . . . . . . . . . . . . $1,277 $1,354 $1,303
79

Union Pacific CorporationExhibit Index
Exhibit No. Description
Filed with this Statement
3(a) By-Laws of UPC, as amended, effective October 1, 2006.
10(a) Form of 2007 Long Term Plan Stock Unit Agreement.
10(b) UPC 2000 Directors Stock Plan, as amended November 16, 2006 and January 30, 2007.
10(c) UP Shares Stock Option Plan of UPC, as amended November 16, 2006.
10(d) The 1993 Stock Option and Retention Stock Plan of UPC, as amended November 16, 2006.
10(e) UPC 2001 Stock Incentive Plan, as amended November 16, 2006.
10(f) UPC 2004 Stock Incentive Plan, as amended November 16, 2006.
12 Ratio of Earnings to Fixed Charges.
21 List of the Corporation’s significant subsidiaries and their respective states ofincorporation.
23 Independent Registered Public Accounting Firm’s Consent.
24 Powers of attorney executed by the directors of UPC.
31(a) Certification Pursuant to Rule 13a-14(a), of the Exchange Act, as Adopted pursuant toSection 302 of the Sarbanes-Oxley Act of 2002 – James R. Young.
31(b) Certification Pursuant to Rule 13a-14(a), of the Exchange Act, as Adopted pursuant toSection 302 of the Sarbanes-Oxley Act of 2002 – Robert M. Knight, Jr.
32(a) Certification Pursuant to 18 U.S.C. Section 1350, as Adopted pursuant to Section 906 ofthe Sarbanes-Oxley Act of 2002 – James R. Young.
32(b) Certification Pursuant to 18 U.S.C. Section 1350, as Adopted pursuant to Section 906 ofthe Sarbanes-Oxley Act of 2002 – Robert M. Knight, Jr.
80

Incorporated by Reference
3(b) Revised Articles of Incorporation of UPC, as amended through April 25, 1996, areincorporated herein by reference to Exhibit 3 to the Corporation’s Quarterly Report onForm 10-Q for the quarter ended March 31, 1996.
4(a) Indenture, dated as of December 20, 1996, between UPC and Citibank, N.A., as Trustee, isincorporated herein by reference to Exhibit 4.1 to UPC’s Registration Statement on FormS-3 (No. 333-18345).
4(b) Indenture, dated as of April 1, 1999, between UPC and JP Morgan Chase Bank, formerlyThe Chase Manhattan Bank, as Trustee, is incorporated herein by reference to Exhibit 4.2to UPC’s Registration Statement on Form S-3 (No. 333-75989).
4(c) Form of Debt Security is incorporated herein by reference to Exhibit 4.3 to UPC’sRegistration Statement on Form S-3 (No. 33-59323). Certain instruments evidencing long-term indebtedness of UPC are not filed as exhibits because the total amount of securitiesauthorized under any single such instrument does not exceed 10% of the Corporation’stotal consolidated assets. UPC agrees to furnish the Commission with a copy of any suchinstrument upon request by the Commission.
10(g) Amended and Restated Registration Rights Agreement, dated as of July 12, 1996, amongUPC, UP Holding Company, Inc., Union Pacific Merger Co. and Southern Pacific RailCorporation (SP) is incorporated herein by reference to Annex J to the Joint ProxyStatement/Prospectus included in Post-Effective Amendment No. 2 to UPC’s RegistrationStatement on Form S-4 (No. 33-64707).
10(h) Agreement, dated September 25, 1995, among UPC, UPRR, Missouri Pacific RailroadCompany (MPRR), SP, Southern Pacific Transportation Company (SPT), The Denver &Rio Grande Western Railroad Company (D&RGW), St. Louis Southwestern RailwayCompany (SLSRC) and SPCSL Corp. (SPCSL), on the one hand, and Burlington NorthernRailroad Company (BN) and The Atchison, Topeka and Santa Fe Railway Company (SantaFe), on the other hand, is incorporated by reference to Exhibit 10.11 to UPC’s RegistrationStatement on Form S-4 (No. 33-64707).
10(i) Supplemental Agreement, dated November 18, 1995, between UPC, UPRR, MPRR, SP,SPT, D&RGW, SLSRC and SPCSL, on the one hand, and BN and Santa Fe, on the otherhand, is incorporated herein by reference to Exhibit 10.12 to UPC’s Registration Statementon Form S-4 (No. 33-64707).
10(j) The Executive Incentive Plan of UPC, as amended May 31, 2001, is incorporated herein byreference to Exhibit 10(b) to the Corporation’s Quarterly Report on Form 10-Q for thequarter ended June 30, 2001.
10(k) Written Description of Premium Exchange Program Pursuant to 1993 Stock Option andRetention Stock Plan of UPC is incorporated herein by reference to Exhibit 10(b) to theCorporation’s Quarterly Report on Form 10-Q for the quarter ended September 30, 1999.
81

10(l) UPC Key Employee Continuity Plan dated November 16, 2000, is incorporated herein byreference to Exhibit 10(o) to the Corporation’s Annual Report on Form 10-K for the yearended December 31, 2000.
10(m) The Pension Plan for Non-Employee Directors of UPC, as amended January 25, 1996, isincorporated herein by reference to Exhibit 10(w) to the Corporation’s Annual Report onForm 10-K for the year ended December 31, 1995.
10(n) The Executive Life Insurance Plan of UPC, as amended October 1997, is incorporatedherein by reference to Exhibit 10(t) to the Corporation’s Annual Report on Form 10-K forthe year ended December 31, 1997.
10(o) The UPC Stock Unit Grant and Deferred Compensation Plan for the Board of Directors, asamended January 1, 2003, is incorporated herein by reference to Exhibit 10(a) to theCorporation’s Annual Report on Form 10-K for the year ended December 31, 2004.
10(p) Charitable Contribution Plan for Non-Employee Directors of Union Pacific Corporation isincorporated herein by reference to Exhibit 10(z) to the Corporation’s Annual Report onForm 10-K for the year ended December 31, 1995.
10(q) Written Description of Other Executive Compensation Arrangements of Union PacificCorporation is incorporated herein by reference to Exhibit 10(q) to the Corporation’sAnnual Report on Form 10-K for the year ended December 31, 1998.
10(r) Form of Non-Qualified Stock Option Agreement for Executives is incorporated herein byreference to Exhibit 10(a) to the Corporation’s Quarterly Report on Form 10-Q for thequarter ended September 30, 2004.
10(s) Form of Stock Unit Agreement for Executives is incorporated herein by reference toExhibit 10(b) to the Corporation’s Quarterly Report on Form 10-Q for the quarter endedSeptember 30, 2004.
10(t) Form of Stock Unit Agreement for Executive Incentive Premium Exchange Program isincorporated herein by reference to Exhibit 10(c) to the Corporation’s Quarterly Report onForm 10-Q for the quarter ended September 30, 2004.
10(u) Form of Non-Qualified Stock Option Agreement for Directors is incorporated herein byreference to Exhibit 10(d) to the Corporation’s Quarterly Report on Form 10-Q for thequarter ended September 30, 2004.
10(v) Form of Stock Unit Agreement for Executives, is incorporated herein by reference toExhibit 10(b) to the Corporation’s Annual Report on Form 10-K for the year endedDecember 31, 2005.
10(w) Form of Non-Qualified Stock Option Agreement for Executives, is incorporated herein byreference to Exhibit 10(c) to the Corporation’s Annual Report on Form 10-K for the yearended December 31, 2005.
82

10(x) UPC Executive Incentive Plan, effective May 5, 2005, is incorporated herein by reference toExhibit 10(d) to the Corporation’s Annual Report on Form 10-K for the year endedDecember 31, 2005.
10(y) Supplemental Thrift Plan of UPC, as amended December 21, 2005, is incorporated hereinby reference to Exhibit 10(e) to the Corporation’s Annual Report on Form 10-K for theyear ended December 31, 2005.
10(z) The Supplemental Pension Plan for Officers and Managers of UPC and Affiliates, asamended December 21, 2005, is incorporated herein by reference to Exhibit 10(f) to theCorporation’s Annual Report on Form 10-K for the year ended December 31, 2005.
10(aa) Executive Incentive Plan (2005) – Deferred Compensation Program, dated December 21,2005, is incorporated herein by reference to Exhibit 10(g) to the Corporation’s AnnualReport on Form 10-K for the year ended December 31, 2005.
83

Exhibit 12
RATIO OF EARNINGS TO FIXED CHARGESUnion Pacific Corporation and Subsidiary Companies
Millions of Dollars, Except for Ratios 2006 2005 2004 2003 2002
Earnings:Net income . . . . . . . . . . . . . . . . . . . . . . . . . . . . . . . . . . . . . . . . . $1,606 $1,026 $ 604 $1,056 $1,265Equity earnings net of distributions . . . . . . . . . . . . . . . . . . . . . . (59) (48) (47) 15 (34)
Total earnings . . . . . . . . . . . . . . . . . . . . . . . . . . . . . . . . . . . . . . . . . 1,547 978 557 1,071 1,231
Income taxes . . . . . . . . . . . . . . . . . . . . . . . . . . . . . . . . . . . . . . . . . . 919 410 252 581 680
Fixed charges:Interest expense including amortization of debt discount . . . . . 477 504 527 574 632Portion of rentals representing an interest factor . . . . . . . . . . . . 243 220 206 169 172
Total fixed charges . . . . . . . . . . . . . . . . . . . . . . . . . . . . . . . . . . . . . . 720 724 733 743 804
Earnings available for fixed charges . . . . . . . . . . . . . . . . . . . . . . . . $3,186 $2,112 $1,542 $2,395 $2,715
Ratio of earnings to fixed charges . . . . . . . . . . . . . . . . . . . . . . . . . . 4.4 2.9 2.1 3.2 3.4
84

Exhibit 21
SIGNIFICANT SUBSIDIARIES OF UNION PACIFIC CORPORATION
Name of CorporationState ofIncorporation
Union Pacific Railroad Company . . . . . . . . . . . . . . . . . . . . . . . . . . . . . . . . . . . . . . . . . . . . . . . . . . . . DelawareSouthern Pacific Rail Corporation . . . . . . . . . . . . . . . . . . . . . . . . . . . . . . . . . . . . . . . . . . . . . . . . . . . Utah
85

Exhibit 23
CONSENT OF INDEPENDENT REGISTERED PUBLIC ACCOUNTING FIRM
We consent to the incorporation by reference in Post-Effective Amendment No. 1 to Registration StatementNo. 33-12513, Registration Statement No. 33-53968, Registration Statement No. 33-49785, RegistrationStatement No. 33-49849, Registration Statement No. 33-51071, Registration Statement No. 333-10797,Registration Statement No. 333-13115, Registration Statement No. 333-16563, Registration StatementNo. 333-88225, Registration Statement No. 333-88709, Registration Statement No. 333-57958, RegistrationStatement No. 333-61856, Registration Statement No. 333-42768, Registration Statement No. 333-106707,Registration Statement No. 333-106708, Registration Statement No. 333-105714, Registration StatementNo. 333-105715, Registration Statement No. 333-116003, and Registration Statement 333-132324 on Forms S-8and Registration No. 333-88666, Amendment No. 1 to Registration Statement No. 333-88666, and RegistrationStatement No. 333-111185 on Forms S-3 of our reports dated February 16, 2007, relating to the consolidatedfinancial statements and financial statement schedule of Union Pacific Corporation and Subsidiary Companies(which report expressed an unqualified opinion and included an explanatory paragraph relating to theCorporation’s adoption, in 2006, of Statement of Financial Accounting Standard No. 158, Employers’ Accountingfor Defined Benefit Pension and Other Postretirement Plans) and management’s report on the effectiveness ofinternal control over financial reporting, appearing in this Annual Report on Form 10-K of Union PacificCorporation and Subsidiary Companies for the year ended December 31, 2006.
Omaha, NebraskaFebruary 22, 2007
86

Exhibit 24
UNION PACIFIC CORPORATIONPowers of Attorney
Each of the undersigned directors of Union Pacific Corporation, a Utah corporation (the "Company”), do herebyappoint each of James R. Young, Barbara W. Schaefer, and Thomas E. Whitaker his or her true and lawfulattorney-in-fact and agent, to sign on his or her behalf the Company’s Annual Report on Form 10-K, for the yearended December 31, 2006, and any and all amendments thereto, and to file the same, with all exhibits thereto,with the Securities and Exchange Commission.
IN WITNESS WHEREOF, the undersigned have executed this Power of Attorney as of February 22, 2007.
/s/ Andrew H. Card, Jr.
Andrew H. Card, Jr.
/s/ Judith Richards Hope
Judith Richards Hope
/s/ Erroll B. Davis, Jr.
Erroll B. Davis, Jr.
/s/ Charles C. Krulak
Charles C. Krulak
/s/ Thomas J. Donohue
Thomas J. Donohue
/s/ Michael W. McConnell
Michael W. McConnell
/s/ Archie W. Dunham
Archie W. Dunham
/s/ Steven R. Rogel
Steven R. Rogel
87

Exhibit 31(a)
CERTIFICATION OF PRINCIPAL EXECUTIVE OFFICER
I, James R. Young, certify that:
1. I have reviewed this annual report on Form 10-K of Union Pacific Corporation;
2. Based on my knowledge, this report does not contain any untrue statement of material fact or omit to state amaterial fact necessary to make the statements made, in light of the circumstances under which suchstatements were made, not misleading with respect to the period covered by this report;
3. Based on my knowledge, the financial statements, and other financial information included in this report,fairly present in all material respects the financial condition, results of operations and cash flows of theregistrant as of, and for, the periods presented in this report;
4. The registrant’s other certifying officer(s) and I are responsible for establishing and maintaining disclosurecontrols and procedures (as defined in Exchange Act Rules 13a-15(e) and 15d-15(e)) and internal controlover financial reporting (as defined in Exchange Act Rules 13a-15(f) and 15d-15(f)) for the registrant andhave:
(a) Designed such disclosure controls and procedures, or caused such disclosure controls and procedures tobe designed under our supervision, to ensure that material information relating to the registrant,including its consolidated subsidiaries, is made known to us by others within those entities, particularlyduring the period in which this report is being prepared;
(b) Designed such internal control over financial reporting, or caused such internal control over financialreporting to be designed under our supervision, to provide reasonable assurance regarding thereliability of financial reporting and the preparation of financial statements for external purposes inaccordance with generally accepted accounting principles;
(c) Evaluated the effectiveness of the registrant’s disclosure controls and procedures and presented in thisreport our conclusions about the effectiveness of the disclosure controls and procedures, as of the end ofthe period covered by this report based on such evaluation; and
(d) Disclosed in this report any change in the registrant’s internal control over financial reporting thatoccurred during the registrant’s most recent fiscal quarter (the registrant’s fourth fiscal quarter in thecase of an annual report) that has materially affected, or is reasonably likely to materially affect, theregistrant’s internal control over financial reporting; and
5. The registrant’s other certifying officer(s) and I have disclosed, based on our most recent evaluation ofinternal control over financial reporting, to the registrant’s auditors and the audit committee of theregistrant’s board of directors (or persons performing the equivalent functions):
(a) All significant deficiencies and material weaknesses in the design or operation of internal control overfinancial reporting which are reasonably likely to adversely affect the registrant’s ability to record,process, summarize and report financial information; and
(b) Any fraud, whether or not material, that involves management or other employees who have asignificant role in the registrant’s internal control over financial reporting.
Date: February 23, 2007
/s/ James R. Young
James R. YoungChairman, President andChief Executive Officer
88

Exhibit 31(b)
CERTIFICATION OF PRINCIPAL FINANCIAL OFFICER
I, Robert M. Knight, Jr., certify that:
1. I have reviewed this annual report on Form 10-K of Union Pacific Corporation;
2. Based on my knowledge, this report does not contain any untrue statement of material fact or omit to state amaterial fact necessary to make the statements made, in light of the circumstances under which suchstatements were made, not misleading with respect to the period covered by this report;
3. Based on my knowledge, the financial statements, and other financial information included in this report,fairly present in all material respects the financial condition, results of operations and cash flows of theregistrant as of, and for, the periods presented in this report;
4. The registrant’s other certifying officer(s) and I are responsible for establishing and maintaining disclosurecontrols and procedures (as defined in Exchange Act Rules 13a-15(e) and 15d-15(e)) and internal controlover financial reporting (as defined in Exchange Act Rules 13a-15(f) and 15d-15(f))for the registrant andhave:
(a) Designed such disclosure controls and procedures, or caused such disclosure controls and procedures tobe designed under our supervision, to ensure that material information relating to the registrant,including its consolidated subsidiaries, is made known to us by others within those entities, particularlyduring the period in which this report is being prepared;
(b) Designed such internal control over financial reporting, or caused such internal control over financialreporting to be designed under our supervision, to provide reasonable assurance regarding thereliability of financial reporting and the preparation of financial statements for external purposes inaccordance with generally accepted accounting principles;
(c) Evaluated the effectiveness of the registrant’s disclosure controls and procedures and presented in thisreport our conclusions about the effectiveness of the disclosure controls and procedures, as of the end ofthe period covered by this report based on such evaluation; and
(d) Disclosed in this report any change in the registrant’s internal control over financial reporting thatoccurred during the registrant’s most recent fiscal quarter (the registrant’s fourth fiscal quarter in thecase of an annual report) that has materially affected, or is reasonably likely to materially affect, theregistrant’s internal control over financial reporting; and
5. The registrant’s other certifying officer(s) and I have disclosed, based on our most recent evaluation ofinternal control over financial reporting, to the registrant’s auditors and the audit committee of theregistrant’s board of directors (or persons performing the equivalent functions):
(a) All significant deficiencies and material weaknesses in the design or operation of internal control overfinancial reporting which are reasonably likely to adversely affect the registrant’s ability to record,process, summarize and report financial information; and
(b) Any fraud, whether or not material, that involves management or other employees who have asignificant role in the registrant’s internal control over financial reporting.
Date: February 23, 2007
/s/ Robert M. Knight, Jr.
Robert M. Knight, Jr.Executive Vice President – Finance andChief Financial Officer
89

Exhibit 32(a)
CERTIFICATION OF CHIEF EXECUTIVE OFFICER PURSUANT TO18 U.S.C. SECTION 1350,
AS ADOPTED PURSUANT TOSECTION 906 OF THE SARBANES-OXLEY ACT OF 2002
In connection with the accompanying Annual Report of Union Pacific Corporation (the Corporation) onForm 10-K for the period ending December 31, 2006, as filed with the Securities and Exchange Commission onthe date hereof (the Report), I, James R. Young, Chairman, President and Chief Executive Officer of theCorporation, certify, pursuant to 18 U.S.C. Section 1350, as adopted pursuant to Section 906 of the Sarbanes-Oxley Act of 2002, to the best of my knowledge, that:
(1) The Report fully complies with the requirements of Section 13(a) or 15(d) of the Securities ExchangeAct of 1934; and
(2) The information contained in the Report fairly presents, in all material respects, the financial conditionand results of operations of the Corporation.
By: /s/ James R. Young
James R. YoungChairman, President andChief Executive OfficerUnion Pacific Corporation
February 23, 2007
A signed original of this written statement required by Section 906 has been provided to the Corporation and willbe retained by the Corporation and furnished to the Securities and Exchange Commission or its staff uponrequest.
90

Exhibit 32(b)
CERTIFICATION OF CHIEF FINANCIAL OFFICER PURSUANT TO18 U.S.C. SECTION 1350,
AS ADOPTED PURSUANT TOSECTION 906 OF THE SARBANES-OXLEY ACT OF 2002
In connection with the accompanying Annual Report of Union Pacific Corporation (the Corporation) on Form10-K for the period ending December 31, 2006, as filed with the Securities and Exchange Commission on the datehereof (the Report), I, Robert M. Knight, Jr., Executive Vice President—Finance and Chief Financial Officer ofthe Corporation, certify, pursuant to 18 U.S.C. Section 1350, as adopted pursuant to Section 906 of the Sarbanes-Oxley Act of 2002, to the best of my knowledge, that:
(1) The Report fully complies with the requirements of Section 13(a) or 15(d) of the Securities ExchangeAct of 1934; and
(2) The information contained in the Report fairly presents, in all material respects, the financial conditionand results of operations of the Corporation.
By: /s/ Robert M. Knight, Jr.
Robert M. Knight, Jr.Executive Vice President – Finance andChief Financial OfficerUnion Pacific Corporation
February 23, 2007
A signed original of this written statement required by Section 906 has been provided to the Corporation and willbe retained by the Corporation and furnished to the Securities and Exchange Commission or its staff uponrequest.
91

dIRECtORS ANd ExECUtIVE OFFICERS
CORPORAtE HEAdqUARtERS
Union Pacific Corporation Union Pacific Railroad Company 1400 Douglas Street 1400 Douglas Street Omaha, NE 68179 Omaha, NE 68179 (402) 544-5000 www.up.com www.up.com
StOCk LIStING ANNUAL MEEtING OF SHAREHOLdERS
New York Stock Exchange (NYSE) May 3, 2007Ticker Symbol: UNP Little America Hotel 500 South Main Street Salt Lake City, UT
INFORMAtION SOURCES
The contact for media inquiries is Corporate Relations at (402) 544-3529. Institutional investors and financial analysts can contact Investor Relations at (402) 544-4227 or (877) 547-7261. Written inquiries for Corporate or Investor Relations can be directed to Union Pacific Corporation’s address listed above.
Individual shareholder questions should be directed to the Corporation’s Transfer Agent using the contact information above.
SEC FILINGS ANd OtHER CORPORAtE INFORMAtION
Union Pacific makes available free of charge on our Internet Web site at www.up.com/investors our annual reports on Form 10-K, our quarterly reports on Form 10-Q, our current reports on Form 8-K, our proxy statements, Forms 3, 4 and 5, filed on behalf of directors and executive officers, and amendments to such reports filed or furnished pursuant to the Securities Exchange Act of 1934, as amended, as soon as reasonably practicable after such material is electronically filed with, or furnished to, the Securities and Exchange Commission (SEC). We also make available on our Web site previously filed SEC reports and exhibits via a link to
“EDGAR” on the SEC’s Internet site at www.sec.gov. Additionally, our corporate governance materials (including By-Laws, Board Committee charters, governance guidelines and policies, and codes of conduct and ethics for directors, officers and employees), news releases, investor fact books and other general information about Union Pacific are available on our Web site. From time to time, the corporate governance materials on our Web site may be updated as necessary to comply with rules issued by the SEC and NYSE or as desirable to promote the effective and efficient governance of our Company.
Copies of Union Pacific’s 2006 Annual Report/Form 10-K and other corporate materials also are available, without charge, by writing to:
SecretaryUnion Pacific Corporation1400 Douglas Street, 19th FloorOmaha, NE 68179
tRANSFER AGENt ANd REGIStRAR OF StOCk
Computershare Investor Services, LLC
For U.S. Mail: For Express Service Delivery:P.O. Box 43036 250 Royall Street, Mail Stop 1AProvidence, RI 02940 Canton, MA 02021
Most questions regarding your account may be answered by contacting the automated Computershare Investor Services Help Line at (800) 317-2512 from your touch-tone phone, 24 hours a day, 7 days a week. Service representatives are available on the Help Line from 8 a.m. to 5 p.m. Central Time, Monday through Friday. You may also write to Computershare at the appropriate address above, or you may contact Computershare online at www.computershare.com.
CORPORAtE INFORMAtION

