lexmark 4 q15 earnings presentation
TRANSCRIPT

Earnings Presentation
February 23, 2016
Fourth Quarter and Full Year 2015

The contents of this presentation that are not statements of historical fact are
forward-looking statements and involve risks and uncertainties that are discussed in
the Safe Harbor section of our earnings releases and SEC filings. Actual results
may differ materially from such statements. Lexmark undertakes no obligation to
update any forward-looking statements.
This presentation contains non-GAAP financial measures, unless otherwise noted.
Lexmark has provided reconciliations of GAAP to non-GAAP financial measures
and a discussion of management’s use of non-GAAP financial measures on its
investor relations website located at http://investor.lexmark.com.
Safe Harbor Statement
© Lexmark International, Inc. All rights reserved. 2

Key Points Solid Financial Results1,2
Fourth quarter revenue in line with guidance
Strong fourth quarter Enterprise Software (ES) operating income margin of 24%
Fourth quarter EPS exceeded October guidance range
Full year Core revenue (Laser + ES) grew 6% at constant currency
16th consecutive year of MPS revenue growth, grew 7% at constant currency
Strategic Alternatives Process Progressing
Positive interest in strategic alternatives process, continuing evaluation
Focused on execution and our commitment to customers, partners, suppliers and
employees while unlocking shareholder value
Demonstrated ongoing commitment to shareholders with 18th consecutive quarterly
dividend announced recently
2016 Restructuring Program Expected to Generate ~$100M Annualized Pretax Savings
2016 restructuring program focused on optimizing the ISS structure, primarily as a result of
the continued strong U.S. dollar, aligned with the previously announced strategic
alternatives process
Next Generation Color Lasers Announced
Next generation of color lasers and smart MFPs optimized for MPS and business process
solutions; integrated with Kofax Onboarding Agility, which automates and streamlines new
customer onboarding processes
3 © Lexmark International, Inc. All rights reserved.
1) Non-GAAP, numbers rounded
2) Constant currency calculated adjusting current year and prior year results to remove estimated currency rate impacts and related hedge gains or losses

Core revenue grew 2% at constant currency2
Higher Value Solutions revenue (MPS + Enterprise Software) grew 19%
Enterprise Software revenue grew $75M, operating income increased $31M
Achieved $500M revenue target one year early
Segment operating income margin percentage more than doubled to 24%
Nearly achieved 25% target3 one year early
Subscriptions and maintenance revenue grew 22% and 97%, respectively,
supporting annuity revenue base
Deferred software revenue grew 61%, annualized subscription value grew 24%
MPS constant currency growth more than offset by currency and Non-MPS
hardware/supplies softness
MPS revenue of $233M, second highest reported quarter
Generated free cash flow of $75M
Paid 17th consecutive quarterly dividend of $22M
Fourth Quarter Financial Highlights1
4 © Lexmark International, Inc. All rights reserved.
1) Non-GAAP, numbers rounded
2) Constant currency calculated adjusting current year and prior year results to remove estimated currency rate impacts and related hedge gains or losses
3) 2016 Enterprise Software operating income exit rate target of 25%

Higher Value Solutions Revenue Growing*
5
Q1 Q2 Q3 Q4 Q1 Q2 Q3 Q4 Q1 Q2 Q3 Q4 Q1 Q2 Q3 Q4 Q1 Q2 Q3 Q4
Q1 Q2 Q3 Q4 Q1 Q2 Q3 Q4 Q1 Q2 Q3 Q4 Q1 Q2 Q3 Q4 Q1 Q2 Q3 Q4
Enterprise Software
16
Consecutive Years
of Revenue Growth
~$700M Revenue Run Rate
& Expanding Margin
Managed Print Services
2011 2012 2013 2014 2015
* Non-GAAP, in millions, totals may not foot due to rounding, numbers rounded
4Q14 4Q15
$407 $341
4Q Higher Value Solutions Revenue Higher Value Solutions Revenue
% of Total Revenue 33% 41%
2011 2012 2013 2014 2015
Enterprise
Software
MPS ~$1.4B Enterprise
Software
Managed Print
Services
19% Higher Value Solutions
Revenue Growth
Full Year 2015
© Lexmark International, Inc. All rights reserved.

Enterprise Software Tracking to Target*
$162
$239
$313
$579
2012 2013 2014 2015
Revenue
*Non-GAAP, in $ Millions, numbers rounded
-15%
-1% 5%
2013 2014 2015
Operating Income Margin
2012
6 © Lexmark International, Inc. All rights reserved.
2016 Exit Rate
Target: 25% 2016 Target: $500 ~24%
2015 Exit Rate
19%
~$700 2015 Exit Run Rate

Lexmark Financial Summary1
1) Non-GAAP, totals may not foot due to rounding, in millions unless otherwise noted
2) Core revenue includes Enterprise Software, MPS, and Non-MPS and excludes Inkjet Exit revenue
3) 4Q14 and FY14 YTD revised for income tax accounting revisions. See footnote slide for additional information.
Revenue $982 -5% +13% $3,596 -4%
Core2 Revenue $953 -2% +14% $3,454 0%
Gross Profit Margin 42.6% +3.7 pts +1.8 pts 42.0% +1.8 pts
Operating Expense $304 +$13 +$14 $1,156 +$53
Operating Income $114 +$4 +$50 $354 -$42
Operating Income Margin 11.6% +0.9 pts +4.2 pts 9.8% -0.8 pts
EBITDA $156 +$3 +$52 $521 -$52
EBITDA Margin 15.9% +1.1 pts +3.9 pts 14.5% -0.9 pts
Net Earnings $72 +$2 +$37 $218 -$35
EPS $1.16 +$0.023 +$0.59 $3.53 -$0.463
4Q15 YTY SEQ FY15 YTY
© Lexmark International, Inc. All rights reserved. 7

Segment Financial Summaries*
*Non-GAAP, totals may not foot due to rounding, in millions unless otherwise noted
Revenue $808 -13 % +15 % $3,017 -12 %
Laser $779 -11 % +16 % $2,875 -9 %
MPS $233 -4 % +12 % $828 +1 %
Non-MPS $547 -14 % +18 % $2,047 -12 %
Inkjet Exit $29 -50 % -7 % $143 -44 %
Gross Profit Margin 37.0 % +0.3 pts +2.5 pts 37.2 % -1.3 pts
Operating Expense $147 -$22 +$6 $586 -$65
R&D $50 -$8 +$3 $201 -$24
SG&A $97 -$13 +$3 $385 -$41
Operating Income $152 -$22 +$51 $538 -$126
Operating Income Margin 18.8 % +0.2 pts +4.4 pts 17.8 % -1.6 pts
Perceptive Software 2Q14 YTY SEQ Enterprise Software 4Q15 YTY SEQ FY15 YTY
ISS 4Q15 YTY SEQ FY15 YTY
Revenue $174 +75 % +5 % $579 +85 %
Licenses $55 +112 % +28 % $170 +110 %
Subscriptions $13 +22 % -10 % $49 +56 %
Maintenance $74 +97 % +1 % $237 +99 %
Professional Services / Other $31 +26 % -7 % $122 +50 %
Gross Profit Margin 74.5 % +7.4 pts +1.0 pts 72.7 % +3.1 pts
Operating Expense $88 +$32 -$3 $311 +$107
R&D $24 +$6 -$3 $92 +$20
SG&A $64 +$26 -$1 $218 +$88
Operating Income $42 +$31 +$12 $110 +$95
Operating Income Margin 23.9 % +13.2 pts +5.7 pts 19.0 % +14.4 pts
© Lexmark International, Inc. All rights reserved. 8

Revenue1
Total $982 +13% -5% 0% $3,596 -4% +2%
Core2 $953 +14% -2% +2% $3,454 0% +6%
Enterprise Software $174 +5% +75% +83% $579 +85% +93%
Laser $779 +16% -11% -7% $2,875 -9% -3%
Higher Value Solutions3 $407 +9% +19% +26% $1,407 +24% +32%
Enterprise Software $174 +5% +75% +83% $579 +85% +93%
MPS $233 +12% -4% +1% $828 +1% +7%
Inkjet Exit $29 -7% -50% -48% $143 -44% -42%
Geographic
U.S. $455 +9% +2% +2% $1,668 +4% +4%
EMEA $367 +28% -7% -1% $1,280 -7% +2%
Rest of World $160 -2% -15% -4% $648 -12% 0%
4Q15 SEQ YTY YTY CC4 FY15 YTY YTY CC4
• Total full year revenue grew 2% at constant currency4 YTY
• Full year Core revenue grew 6% at constant currency YTY
• Full year Higher Value Solutions revenue at constant currency grew 32%, comprised of
93% growth in Enterprise Software and 7% growth in MPS
• Worldwide laser supplies channel inventory within 6 to 10 weeks target range
1) Non-GAAP, totals may not foot due to rounding, in millions unless otherwise noted, numbers rounded
2) Core revenue includes Enterprise Software, MPS, and Non-MPS revenue and excludes Inkjet Exit revenue
3) Higher Value revenue includes Enterprise Software and MPS
4) Constant currency calculated adjusting current year and prior year results to remove estimated currency rate impacts and related hedge gains or losses
© Lexmark International, Inc. All rights reserved. 9

Product Revenue1
Laser Hardware -11% -18% +8%
Large Workgroup -8% -10% +3%
Small Workgroup -29% -29% 0%
4Q15 YTY Rev Units AUR
© Lexmark International, Inc. All rights reserved. 10
Total $982 -5% +13% $3,596 -4%
Hardware2 $210 -11% +27% $706 -10% Large Workgroup5 $183 -8% +29% $602 -8%
Small Workgroup6 $25 -29% +15% $94 -23%
Other $2 -24% +29% $9 +7%
Supplies3 $551 -15% +12% $2,129 -13% Laser $522 -11% +13% $1,986 -9%
Inkjet Exit $29 -50% -7% $142 -45%
Software & Other4 $221 +48% +5% $762 +53% Software $156 +53% +5% $536 +71%
Other $65 +38% +7% $226 +25%
4Q15 YTY SEQ FY15 YTY Comments
Laser Hardware -10% -12% +2%
Large Workgroup -8% -6% -2%
Small Workgroup -23% -20% -4%
FY15 YTY Rev Units AUR
4Q15 FY15
Enterprise Software +75% +85%
1) Non-GAAP, totals may not foot due to rounding, in millions unless otherwise noted, numbers rounded
2) Includes laser, inkjet, and dot matrix hardware, associated features sold on a unit basis or through a managed service agreement and miscellaneous non-printing hardware related to a software solution
3) Includes laser, inkjet, and dot matrix supplies and associated supplies services sold on a unit basis or through a managed service agreement
4) Includes parts and service related to hardware maintenance and includes software licenses and the associated software maintenance services sold on a unit basis or as a subscription service
5) Includes departmental, large workgroup, and medium workgroup lasers, dot matrix printers and features
6) Includes small workgroup lasers and personal lasers
$3.6B Total
Revenue
Supplies
Hardware
Software & Other
$2.9B Laser
Revenue
Laser Supplies
FY15
$0.6B Enterprise
Software Subscriptions
Maintenance Licenses
Professional Services & Other Laser Hardware

Gross Profit Margin*
11
4Q gross profit margin improved 370 bps YTY driven by increased mix of
Enterprise Software
Enterprise Software gross profit margin increased 740 bps, primarily driven by the
addition of Kofax
ISS gross profit margin increased 30 bps, primarily driven by improved hardware
margins
• 4Q gross profit margin increased 180 bps sequentially, driven by ISS
Sequential growth in ISS gross profit margin primarily driven by higher hardware and
supplies margin
Enterprise Software gross profit margin increased 100 bps, primarily driven by
favorable product mix
Total 42.6% +370 bps +180 bps 42.0% +180 bps
Enterprise Software 74.5% +740 bps +100 bps 72.7% +310 bps
ISS 37.0% +30 bps +250 bps 37.2% -130 bps
4Q15 YTY SEQ FY15 YTY
* Non-GAAP, totals may not foot due to rounding, in millions unless otherwise noted
© Lexmark International, Inc. All rights reserved.

Operating Expense1
1) Non-GAAP, totals may not foot due to rounding, in millions unless otherwise noted
2) All Other expenses are for corporate functions including IT, finance, human resources, facilities, legal, corporate staff, and total company equity compensation
4Q15 YTY SEQ FY15 YTY
Total $304 +$13 +$14 $1,156 +$53 Enterprise Software $88 +$32 -$3 $311 +$107
ISS $147 -$22 +$6 $586 -$65
All Other2 $69 +$3 +$11 $260 +$10
R&D $81 -$4 $0 $325 -$8 Enterprise Software $24 +$6 -$3 $92 +$20
ISS $50 -$8 +$3 $201 -$24
All Other $7 -$1 -$1 $31 -$4
SG&A $224 +$18 +$14 $832 +$61 Enterprise Software $64 +$26 -$1 $218 +$88
ISS $97 -$13 +$3 $385 -$41
All Other $62 +$4 +$12 $228 +$14
• Disciplined cost and expense management, restructuring and lowered performance-based
compensation helped mitigate expense growth YTY
© Lexmark International, Inc. All rights reserved. 12
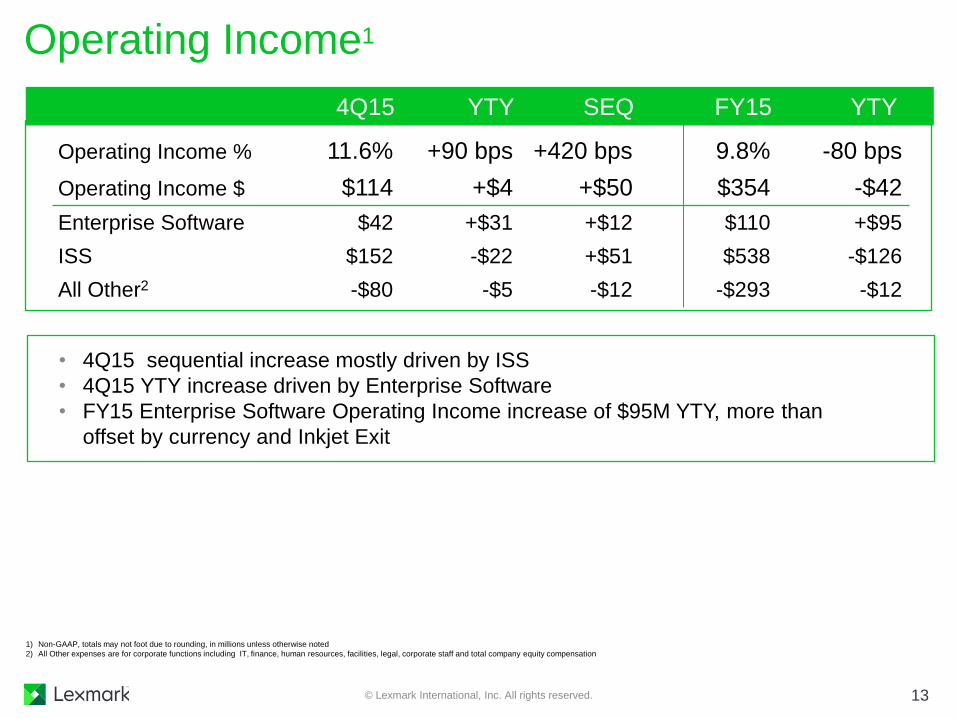
Operating Income1
• 4Q15 sequential increase mostly driven by ISS
• 4Q15 YTY increase driven by Enterprise Software
• FY15 Enterprise Software Operating Income increase of $95M YTY, more than
offset by currency and Inkjet Exit
Operating Income % 11.6% +90 bps +420 bps 9.8% -80 bps
Operating Income $ $114 +$4 +$50 $354 -$42
Enterprise Software $42 +$31 +$12 $110 +$95
ISS $152 -$22 +$51 $538 -$126
All Other2 -$80 -$5 -$12 -$293 -$12
4Q15 YTY SEQ FY15 YTY
© Lexmark International, Inc. All rights reserved. 13
1) Non-GAAP, totals may not foot due to rounding, in millions unless otherwise noted
2) All Other expenses are for corporate functions including IT, finance, human resources, facilities, legal, corporate staff and total company equity compensation

Currency headwind of ~$0.28 per share and ~$1.53 per share year to year in
4Q15 and FY15, respectively
Earnings1
14
1. Non-GAAP, totals may not foot due to rounding, EBITDA, net earnings and average diluted shares outstanding in millions, numbers rounded
2. Adjusted EBITDA defined as net earnings plus net interest expense (income), provision for income taxes, depreciation and amortization, excluding restructuring charges and project costs, acquisition and divestiture related adjustments, pension plan
actuarial gains or losses, and remediation-related adjustments
3. 4Q14 and FY14 revised for income tax accounting revisions. See footnote slide for additional information
EBITDA2 $156 +$3 +$52 $521 -$52
Net Earnings3 $72 +$2 +$37 $218 -$35
EPS3 $1.16 +$0.02 +$0.59 $3.53 -$0.46
Avg. diluted shares outstanding 61.9 +0.3 +0.2 61.6 -1.6
4Q15 YTY SEQ FY15 YTY
© Lexmark International, Inc. All rights reserved.

4Q15 EPS Guidance Midpoint $1.10
Operational Performance +0.06
4Q15 EPS $1.16
4Q14 EPS2 $1.14
Operational Performance +0.32
Approximate Currency Impact -0.28
Non-Operational Items -0.02
4Q15 EPS $1.16
+ Enterprise Software improvement
+ Laser improvement
+ Belgium copyright levy accrual release ($5M)
- Inkjet Exit decline
4Q15 Guidance vs. Actual
4Q15 EPS Overview1
1) Non-GAAP, numbers rounded
2) FY14 EPS revised for income tax accounting revisions. See footnote slide for additional information
4Q14 vs. 4Q15
© Lexmark International, Inc. All rights reserved. 15
+ Belgium copyright levy accrual release ($5M)
+ Laser performance
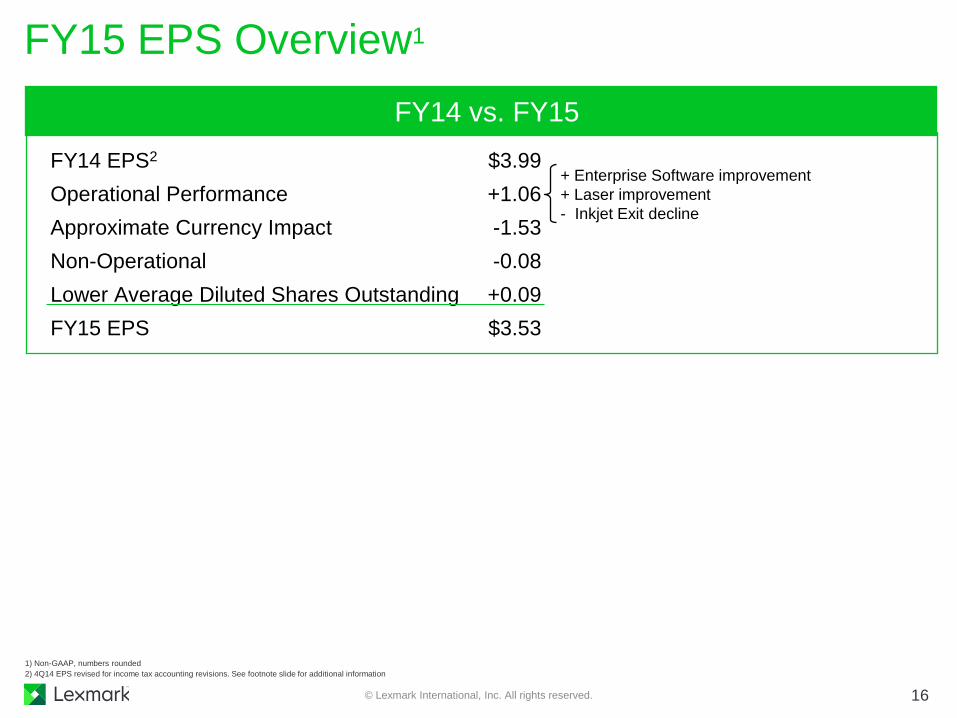
FY14 EPS2 $3.99
Operational Performance +1.06
Approximate Currency Impact -1.53
Non-Operational -0.08
Lower Average Diluted Shares Outstanding +0.09
FY15 EPS $3.53
+ Enterprise Software improvement
+ Laser improvement
- Inkjet Exit decline
FY15 EPS Overview1
1) Non-GAAP, numbers rounded
2) 4Q14 EPS revised for income tax accounting revisions. See footnote slide for additional information
FY14 vs. FY15
© Lexmark International, Inc. All rights reserved. 16

Balance Sheet and Cash Flow1
1) GAAP, totals may not foot due to rounding, in millions unless otherwise noted, numbers rounded
2) Includes current short-term marketable securities
3) Net cash provided by operating activities
4) Free cash flow = cash from operations – capital expenditures + proceeds from the sale of fixed assets
5) Includes non-GAAP adjustments of approximately $38 million
6) Long Term Bonds of $700 million, net of unamortized debt issuance cost and original issue discount
• Generated Cash from Operations of $103M in the fourth quarter
• Credit facilities include $500M Revolver, $100M Uncommitted Facility, $125M A/R Program
• Maintaining an Investment Grade Debt Rating
Credit Facilities $364
Long Term Bonds6 $697
Total Debt $1,061
Highlights
Cash Conversion Days
Debt
Dec. 31, 2015
Cash2 $158
U.S. Cash $50
Non-U.S. Cash $108
Net cash / (debt) ($903)
4Q15 Cash Flow
Cash from Operations3 $103
Free Cash Flow4 $75
Depreciation & Amortization5 $80
Capital Expenditures -$29
Cash Flow Impact
Accounts Receivable +$8
Inventory +$26
Accounts Payable +$23
Balance Sheet & 4Q15 Cash Flow
© Lexmark International, Inc. All rights reserved. 17
4Q14 1Q15 2Q15 3Q15 4Q15
Receivables 37 42 47 47 40
Inventory 34 44 48 44 36
Payables 72 92 85 81 77
Cash
Conversion (1) (6) 10 9 (1)

As previously announced, Lexmark’s Board of Directors has authorized the exploration of strategic alternatives to enhance shareholder value and unlock the intrinsic value created by the company
On the company’s third quarter 2015 earnings call, Lexmark indicated that these alternatives could include a sale of the entire company or spin-off of a portion of the company to either strategic or financial buyers
Lexmark is very pleased with both the progress and positive interest in the company’s strategic alternatives process, and is continuing its evaluation
Given the ongoing exploration of strategic alternatives, the company is not providing guidance, will not host a conference call with securities analysts and investors in conjunction with today’s earnings release, and is remaining in its quiet period
Lexmark does not intend to comment on the exploration process or disclose further developments until the Board approves a specific transaction or otherwise concludes the exploration of strategic alternatives. No assurance can be given of the outcome of the strategic alternatives review process, including whether any transaction will result or the associated timing or terms
During this process, Lexmark remains squarely focused on the execution of its strategy, commitment to its customers, partners, suppliers and employees and driving value for our shareholders
Positive Interest in Strategic Alternatives Process
18 © Lexmark International, Inc. All rights reserved.

Restructuring Summary
19 © Lexmark International, Inc. All rights reserved.
Charges Cash Cost3
FY15 $40 $0
FY16 $25 $59
Total Program $65 $59
1) Restructuring-related charges for 2016 actions and related project costs only, in millions unless otherwise noted
2) Restructuring-related charges for July 2015 actions and related project costs only, in millions unless otherwise noted
3) Cash restructuring charges are estimates based on timing of related activities
4) Beginning in FY17, estimated allocation of 90% operating expense / 10% cost of goods sold
2016
Program1 Cash Savings
FY16 $67
FY17 & Ongoing Annual4 $100
Charges Cash Cost3
FY15 $36 $8
FY16 $19 $47
Total Program $55 $55 2015
Program2
Cash Savings
FY15 $2
FY16 $55
FY17 & Ongoing Annual4 $65

• Revenue trends
• Deferred software revenue and annualized subscription value
• Deferred software revenue trend by quarter
• Outstanding shares / dividends
• Currency
Supplemental Materials
© Lexmark International, Inc. All rights reserved. 20

Revenue Trends1
1) Non-GAAP, totals may not foot due to rounding, in millions unless otherwise noted. Periodic modifications to category definitions may change previously stated values
2) Includes laser, inkjet, and dot matrix hardware, and associated features sold on a unit basis or through a managed service agreement
3) Includes laser, inkjet, and dot matrix supplies and associated supplies services sold on a unit basis or through a managed service agreement
4) Includes departmental, large workgroup, and medium workgroup lasers, dot matrix printers and options
5) Includes small workgroup lasers and personal lasers
6) Includes miscellaneous non-printing revenue related to a software solution
7) Includes software licenses and the associated software maintenance services sold on a unit basis or as a subscription service
8) Includes parts and service related to hardware maintenance
© Lexmark International, Inc. All rights reserved. 21
Revenue Trends1
($M) 1Q13 2Q13 3Q13 4Q13 1Q14 2Q14 3Q14 4Q14 1Q15 2Q15 3Q15 4Q15 FY 2013 FY 2014 FY 2015
Geography 886 890 896 1,011 881 894 921 1,032 855 891 868 982 3,684 3,728 3,596
US 377 386 401 424 383 373 406 448 386 409 418 455 1,589 1,610 1,668
EMEA 335 325 311 386 316 341 332 394 309 318 287 367 1,357 1,382 1,280
Rest of World 174 179 183 201 183 180 183 189 161 164 163 160 737 735 648
Segment 886 890 896 1,011 881 894 921 1,032 855 891 868 982 3,684 3,728 3,596
ISS 840 828 837 939 817 830 835 933 766 740 703 808 3,444 3,415 3,017
Laser 718 729 753 839 744 764 775 875 718 706 672 779 3,039 3,158 2,875
MPS 160 170 184 208 180 195 205 242 185 203 207 233 722 821 828
Non MPS 558 559 569 631 565 569 570 633 533 503 465 547 2,317 2,337 2,047
Inkjet Exit 122 99 84 100 73 67 60 58 48 35 31 29 405 257 143
Enterprise Software 46 62 59 72 64 64 86 99 90 150 165 174 239 313 579
Licenses 13 24 17 23 16 15 24 26 19 53 43 55 78 81 170
Subscriptions 5 3 5 5 6 6 9 11 10 12 14 13 18 32 49
Maintenance 17 19 19 24 24 25 32 38 36 52 74 74 79 119 237
Professional Services / Other 6 11 16 17 19 18 17 22 25 24 33 33 31 64 81 122
Product 886 890 896 1,011 881 894 921 1,032 855 891 868 982 3,684 3,728 3,596
Hardware 2 181 171 182 228 167 183 196 236 152 179 165 210 763 782 706
Large Workgroup 4 149 139 153 190 137 151 164 199 127 149 142 183 631 651 602
Small Workgroup 5 29 30 28 36 27 30 31 35 23 25 22 25 124 123 94
Other 6 0 1 1 2 2 2 2 2 2 4 1 2 4 9 9
Inkjet Exit 2 1 0 0 0 0 0 0 0 0 0 0 4 0 0
Supplies 3 609 608 606 661 605 602 593 646 568 517 493 551 2,484 2,446 2,129
Laser 490 510 522 562 532 535 533 589 520 482 461 522 2,083 2,189 1,986
Inkjet Exit 120 98 84 100 73 67 60 58 48 35 31 29 401 257 142
Software & Other 97 111 107 122 109 109 132 150 135 195 210 221 436 500 762
Software 7 54 67 64 77 66 66 88 102 87 144 149 156 262 322 536
Other 843 44 43 45 43 43 44 47 48 51 61 65 175 178 226

$133
$214
4Q14 4Q15
Growing Enterprise Software Revenue Base*
4Q14 4Q15
YTY
+24%
Annualized Subscription Contract Value
Forward 12 Months Value
YTY
+61%
Deferred Software Revenue
$57
$46
* Non-GAAP, totals may not foot due to rounding, in millions unless otherwise noted, numbers rounded
© Lexmark International, Inc. All rights reserved. 22

Deferred Software Revenue Trend*
GAAP Non-GAAP
1Q14 $88 $96
2Q14 $90 $96
3Q14 $104 $123
4Q14 $117 $133
1Q15 $118 $130
2Q15 $178 $226
3Q15 $175 $206
4Q15 $197 $214
* In millions
© Lexmark International, Inc. All rights reserved. 23

Outstanding Shares / Dividends
Actual Diluted
Period Ending Average
4Q15 61.9 61.9
3Q15 61.8 61.7
2Q15 61.6 61.5
1Q15 61.3 62.4
4Q14 61.3 61.6
FY15 61.9 61.6
FY14 61.3 63.2
FY13 62.0 64.1
FY12 63.9 69.5
FY11 71.4 77.9
Declaration Record Payment
Date Date Date
02/18/16 02/29/16 03/11/16
04/21/16 06/03/16 06/17/16
07/21/16 09/02/16 09/16/16
10/20/16 12/02/16 12/16/16
Outstanding Share Counts1 Anticipated Dividend Schedule2
1) Millions
2) Future quarterly dividend payments subject to Board of Directors’ approval
© Lexmark International, Inc. All rights reserved. 24
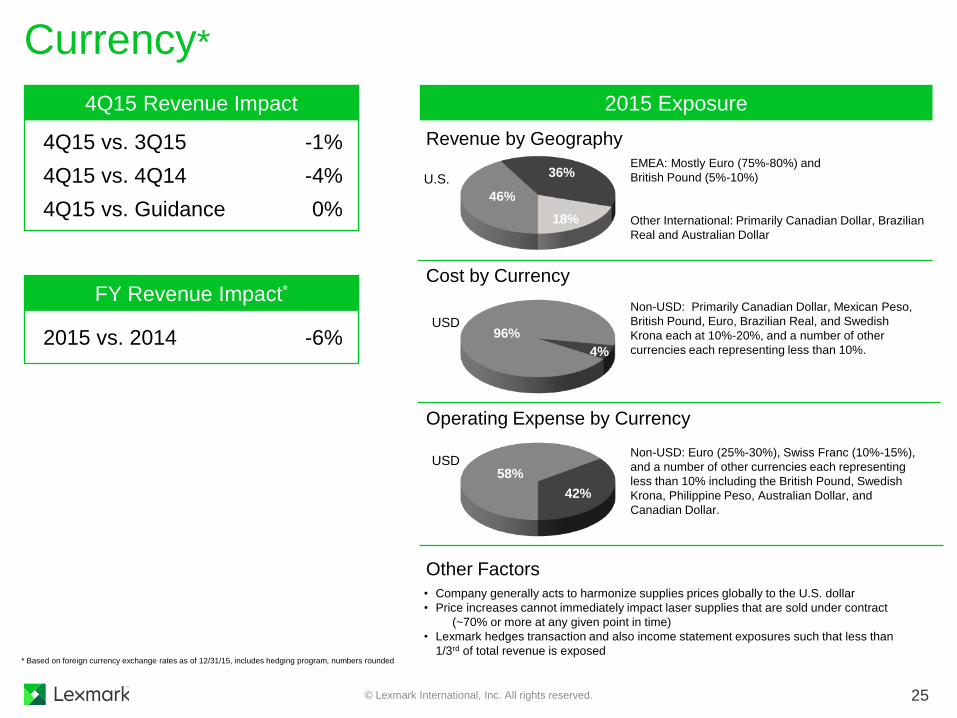
Currency*
* Based on foreign currency exchange rates as of 12/31/15, includes hedging program, numbers rounded
Revenue by Geography
58%
42%
EMEA: Mostly Euro (75%-80%) and
British Pound (5%-10%)
Other International: Primarily Canadian Dollar, Brazilian
Real and Australian Dollar
Cost by Currency
Non-USD: Primarily Canadian Dollar, Mexican Peso,
British Pound, Euro, Brazilian Real, and Swedish
Krona each at 10%-20%, and a number of other
currencies each representing less than 10%.
Operating Expense by Currency
Non-USD: Euro (25%-30%), Swiss Franc (10%-15%),
and a number of other currencies each representing
less than 10% including the British Pound, Swedish
Krona, Philippine Peso, Australian Dollar, and
Canadian Dollar.
Other Factors
• Company generally acts to harmonize supplies prices globally to the U.S. dollar
• Price increases cannot immediately impact laser supplies that are sold under contract
(~70% or more at any given point in time)
• Lexmark hedges transaction and also income statement exposures such that less than
1/3rd of total revenue is exposed
96%
4%
46%
18%
36%
4Q15 vs. 3Q15 -1%
4Q15 vs. 4Q14 -4%
4Q15 vs. Guidance 0%
2015 vs. 2014 -6%
4Q15 Revenue Impact
FY Revenue Impact*
USD
U.S.
USD
2015 Exposure
© Lexmark International, Inc. All rights reserved. 25

Footnotes Slide
© Lexmark International, Inc. All rights reserved. 26
. As reported in Lexmark’s 2014 Annual Report on Form 10-K, Lexmark identified a material weakness in accounting for income taxes. As part of the
company’s continued income tax accounting remediation efforts, tax revisions have been made to correct errors for prior fiscal periods. Revisions
to GAAP EPS were as follows: 3Q14 EPS of -0.05, 4Q14 EPS of +0.05, and Full Year 2014 of +0.01. Revisions to non-GAAP EPS were as follows:
3Q14 EPS of -0.09, 4Q14 EPS of +0.03, and Full Year 2014 of -0.05. All tax revisions made for prior annual periods will be reported in the
company’s annual report on Form 10-K for the period ended December 31, 2015.

© Lexmark International, Inc. All rights reserved. 27