3 q15 earnings presentation final
TRANSCRIPT

2015 Third Quarter Earnings PresentationNYSE: DOOR
November 5, 2015

2
Safe Harbor / Non-GAAP Financial Measure
SAFE HARBOR / FORWARD LOOKING STATEMENT
This investor presentation contains forward-looking information and other forward-looking statements within the meaning of applicable Canadian and/or U.S. securities laws, including our
discussion of improvements in the housing market and related markets and the effects of our pricing and other strategies. When used in this Investor Presentation, such forward-looking
statements may be identified by the use of such words as “may,” might, “could,” “will,” would,” “should,” “expect,” “believes,” “outlook,” “predict,” “forecast,” “objective,” “remain,”
“anticipate,” “estimate,” “potential,” “continue,” “plan,” “project,” “targeting,” or the negative of these terms or other similar terminology.
Forward-looking statements involve significant known and unknown risks, uncertainties and other factors that may cause the actual results, performance or achievements of Masonite, or
industry results, to be materially different from any future plans, goals, targets, objectives, results, performance or achievements expressed or implied by such forward-looking statements.
As a result, such forward-looking statements should not be read as guarantees of future performance or results, should not be unduly relied upon, and will not necessarily be accurate
indications of whether or not such results will be achieved. Factors that could cause actual results to differ materially from the results discussed in the forward-looking statements include,
but are not limited to, our ability to successfully implement our business strategy; general economic, market and business conditions; levels of residential new construction, residential
repair, renovation and remodeling and non-residential building construction activity; competition; our ability to manage our operations including integrating our recent acquisitions and
companies or assets we acquire in the future; our ability to generate sufficient cash flows to fund our capital expenditure requirements and to meet our debt service obligations, including
our obligations under our senior notes and our senior secured asset-backed credit facility; labor relations (i.e., disruptions, strikes or work stoppages), labor costs, and availability of labor;
increases in the costs of raw materials or any shortage in supplies; our ability to keep pace with technological developments; the actions by, and the continued success of, certain key
customers; our ability to maintain relationships with certain customers; new contractual commitments; our ability to generate the benefits of our restructuring activities; retention of key
management personnel; environmental and other government regulations; limitations on operating our business as a result of covenant restrictions under our existing and future
indebtedness, including our senior notes and senior secured asset-based credit facility; and other factors publicly disclosed by the company from time to time.
NON-GAAP FINANCIAL MEASURE
Adjusted EBITDA is a measure used by management to measure operating performance. Beginning in the first quarter of 2015, we revised our calculation of Adjusted EBITDA to
separately exclude loss on extinguishment of debt, which would be a component of other expense (income), net, but is separately stated due to its magnitude. Furthermore, in the third
quarter of 2015, we revised our calculation of Adjusted EBITDA to separately exclude loss (gain) on disposal of subsidiaries. The revisions to this definition had no impact on our reported
Adjusted EBITDA for the three or nine months ended September 28, 2014. As revised, Adjusted EBITDA is defined as net income (loss) attributable to Masonite plus depreciation,
amortization, restructuring costs, loss (gain) on sale of property, plant and equipment, asset impairment, loss (gain) on disposal of subsidiaries, registration and listing fees, interest
expense, net, loss on extinguishment of debt, other expense (income), net, income tax expense (benefit), loss (income) from discontinued operations, net of tax, net income attributable to
non-controlling interest and share based compensation expense. Adjusted EBITDA is not a measure of financial condition or profitability under GAAP, and should not be considered as an
alternative to (i) net income (loss) or net income (loss) attributable to Masonite determined in accordance with GAAP or (ii) operating cash flow determined in accordance with GAAP.
Additionally, Adjusted EBITDA is not intended to be a measure of free cash flow for management's discretionary use, as it does not include certain cash requirements such as interest
payments, tax payments and debt service requirements. We believe that the inclusion of Adjusted EBITDA in this press release is appropriate to provide additional information to investors
about our operating performance. Not all companies use identical calculations, and as a result, this presentation of Adjusted EBITDA may not be comparable to other similarly titled
measures of other companies. Moreover, Adjusted EBITDA as presented for financial reporting purposes herein, although similar, is not the same as similar terms in the applicable
covenants in our ABL Facility or our senior notes. Adjusted EBITDA, as calculated under our ABL Facility or senior notes would also include, among other things, additional add-backs for
amounts related to: cost savings projected by us in good faith to be realized as a result of actions taken or expected to be taken prior to or during the relevant period; fees and expenses
in connection with certain plant closures and layoffs; and the amount of any restructuring charges, integration costs or other business optimization expenses or reserve deducted in the
relevant period in computing consolidated net income, including any one-time costs incurred in connection with acquisitions. A reconciliation of Adjusted EBITDA to net income (loss)
attributable to Masonite for the periods indicated is set forth in the appendix to this presentation.

① Company / Industry Update
② Q3’15 Financial Review
③ Summary / Q&A
4
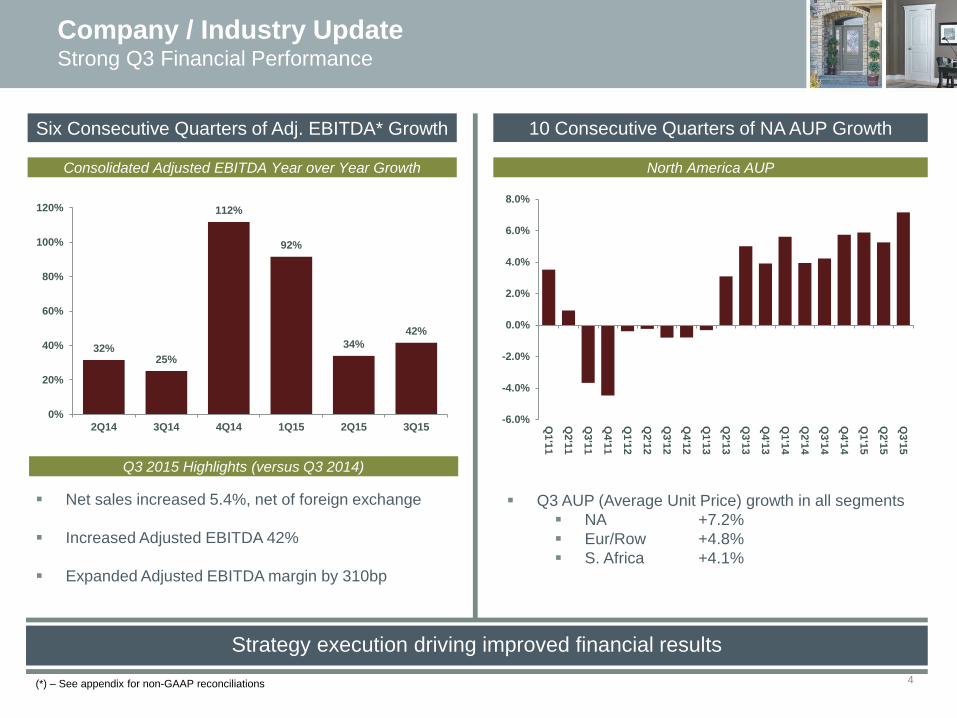
Company / Industry UpdateStrong Q3 Financial Performance
Strategy execution driving improved financial results
Six Consecutive Quarters of Adj. EBITDA* Growth
Net sales increased 5.4%, net of foreign exchange
Increased Adjusted EBITDA 42%
Expanded Adjusted EBITDA margin by 310bp
10 Consecutive Quarters of NA AUP Growth
(*) – See appendix for non-GAAP reconciliations
-6.0%
-4.0%
-2.0%
0.0%
2.0%
4.0%
6.0%
8.0%
Q1'1
1
Q2'1
1
Q3'1
1
Q4'1
1
Q1'1
2
Q2'1
2
Q3'1
2
Q4'1
2
Q1'1
3
Q2'1
3
Q3'1
3
Q4'1
3
Q1'1
4
Q2'1
4
Q3'1
4
Q4'1
4
Q1'1
5
Q2'1
5
Q3'1
5
Q3 AUP (Average Unit Price) growth in all segments
NA +7.2%
Eur/Row +4.8%
S. Africa +4.1%
North America AUP
32%25%
112%
92%
34%
42%
0%
20%
40%
60%
80%
100%
120%
2Q14 3Q14 4Q14 1Q15 2Q15 3Q15
Consolidated Adjusted EBITDA Year over Year Growth
Q3 2015 Highlights (versus Q3 2014)

5
Demonstrated improvement through strategic focus
Company / Industry UpdateOur Strategy Is Working
Adjusted EBITDA* Growth Outpacing Net Sales and Volume^ Growth
(in millions)
(*) – See appendix for non-GAAP reconciliations
(^) – Does not include Africa segment, PDS or National Hickman. Includes only 1 month of France in Q3’15.
(#) – Net of $72.5 million of negative foreign exchange in 2015
2010 – Q3’15
Growth
129%
13%
Adj. EBITDA Door volumeTTM
$80.7 $82.0
$97.3
$105.9
$137.1
$185.1
28.8 29.0 30.7 31.6 32.8 32.6 32.4
$1,383.3$1,489.2
$1,676.0 $1,731.1$1,837.7 $1,836.1 $1,835.5
$0
$500
$1,000
$1,500
$2,000
$2,500
$3,000
$3,500
$4,000
0
20
40
60
80
100
120
140
160
180
200
2010 2011 2012 2013 2014 Q3'15
33%
Net sales
38%$1,908.0#

6
Company / Industry UpdatePortfolio Optimization - Europe
Value creation through a superior product and service proposition
Recent Developments
Over the past four months:
Divested door business in France
Acquired PDS (UK)
Acquired National Hickman (UK)
Transformed European Business
Install solutions directly to homebuilders
Custom doors, specialized sectors

7
Company / Industry UpdateEuropean Adj. EBITDA Progression
Portfolio Optimization has transformed our European business
Europe/ROW Is Contributing More Adj. EBITDA* To Our Overall Business
(*) – See appendix for non-GAAP reconciliations
Adj EBITDA (in millions of $)
$10.0
$28.6
3.4%
10.9%
0.0%
2.0%
4.0%
6.0%
8.0%
10.0%
12.0%
$0
$5
$10
$15
$20
$25
$30
$35
YTD14 YTD15
Adj. EBITDA Adj. EBITDA margin
Adj EBITDA margin

8
Company / Industry UpdatePortfolio Optimization – North America
USA Wood Door allows Masonite to capture additional value through the supply chain
USA Wood Door - Customized Solutions, Rapid Delivery
Supplier of architectural and commercial wood
doors in the Eastern United States providing
door and hardware distributors with machined,
re-sized, and value added additions to both
unfinished and prefinished doors
Customer Customer Customer
Quick shipping, re-sizing, machining, color matching
$13mm
Purchase Price
$18mm in net sales (TTM)
Based in Thorofare, NJ

Company / Industry UpdateMarketing to the Influencer: Branding at Lowe’s
Before After
Mixture of kiosks and
doors in frames
Merchandising
difficult to read at
upper level
Focusing on opportunities to expand our reach and our brand
9

10
Company / Industry UpdateProduct Line Leadership: Interior & Exterior Doors
Heritage Series Barn Door Kits
Vista Grande Everland

11
Company / Industry UpdateSales & Marketing Excellence: Selling Down Channel
Connecting with remodelers down channel
Angie’s List
Arrangement provides members Masonite
product information and links them to trained
Masonite Preferred Remodelers in their area.
Angie’s List will have a dedicated team assigned
to the Masonite Preferred Remodelers program
Masonite is the exclusive door advertiser on the
site
Targeted Down channel strategy to connect
consumers and contractors with Masonite doors

① Company / Industry Update
② Q3’15 Financial Review
③ Summary / Q&A

$35.6
$50.5
$25.0
$35.0
$45.0
$55.0
$65.0
$75.0
Q3'14 Q3'15
$476.1 $475.7
$200.0
$300.0
$400.0
$500.0
$600.0
Q3'14 Q3'15
8.58.0
5.0
10.0
15.0
Q3'14 Q3'15
Adj. EBITDA* Door Volume^Net Sales
(in millions) (millions of USD) (millions of USD)
Q3’14 Q3’15 Q3’14 Q3’15 Q3’14 Q3’15
(^) – Does not include Africa segment, PDS or National Hickman. Includes only 1 month of France in Q3’15.
(*) – See appendix for non-GAAP reconciliations.
13
2015 Third Quarter Financial ResultsDoor Volume, Net Sales and Adjusted EBITDA
Masonite’s results continue to improve by focusing on high value products and services
+42%0% -6%
+5%Excluding impact of F(x): +49%Excluding impact of F(x):
~40% of volume decline due
to France disposal

(*) – See appendix for non-GAAP reconciliations
Net Sales
Gross Profit
Gross Profit %
SG&A
SG&A %
Adj. EBITDA*
Adj. EBITDA %
Q3’15
$475.7
$87.5
18.4%
$59.6
12.5%
$50.5
10.6%
Q3’14
$476.1
$66.2
13.9%
$53.9
11.3%
$35.6
7.5%
Change
-0.1%
+32.1%
+450 bps.
+10.6%
+120 bps.
+41.9%
+310 bps.
14
2015 Third Quarter Financial ResultsConsolidated P&L Information
Gross profit margin expanded by 450 basis points
($ in millions)
+ 5.4%, exc. FX
+ 49%, exc. FX

15
2015 Third Quarter Financial ResultsNet Sales and Adjusted EBITDA Growth versus Q3 2014
Strong Adjusted EBITDA growth vs. Q3 2014 in NA and Europe / Other
Net Sales + $4.5M
+ $21.0M excl. FX
Adj. EBITDA* +$5.7M
+ 15.7%
AUP + 7.2%
Net Sales - $6.1M
+ $0.8M excl. FX
Adj. EBITDA* +$6.5M
+ 342.1%
AUP + 4.8%^
(*) – See appendix for non-GAAP reconciliations
(^) – EUR/ROW AUP does not include PDS or National Hickman contributions
North America Europe / Other
Adjusted EBITDA and AUP increases in all reportable segments

2015 Third Quarter Financial ResultsGenerating increasing free cash flow
$48.9
$60.3
$86.9
$60.9
$139.0
$0.0
$20.0
$40.0
$60.0
$80.0
$100.0
$120.0
$140.0
$160.0
2012 2013 2014 Q3'14 Q3'15
Masonite’s Trailing Twelve Month Free Cash Flow* (2012 – Present)
Higher AUP and improved operating performance drive strong free cash flow generation
(*) – FCF defined as Adjusted EBITDA less capex 16
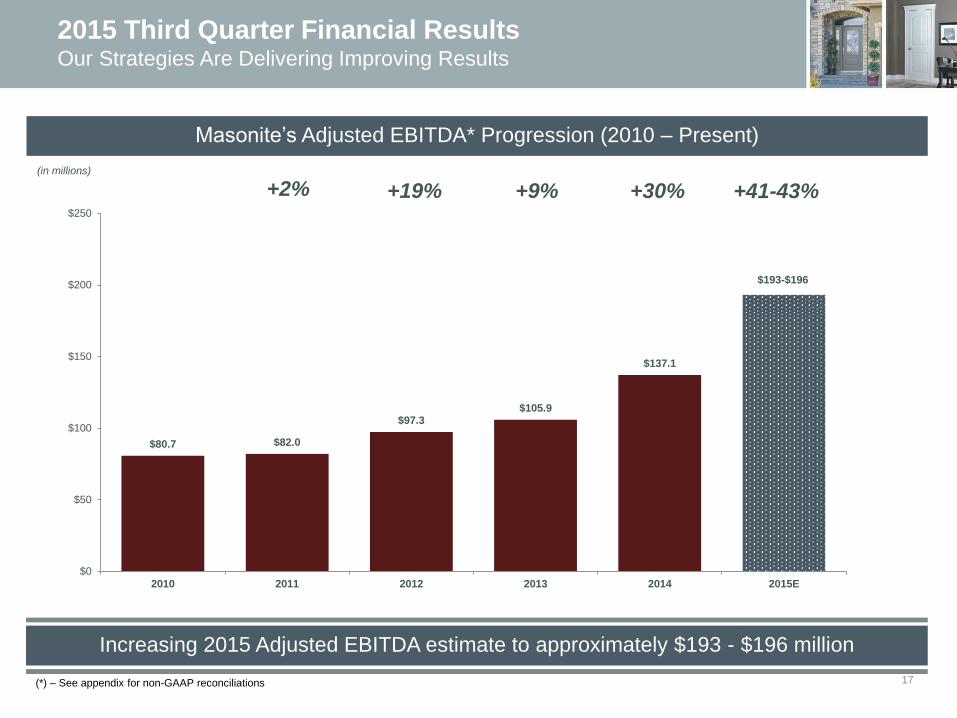
$80.7 $82.0
$97.3$105.9
$137.1
$0
$50
$100
$150
$200
$250
2010 2011 2012 2013 2014 2015E
17
Increasing 2015 Adjusted EBITDA estimate to approximately $193 - $196 million
2015 Third Quarter Financial ResultsOur Strategies Are Delivering Improving Results
Masonite’s Adjusted EBITDA* Progression (2010 – Present)
(in millions)
+2% +19% +9% +30%
(*) – See appendix for non-GAAP reconciliations
+41-43%
$193-$196

① Company / Industry Update
② Q3’15 Financial Review
③ Summary / Q&A

Masonite’s Q3 Results Continued to Improve Despite an Uneven Recovery
Excluding foreign exchange net sales increased 5.4%
Gross profit increased 32% and gross margin expanded 450 basis points
Adjusted EBITDA margin expanded 310 basis points to 10.6%
Sixth consecutive quarter of Adjusted EBITDA growth greater than 20%
Business Transformation Continues
Providing an unparalleled customer experience
Acquired European businesses broaden our product and customer portfolio
Acquisition of USA Wood Door provides more value added service capabilities
Disposed of door business in France
Continued focus on efficiency through lean enterprise
19
SummaryMasonite’s Balanced Growth Strategy Is Working

Questions & Answers

Appendix

Leverage Ratios
Unrestricted Cash $69.0
Total Available Liquidity $206.1
Liquidity at September 27, 2015 (millions of USD)
TTM Adj. EBITDA^ $185.1
TTM Interest Expense $36.2
Total Debt $472.6
Net Debt $403.6
22
Liquidity, Credit and Debt Profile
8.25% Senior Unsecured Notes due 2021
(^) – See appendix for non-GAAP reconciliations.
Masonite’s balance sheet and liquidity position remain strong
Coverage Ratios
0.0
1.0
2.0
3.0
4.0
5.0
Q3'14 Q4'14 Q1'15 Q2'15 Q3'15
Total Debt Net Debt
0.0
1.0
2.0
3.0
4.0
5.0
6.0
Q3'14 Q4'14 Q1'15 Q2'15 Q3'15
Adj. EBITDA / Interest (Adj. EBITDA - Capex) / Interest
Debt Maturities
$150
$475
$0
$100
$200
$300
$400
$500
2015 2016 2017 2018 2019 2020 2021 2022 2023
($ in millions)
ABL
Senior Unsecured Notes

23
Reconciliation of Adjusted EBITDA to Net Income
(loss) Attributable to Masonite
Consolidated
(In thousands)
September 27,
2015
September 28,
2014
September 27,
2015
September 28,
2014
September 27,
2015
June 28,
2015
March 29,
2015
December 28,
2014
September 28,
2014
June 29,
2014 (In thousands)
December 28,
2014
December 29,
2013
December 30,
2012
January 1,
2012
January 2,
2011
Adjusted EBITDA 50,512$ 35,597$ 147,357$ 99,365$ 185,079$ 170,164$ 155,157$ 137,087$ 117,172$ 110,007$ Adjusted EBITDA 137,087$ 105,877$ 97,261$ 81,994$ 80,678$
Less (plus): Less (plus):
Depreciation 14,554 15,842 44,270 45,824 59,068 60,356 60,482 60,622 60,222 59,885 Depreciation 60,622 62,080 63,348 60,784 58,633
Amortization 6,258 4,889 16,244 16,173 21,793 20,424 21,042 21,722 20,348 19,736 Amortization 21,722 17,058 15,076 10,569 8,092
Share based compensation expense 1,490 2,255 6,975 7,335 9,245 10,010 9,701 9,605 9,335 8,921 Share based compensation expense 9,605 7,752 6,517 5,888 9,626
Loss (gain) on disposal of property, plant and
equipment 291 236 585 2,359 2,042 1,987 2,673 3,816 2,394 (614)
Loss (gain) on disposal of property, plant and
equipment 3,816 (1,775) 2,724 3,654 1,301
Registration and listing fees — — — — — — — — 423 2,421 Registration and listing fees — 2,421 — — —
Restructuring costs 1,139 9,913 4,483 11,194 4,426 13,200 12,772 11,137 17,357 8,709 Restructuring costs 11,137 10,630 11,431 5,116 7,000
Asset impairment 9,439 — 9,439 — 27,641 18,202 18,202 18,202 — — Asset impairment 18,202 1,904 1,350 2,516 —
Loss (gain) on disposal of subsidiaries 29,721 — 29,721 — 29,721 — — — — — Interest expense (income), net 41,525 33,230 31,454 18,068 245
Interest expense (income), net 7,179 10,447 25,719 31,034 36,210 39,478 43,285 41,525 39,476 37,359 Loss on extinguishment of debt — — — — —
Loss on extinguishment of debt — — 28,046 — 28,046 28,046 28,046 — — — Other expense (income), net (587) 2,316 528 1,111 1,030
Other expense (income), net (1,720) (404) (3,539) 1,083 (5,209) (3,893) (1,952) (587) 4,175 4,324 Income tax expense (benefit) 4,533 (21,377) (13,365) (21,560) (11,396)
Income tax expense (benefit) (2,510) 2,004 15,767 3,402 16,898 21,412 7,778 4,533 (10,259) (18,535)
Loss (income) from discontinued operations, net
of tax 630 598 (1,480) 303 1,718
Loss (income) from discontinued operations, net
of tax 192 124 661 436 855 787 717 630 838 776
Net income (loss) attributable to non-controlling
interest 3,222 2,050 2,923 2,079 1,390
Net income (loss) attributable to non-controlling
interest 762 258 2,879 1,498 4,603 4,099 4,217 3,222 1,425 2,005 Net income (loss) attributable to Masonite (37,340)$ (11,010)$ (23,245)$ (6,534)$ 3,039$
Net income (loss) attributable to Masonite (16,283)$ (9,967)$ (33,893)$ (20,973)$ (50,260)$ (43,944)$ (51,806)$ (37,340)$ (28,562)$ (14,980)$
Three Months Ended Nine Months Ended Twelve Months Ended Year Ended

24
Reconciliation of Adjusted EBITDA to Net Income
(loss) Attributable to Masonite
(In thousands)
September 27,
2015
September 27,
2014
September 27,
2015
September 27,
2014
Adjusted EBITDA 8,431$ 1,902$ 28,561$ 9,964$
Less (plus):
Depreciation 3,649 5,328 10,068 14,033
Amortization 2,290 1,107 4,118 3,226
Loss (gain) on disposal of property, plant and equipment 13 (929) 32 (330)
Restructuring costs 219 9,832 2,414 10,705
Asset impairment 9,439 — 9,439 —
Loss (gain) on disposal of subsidiaries 29,721 — 29,721 —
Interest expense (income), net (5,637) (6,967) (19,426) (21,358)
Other expense (income), net (1,466) (117) (2,640) 1,528
Income tax expense (benefit) (2,241) (12) 391 199
Loss (income) from discontinued operations, net of tax — — 152 —
Net income (loss) attributable to Masonite (27,556)$ (6,340)$ (5,708)$ 1,961$
Three Months Ended Nine Months Ended
EUR / ROW Segment
