4 q15 earnings presentation
TRANSCRIPT

Fourth Quarter 2015 Earnings Conference Call
February 18, 2016
This presentation contains forward-looking statements, including our belief in the
benefits to be achieved from the business unit realignment, expectations for
annualized cost savings achieved from our cost optimization program and resulting
restructuring charges, expectations for revenue, adjusted EBITDA and capital
expenditures in 2016 and our ability to further improve margin profile and generate
positive levered free cash flow for the full-year 2016. Because such statements are not
guarantees of future performance and involve risks and uncertainties, there are
important factors that could cause Internap's actual results to differ materially from
those in the forward-looking statements. These include statements related to our
expectations regarding performance of our IT infrastructure services and the benefits
we expect our customers to receive from them, customer adoption rates of our
performance-based product offerings, our ability to execute our strategy, deliver growth
and generate cash, our ability to correctly forecast anticipated cost savings and
restructuring charges, our ability to leverage data center expansions and continue to
build positive operating leverage in the business model, our ability to sell into available
data center capacity, our ability to renegotiate key IP transit contracts on favorable
terms and our ability to increase our utilization of our data center space. Internap
discusses these factors in its filings with the Securities and Exchange Commission.
Given these risks and uncertainties, investors should not place undue reliance on
forward-looking statements as a prediction of future results. Internap undertakes no
obligation to update, amend, or clarify any forward-looking statement for any reason. 2
Forward-looking Statements

• In 2015, the Board of Directors created a Strategy Committee of independent
directors
• Hired Morgan Stanley and Greenberg Traurig to assist in evaluation of strategic
alternatives
• Internap contacted a wide range of financial and strategic parties
• Internap received several preliminary, non-binding indications of interest with respect
to a potential acquisition of the Company
• Due to a variety of factors, including the inability to obtain financing and volatility in
the credit markets, no agreement was reached
• The Board remains open to all alternatives that would maximize shareholder value
• Having conducted a thorough review, the Board has determined that accelerating
Internap’s business unit realignment best positions the Company for value creation
as a standalone entity and also best facilitates the possibility of other value creating
combinations
Strategic Review Process Summary
Strategic Review
3

• Accelerate transition into two integrated business units: Data Center and Network
Services and Cloud and Hosting Services
• The business unit realignment will facilitate more effective and efficient business
operations, improve customer and product focus and increase long-term
shareholder value
• Cost optimization program expected to result in approximately $4 million - $5
million of annualized cost savings beginning in 2Q16
• Savings will be generated primarily by optimizing the Company’s cost structure
during the business realignment, as well as reduced discretionary spending and
marketing program efficiencies
• Record a one-time, below the line, restructuring charge of approximately $2.5
million - $3.0 million
Business Realignment and Associated
Cost Optimization Initiative
Strategic Review
4

5
Business Alignment
2Q13Percentages not to scale.
Data Center
and
Network
Services
67%
Company-
Controlled Colo
28%~55%-60%
IP Services
26%
~55%-60%
Service
Partner Colo
13%~25%-30%
Cloud and
Hosting
Services
33%
Bare-Metal Cloud
11% ~70%
Dedicated Hosting
20%~70%
Other
2%~ 80%
Services/% Total Pro Forma Revenue
• Market growth rate 8%-10%
• Regional and global competitors (Colo/REIT’s)
• Differentiate on power dense platform
• Market growth rate (2)%-(5)%
• Price declines partially offset by traffic growth
• Global carrier competitors
• Patented technology enables and differentiates colo
and cloud/hosting services
• Customer convenience play
• Geographic reach and “fill in”
• Market growth rate 20%-25%
• Differentiate on superior price/performance value
proposition for high performance applications
• Bare metal and virtual cloud provider competitors
• Custom hosting represents 40%
• Market growth rate 10%-15%
• Dedicated servers represents 60%
• Market growth rate 5%-6%
• Managed services and compliance value proposition
• Hosting provider competitors
• Software and shared hosting
GM % Market Dynamic/Competitive Positioning

• Consolidated revenue of $78.8M increased 1% Q/Q and decreased 7% Y/Y
• Core data center services revenue of $49.1M increased 1% Q/Q and decreased 1% Y/Y
• Segment profit of $47.3M increased 6% Q/Q and decreased 3% Y/Y
• Segment margin of 60.1% expanded 310 bps Q/Q and 220 bps Y/Y
• Adjusted EBITDA of $22.8M increased 15% Q/Q and flat Y/Y
• Adjusted EBITDA margin of 29.0% expanded 380 bps Q/Q and 200 bps Y/Y
• Levered free cash flow of $1.4 million (second consecutive positive quarter)
Record Financial Results
4Q15 Highlights
6
Core data center services defined as company-controlled colocation, hosting and cloud services.
Segment profit, segment margin, adjusted EBITDA, adjusted EBITDA margin and levered free cash flow are non-GAAP measures. Segment profit is segment revenues less
direct costs of network, sales and services, exclusive of depreciation and amortization. Segment profit does not include direct costs of customer support, direct costs of
amortization of acquired technologies or any other depreciation or amortization associated with direct costs. Segment margin is segment profit as a percentage of segment
revenues. Adjusted EBITDA is loss from operations plus depreciation and amortization, (loss) gain on disposals of property and equipment, exit activities, restructuring and
impairments, stock-based compensation, acquisition costs and strategic alternatives and related costs. Adjusted EBITDA margin is adjusted EBITDA as a percentage of
revenues. Levered free cash flow is adjusted EBITDA less capital expenditures, net of equipment sale-leaseback transactions and cash paid for interest. A presentation of
segment profit and segment margin and a reconciliation of adjusted EBITDA to GAAP loss from operations and levered free cash flow can be found in the attachment to our
fourth quarter 2015 earnings press release, which is available on our website and furnished to the Securities and Exchange Commission.
.

Financial Summary: Revenue
Revenue
7$ in millions.
• Consolidated revenue increased 1% Q/Q and decreased 7% Y/Y
• Data center services revenue increased 1% Q/Q and decreased 4% Y/Y
• Strategic mix shift to data center services 75% of consolidated revenue
• IP services revenue flat Q/Q and decreased 14% Y/Y
• Churn mitigation program yielding positive results
Data Center Services Drive Sequential Top Line Growth
Revenue Churn
Data Center Churn 1.8% 1.7% 3.0% 2.3% 2.1% 2.4% 2.1% 1.6%
IP Revenue Churn 1.2% 1.2% 1.8% 1.4% 1.9% 1.8% 1.6% 1.7%
Total Revenue Churn 1.6% 1.6% 2.7% 2.0% 2.1% 2.3% 2.0% 1.6%
71% 73% 73% 73% 73% 74% 75% 75%
29% 27% 27% 27% 27% 26% 25% 25%
1Q14 2Q14 3Q14 4Q14 1Q15 2Q15 3Q15 4Q15
IP ServicesData Center Services
$84.1 $84.7 $84.3 $80.8 $80.4 $78.3 $78.8$82.0

8
Strategic Mix Shift Engine for Growth
Favorable Revenue Mix
Profitable Growth
$ in millions. Core data center services defined as company-controlled colocation, hosting and cloud services. Legacy revenue defined as IP services and partner colocation data
center services. CAGR is compound annual growth rate.
• 15% 3-year adj. EBITDA CAGR
• Adjusted EBITDA margin expanded
750 basis points over the same time-
frame
Solid Adj. EBITDA Growth and
Margin Expansion
• Core increased 1% Q/Q and
decreased 1% Y/Y
• Core revenue represents 83% of data
center services revenue and 62% of
consolidated revenue
• 17% 3-year revenue CAGR
Core Data Center Services
Resume Sequential Growth
$39.4
$29.7 $30.4
$49.1
4Q
12
1Q
13
2Q
13
3Q
13
4Q
13
1Q
14
2Q
14
3Q
14
4Q
14
1Q
15
2Q
15
3Q
15
4Q
15
Core Legacy
$15.0
$22.8
21.5%
29.0%
4Q
12
1Q
13
2Q
13
3Q
13
4Q
13
1Q
14
2Q
14
3Q
14
4Q
14
1Q
15
2Q
15
3Q
15
4Q
15
Adj. EBITDA Margin

Data Center Services Segment Profit and
Segment Margin
9
Data Center Services Segment Profit
• Data center segment profit increased 5% Q/Q and flat Y/Y
• Data center segment margin expanded 270 basis points Q/Q and 230 basis points Y/Y
• Core segment profit increased 5% Q/Q and 2% Y/Y
• Core segment margin expanded 220 basis points Q/Q and 240 basis points Y/Y
Core Data Center Services Engine for Long-Term Profitable Growth
$ in millions.
$32.4 $34.8 $33.9 $35.3 $34.9 $35.1
$33.5 $35.3
55.6%56.7%
55.0%
57.6%58.9% 59.0%
57.2%
59.9%63.4%
64.8%62.3%
64.2%65.6% 66.4% 64.4%
66.6%
1Q14 2Q14 3Q14 4Q14 1Q15 2Q15 3Q15 4Q15
Partner Colo Segment Profit Core Segment Profit
DC Segment Margin % Core Segment Margin %

IP Services Segment Profit and Segment Margin
10
IP Services Segment Profit
Solid Profitability and Cash Generation
$ in millions.
• IP segment profit increased 8% Q/Q and decreased 11% Y/Y
• IP segment margin expanded 420 basis points Q/Q and 200 basis points Y/Y
• Enabler for high-performance, hybrid Internet infrastructure service offerings
$13.8 $12.7
$13.6 $13.5 $12.6
$12.4 $11.1
$12.0
58.3%
55.9%
59.0%58.7%
58.1%58.9%
56.5%
60.7%
1Q14 2Q14 3Q14 4Q14 1Q15 2Q15 3Q15 4Q15
Segment Margin %

11
Record High Adjusted EBITDA and Adjusted EBITDA Margin
Adjusted EBITDA
$ in millions.
• Adjusted EBITDA increased 15% Q/Q and flat Y/Y
• Adjusted EBITDA margin expanded 380 bps Q/Q and 200 bps Y/Y
• Positive results reflect impact of favorable product mix shift
• Tight operational controls and positive operating leverage support margin expansion
Record Adjusted EBITDA Results
$17.8 $18.5 $19.7
$22.7
$17.9 $19.1 $19.8
$22.8
21.7% 22.0%23.3%
27.0%
22.2%
23.8%
25.2%
29.0%
1Q14 2Q14 3Q14 4Q14 1Q15 2Q15 3Q15 4Q15
Adj. EBITDA Margin

Financial Review: Cash Flow and Balance Sheet
12
Levered Free Cash Flow
4Q15 3Q15 4Q14
Cash & Cash Equivalents $17.8 $18.3 $20.1
Less: Debt (net of discount) 318.5 318.8 299.0
Less: Capital Leases 57.1 57.5 60.1
Equals: Net Debt $(357.8) $(358.0) $(339.0)
Net Debt to Adj. EBITDA (LQA)* 3.9x 4.5x 4.7x
Balance Sheet Summary
$ in millions * LQA = Last Quarter Annualized.
$(13.5)
$(0.7) $(0.2)
$(9.2)$(4.2)
$(3.3)
$2.2 $1.4
1Q14 2Q14 3Q14 4Q14 1Q15 2Q15 3Q15 4Q15
Adj. EBITDA $17.8 $18.5 $19.7 $22.7 $17.9 $19.1 $19.8 $22.8
Less: Capex $(25.5) $(13.1) $(13.7) $(25.1) $(15.7) $(15.8) $(10.9) $(14.7)
Less: Cash Interest Exp. $(5.8) $(6.1) $(6.2) $(6.8) $(6.4) $(6.6) $(6.7) $(6.7)
Equals: Levered FCF $(13.5) $(0.7) $(0.2) $(9.2) $(4.2) $(3.3) $2.2 $1.4
$(40.0)
$(30.0)
$(20.0)
$(10.0)
$-
$10.0
$20.0
$30.0

2016 Financial Guidance
13
Revenue
Adjusted EBITDA
$310 - $320
$80 - $90
Range
(in millions)
Financial guidance constitutes forward-looking statements which involve risks and uncertainties. Please refer to slide 2 for more information
regarding forward-looking statements.
Capital Expenditures
Growth
Maintenance
$40 - $50
$30 - $35
$10 - $15
14
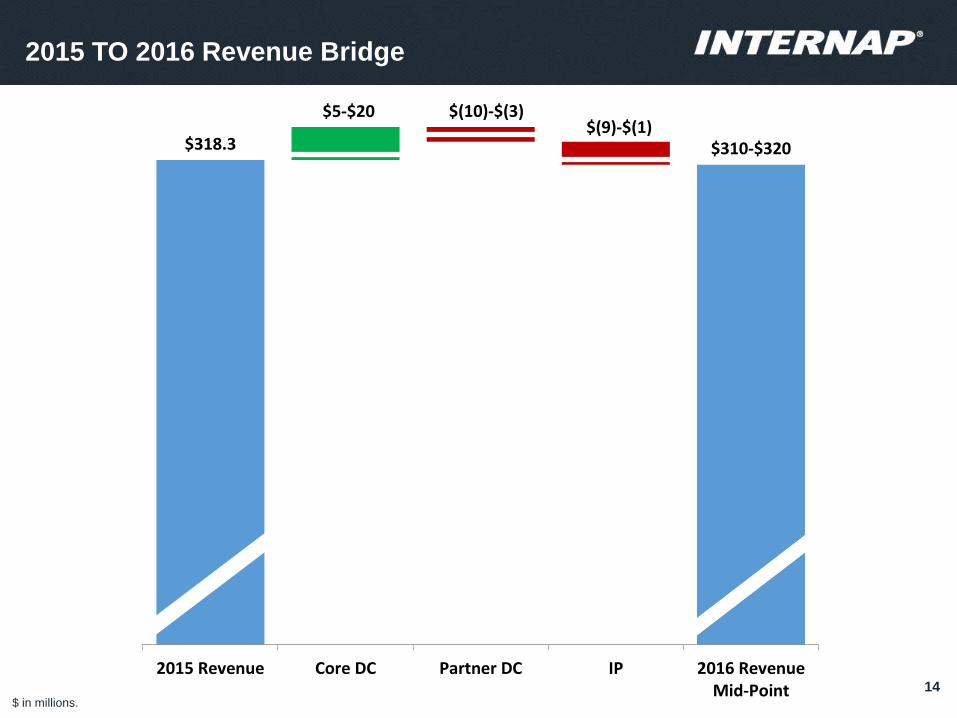
2015 TO 2016 Revenue Bridge
2Q13$ in millions.
$318.3 $310-$320
$5-$20 $(10)-$(3)$(9)-$(1)
2015 Revenue Core DC Partner DC IP 2016 RevenueMid-Point

15
2015 TO 2016 Adjusted EBITDA Bridge
2Q13$ in millions.
$79.6
$80-$90
$2-$7 $(7)-$(2) $1-$3 $1-$3
$3-$6
2015 Adj. EBITDA GrowthInitiatives
Churn MIRO C COGS Savings Opex Benefits 2016 Adj. EBITDAMid-Point

Product
MarketExecution
Building a Great Company
16

1. Salesforce productivity initiatives
Bookings increased sequentially during 4Q15
2. Proactive churn mitigation and account management
Total churn rate the lowest level in 6 quarters
3. Targeted data center utilization
Largest quarterly leasing increase in Dallas data center since facility opening
4. Channel programs – sales force multiplier
Positive momentum with second-half 2015 channel bookings up significantly from first-half
2015
5. Lead generation and targeted marketing initiatives
Marketing sourced new logos MRR accelerate considerably over the previous 2 quarters
6. New/enhanced product and service offerings
Gaining traction for Managed Internet Routing Optimizer (MIRO) Controller with $0.5M in sales
in 4Q15
Focus on Growth
17
Growth Initiatives Yielding Positive Results

Results:
• Record results for 4Q15 and FY 2015
– Highest quarterly and annual levels of adjusted EBITDA, adjusted EBITDA margin and
segment margin
• Adjusted EBITDA increased 15% and adjusted EBITDA margin expanded 380 bps Q/Q
• Second consecutive quarter of positive levered free cash flow
Looking Forward:
• Business unit realignment designed to facilitate more effective and efficient business
operations, to improve customer and product focus and increase long-term
shareholder value
• Cost optimization program expected to result in approximately $4 million - $5 million
of annualized cost savings beginning in 2Q16, primarily a result of optimizing cost
structure around the business unit realignment
• Further improve margin profile
• Expect to generate positive levered free cash flow for the full-year 2016
Improved Operational and Financial Results
4Q15 Summary
18