life cycle assessment of a new pidgeon process – esan ...€¦ · esan lca study r 2 title life...
TRANSCRIPT
Life Cycle Assessment of a New Pidgeon Process – ESAN Summary of Results Prepared for: I. Göknel, ESAN
ESAN LCA Study
r 2
Title Life Cycle Assessment of a New Pidgeon Process – ESAN
Summary of Results
Date 10-Nov-15
Authors Simone Ehrenberger, Mascha Brost
Approved by Dr-Ing. S. Schmid, Prof. Dr-Ing. H.E. Friedrich
Prepared for ESAN
German Aerospace Centre e.V.
Institute of Vehicle Concepts
Prof. Dr.-Ing. H. E. Friedrich
Pfaffenwaldring 38-40
D-70569 Stuttgart, GERMANY
Simone Ehrenberger
Tel.: +49 (0)711/6862-256 +49 (0) 711/6862-412
Fax : +49 (0)711/6862-258 +49 (0) 711/6862-258
ESAN LCA Study
3
1 Goal and Scope of Study
The Pidgeon process has become the dominant production path for primary magnesium during the last
fifteen years. The process was invented in Canada in the 1940s, but in recent years has been used almost
exclusively in China, which covers about 88 % [1] of current world production. In 2012, ESAN started to
build up a magnesium production plant using the Pidgeon process technology in Cifteler, Central Turkey.
This study is based on planning data from the ESAN plant. The aim is to assess the potential impacts of
emissions from the plant and the upstream processes with a focus on greenhouse gas emissions. The study
identifies hot spots for emissions and resource consumption as well as potential solutions for lowering
emissions from the overall process chain.
The functional unit of the study is 1 kg of pure magnesium produced via the Pidgeon process and a final
refining step. The analysis follows a cradle-to-gate approach and includes all upstream processes. The
energy and material supply for the core processes are site-specific and are modelled according to the
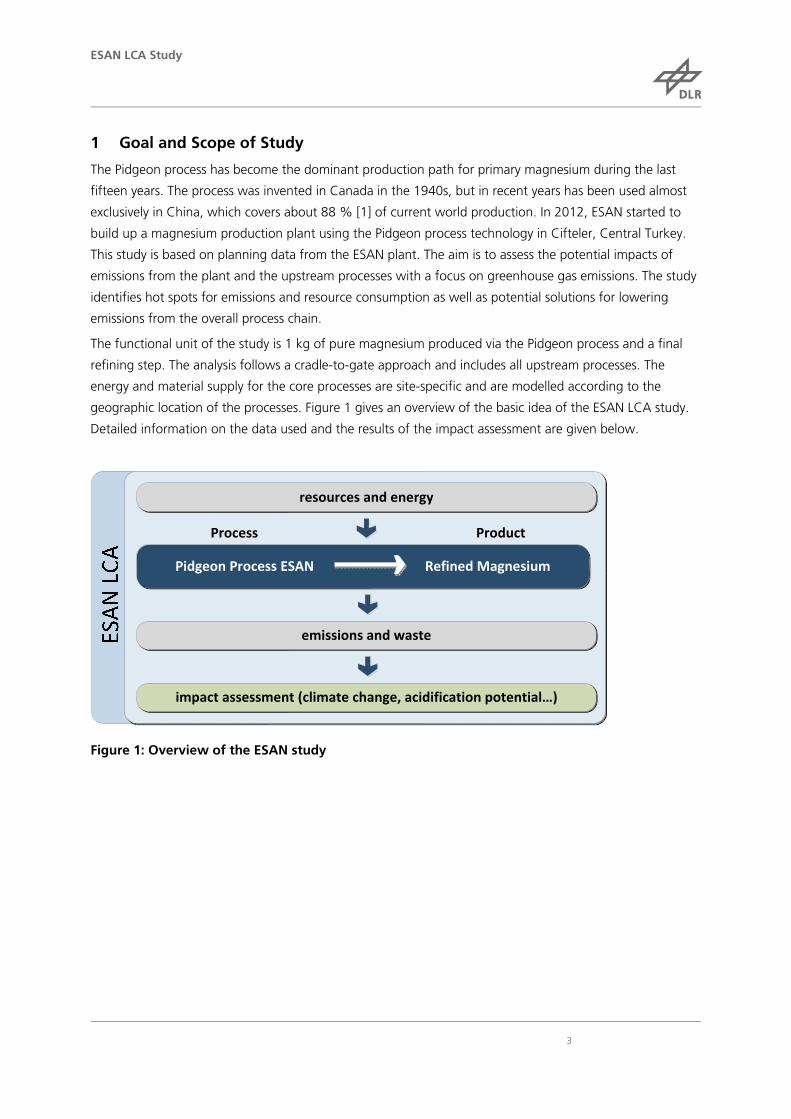
geographic location of the processes. Figure 1 gives an overview of the basic idea of the ESAN LCA study.
Detailed information on the data used and the results of the impact assessment are given below.
Process Product
Pidgeon Process ESAN Refined Magnesium
emissions and waste
resources and energy
impact assessment (climate change, acidification potential…)
Figure 1: Overview of the ESAN study
ESAN LCA Study
4
2 Process Data from Primary Magnesium Production at ESAN
In this study, the data for the core processes at ESAN is site-specific and reflects the planning status of the
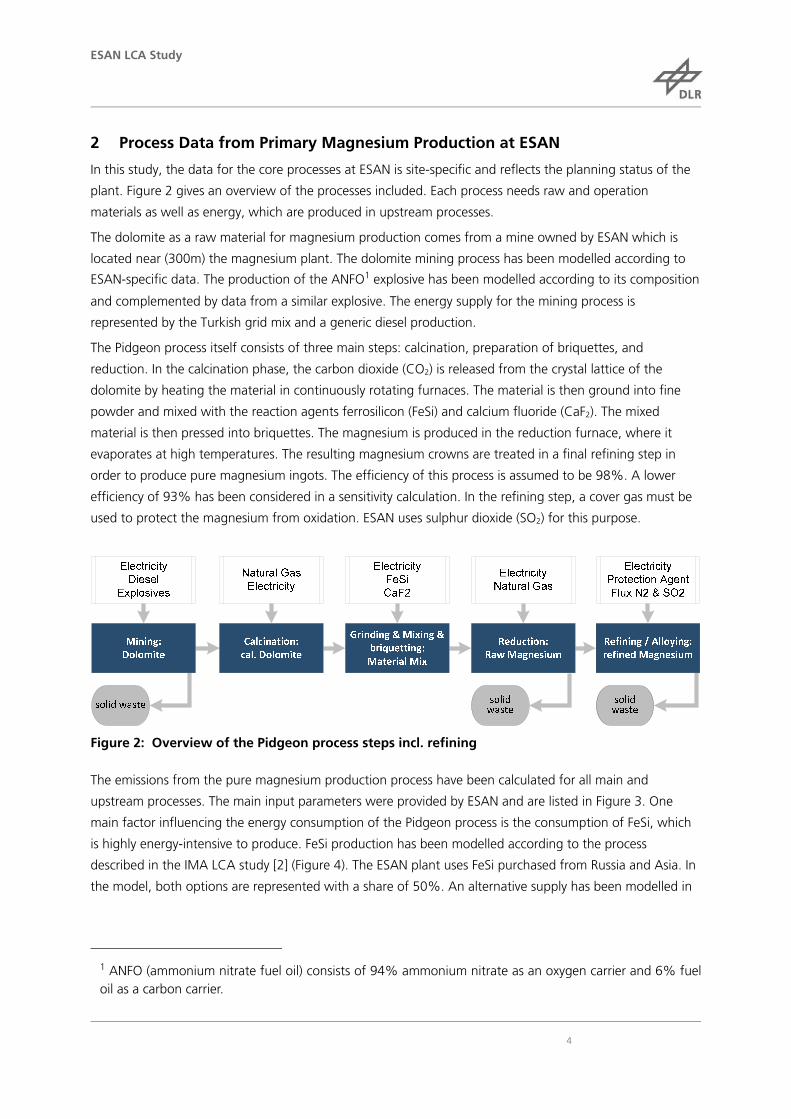
plant. Figure 2 gives an overview of the processes included. Each process needs raw and operation
materials as well as energy, which are produced in upstream processes.
The dolomite as a raw material for magnesium production comes from a mine owned by ESAN which is
located near (300m) the magnesium plant. The dolomite mining process has been modelled according to
ESAN-specific data. The production of the ANFO1 explosive has been modelled according to its composition
and complemented by data from a similar explosive. The energy supply for the mining process is
represented by the Turkish grid mix and a generic diesel production.
The Pidgeon process itself consists of three main steps: calcination, preparation of briquettes, and
reduction. In the calcination phase, the carbon dioxide (CO2) is released from the crystal lattice of the
dolomite by heating the material in continuously rotating furnaces. The material is then ground into fine
powder and mixed with the reaction agents ferrosilicon (FeSi) and calcium fluoride (CaF2). The mixed
material is then pressed into briquettes. The magnesium is produced in the reduction furnace, where it
evaporates at high temperatures. The resulting magnesium crowns are treated in a final refining step in
order to produce pure magnesium ingots. The efficiency of this process is assumed to be 98%. A lower
efficiency of 93% has been considered in a sensitivity calculation. In the refining step, a cover gas must be
used to protect the magnesium from oxidation. ESAN uses sulphur dioxide (SO2) for this purpose.
Figure 2: Overview of the Pidgeon process steps incl. refining
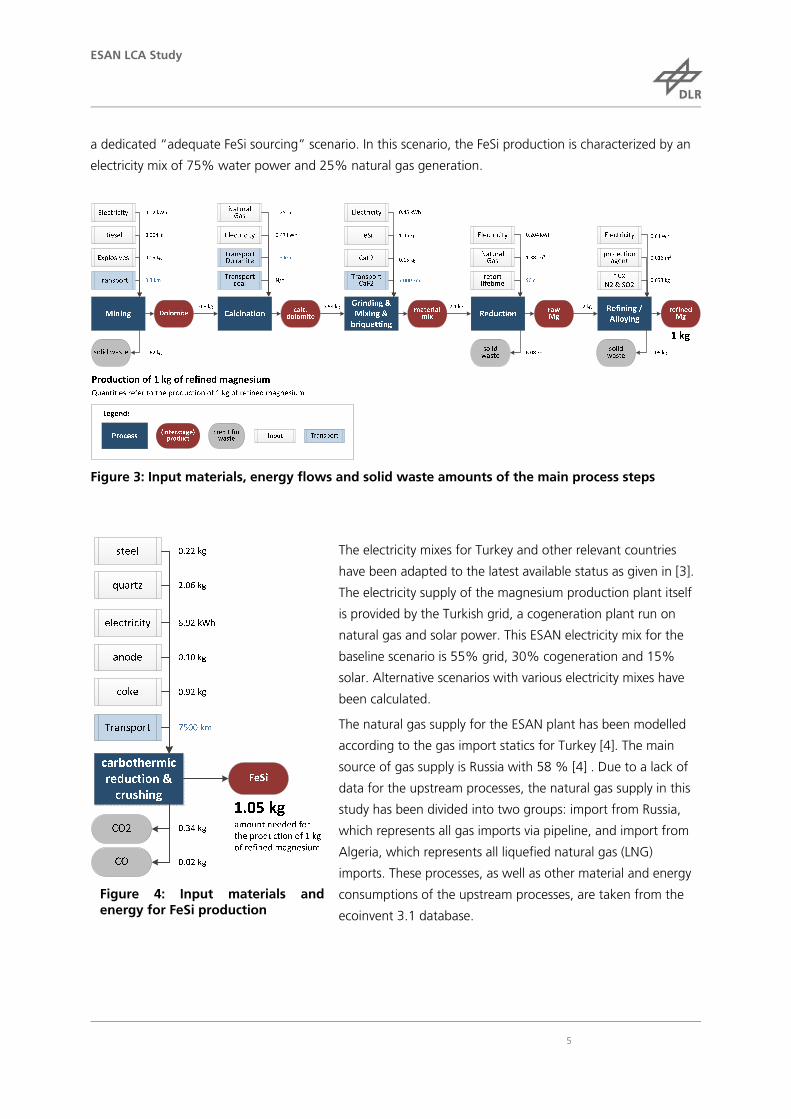
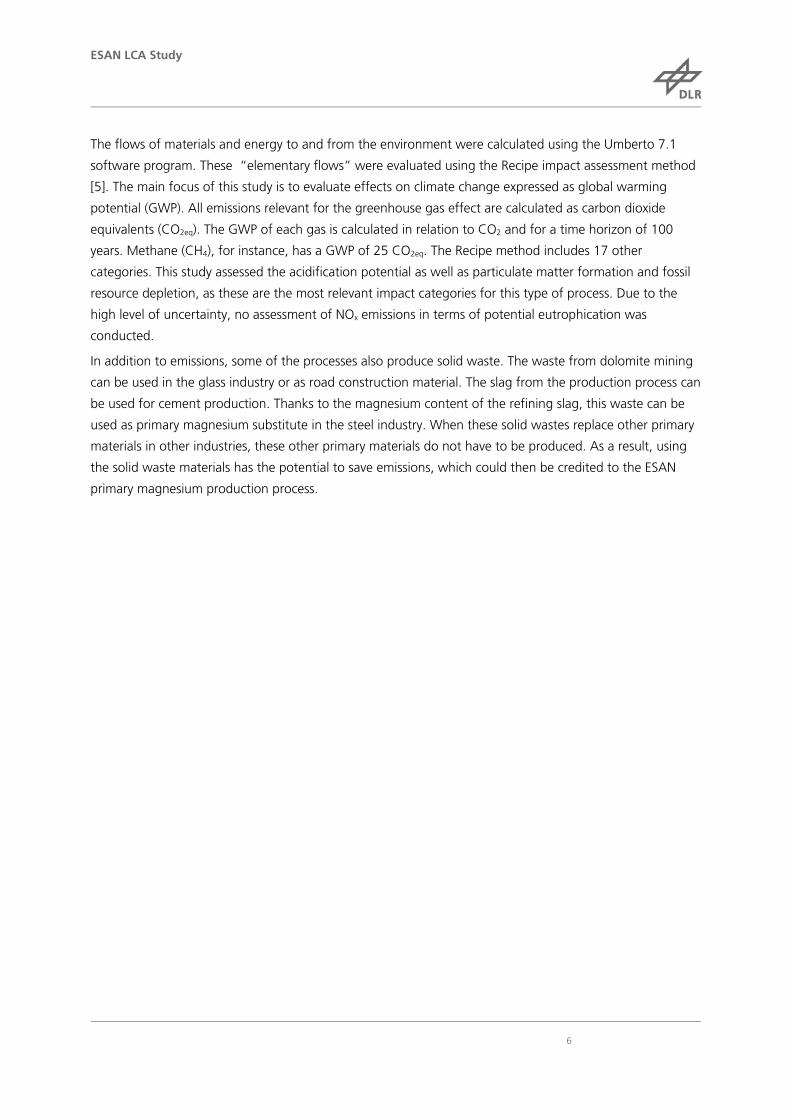
The emissions from the pure magnesium production process have been calculated for all main and
upstream processes. The main input parameters were provided by ESAN and are listed in Figure 3. One
main factor influencing the energy consumption of the Pidgeon process is the consumption of FeSi, which
is highly energy-intensive to produce. FeSi production has been modelled according to the process
described in the IMA LCA study [2] (Figure 4). The ESAN plant uses FeSi purchased from Russia and Asia. In
the model, both options are represented with a share of 50%. An alternative supply has been modelled in
1 ANFO (ammonium nitrate fuel oil) consists of 94% ammonium nitrate as an oxygen carrier and 6% fuel oil as a carbon carrier.
ESAN LCA Study
5
a dedicated “adequate FeSi sourcing” scenario. In this scenario, the FeSi production is characterized by an
electricity mix of 75% water power and 25% natural gas generation.
Figure 3: Input materials, energy flows and solid waste amounts of the main process steps
Figure 4: Input materials and energy for FeSi production
The electricity mixes for Turkey and other relevant countries
have been adapted to the latest available status as given in [3].
The electricity supply of the magnesium production plant itself
is provided by the Turkish grid, a cogeneration plant run on
natural gas and solar power. This ESAN electricity mix for the
baseline scenario is 55% grid, 30% cogeneration and 15%
solar. Alternative scenarios with various electricity mixes have
been calculated.
The natural gas supply for the ESAN plant has been modelled
according to the gas import statics for Turkey [4]. The main
source of gas supply is Russia with 58 % [4] . Due to a lack of
data for the upstream processes, the natural gas supply in this
study has been divided into two groups: import from Russia,
which represents all gas imports via pipeline, and import from
Algeria, which represents all liquefied natural gas (LNG)
imports. These processes, as well as other material and energy
consumptions of the upstream processes, are taken from the
ecoinvent 3.1 database.
ESAN LCA Study
6
The flows of materials and energy to and from the environment were calculated using the Umberto 7.1
software program. These “elementary flows” were evaluated using the Recipe impact assessment method
[5]. The main focus of this study is to evaluate effects on climate change expressed as global warming
potential (GWP). All emissions relevant for the greenhouse gas effect are calculated as carbon dioxide
equivalents (CO2eq). The GWP of each gas is calculated in relation to CO2 and for a time horizon of 100
years. Methane (CH4), for instance, has a GWP of 25 CO2eq. The Recipe method includes 17 other
categories. This study assessed the acidification potential as well as particulate matter formation and fossil
resource depletion, as these are the most relevant impact categories for this type of process. Due to the
high level of uncertainty, no assessment of NOx emissions in terms of potential eutrophication was
conducted.
In addition to emissions, some of the processes also produce solid waste. The waste from dolomite mining
can be used in the glass industry or as road construction material. The slag from the production process can
be used for cement production. Thanks to the magnesium content of the refining slag, this waste can be
used as primary magnesium substitute in the steel industry. When these solid wastes replace other primary
materials in other industries, these other primary materials do not have to be produced. As a result, using
the solid waste materials has the potential to save emissions, which could then be credited to the ESAN
primary magnesium production process.
ESAN LCA Study
7
3 Impact Assessment of Primary Magnesium Production at ESAN
3.1 Assessment of Global Warming Potential
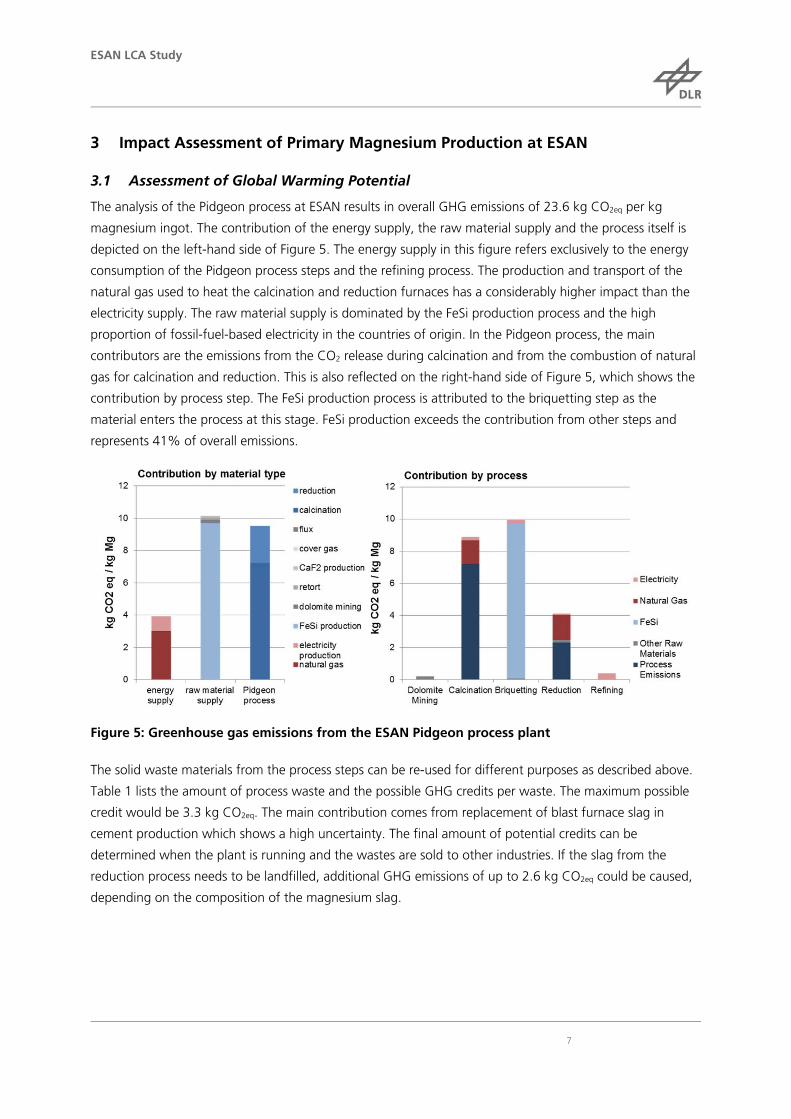
The analysis of the Pidgeon process at ESAN results in overall GHG emissions of 23.6 kg CO2eq per kg
magnesium ingot. The contribution of the energy supply, the raw material supply and the process itself is
depicted on the left-hand side of Figure 5. The energy supply in this figure refers exclusively to the energy
consumption of the Pidgeon process steps and the refining process. The production and transport of the
natural gas used to heat the calcination and reduction furnaces has a considerably higher impact than the
electricity supply. The raw material supply is dominated by the FeSi production process and the high
proportion of fossil-fuel-based electricity in the countries of origin. In the Pidgeon process, the main
contributors are the emissions from the CO2 release during calcination and from the combustion of natural
gas for calcination and reduction. This is also reflected on the right-hand side of Figure 5, which shows the
contribution by process step. The FeSi production process is attributed to the briquetting step as the
material enters the process at this stage. FeSi production exceeds the contribution from other steps and
represents 41% of overall emissions.
Figure 5: Greenhouse gas emissions from the ESAN Pidgeon process plant
The solid waste materials from the process steps can be re-used for different purposes as described above.
Table 1 lists the amount of process waste and the possible GHG credits per waste. The maximum possible
credit would be 3.3 kg CO2eq. The main contribution comes from replacement of blast furnace slag in
cement production which shows a high uncertainty. The final amount of potential credits can be
determined when the plant is running and the wastes are sold to other industries. If the slag from the
reduction process needs to be landfilled, additional GHG emissions of up to 2.6 kg CO2eq could be caused,
depending on the composition of the magnesium slag.
ESAN LCA Study
8
Table 1: Amount of solid waste per process and potential GHG credits
Waste Amount [kg / kg Mg]
Substituted Material (data from ecoinvent 3.1)
GHG Credit [kg CO2eq / kg Mg]
solid waste from dolomite mining
1.6 gravel or silica in road construction 0.02
dolomite in glass industry 0.03
slag from reduction process
6.1 ground granulated blast furnace slag in cement production
2.2 - 3.0
crushed limestone in cement production
0.02
slag from refining process
0.1 (11% Mg content)
primary Mg from CN in steel industry 0.3
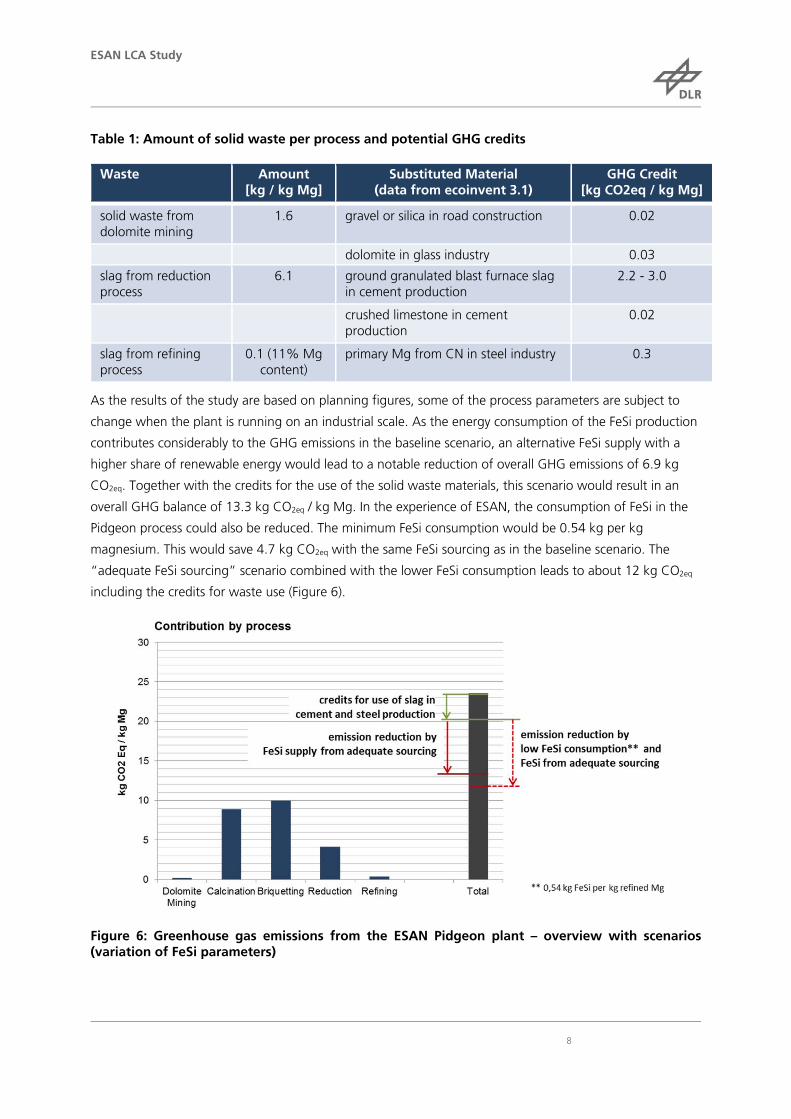
As the results of the study are based on planning figures, some of the process parameters are subject to
change when the plant is running on an industrial scale. As the energy consumption of the FeSi production
contributes considerably to the GHG emissions in the baseline scenario, an alternative FeSi supply with a
higher share of renewable energy would lead to a notable reduction of overall GHG emissions of 6.9 kg
CO2eq. Together with the credits for the use of the solid waste materials, this scenario would result in an
overall GHG balance of 13.3 kg CO2eq / kg Mg. In the experience of ESAN, the consumption of FeSi in the
Pidgeon process could also be reduced. The minimum FeSi consumption would be 0.54 kg per kg
magnesium. This would save 4.7 kg CO2eq with the same FeSi sourcing as in the baseline scenario. The
“adequate FeSi sourcing” scenario combined with the lower FeSi consumption leads to about 12 kg CO2eq
including the credits for waste use (Figure 6).
Figure 6: Greenhouse gas emissions from the ESAN Pidgeon plant – overview with scenarios (variation of FeSi parameters)
ESAN LCA Study
9
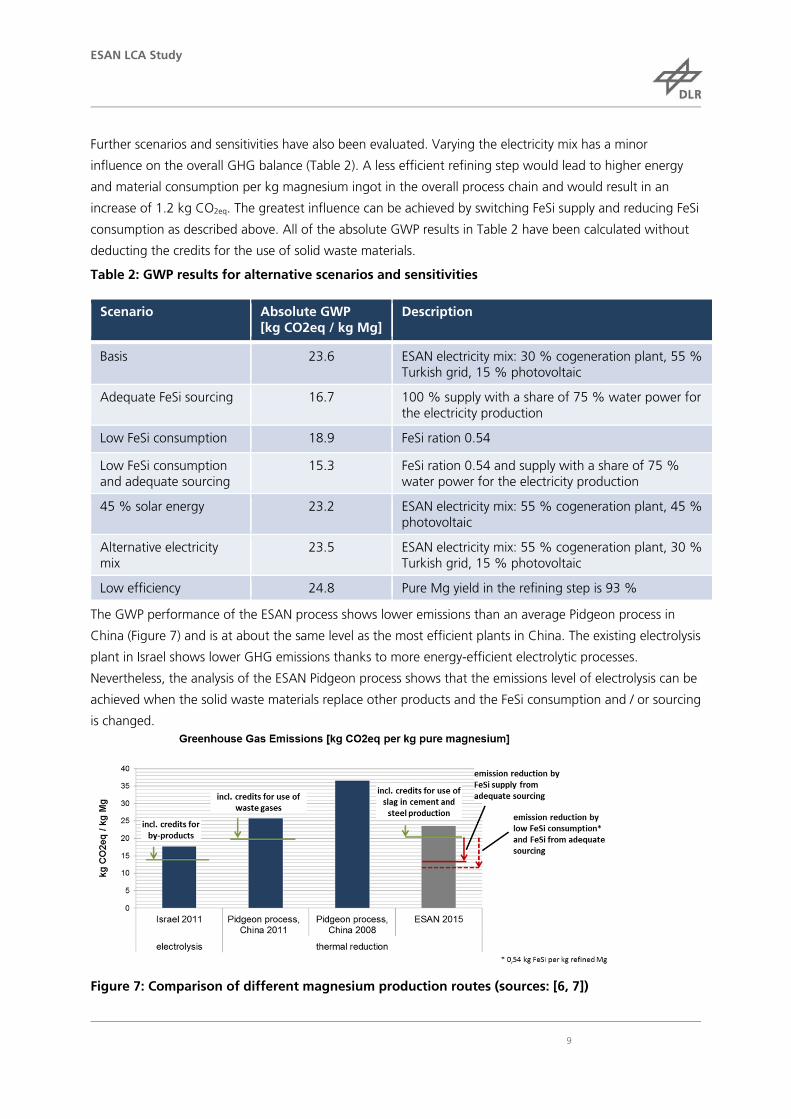
Further scenarios and sensitivities have also been evaluated. Varying the electricity mix has a minor
influence on the overall GHG balance (Table 2). A less efficient refining step would lead to higher energy
and material consumption per kg magnesium ingot in the overall process chain and would result in an
increase of 1.2 kg CO2eq. The greatest influence can be achieved by switching FeSi supply and reducing FeSi
consumption as described above. All of the absolute GWP results in Table 2 have been calculated without
deducting the credits for the use of solid waste materials.
Table 2: GWP results for alternative scenarios and sensitivities
Scenario Absolute GWP [kg CO2eq / kg Mg]
Description
Basis 23.6 ESAN electricity mix: 30 % cogeneration plant, 55 % Turkish grid, 15 % photovoltaic
Adequate FeSi sourcing 16.7 100 % supply with a share of 75 % water power for the electricity production
Low FeSi consumption 18.9 FeSi ration 0.54
Low FeSi consumption and adequate sourcing
15.3 FeSi ration 0.54 and supply with a share of 75 % water power for the electricity production
45 % solar energy 23.2 ESAN electricity mix: 55 % cogeneration plant, 45 % photovoltaic
Alternative electricity mix
23.5 ESAN electricity mix: 55 % cogeneration plant, 30 % Turkish grid, 15 % photovoltaic
Low efficiency 24.8 Pure Mg yield in the refining step is 93 %
The GWP performance of the ESAN process shows lower emissions than an average Pidgeon process in
China (Figure 7) and is at about the same level as the most efficient plants in China. The existing electrolysis
plant in Israel shows lower GHG emissions thanks to more energy-efficient electrolytic processes.
Nevertheless, the analysis of the ESAN Pidgeon process shows that the emissions level of electrolysis can be
achieved when the solid waste materials replace other products and the FeSi consumption and / or sourcing
is changed.
Figure 7: Comparison of different magnesium production routes (sources: [6, 7])
ESAN LCA Study
10
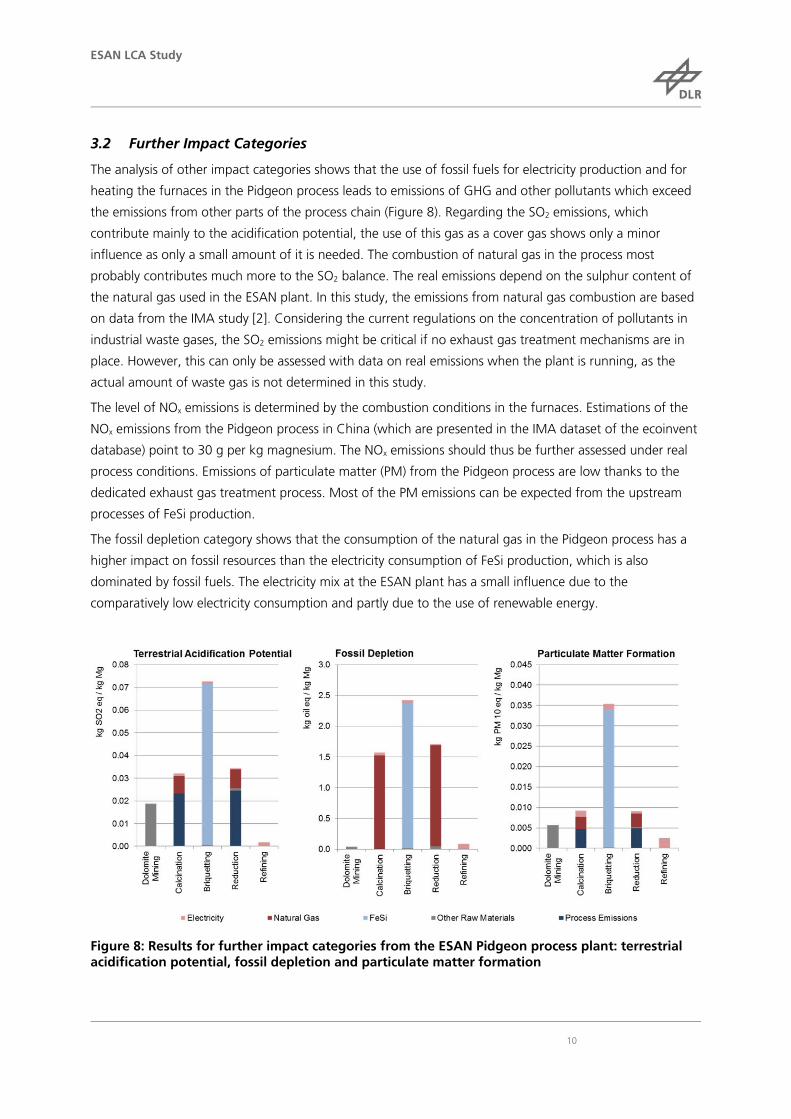
3.2 Further Impact Categories
The analysis of other impact categories shows that the use of fossil fuels for electricity production and for
heating the furnaces in the Pidgeon process leads to emissions of GHG and other pollutants which exceed
the emissions from other parts of the process chain (Figure 8). Regarding the SO2 emissions, which
contribute mainly to the acidification potential, the use of this gas as a cover gas shows only a minor
influence as only a small amount of it is needed. The combustion of natural gas in the process most
probably contributes much more to the SO2 balance. The real emissions depend on the sulphur content of
the natural gas used in the ESAN plant. In this study, the emissions from natural gas combustion are based
on data from the IMA study [2]. Considering the current regulations on the concentration of pollutants in
industrial waste gases, the SO2 emissions might be critical if no exhaust gas treatment mechanisms are in
place. However, this can only be assessed with data on real emissions when the plant is running, as the
actual amount of waste gas is not determined in this study.
The level of NOx emissions is determined by the combustion conditions in the furnaces. Estimations of the
NOx emissions from the Pidgeon process in China (which are presented in the IMA dataset of the ecoinvent
database) point to 30 g per kg magnesium. The NOx emissions should thus be further assessed under real
process conditions. Emissions of particulate matter (PM) from the Pidgeon process are low thanks to the
dedicated exhaust gas treatment process. Most of the PM emissions can be expected from the upstream
processes of FeSi production.
The fossil depletion category shows that the consumption of the natural gas in the Pidgeon process has a
higher impact on fossil resources than the electricity consumption of FeSi production, which is also
dominated by fossil fuels. The electricity mix at the ESAN plant has a small influence due to the
comparatively low electricity consumption and partly due to the use of renewable energy.
Figure 8: Results for further impact categories from the ESAN Pidgeon process plant: terrestrial acidification potential, fossil depletion and particulate matter formation
ESAN LCA Study
11
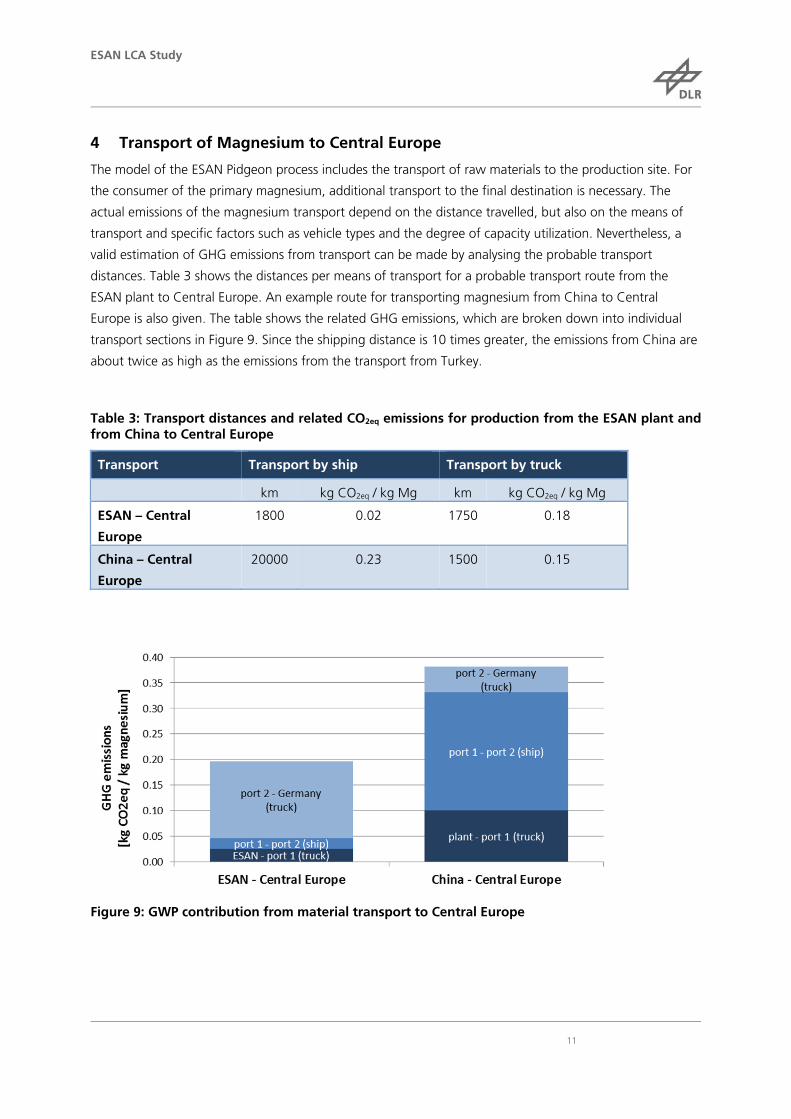
4 Transport of Magnesium to Central Europe
The model of the ESAN Pidgeon process includes the transport of raw materials to the production site. For
the consumer of the primary magnesium, additional transport to the final destination is necessary. The
actual emissions of the magnesium transport depend on the distance travelled, but also on the means of
transport and specific factors such as vehicle types and the degree of capacity utilization. Nevertheless, a
valid estimation of GHG emissions from transport can be made by analysing the probable transport
distances. Table 3 shows the distances per means of transport for a probable transport route from the
ESAN plant to Central Europe. An example route for transporting magnesium from China to Central
Europe is also given. The table shows the related GHG emissions, which are broken down into individual
transport sections in Figure 9. Since the shipping distance is 10 times greater, the emissions from China are
about twice as high as the emissions from the transport from Turkey.
Table 3: Transport distances and related CO2eq emissions for production from the ESAN plant and from China to Central Europe
Transport Transport by ship Transport by truck
km kg CO2eq / kg Mg km kg CO2eq / kg Mg
ESAN – Central
Europe
1800 0.02 1750 0.18
China – Central
Europe
20000 0.23 1500 0.15
Figure 9: GWP contribution from material transport to Central Europe
ESAN LCA Study
12
5 Conclusions
The study shows that the emissions from the ESAN Pidgeon process are lower than from an average plant
in China and are about the same as efficient Chinese Pidgeon process plants. The further use of the solid
process wastes in other industries is beneficial and could be credited with up to 3.4 kg of CO2eq depending
on their final end use. Emissions could be lowered by reducing the use of FeSi or by using an alternative
source which uses a higher share of renewable electricity. It would also be preferable to reduce
consumption of natural gas, but this would have a lower impact compared to FeSi supply. This mechanism
does not only apply to the GWP impact category, but also to other categories assessed, as the use of
energy based on fossil fuel resources and the resulting emissions into the atmosphere have the most
environmental impact. The direct emission of CO2 from dolomite conversion in the calcination process step
also has a notable contribution, but is unavoidable in this method of magnesium production.
Regarding the transport of the magnesium to the consumer, the location of the ESAN plant has significant
benefits for customers in Europe. It can be expected that the GHG emissions of material transport from the
ESAN plant are about half those of transport from China in the case of the representative transport routes
considered in this study.
6 Sources
1. USGS, Magnesium Metal Statistics 2014, in Mineral Commodity Summaries, E.L. Bray, Editor 2015.
2. Ehrenberger, S., H. Dieringa, and H.E. Friedrich, Life Cycle Assessment of Magnesium Components in Vehicle Construction, 2013, German Aerospace Centre, Institute of Vehicle Concepts: Stuttgart. p. 109.
3. OECD / IEA, Electricity Information 2014 with 2013 data, in IEA Statistics2014, Paris. 4. OECD / IEA, Energy Supply Security 2014, 2014: Paris. 5. Goedkoop, M., et al., ReCiPe 2008, A life cycle impact assessment method which
comprises harmonised category indicators at the midpoint and the endpoint level; Report 1: Characterisation; First edition (Version 1.08), 2013, Ruimte en Milieu Ministerie van Volkshuisvesting.
6. Ehrenberger, S., H. Dieringa, and H.E. Friedrich, Life Cycle Assessment of Magnesium Components in Vehicle Construction, 2013, Deutsches Zentrum für Luft- und Raumfahrt.
7. Gao, F., et al., Life cycle assessment of primary magnesium production using the Pidgeon process in China. The International Journal of Life Cycle Assessment, 2009. 14(5): p. 480-489.