lipid thermotropic transitions in triatoma infestans lipophorin
TRANSCRIPT

Lipid thermotropic transitions in Triatoma infestans lipophorin
Jose Luis Soulages, Omar Jorge Rimoldi, and Rodolfo R. Brenner'
Instituto de Investigaciones Bioquimicas de La Plata (INIBIOLP), CONICET-UNLP, Facultad de Ciencias MCdicas, Calles 60 y 120, (1900) La Plata, Argentina
Abstract The structure and lipid thermotropic transitions of highly purified lipophorin of Triatoma infestam were examined by several techniques: steady-state fluorescence polarization of 1,6-diphenyl-1,3,5-hexatriene (DPH), cis-parinaric acid (cis-PnA) and tram-parinaric acid (tram-PnA), light scattering fluorescence energy transfer between the lipophorin tryptophan residues and the bound chromophores, DPH, tram-parinaric acid cis-parinaric acid, gel electrophoresis, and gel filtration. Fluorescence polari- zation of PnAs and DPH revealed a reversible lipid thermo- tropic transition in intact lipophorin at about 2OoC and 18OC, respectively. In lipophorin, lipid dispersion fluorescence polari- zation of DPH detected a lipid transition approximately at 2OoC, while tram-PnA showed a gel phase formation at a temper- ature below 3OOC. Similar experiments in which tram-PnA was incorporated into diacylglycerols and phospholipids extracted from the lipophorin revealed gel phase formation below 3OoC and 24OC, respectively. Light scattering measurements showed that lipophorin particles aggregate irreversibly at 45OC, increas- ing the molecular weight, as determined by gel filtration on Sephacryl S-300, from 740,000 to values larger than 1,500,000. The particle aggregation did not change the physical properties of the lipophorin studied by fluorescence polarization, indicating that the aggregation is apparently a non-denaturing process. Energy transfer between the lipophorin tryptophans and the bound chromophores cis-PnA, tram-PnA, and DPA revealed a different location of the fluorescent probes within the lipophorin. Temperature-dependence on the energy transfer efficiency for all probes confirmed a change in the ordering of the lipophorin lipids at 24'C-Soulages, J. L., 0. J. Rimoldi, and R. R. Brenner. Lipid thermotropic transitions in Triatoma infestam lipophorin. J. Lipid Res. 1988. 29: 172-182.
Supplementary key words fluorescence probes diacylglycerol phospholipids fluorescence polarization
Ultracentrifugation of Triatoma infestans hemolymph yields three lipoprotein fractions: a high density lipopro- tein (HDL) and two very high density lipoproteins. HDL is largely the principal carrier of lipid, transporting diacylglycerols from storage sites, but also from absorp- tion sites, to other tissues (1, 2). HDL corresponds to the lipoprotein designated lipophorin by Chino et al. (3). Diacylglycerols, phospholipids, and hydrocarbons are the principal components of lipophorin (1).
The metabolism of insect lipophorins may be a func- tion of their composition, structure, and physical proper- ties, which can be altered under different physiological conditions and temperature.
It has been shown that, in locust, the lipoprotein diacyl- glycerols and molecular weight are elevated several-fold in response to adipokinetic hormone release (4-7).
Phospholipids of locust lipophorin are on the surface of the particle (8) and hydrocarbons appear to occur as a nonpolar domain within the lipophorin having two endo- thermic peaks centered at ll°C and 36OC (9).
Studies of lipophorin structure are at an early stage, and no information about the problems of protein-lipid interactions and of the state and organization of lipids in the presence or absence of proteins has been reported yet.
Fluorescent probes have been very useful to elucidate structural and dynamic properties of human or animal lipoprotein lipids (10-13). Schroeder, Goh, and Heimberg (14) and Sklar et al. (15) have shown that the fluorescent probe 1,6-diphenyl-1,3,5-hexatriene (DPH) is located in the interior core of human lipoproteins, while tram- parinaric acid (trans-PnA) is exclusively located on the surface of the lipoprotein particles. Moreover, M a r , Miljanich, and Dratz (16) showed that trans-PnA, due to its high solubility and quantum yield in gel phases, is a useful fluorescent probe to detect low proportions of this phase, while cis-PnA has the same solubility in both gel or liquid crystalline phases. The fluorescence polarization of these three probes embedded into the lipophorin may give valuable information on different structural aspects and temperature-dependent changes of the lipophorin lipids. Moreover, resonance energy transfer from the apoprotein tryptophan residue to these three fluorescent probes can
Abbreviations: HDL, high density lipoproteins; DPH, 1,6-diphenyl- 1,3,5-hexatriene; cis-PnA, cis-parinaric acid; trans-PnA, trans-parinaric acid; DG, diacylglycerol; PL, phospholipid.
'Member of the Carrera del Investigador Cientifico, Consejo Nacional de Investigaciones Cientificas y Tkcnicas, Argentina.
172 Journal of Lipid Research Volume 29, 1988
by guest, on Novem
ber 21, 2018w
ww
.jlr.orgD
ownloaded from

give information about the relative localization of the apoproteins in the surface or core of the lipoprotein particle (10, 14, 17).
In the present report, temperature-dependence on the fluorescence polarization of DPH, trans-PnA and cis-PnA, energy transfer experiments, and 90’ light scattering were employed to examine structure and lipid thermo- tropic transitions in the 5O-6OoC temperature range. The term lipid thermotropic transition is used in a general sense to denote a thermally induced change in the physical state of the lipophorin lipids. The change might involve order-disorder transitions of the liquid crystalline to gel type, lateral phase separations, or lipid clusters (18).
MATERIALS AND METHODS
Insects
Adult female T infeetans, reared on hen blood twice a week and maintained at 28OC and 60-70% humidity in our laboratory, were used. Seven or 8 days after the last moult, the insects were fed and then fasted for 5 days prior to the collection of the hemolymph.
Collection of hemolymph
Insects were anesthesized by ice cooling. To collect hemolymph, the legs were cut off and the insect was placed in a precooled centrifuge tube with the head towards the pointed end and centrifuged for 1 min at 120 g and 4OC. Hemolymph was then centrifuged at 4OC and 10,000 g for 10 min to remove hemocytes. Darkening of hemolymph by air exposure was prevented by addition of 5 mmol/ml hemolymph of N-acetyl-L-cysteine.
Isolation of lipophorin
Hemolymph was ultracentrifuged to fractionate the lipoproteins, using a procedure similar to that described by Fichera and Brenner (1). Three m1 of NaBr solution (density 1.28 g/ml) was placed in a centrifuge tube and 1 m1 of hemolymph was carefully layered over the solution and centrifuged at 178,850 g at 10°C for 20 hr. The lipophorin band was removed by aspiration. For purifica- tion of lipophorin, this fraction was mixed with NaCl solution (d 1.006 g/ml) to a total volume of 1 m1 and layered over 3 m1 of NaBr solution (density 1.18 g/ml) and centrifuged at 178,800 g at 10°C for 10 hr. Lipophorin was dialyzed at 4OC for 24 hr against 50 mM potassium phos- phate buffer, pH 7.2, 130 mM NaCl, and 1 mM EDTA.
Determination of the lipophorin size
The Stokes radius was estimated by gel permeation on Sephacryl S-300 column (80 x 1.6 cm) and eluted with the dialysis buffer at a flow rate of 20 ml/hr at room tem- perature. Fractions of 2 m1 were collected and peak frac-
tions were detected by absorbance at 280 nm. High molecular weight calibration standards (Pharmacia Fine Chemicals) were used to estimate molecular weight, and void volume was measured with Blue Dextran (Pharma- cia). Stokes radius (R,) was estimated by gel filtration using a calibration curve in which R, was plotted against (-log K,)”‘. The partition coefficient K, was calcu- lated according to
where V, is the elution volume, V. and V, are void and total volumes, respectively.
Gel electrophoresis
Non-dissociating polyacrylamide slab-gel electrophore- sis was performed in 5% resolving gel with l cm of 3.75% stacking gel following the method of Frings, Foster, and Cohen (19). The gel was stained with Coomassie Blue G-250.
Lipid extraction and separation
Total lipids were extracted from the lipoproteins by the method of Folch, Lees, and Sloane Stanley (20). Diacyl- glycerols were separated by thin-layer chromatography (TLC) on silica gel G plates developed in hexane- diethylether-acetic acid 80:20:2 (v/.) as solvent mixture. Appropriate standards were visualized by exposure to iodine vapor. Unexposed diacylglycerol zones were scraped off the plate and extracted with chloroform-methanol- hexane 2:1:3 (v/.). The total lipid extract (in chloroform) was chromatographed on a column packed with silicic acid (Mallinckrodt 100 mesh). Neutral lipids were eluted with chloroform and phospholipids were eluted with methanol.
Spectroscopic measurements
An Aminco-Bowman spectrofluorometer was used for the fluorescence and 90° light-scattering experiments. For the polarization measurements, the spectrofluorometer was equipped with two Glan Thompson polarizers. The polarization alignment was verified using fluorescein in alkaline glycerol at 10°C (21). The polarization ratio P is defined as 11 1/IL . G. 11 I and IL refer to intensities emitted, parallel and perpendicular, respectively, to the vertically polarized excitation, and G is a factor for instru- ment correction (22). The maximum reached by P in this system was 2.75 * 0.05. Excitation wavelengths of 360, 315, and 320 nm, and emission wavelengths of 430, 420, and 410 nm were used for fluorescence polarization of DPH, trans-PnA, and cis-PnA, respectively. A 2.0” NaNO, solution placed between the emission mono- chromator and the photomultiplier was used as a cut-off filter for the wavelengths below 390 nm. Light scattering
Soulages, Rimoldi, and Brenner Lipid thermotropic transitions in lipophorin 173
by guest, on Novem
ber 21, 2018w
ww
.jlr.orgD
ownloaded from

was less than 5 % and 15 in the fluorescence polarization of DPH and PnA, respectively. Unlabeled samples with the same concentration of the labeled samples were used as reference blanks which served to correct for the exci- tant light-scattering and other contributions to the fluorescence signal.
The steady-state fluorescence anisotropy (rs) of DPH was calculated using the equation:
P - l r, = ____
P + 2
where P is the polarization ratio previously defined. Temperature was monitored by a thermocouple inserted
directly into the cuvette. Flourescence quenching and uncorrected emission
spectra were measured in 10 x 10 mm cuvettes. Correc- tions by the inner filter-effect never exceeded 10% of the fluorescence intensity. Tryptophan excitation was per- formed at 280 nm to reduce direct excitation of the fluorescent probes.
Preparation of lipophorin and lipid dispersion for the fluorescence measurements
Lipophorin (250 pg of proteidml) suspended in 50 mM potassium phosphate buffer, pH 7.2, was labeled by adding 3-5 p1 of trans-PnA or cis-PnA (PL-Biochemicals) in ethanolic solution, or DPH (Aldrich Chemical Co.) in tetrahydrofurane. The concentration of the parinaric acids in stock solution was determined by measuring ab- sorbance using the extinction molar coefficients of Sklar et al. (23), and DPH concentration was determined in hexane according to Shinitzky and Barenholz (24). The particle concentration was calculated from the protein content determined by the method of Lowry et al. (25) in the presence of SDS using bovine serum albumin standard. Lipid samples were dried under N2 in the tubes and then sonicated in 50 mM potassium phosphate buffer, pH 7.2, at 40-45OC, for 10 min in a Heat System sonicator. In both lipid dispersion or lipophorin suspensions, the molar ratio of DPH to lipids was about 1:250, and the PnA to lipid molar ratio was about 1300.
Binding studies
The binding of trans-parinaric acid and cis-parinaric acid was studied by fluorescence enhancement, according to the method described by Sklar (26). The partition constant K, defined as:
K, =
moles of bound PnNmoles lipophorin superficial lipids
moles of free PnA/moles of H20
was obtained from the slope of the double reciprocal plot
of I” against moles of HzO/moles of superficial lipids (SL). It is based on the equation:
1 1 1 mol HzO
I I,,, K, I,,, mol SL
where I,,, is the maximal fluorescence intensity of PnA calculated from the y intercept. The moles of superficial lipids were calculated from the weight percent of the phos- pholipids, cholesterol, and diacylglycerols of the lipopho- rin (l), using the following molecular weights: DG = 626; PL = 780; and cholesterol = 386.
Calculation of Arrhenius plots
~~ - - ~- + ____.” .
To determine the best fits and the breakpoints of the Ar- rhenius plot, data obtained in the fluorescence anisotropy studies were processed as follows.
A linear plot was computed for the first three data points and a second line was computed for the remainder of the data points by least squares fit. The variance of the data points around the two lines was computed. This was repeated for the first four points, five points, etc., until all possible two-line fits were computed. The fit with the minimum variance was chosen as the best two-line fit. To decide whether the best two-line fit was significantly better than the best one-line fit (least square fit of all the data points), an F test was performed to approximate the statistical significance of the difference in variance between one-line fit and the two-line fit. No two-line fit was accepted unless the F test indicated statistical significance ( P < 0.05).
Other methods
Phospholipids were determined by the method of Chen, Toribara, and Huber (27); total lipids were determined gravimetrically; and diacylglycerols were determined by gas-liquid chromatography in a Hewlett Packard model 5840-A, calculating the content of fatty acid methyl esters employing 1,2-dieicosaenoylglycerol as an internal standard.
RESULTS
Lipophorin isolation, purity, and size
As shown in Fig. 1, native gel electrophoresis of our lipophorin preparation demonstrates a single major band with small amounts as aggregated material that can be attributed to the so-called “ 0 lipophorin (28). After Sephacryl S-300 gel filtration, lipophorin emerged as a single symmetrical peak, and no protein peaks were eluted either before or after the lipophorin peak. The lipophorin preparation was homogeneous in size and no significant contamination with either larger or smaller
174 Journal of Lipid Research Volume 29, 1988
by guest, on Novem
ber 21, 2018w
ww
.jlr.orgD
ownloaded from

a b
Fig. 1. Native polyacrylamide g e l electrophoresis of lipophorin after second density gradient ultracentrifugation (lane a), and whole hemo- lymph (lane b). Analyses were in 5% resolving g e l with 3.75% of stack- ing gel. The arrow indicates the origin of separating g e l .
proteins could be detected. A value of 73 A was obtained for the T infctuns lipophorin Stokes radius. It indicates that injoturn lipophorin size is in the range of the other insect lipophorins (29).
Fluorescence polarization studies
Within several limitations (30), the fluorescence aniso- tropy is inversely related to the relative motional freedom of the fluorophore in the lipids and provides thereby an indication of the "fluidity" of lipid molecules in the lipo- protein particles. In order to determine the contribution of the different lipid classes and apoproteins to the overall lipid dynamics in intact lipophorins, and to obtain a better understanding of the thermotropic behavior of the lipophorin lipids, the temperature-dependence on the flu- orescence polarization of DPH, tmns-PnA, and cis-PnA was studied in purified intact lipophorin. In addition, the total lipophorin lipids and the two major lipidic compo- nents of the lipophorin (1). diacylglycerols and phospho- lipids, were examined by fluorescence polarization of DPH and fmns-PnA. Arrhenius plots of the fluorescence anisotropy of DPH are shown in Fig. 2, and Table 1 sum- marizes the values of the breakpoints observed in the lipophorin and lipophorin components. As determined by linear regression analysis, the data for lipoprotein, total
lipids, and total diacylglycerols fit best in a two-slope plot. A breakpoint at around 18OC was found in whole lipopho- rin, while total lipophorin lipids and diacylglycerols showed higher breakpoints at 2OoC and 26OC, respec- tively. Fig. 2 shows heating curves. However, cooling curves of lipophorin produced similar breakpoints and no significant hysteresis was detected.
Lipophorin hydrocarbons comprise a 10% (w/w) of the injotmu lipophorin lipids (1). Hydrocarbons can be
incorporated into the lipophorin by incubation of an aqueous lipophorin suspension with the extracted and purified hydrocarbon fraction. Incorporation of an addi- tional 10% of hydrocarbons into the native lipophorin evoked only a slight increase of the fluorescence anisotropy of DPH and a 3OC increase of the breakpoint tempera- ture (data not shown).
Fluorescence anisotropy values show that phospholipids are the most fluid components of the lipophorin, and the comparison between the r, values of the total lipid disper- sion and the intact lipophorin (Fig. 2 and Table l), indi-
p"
I
3.00 3.20 3.40 3.60
111 ( * t ~ ' l ( K " \
Fig. 2. Arrhenius plots of steady-state anisotropy of fluorescence of DPH in DPPC (+), intact lipophorin (O), total lipophorin lipid disper- sion (A), total lipophorin diacylglycerol dispersion (A), and total lipophorin phospholipid dispersion (a).
Soula.qes, Rimoldi, and Rmnn Lipid thermotropic transitions in lipophorin 175
by guest, on Novem
ber 21, 2018w
ww
.jlr.orgD
ownloaded from
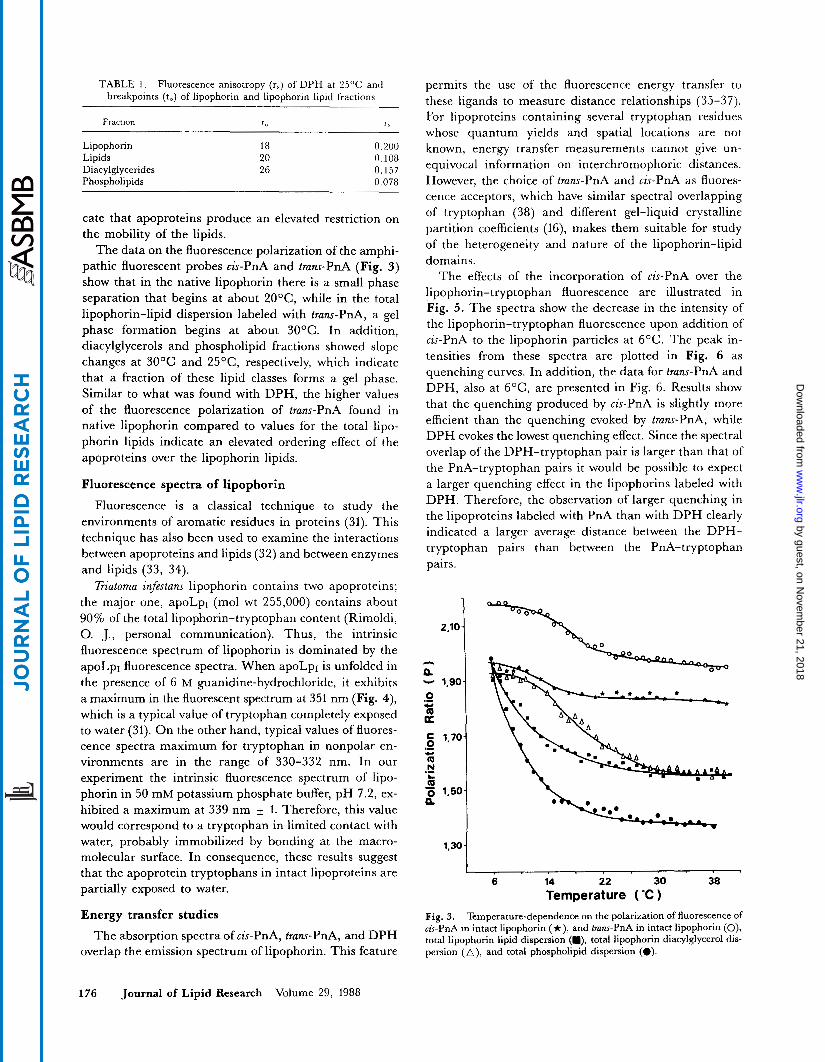
TABLE 1. Fluorescence anisotropy (rs) of DPH at 25°C and breakpoints (to) of lipophorin and lipophorin lipid fractions
Fraction t" K'
Lipophorin 18 0.200 Lipids 20 0.108 Diacylglycerides 26 0.157 Phospholipids 0.078
cate that apoproteins produce an elevated restriction on the mobility of the lipids.
The data on the fluorescence polarization of the amphi- pathic fluorescent probes cis-PnA and trans-PnA (Fig. 3) show that in the native lipophorin there is a small phase separation that begins at about 2OoC, while in the total lipophorin-lipid dispersion labeled with trans-PnA, a gel phase formation begins at about 3OOC. In addition, diacylglycerols and phospholipid fractions showed slope changes at 3OoC and 25OC, respectively, which indicate that a fraction of these lipid classes forms a gel phase. Similar to what was found with DPH, the higher values of the fluorescence polarization of trans-PnA found in native lipophorin compared to values for the total lipo- phorin lipids indicate an elevated ordering effect of the apoproteins over the lipophorin lipids.
Fluorescence spectra of lipophorin
Fluorescence is a classical technique to study the environments of aromatic residues in proteins (31). This technique has also been used to examine the interactions between apoproteins and lipids (32) and between enzymes and lipids (33, 34).
Triatoma infestans lipophorin contains two apoproteins; the major one, apoLpl (mol wt 255,000) contains about 90% of the total lipophorin-tryptophan content (Rimoldi, 0. J., personal communication). Thus, the intrinsic fluorescence spectrum of lipophorin is dominated by the apoLpI fluorescence spectra. When apoLpI is unfolded in the presence of 6 M guanidine-hydrochloride, it exhibits a maximum in the fluorescent spectrum at 351 nm (Fig. 4), which is a typical value of tryptophan completely exposed to water (31). On the other hand, typical values of fluores- cence spectra maximum for tryptophan in nonpolar en- vironments are in the range of 330-332 nm. In our experiment the intrinsic fluorescence spectrum of lipo- phorin in 50 mM potassium phosphate buffer, pH 7.2, ex- hibited a maximum at 339 nm 5 1. Therefore, this value would correspond to a tryptophan in limited contact with water, probably immobilized by bonding at the macro- molecular surface. In consequence, these results suggest that the apoprotein tryptophans in intact lipoproteins are partially exposed to water.
Energy transfer studies
The absorption spectra of cis-PnA, trans-PnA, and DPH overlap the emission spectrum of lipophorin. This feature
176 Journal of Lipid Research Volume 29, 1988
permits the use of the fluorescence energy transfer to these ligands to measure distance relationships (35-37). For lipoproteins containing several tryptophan residues whose quantum yields and spatial locations are not known, energy transfer measurements cannot give un- equivocal information on interchromophoric distances. However, the choice of trans-PnA and cis-PnA as fluores- cence acceptors, which have similar spectral overlapping of tryptophan (38) and different gel-liquid crystalline partition coefficients (16), makes them suitable for study of the heterogeneity and nature of the lipophorin-lipid domains.
The effects of the incorporation of cis-PnA over the lipophorin-tryptophan fluorescence are illustrated in Fig. 5 . The spectra show the decrease in the intensity of the lipophorin-tryptophan fluorescence upon addition of cis-PnA to the lipophorin particles at 6OC. The peak in- tensities from these spectra are plotted in Fig. 6 as quenching curves. In addition, the data for trans-PnA and DPH, also at 6OC, are presented in Fig. 6. Results show that the quenching produced by cis-PnA is slightly more efficient than the quenching evoked by trans-PnA, while DPH evokes the lowest quenching effect. Since the spectral overlap of the DPH-tryptophan pair is larger than that of the PnA-tryptophan pairs it would be possible to expect a larger quenching effect in the lipophorins labeled with DPH. Therefore, the observation of larger quenching in the lipoproteins labeled with PnA than with DPH clearly indicated a larger average distance between the DPH- tryptophan pairs than between the PnA-tryptophan pairs.
2.10.
a - 1,90
.- 0
0 c
a c 1.70 0
m N
.- c
.- m' n 5 1,50
1.30
6 14 22 30 38 Temperature ( 'C )
Fig. 3. Temperature-dependence on the polarization of fluorescence of cis-PnA in intact lipophorin (*), and ~runs-PnA in intact lipophorin (O), total lipophorin lipid dispersion (m), total lipophorin diacylglycerol dis- persion (A) , and total phospholipid dispersion (0).
by guest, on Novem
ber 21, 2018w
ww
.jlr.orgD
ownloaded from

1 b - K c
250 350 450 550
Emission Wavelength Fig. 4. Fluorescence spectra of: a) apolpl, 50 pg of protein/ml in 6 M guanidine hydrochloride; b) lipophorin, 200 pg of protein/ml in potas- sium phosphate buffer, pH 7.2; c) tryptophan, 60 FM, in potassium phosphate buffer, pH 7.2.
Approximate temperature-dependence of lipophorin fluorescence quenching was also recorded. Fig. 7 shows that a temperature increase from 24" to 3OoC evokes a sharp decrease in the energy transfer efficiency for all the probes used and the values at lower temperatures are in good agreement with those of Fig. 6.
One possible reason for the change in the PnA quench- ing efficiency could be due to a change in the amount of the polyene fatty acid chromophore in the lipophorin. Decreased quenching efficiency of parinaric acids above 24OC could be due to a decreased association of the probes with the lipophorin. This possibility was examined by determining the binding association constants of poly- ene fatty acid probes at 6OC and 37OC. Fig. 8a shows the binding titration curves obtained at 6OC and Fig. 8b shows the double reciprocal plots of the data of Fig. 8a. At 6OC, K, values of 7.2 x lo6 and 2.9 x lo6 were found for cis-PnA and trans-PnA, respectively, whereas K, values of 5.6 x lo6 and 3.3 x lo6 were found at 37OC for cis-PnA and trans-PnA, respectively. Thus, this factor cannot evoke a variation of the tryptophan fluorescence intensity, since more than 98% of the added parinaric acids was bound at any temperature in the working conditions of the experi- ments.
Light scattering studies
Light scattering techniques can render information about the lipid thermotropic transitions in membranes
and lipoproteins (39, 40) and can also give information about the particle size or particle size changes. Fig. 9 shows the temperature-dependence on the 90' light scat- tering of lipophorin suspension studied in the 5O-6OoC temperature range. The heating curve shows that between 22' and 44OC there is a sharp decrease in the light scat- tering intensity, while above 44OC the light scattering intensity increases at least up to 62OC. The curves also show that when the lipophorin suspension was heated to 32OC, the cooling curve gave results similar to the heating curves, indicating a reversible process. However, when the lipophorin suspension was heated up to 6OoC and then cooled, a different curve was obtained, indicating that above 44OC an irreversible process is produced. The decrease in the light scattering intensity that begins at 22OC is a typical change observed in order-disorder transitions, while the increase in the light intensity ob- served above 44OC can be explained by the size increase of the particles. The size increase was further investigated by heating a lipophorin suspension at 50°C for 20 min and applying the sample in a chromatography gel-liltration column packed with Sephacryl S-300. After this process no lipophorin peak was detected and all the sample eluted in the void volume, indicating that, in our working condi- tions and at temperatures higher than 44OC, the lipopho- rin particles aggregate irreversibly to form particles with molecular weights larger than 1,500.
1
250 ' 350 ' 450 . 550
Emission Wavelength
Fig. 5. Quenching curves. Fluorescence emission spectra of lipophorin particles were recorded as described in Material and Methods. Aliquots of a stock ethanolic solution of 0.22 mM cir-PnA were added to 2 m1 of lipophorin resuspended at a final concentration of 300 pg of proteidml. Sample temperature was 6%
Soulages, Rimoldi, and Brenner Lipid thermotropic transitions in lipophorin 177
by guest, on Novem
ber 21, 2018w
ww
.jlr.orgD
ownloaded from

, 1 2 3 4
moles Probe/moles Lipophorin
Fig. 6. Decrease in lipophorin tryptophan fluorescence quenching by cis-PnA (O), Irans-PnA (e), and DPH (+). Percent of control fluores- cence was determined from emission curves as described in the legend to Fig. 5. Lipophorin:probe molar ratios were calculated using a lipophorin molecular weight value of 740,000. Results are the mean of three determinations SD.
DISCUSSION
T infestans lipophorin is a lipid-transporting lipoprotein with a density between 1.11 and 1.15 g/ml (1). The lipid content is high, 30 to 50%, but with a completely different composition compared to vertebrate lipoproteins (41). Unlike lipoproteins from vertebrates it contains high amounts of diacylglycerols (29.2%) and hydrocarbons (lO.O%), and low amounts of triacylglycerols (6.6%). It also contains phospholipids (31.4%), cholesterol (9.4%), and cholesteryl esters (3.9%). The two main phospho- lipids are phosphatidylethanolamine and phosphatidyl- choline. But phosphatidylethanolamine (67.6%) predomi- nates over phosphatidylcholine (32.4%). The fatty acid composition of lipophorin lipids has been already reported (1, 41) and shows the predominance of fatty acids of 16 and 18 carbons, mainly oleic, palmitic, and stearic acids. Linoleic acid is also present in a fairly constant propor- tion of about 7%.
At least two types of thermally induced structural changes take place in the Triatoma inf~tuns lipophorin within the 5O-6OoC temperature range: U ) a reversible lipid thermotropic transition in intact lipophorin particles and 6 ) an irreversible lipoprotein particle aggregation.
The reversible lipid thermotrophic transition in native lipophorin that falls at about 2OoC and 18OC has been shown by fluorescence polarization of PnAs and DPH, respectively. Correspondingly a lipid transition at about 20°C has been detected in the total lipophorin lipid dis-
I - 10 20 30 40
Temperature ( "C 1
Fig. 7. Temperature-dependence on the tryptophan fluorescence quenching by cis-PnA (A), tmnr-PnA (e), and DPH (0). Lipophorin concentration was 300 fig of proteinhl and mole ratios of probe:lipophorin were 3:l for all the probes. Excitation wavelengths were 280 nm and emission wavelengths were 340 nm. Temperature was increased at the rate of approximately l0C/min, using a circulating water bath.
178 Journal of Lipid Research Volume 29, 1988
by guest, on Novem
ber 21, 2018w
ww
.jlr.orgD
ownloaded from

Pkomdes of Lipophorin 40 l20 200 280
cis-PnA -
F trans - PnA
1 2 3 4 5 - e 7 e
mol H20/mol superf iciei lipids
Fig. 8. The binding of cir-PnA and tram-PnA to lipophorin as deter- mined by fluorescence enhancement at 6OC. A) Fluorescence intensity of parinaric acids. The concentration for cir-PnA was 1.5 pM and for tmnr-PnA 0.8 PM. Lipophorin was added as microliter aliquots from a stock solution of 5 mg of protein/ml. Fluorescence excitation was at 320 nm and emission was determined at 420 nm. B) Double reciprocal plot of I-' mol of H,O/mol of superficial lipids. It was assumed that the max- imal fluorescence achieved when a l a r g e excess of lipophorin was added represented 100% binding, and that the amounts of PnA bound are proportional to their relative fluorescence intensities.
persion by fluorescence polarization of DPH. In addition, a gel phase formation at temperatures below 3OoC has been recognized by fluorescence polarization of trans-PnA. Similarly, diacylglycerols showed a small gel phase forma- tion below 3OoC when the lipids were labeled with trans- PnA. Diphenylhexatriene failed to detect lipid transitions in phospholipid dispersions. However, trans-PnA allowed us to detect a small fraction of the phospholipids that formed a gel phase below 24OC. Differences found in trans- PnA and DPH breakpoints must be attributed to the properties of the probes. DPH has been shown to report the lowest critical temperature of the lipid transition (42, 43) while trans-PnA by its high solubility and quantum yield in gel phases (16, 44) allows detection of as little as 5% of the gel phase in the lipids. These properties of the
tram-PnA make it sensitive to the upper critical tempera- ture of the transition.
Recently, Katagiri, Kimura, and Murase (g), employ- ing differential scanning calorimetry to study the locust lipophorin, have reported two endothermic peaks centered at 11' and 36OC in both intact lipophorin and lipophorin hydrocarbon fractions. We have not extensively studied the hydrocarbon fraction of the T injesstans lipophorin, but it is probably involved in the lipid thermotropic transition of native lipophorin. However, the results obtained in the study of the diacylglycerol and in the phospholipid frac- tions allow us to suggest that a small fraction of these lipid classes can be involved in the lipid transition found at about 2OOC.
Katagiri (8) has shown the superficial localization of the phospholipids in the lipoprotein particle of Locwta and although the distribution of the diacylglycerols in the lipophorin particle remains unknown, by their polar nature, it is valid to suppose that at least part of these lipids will be located superficially in the lipophorin. Moreover, taking into account the polar nature of the trans-PnA and cis-PnA and their superficial location in human lipoproteins (14, 15), we can propose that super- ficial lipophorin lipids are involved in the lipid transition found at about 20°C.
Because of their free hydroxyl group diacylglycerols have a larger polarity than triacylglycerols. Consequently, insect fatty acid transport can be carried out by superficial lipids of the lipoprotein while mammalian fatty acids
L -m l4 30 46 62
Temperature ( 'C 1 Fig. 9. Temperature-dependence on the 90' light scattering intensity. Lipophorin concentration was 300 pg of protein/ml in 50 mM potassium phosphate buffer, pH 7.2. Sample temperature was varied at approxi- mately 1°C/min. The sequence in the experiment was: heating 5O-+32OC (0); cooling 32O-+5OC (0); reheating 5O-+6ZoC (+); recool- ing 62O-+6OC (A) and reheating 6'-*32OC (A).
Soulages, Rimoldi, and Brenner Lipid thermotropic transitions in lipophorin 179
by guest, on Novem
ber 21, 2018w
ww
.jlr.orgD
ownloaded from

must be transported in the core of the particle by the tri- acylglycerols. In addition, the superficial location of diacylglycerols would favor their exchange in the tissues, allowing the recycling of the lipophorin. Moreover, the solubility of diacylglycerols in lipid membranes would make unnecessary their breakdown to fatty acids and glycerol in order to be incorporated into the cell.
The large difference between the fluorescence polariza- tion values of DPH or trans-PnA in the lipid dispersion and in the native lipophorin (Table 1) reflects the high lipid mobility restriction imposed by the apoproteins. These differences are larger than those found in human HDL (10) and could indicate the influence of the apopro- teins in determining lipoprotein structure. This hypothesis is supported by the fact that diacylglycerols and phos- phatidylethanolamine are the principal lipid components of the T infeetans lipophorin (1, 41), and moreover, that diacylglycerols represent an important fraction of the lipids in all the insect lipophorin studied (29). Phos- phatidylethanolamine and diacylglycerols, due to the small size of their polar head groups, adopt hexagonal structures (HII) (45-47). In addition, low concentrations of diacylglycerol induce lamellar-to-hexagonal structural transitions in phosphatidylethanolamine or phosphatidyl- choline systems. Therefore, a globular lipophorin having a micellar structure with the head groups of the polar lipids in the surface of the spherical particle, can only be envisaged if the protein components exert a high inter- action with DG and PE lipids, filling the free spaces left among the polar head groups by these molecules.
The location of the apoproteins on the surface of the particles, according to the preceding comments, is also supported by a previous report of Shapiro, Keim, and Law (48). These authors, employing double immuno- diffusion tests, have found that in Manduca sexta both apo- proteins of lipophorin, apoLp-I and apoLp-I1 are exposed to the aqueous environment. In addition, our results of the energy transfer experiments, which have shown a lesser tryptophan-probe average distance for the parinaric acid probes than for the DPH probe, are in agreement with a superficial location of the apoproteins (49).
Quenching curves of Fig. 7 show that at 24OC there is a decrease in the quenching efficiency for all the probes used. These results could be due, in part, to the expansion of the lipoprotein by a lipid transition and a correspond- ing decrease in the acceptor chromophore density. But it is also possible that a conformational change of the apo- proteins could take place at this temperature. However, since thermotropic transitions of the lipoprotein lipids have been shown around this temperature, it is more probable that the change shown is due to a change in the order of the lipophorin lipids.
Light-scattering curves together with the gel filtration experiments showed that under our working conditions
lipophorin aggregation can be induced by effect of tem- perature. In a recent report, Chino et al. (28) presented some evidence supporting the proposal, previously men- tioned by Wheeler and Goldsworthy (6) and Mwangi and Goldsworthy (50), that in the locust lipophorin 0 is not a naturally occurring component of the hemolymph. Thus, our results support the proposal that 0 lipophorin is produced by technical manipulation of the hemolymph. Moreover, the continuity found in the heating curves of the anisotropy of fluorescence of DPH (Fig. 2) above 44OC and the reversibility observed in the cooling curves suggest that no denaturation, or at least no change in the lipid-protein interactions, is produced by the particle aggregation. These results are in agreement with the results found with electronic microscopy by several authors (6, 28, 29, 51), where the called “ 0 lipophorin appears as a single aggregate of the lipophorin without extensive loss of the particle identity. I
This work was supported by grants from CONICET. The authors are indebted to Horacio Heras for his contribution in setting up the computer routines and to Susana Gonzslez for her excellent technical assistance. Manuscrip1 received 24 June 1987 and in reuised J o n 31 August 1987.
1.
2
3
4
5
6 .
7.
8.
9.
REFERENCES
Fichera, L., and R. R. Brenner. 1982. Isolation and charac- terization of the hemolymph lipoproteins of Tnutoma infestam. Comp. Biochm. Physiol. 72: 71-75. Rimoldi, 0. J., R. 0. Peluffo, M. S. Gonzgez, and R. R. Brenner. 1985. Lipid digestion, absorption and transport in Tritoma infestam. Cornp. Biochem. Physiol. 82B: 187-190. Chino, H., R. G. H. Downer, G. R. Wyatt, and L. J. Gil- bert. 1981. Lipophorin, a major class of lipoprotein of insect hemolymph. Insect Biochem. 11: 491-498. Peled, Y., and A. Tietz. 1975. Isolation and properties of a lipoprotein from the hemolymph of the locust. Insect Bio-
Mwangi, R. W., and G. J. Goldsworthy. 1977. Diglyceride- transporting lipoproteins in Locusta. J Comp. Physiol. 114:
Wheeler, C. H., and G. J. Goldsworthy. 1983. Qualitative and quantitative changes in Locurta hemolymph protein and lipoprotein during ageing and adipokinetic hormone action. J Insect Physiol. 29: 339-347. Van Der Horst, D. J., J. H. Van Doorn, and A. M. Beenakkers. 1979. Effect of adipokinetic hormone on the release and turnover of hemolymph diglycerides and the formation of the diglyceride-transporting lipoprotein sys- tem during locust flight. Insect Biochem. 9: 627-635. Katagiri, C. 1985. Structure of lipophorin in insect blood: location of phospholipid. Biochem. Biophys. Acta. 834:
Katagiri, C., J. Kimura, and N. Murase. 1985. Structural studies of lipophorin in insect blood by differential scanning calorimetry and 13C nuclear magnetic relaxation measure- ments. J Biol. Cham. 260: 13490-13495.
chm. 5: 61-72.
177-190.
139-143.
180 Journal of Lipid Research Volume 29, 1988
by guest, on Novem
ber 21, 2018w
ww
.jlr.orgD
ownloaded from

10.
11.
12.
13.
14.
15.
16.
17.
18.
19.
20.
21.
22.
23.
24.
Jonas, A. 1977. Microviscosity of lipid domains in human serum lipoproteins. Biochim. Biophys. Acta. 486: 10-22. Berlin, E., and E. Sainz. 1984. Fluorescence polarization order parameters and phase transitions in lipids and lipo- proteins. Biochim. Biophys. Acta. 794: 49-55. Berlin, E., and C. Young, Jr. 1983. Effects of fat level, feeding period, and source of fat on lipid fluidity and physical state of rabbit plasma lipoproteins. Athmsclmsis. 48: 15-27. Bergeron, R., and J. Scott. 1982. Fluorescent lipoprotein probe. Anal. Biochem. 119: 128-134. Schroeder, E., E. H. Goh, and M. Heimberg. 1979. Investi- gation of the surface structure of the very low density lipoprotein using fluorescence probes. FEBS Left. 97:
Sklar, L. A., M. C. Doody, A. M. Gotto, Jr., and H. J. Pownall. 1980. Serum lipoprotein structure: resonance energy transfer localization of fluorescent lipid probes. Bio-
Sklar, L. A., G. P. Miljanich, and E. A. Dratz. 1979. Phos- pholipid lateral phase separation and the partition of cis- parinaric acid and trans-parinaric acid among aqueous, solid lipid and fluid lipid phases. Biochemistry. 18: 1707-1716. Molotkovsky, J. G., Y. M. Manevich, E. N. Gerasimova, I . M. Molotovskaya, V. A. Poleskky, and L. D. Bergelson. 1982. Differential study of phosphatidylcholine and sphin- gomyelin in human high-density lipoproteins with lipid- specific fluorescent probes. Eur. J. Biochem. 122: 573-579. Lee, A. G. 1977. Lipid phase transitions and phase dia- grams. Mixtures involving lipids. Biochim. Biophys. Acta.
Frings, C. S., L. B. Foster, and P. S. Cohen. 1971. Electro- phoresis separation of serum lipoprotein in polyacrylamide gel. Clin. Chem. 17: 111-114. Folch, J., M. Lees, and G. H. Sloane Stanley. 1957. A simple method for isolation and purification of total lipids from animal tissues. J Biol. Chem. 226: 497-509. Chen, R. F., and R. L. Bowman. 1965. Fluorescence polari- zation measurement with ultraviolet-polarizing filters in a spectrophotofluorometer. Science. 147: 729-732. Azumi, T., and S. P. McGlynn. 1962. Polarization of lumi- nescence of phenanthrene. J Chem. Phys. 37: 2413-2420. Sklar, L. A., B. S. Hudson, M. Petersen, and J. Diamond. 1979. Conjugated polyene fatty acids on fluorescent probes: spectroscopic characterization. Biochemistry. 16: 813-819. Shinitzky, M,, and Y. Barenholz. 1974. Dynamics of the hydrocarbon layer in liposomes of lecithin and sphingomye- lin containing dicetylphosphate. J. Biol. Chem. 249: 2652- 2657.
233-236.
chemistry. 19: 1301-1304.
472: 285-344.
25. Lowry, 0. H., N. J. Rosebrough, A. L. Farr, and R. J. Ran- dall. 1951. Protein measurement with the Folin phenol reagent. J Biol. Chem. 193: 265-275.
26. Sklar, L. A. 1980. The partition of cis-parinaric acid and trans-parinaric acid among aqueous, fluid lipid and solid lipid phases. Mol. Cell. Biochem. 32: 169-177.
27. Chen, P. S., T. Toribara, and W. Huber. 1956. Microdeter- mination of phosphorus. Anal. Chem. 28: 1756-1758.
28. Chino, H., Y. Hirayama, Y. Kiyomoto, R. G. H. Downer, and K. Takahashi. 1987. Spontaneous aggregation of locust lipophorin during hemolymph collection. Zmect Biochem. 17:
29. Beenakkers, A. M., D. J. Van Der Horst, and W. J. A. Marrewijk. 1985. Insect lipids and lipoproteins and their role in physiological processes. Pmg. Lipid Res. 24: 19-67.
89-97.
30.
31.
32.
33.
34.
35.
36.
37.
38.
39.
40.
41.
42.
43.
44.
45.
46.
47.
Hildenbrand, K., and C. Nicolau. 1979. Nanosecond fluo- rescence anisotropy decays of 1,6-diphenyl-1,3,5-hexatriene in membranes. Biochim. Biophys. Acta. 553: 365-377. Burstein, E. A., N. S. Vedenkina, and M. N. Ivkova. 1973. Fluorescence and location of tryptophan residues in protein molecules. Photochem. Phofobiol. 18: 263-279. Morriset, J. D., J. S. K. David, H. J. Pownall, and A. M. Gotto, Jr. 1973. Interaction of an apolipoprotein (apo Lp- alanine) with phosphatidyl-choline. Biochemistry. 12: 1290- 1299. Lee, A. G. 1982. Lipid and membrane biochemistry. %h. L$e Sci. 422: 1-49. Dufourcq, J., F. J. Faucon, C. Lussan, and R. Bernou. 1975. Study of lipid-protein interactions in membrane models: intrinsic fluorescence of cytochrome b5-phospholipid complexes. FEBS Lett. 57: 112-116. Fairclough, R. H., and C. R. Cantor. 1978. The use of singlet-singlet energy transfer to study macromolecular assemblies. Methodr Enzymol. 48: 347-379, Stryer, L. 1978. Fluorescence energy transfer as a spectro- scopic ruler. Annu. Rev. Biochem. 47: 819-846. Kleinfeid, A. M. 1985. Tryptophan imaging of membranes proteins. Biochemistry. 24: 1874-1882. Kimelman, D., S. E. Tecoma, P. K. Wolber, B. S. Hudson, W. T. Wickner, and R. D. Simoni. 1979. Protein-lipid inter- actions. Studies of the M13 coat protein in dimyristoylphos- phatidylcholine vesicle using parinaric acid. Biochemistty. 18:
Smith, M. B., and J. F. Back. 1975. Thermal transitions in the low-density lipoprotein and lipids of the egg yolk of hens. Biochim. Biophys. Acta. 388: 203-212. Overath, P., and H. Traiible. 1973. Phase transitions in cells, membranes and lipids of Escherichia coli. Detection by fluorescent probes, light scattering, and dilatometry. Bio- chemistry. 12: 2625-2631. Fichera, L. E., and R. R. Brenner. 1982. Bioquimica del ciclo evolutivo del T i a t o m injestam (Vinchuca). VI. Re- conocimiento y copmposici6n lipidica de las lipoproteinas hemolinffiticas de machos adultos. Acta Physiol. Lat. Am. 32:
Brasitus, T. A., A. R. Tall, and D. Schachter. 1980. Ther- motropic transitions in rat intestinal plasma membranes studied by differential scanning calorimetry and fluores- cence polarization. Biochemistry. 19: 1256-1261. Lentz, B. R., Y. Barenholz, and T. E. Thompson. 1976. Fluorescence depolarization studies of phase transitions and fluidity in phospholipid bilayers. 2. Two component phosphatidylcholine liposomes. Biochemisfry. 15: 4529-4537. Gallay, J., and M. Vincent. 1986. Cardiolipin-cholesterol interactions in the liquid-crystalline phase: a steady-state and time-resolved fluorescence anisotropy study with cis- and tram-parinaric acids as probes. Biochemistry. 25: 2650-2656. Das, S., and R. P. Rand. 1984. Diacylglycerol causes major structural transitions in phospholipid bilayer membranes. Biochem. Biopiys. Res. Commun. 124: 491-496. Das, S., and R. P. Rand. 1986. Modification by diacyl- glycerol of the structure and interaction of various phospho- lipid bilayer membranes. Biochemistry. 25: 2882-2889. Cullis, P. R., and R. De Kruijff. 1979. Lipid polymorphism and the functional roles of the lipids in biological mem- branes. Biochim. Biophys. Acta. 559: 399-420.
5874-5880.
21-29.
Soulages, Rimoldi, and Brenner Lipid thermotropic transitions in lipophorin 181
by guest, on Novem
ber 21, 2018w
ww
.jlr.orgD
ownloaded from

48. Shapiro, J. P,, P. S. Keim, and J. H. Law. 1984. Structural 50. Mwangi, R. W., and G. J. Goldsworthy. 1981. Diacyl- studies on lipophorin, an insect lipoprotein. J Biol. Chem. glycerol-transporting lipoproteins and flight in Locmta.
49. Fung, B. K. K., and L. Stryer. 1978. Surface density deter- 51. Wheeler, C. H., J. E. Mundy, and G. J. Goldsworthy. 1983. mination in membranes by fluorescence energy transfer. Bi- Locust hemolymph lipoproteins visualized in the electron ochemistry. 17: 5241-5248. microscope. J Comp. Physiol. B154: 281-286.
259: 3680-3685. J Insect Physiol. 27: 47-50.
182 Journal of Lipid Research Volume 29, 1988
by guest, on Novem
ber 21, 2018w
ww
.jlr.orgD
ownloaded from