liquids rich montney - blackswanenergy.com · 4. financial performance • demonstrated material...
TRANSCRIPT

Liquids Rich Montney Value | Scale | Growth
March 2018
2
FT ST JOHN
EDMONTON
MONTNEY
BRITISH COLUMBIA
ALBERTA
10 km
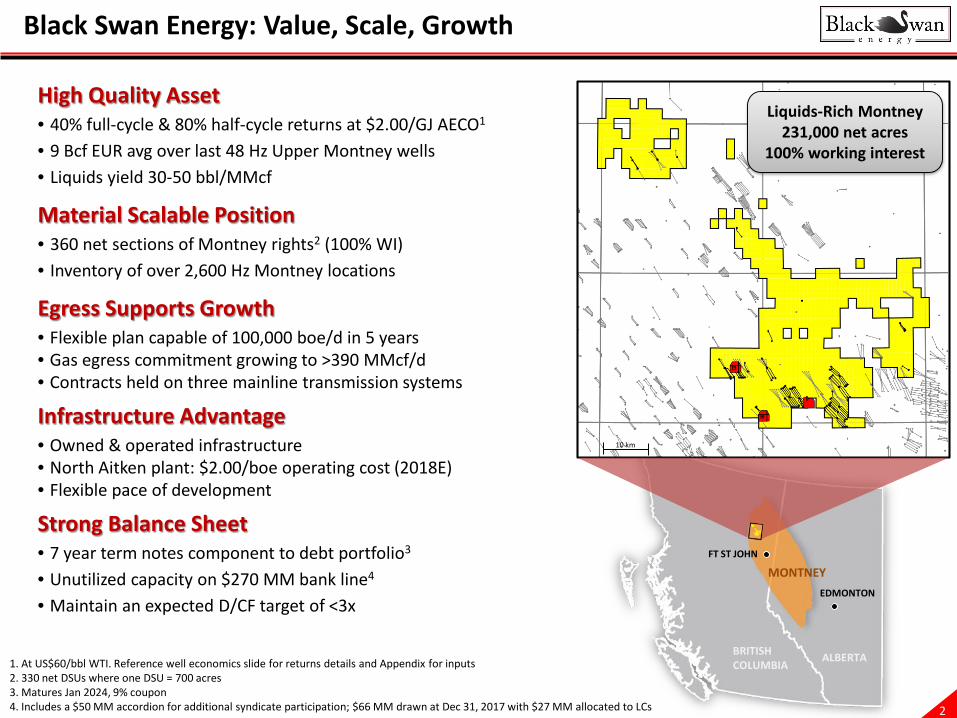
Liquids-Rich Montney 231,000 net acres
100% working interest
Black Swan Energy: Value, Scale, Growth
High Quality Asset• 40% full-cycle & 80% half-cycle returns at $2.00/GJ AECO1
• 9 Bcf EUR avg over last 48 Hz Upper Montney wells • Liquids yield 30-50 bbl/MMcf
Material Scalable Position• 360 net sections of Montney rights2 (100% WI)• Inventory of over 2,600 Hz Montney locations
Egress Supports Growth• Flexible plan capable of 100,000 boe/d in 5 years• Gas egress commitment growing to >390 MMcf/d• Contracts held on three mainline transmission systems
Infrastructure Advantage• Owned & operated infrastructure• North Aitken plant: $2.00/boe operating cost (2018E)• Flexible pace of development
Strong Balance Sheet• 7 year term notes component to debt portfolio3
• Unutilized capacity on $270 MM bank line4
• Maintain an expected D/CF target of <3x
1. At US$60/bbl WTI. Reference well economics slide for returns details and Appendix for inputs2. 330 net DSUs where one DSU = 700 acres 3. Matures Jan 2024, 9% coupon4. Includes a $50 MM accordion for additional syndicate participation; $66 MM drawn at Dec 31, 2017 with $27 MM allocated to LCs

3
-
4,000
8,000
12,000
16,000
20,000
24,000
28,000
Q1
Q2
Q3
Q4
Q1
Q2
Q3
Q4
Q1
Q2
Q3
Q4
Q1
Q2
Q3
Q4
Q1
Q2
Q3
Q4
Q1
Q2
Q3
Q4
2013 2014 2015 2016 2017 2018E
Avg.
Dai
ly P
rodu
ctio
n (b
oe/d
)Building Momentum Exiting 2017
1. Based on field estimates2. Evaluated by GLJ Petroleum Consultants3. Capital costs include the cost of the North Aitken Creek Gas Plant & land &
changes in Future Development Capital (FDC)
Production Growth
Delineation
- 50
100 150 200 250 300 350 400 450 500
2012 2013 2014 2015 2016
Rese
rves
(MM
boe)
PDP PDNP + PUD Probable
Reserve Growth
Development
Corporate Production• Dec 2016: 16,650 boe/d (16% liquids)• Dec 2017: 27,000 boe/d (20% liquids)1
Reserves Growth2
• 2016 YE: 2P 478 MMboe; 1P 171 MMboe• 2016 FD&A (incl. FDC)3:
• PDP $5.86 | 1P $7.63 | 2P $5.78
78% CAGR Q4 2014-2017(achieved with less than one rig annually)
Significant reserves based on large delineated area of development

4
Financial Performance
• Demonstrated material cost savings per unit with execution of growth plan
• Transportation costs increase reflects increased Alliance capacity
Reducing Cash Costs
• Q4/17 delivered record cash flow of $27 MM and net earnings of $8.1 MM1
• Asset performance delivering production growth
• Cash flow margins protected by:• Infrastructure ownership strategy• Disciplined spending and cost controls
• Significant liquids contribution to revenues
Growing Cash Flow
$0.00
$5.00
$10.00
$15.00
$20.00
$25.00
Q1 Q2 Q3 Q4 Q1 Q2 Q3 Q4 Q1 Q2 Q3 Q4 Q1 Q2 Q3 Q4
2014 2015 2016 2017
$/bo
e
Controllable Cash Costs (corporate)
Opex Transportation G&A Financing
$0.00
$1.00
$2.00
$3.00
$4.00
$5.00
$0
$5
$10
$15
$20
$25
$30
Q1 Q2 Q3 Q4 Q1 Q2 Q3 Q4 Q1 Q2 Q3 Q4 Q1 Q2 Q3 Q4
2014 2015 2016 2017
AECO
(C$/
GJ)
Cash
Flo
w
Cash Flow vs. Commodity Prices
Cash Flow ($MM) Cash Flow Netback ($/boe) AECO Natural Gas (C$/GJ)
1. Excludes unrealized hedging gains of $7.9MM
5
0%
20%
40%
60%
80%
100%
120%
140%
160%
180%
$1.00/GJ Stn 2$55/bbl WTI
$1.50/GJ Stn 2$60/bbl WTI
$2.00/GJ Stn 2$65/bbl WTI
IRR
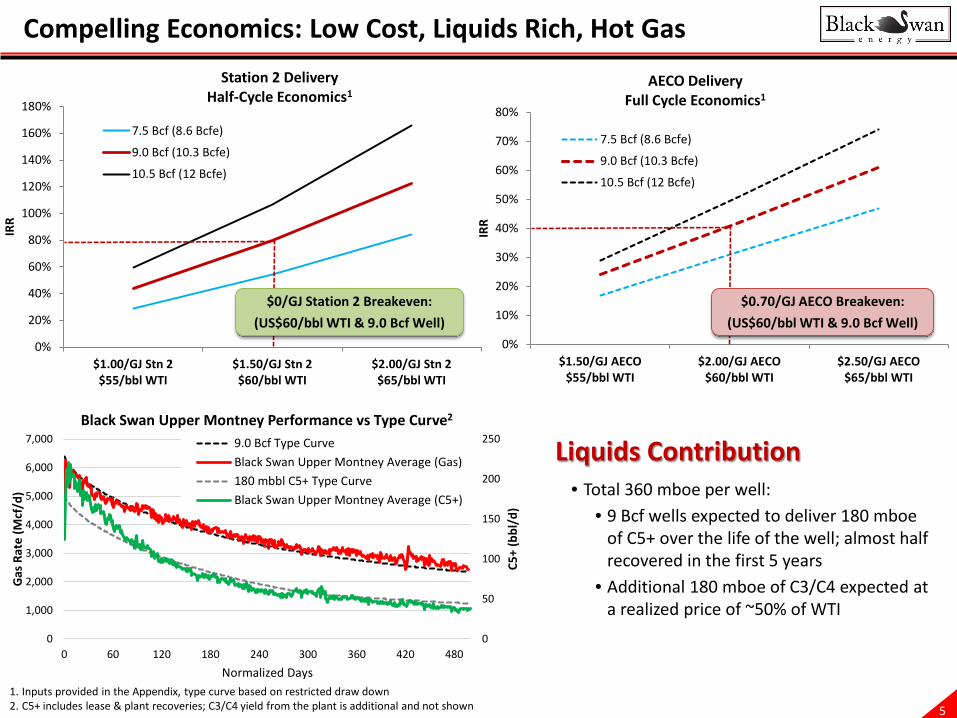
Station 2 DeliveryHalf-Cycle Economics1
7.5 Bcf (8.6 Bcfe)
9.0 Bcf (10.3 Bcfe)
10.5 Bcf (12 Bcfe)
0
50
100
150
200
250
0
1,000
2,000
3,000
4,000
5,000
6,000
7,000
0 60 120 180 240 300 360 420 480
C5+
(bbl
/d)
Gas
Rat
e (M
cf/d
)
Normalized Days
Black Swan Upper Montney Performance vs Type Curve2
9.0 Bcf Type CurveBlack Swan Upper Montney Average (Gas)180 mbbl C5+ Type CurveBlack Swan Upper Montney Average (C5+)
Compelling Economics: Low Cost, Liquids Rich, Hot Gas
1. Inputs provided in the Appendix, type curve based on restricted draw down2. C5+ includes lease & plant recoveries; C3/C4 yield from the plant is additional and not shown
Liquids Contribution• Total 360 mboe per well:
• 9 Bcf wells expected to deliver 180 mboe of C5+ over the life of the well; almost half recovered in the first 5 years
• Additional 180 mboe of C3/C4 expected at a realized price of ~50% of WTI
0%
10%
20%
30%
40%
50%
60%
70%
80%
$1.50/GJ AECO$55/bbl WTI
$2.00/GJ AECO$60/bbl WTI
$2.50/GJ AECO$65/bbl WTI
IRR
AECO DeliveryFull Cycle Economics1
7.5 Bcf (8.6 Bcfe)
9.0 Bcf (10.3 Bcfe)
10.5 Bcf (12 Bcfe)
$0/GJ Station 2 Breakeven:(US$60/bbl WTI & 9.0 Bcf Well)
$0.70/GJ AECO Breakeven:(US$60/bbl WTI & 9.0 Bcf Well)

6
$0.0
$1.0
$2.0
$3.0
$4.0
$5.0
$6.0
$7.0
2014 2015 2016 2017 2018E
D&C
Cost
s ($M
M/w
ell)
Drilling Cost Completion Cost Design Evolution
Repeatable Well Deliverability at Low Cost
Decreasing Costs on Multi-well Pads
$4.5 MM2
$6.4 MM
$4.6 MM
$3.8 MM
0.0
2.0
4.0
6.0
8.0
10.0
12.0
EUR
(Bcf
/wel
l)
Upper Montney Wells (by completion date)
EUR (on-stream) Average EUR
2012/13 2014 2015 2016 2017
Evolving Wellbore Design• 2017: tested increased well length, proppant
loading, stage count and inter-well spacing• 2018 wellbore design range3:
• Base design (pads): $4.0MM and 9 Bcf• Aggressive design: up to $4.8MM and
>9 Bcf (pending evaluation of ‘17 program)
1. Well results are not normalized for completions2. Includes $0.4 MM for cost of testing design changes3. Base design includes 1,800 m lateral, 30 stages, 60 T/ frac. Average well
cost excludes land retention wells
Ongoing Operational Success• Avg EUR: 9.0 Bcf since 2012 (48 wells)1
• Repeatable and predictable outcomes
Driving Lower Costs• Continuous rig program• Ongoing optimization• Pad drilling• Frac water infrastructure • Timing of completions
$4.0-$4.8 MM3

7
Owned & Operated Infrastructure: Flexible Pace of Growth
North Aitken CreekGas Plant
110 MMcf/d capacity
10” sales gas line; connects to Enbridge T-North system
50 MMcf/d compression & dehy, volumes
flow to McMahon for processing
6”6”
6”
10”
10”
Gathering trunk-lines built H1/16
10”
8”
10 km
Existing gathering trunk-lines
110 MMcf/d North Aitken Creek (Plant 1)
Future site for 198 MMcf/d facility (Plant 2)
• 41 km raw gas gathering lines to North Aitken plant & Black Swan compressors
• 22 km sour gas lines to 3rd party facilities
• 14 km sweet sales gas lines (Enbridge T-North & Alliance)
1. Full capacity reached Nov 20172. Pending FID on Plant 2
Plant 1: 110 MMcf/d •50 MMcf/d (Q1 2016) + 60 MMcf/d (Q2 2017)1
•Liquids recoveries capable of ~40 bbl/MMcf (>50% C5+)
Plant 2: 198 MMcf/d •Engineering in progress with long lead equipment
included in ‘17 budget•Phase A on-stream timing to match pipeline expansions
Infrastructure Investment At 2017 YE: $312 MM
2018 Budget: $90 MM2

8
0
5
10
15
20
25
30
35
40
45
50
Jan-16 May-16 Sep-16 Jan-17 May-17 Sep-17 Jan-18
Liqu
ids Y
ield
(bbl
/MM
cf R
aw)
C5 Yield (bbl/MMcf Raw) C3/C4 Yield (bbl/MMcf Raw)
0
20
40
60
80
100
120
Jan/16 May/16 Sep/16 Jan/17 May/17 Sep/17 Jan/18
Gas
Pro
duct
ion
(MM
cf/d
)
Inlet Gas (MMcf/d) Inlet Capacity (MMcf/d)
Expanded Capacity
Owned & Operated Infrastructure: Lower Costs & Higher Netbacks
Final compressor commissionedPlant at capacity of 110 MMcf/d
Stable Liquids: ~45 bbl/MMcf
$10.03
$7.33
$2.31
$2.10
$3.00 $0.89
$0.00$2.00$4.00$6.00$8.00
$10.00$12.00$14.00$16.00$18.00$20.00
Costs Revenues
$/bo
e
RoyaltyTransportationOperating CostC3/C4 RevenueC5+ RevenueGas Revenue
Higher Revenues & Lower Costs
2017 Field Netback1
$13.86/boe
Top Tier 2018E Operating Costs
1. Unaudited: Average price of $2.04/GJ, -$0.56/GJ Station 2 to AECO differential, US$50.93/bbl WTI and $1.30 C$/US$, excludes hedging gains/(losses)
Source: National Bank Financial and Black Swan
98.6% run time prior to turnaround for expansion
$0.00
$2.00
$4.00
$6.00
$8.00
$10.00
$12.00
Peer
1
Peer
2
BSE
Plan
t
BSE
Peer
3
Peer
4
Peer
5
Peer
6
Peer
7
Peer
8
Peer
9
Peer
10
$/bo
e
9
0
5,000
10,000
15,000
20,000
25,000
30,000
Jan-16 Apr-16 Jul-16 Oct-16 Jan-17 Apr-17 Jul-17 Oct-17 Jan-18 Apr-18 Jul-18 Oct-18
Daily
Pro
duct
ion
(boe
/d)
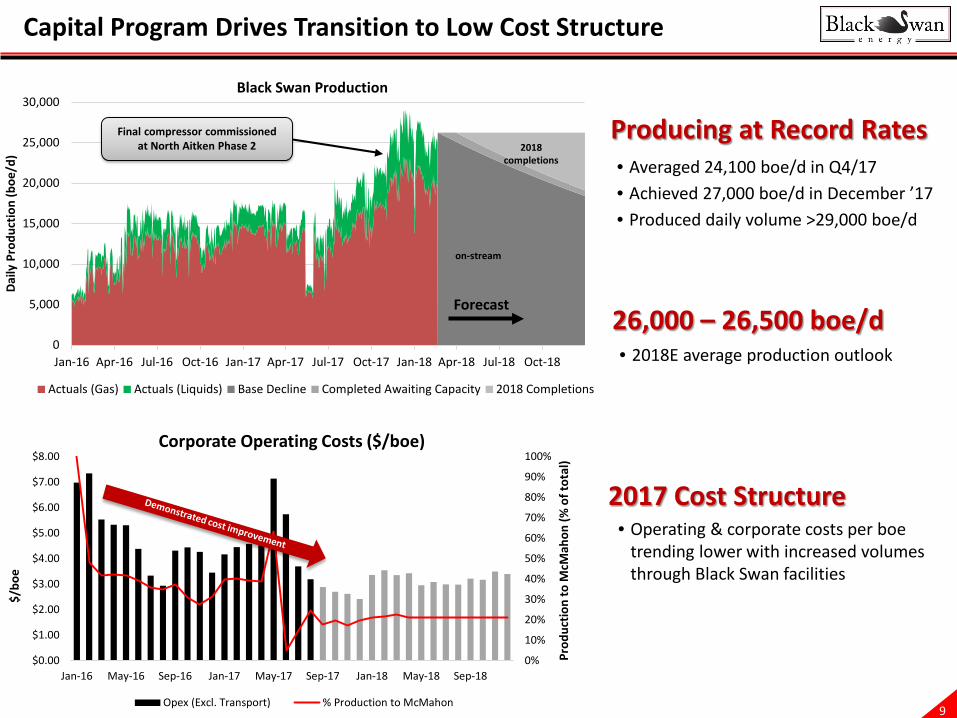
Black Swan Production
Actuals (Gas) Actuals (Liquids) Base Decline Completed Awaiting Capacity 2018 Completions
Capital Program Drives Transition to Low Cost Structure
26,000 – 26,500 boe/d• 2018E average production outlook
Producing at Record Rates• Averaged 24,100 boe/d in Q4/17• Achieved 27,000 boe/d in December ’17• Produced daily volume >29,000 boe/d
2017 Cost Structure• Operating & corporate costs per boe
trending lower with increased volumes through Black Swan facilities
0%
10%
20%
30%
40%
50%
60%
70%
80%
90%
100%
$0.00
$1.00
$2.00
$3.00
$4.00
$5.00
$6.00
$7.00
$8.00
Jan-16 May-16 Sep-16 Jan-17 May-17 Sep-17 Jan-18 May-18 Sep-18
Prod
uctio
n to
McM
ahon
(% o
f tot
al)
$/bo
e
Corporate Operating Costs ($/boe)
Opex (Excl. Transport) % Production to McMahon
on-stream
Final compressor commissioned at North Aitken Phase 2 2018
completions
Forecast
10
$10.37
$6.82
$1.80 $0.16 $2.79
$3.73 $3.00 $1.44 $0.89 $2.02
$0.00
$5.00
$10.00
$15.00
$20.00
$25.00
Costs Revenues
2017E
$/bo
e
2017E Revenues vs. Costs
Interest
Royalty
G&A
Transportation
Operating Cost
Hedging
Processing Income
C3/C4 Revenue
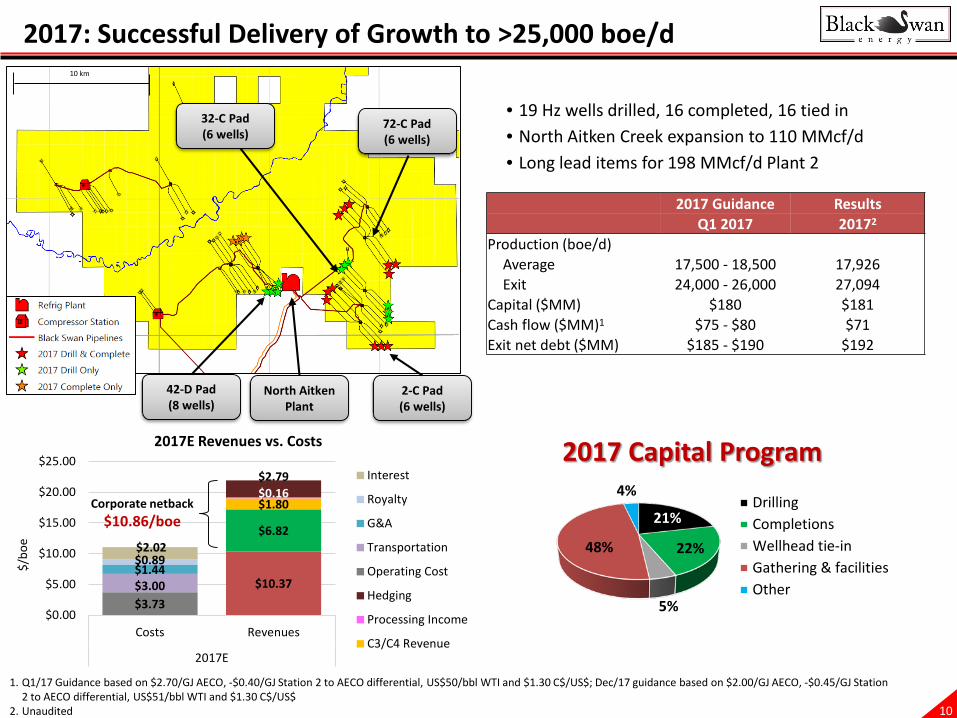
2017: Successful Delivery of Growth to >25,000 boe/d
42-D Pad(8 wells)
2-C Pad(6 wells)
72-C Pad(6 wells)
North Aitken Plant
10 km
21%
22%
5%
48%
4%
2017 Capital Program
DrillingCompletionsWellhead tie-inGathering & facilitiesOther
• 19 Hz wells drilled, 16 completed, 16 tied in• North Aitken Creek expansion to 110 MMcf/d• Long lead items for 198 MMcf/d Plant 2
1. Q1/17 Guidance based on $2.70/GJ AECO, -$0.40/GJ Station 2 to AECO differential, US$50/bbl WTI and $1.30 C$/US$; Dec/17 guidance based on $2.00/GJ AECO, -$0.45/GJ Station 2 to AECO differential, US$51/bbl WTI and $1.30 C$/US$
2. Unaudited
32-C Pad(6 wells)
Corporate netback $10.86/boe
2017 Guidance ResultsQ1 2017 20172
Production (boe/d)Average 17,500 - 18,500 17,926Exit 24,000 - 26,000 27,094
Capital ($MM) $180 $181Cash flow ($MM)1 $75 - $80 $71Exit net debt ($MM) $185 - $190 $192

11
Stable Base Production: Minimal Maintenance Capital Required
1. Notes:• Assumes 35% base decline; $6,000/boe/d rig efficiency, $5MM/year miscellaneous field capital• Prior to hedging gains/losses; Assumes $0.50/GJ Station 2 Differential • The ratio between maintenance capital and free cash flow will remain the same as productions grows
2. At $2.00/GJ AECO & $60/bbl WTI and $1.30 C$/US$ FX
<60% of Cash FlowRequired to maintain production2
Free cash flow positive & able to maintain production at low prices
Strong Asset Base Fundamentals:<$3/boe F&D cost
<$6,000/boe/d capital efficiency
Avg 9 Bcf over last 48 Upper Montney wells drilled
$0
$20
$40
$60
$80
$100
$120
$140
$160
$1.5/GJ AECO $2/GJ AECO $2.5/GJ AECO
US $55/bbl WTI US $60/bbl WTI US $65/bbl WTI
$MM
Free Cash Flow Generation at 26,000 boe/d1
Maintenance Capital Free Cash Flow Total Cash Flow

12
Connected to Multiple Markets
McMahon Gas Plant
Sunset
T-South to Huntington/Sumas
Station 2
Aitken Creek Gas Storage
NGTL to AECO
North Aitken Gas Plant
BRIT
ISH
COLU
MBI
AAL
BERT
A
25 km
1. NGTL is part of the TransCanada pipeline system2. North Montney Mainline subject to regulatory approval
• Egress on all three Canadian gas transmission systems2
• Connection to different markets enables netback optimization
• Option to accelerate production growth based on market conditions
Egress Via 3 Major Gas PipelinesLong term >2/3 of egress on TCPL with access to
AECO and beyond

13
0
50
100
150
200
250
300
350
400
450
Jan
Mar
May Ju
l
Sep
Nov Ja
n
Mar
May Ju
l
Sep
Nov Ja
n
Mar
May Ju
l
Sep
Nov Ja
n
Mar
May Ju
l
Sep
Nov
2018E 2019E 2020E 2021E
Gas
(MM
cf/d
)
Planned Plant Capacity vs. Egress Commitments
Egress Commitments Provide Transformational Growth
1. Unutilized tolls: $0.8 MM/month post Plant 2A; $0.4MM/month post Plant 2B; $1.8 MM/month with no new processing capacity
Existing Processing
Plant 2A
Plant 2B
Alliance Capacity
Enbridge Capacity
TransCanada Expansion
Option to accelerate1
Owned & operated
• New processing units built in 100 MMcf/d (19,000 boe/d) increments
• Plant construction timed to align with pipeline expansion
Egress grows to >390 MMcf/d
• Option to flow up to 100% on TCPL by 2019• Long term >2/3 of egress on TCPL with
access to AECO and beyond• Connection to different markets enables
netback optimization• Option to accelerate production growth
based on market conditions
Market & Growth Optionality
Enbridge Expansion
Spruce Ridge ProjectBlack Swan:60 MMcf/dEst. Q3/19
North Montney MainlineBlack Swan:229 MMcf/dEst. Q2/19
Existing Pipelines

14
$10.58
$6.26
$1.72 $0.10 $1.43
$3.24 $2.25 $1.11 $0.97 $1.59
$0.00
$5.00
$10.00
$15.00
$20.00
$25.00
Costs Revenues
2018E
$/bo
e
2018E Revenues vs. CostsInterest
Royalty
G&A
Transportation
Operating Cost
Hedging
Processing Income
C3/C4 Revenue
C5+ Revenue
Gas Revenue
2018: Maintaining Low Cost Production Ahead of 2019 Ramp Up
• Maintenance capital: • Wells: $56MM (5 Hz drills, 15 completions, 15 tied-in)• Gathering & Misc: $6MM
• Growth capital: • Land retention wells: $7MM (2 Hz, 1 Vt; drill only)• Plant 2 long lead: $33MM• Wells: $36MM (18 Hz drills)1
• Plant 2 construction: $49MM1
1. Pending FID on Plant 22. Based on annual pricing of $1.80/GJ AECO, -$0.40/GJ Station 2 to AECO differential, US$55/bbl WTI and $1.27 C$/US$
Netback$9.85/boe
2018 Guidance2
Production (boe/d)Average 26,000 – 26,500Exit 26,000 – 26,500
Capital ($MM) $190Cash flow ($MM)1 $90 - $95Exit Net Debt ($MM) $290 - $295
32-C Pad Complete
19-EDrill & Complete
42-D Pad Complete
Ramp Up Ahead of North Plant 2
Production Maintenance Activity
88-C PadDrill
Plant 2c-46-C
52-C Pad Drill
56-C Pad Drill
5 km
Scalable 2018 Capital Program44-C Pad Drill & Complete

15
Aitken Area Capable of Delivering & Sustaining >100,000 boe/d
10 km
Aitken Core Development Area
Development Plan1 Uses <20% of Inventory• Upper Montney delineated across the Aitken core
development area; 430 Hz locations remaining
• Remaining acreage & landing zones have potential to• Increase peak production, or• Extend production plateau
Aitken core development delineated; upside on
northern acreage
1. Drilling plans are subject to annual review and may be modified based on factors including: commodity prices, facility access and regulatory constraints
2. Assumes min 25 wells/rig/year; based on IP 365 of 765 boe/d (half-cycle 9.0 Bcf EUR type curve, $4.5 MM DCET)
92-C/72-C padEUR = 9 Bcf
54-D/42-D padAvg EUR = 9 Bcf
22-C/2-C padAvg EUR = 11 Bcf
19-E padAvg. EUR = 9 Bcf
7-H padAvg EUR = 7 Bcf
45-D wellEUR = 11 Bcf
Capital Efficient Asset Provides Robust Growth• Single continuous one rig program drills ~25 wells per
year• Add 19,000 boe/d/rig annually2
• F&D cost<$3.00/boe• Capital efficiency <$6,000/boe/d• Delivers 100,000 boe/d in 5 yrs with 2 rigs

16
Source Water Secured for Long-Term Development Plan
• Underpins growth to 100,000 boe/d • Permanent intake and storage in place• Water license for up to 100+ Hz wells per year
through Dec. 31, 20211
Water pump station1. With renewal provisions
Black Swan has re-used 100% of produced water since June 2014
Water License Intake 1
10 km
Water Pump Station
b-54-D65,800 m³
c-7-H60,300 m³
b-11-A44,900 m³
d-42-D65,000 m³
a-72-C68,000 m³
c-38-C56,000 m³
Responsible management & recycling • >2.2 MMbbl of fresh water storage capacity
constructed• Produced water is recovered & recycled• Temporary handling infrastructure allows
flexibility of operation + optimization of capital
Water License

17
0
500
1,000
1,500
2,000
2,500
2018 2019
Hedg
ed V
olum
es (b
bl/d
)
C4 & C5+ Avg. Contract Pricing
Swaps (C$ WTI) Collars (C$ WTI)
Puts (C$ WTI)
Risk Management: Ability to Hedge up to 3 Years Out
Note: Gas pricing portfolio percentages include physical contracts. Put prices are shown net of premiums and Chicago prices are shown prior to transportation costs on Alliance; 2018 NYMEX puts & 2019 NYMEX collars are matched with C$-2.15/MMBtu and C$-1.82/MMBtu AECO basis swaps respectively
0
20,000
40,000
60,000
80,000
100,000
2018 2019
Hedg
ed V
olum
es (G
J/d)
Natural Gas Avg. Contract Pricing
Station 2 Diff ($/GJ) AECO Swaps ($/GJ)AECO Puts ($/GJ) Chicago Swaps (C$/MMBtu)NYMEX Puts (C$/MMBtu) NYMEX Collars (C$/MMBtu)
0
100
200
300
400
500
600
700
2018 2019
Hedg
ed V
olum
es (b
bl/d
)
Propane Avg. Contract Pricing
Swaps (C$ Conway)
Gas Pricing Portfolio C4 & C5+ Hedging$2
.34
-$0.
49
$1.7
9 -$0.
39$1
.84
$55.
00 x
$67
.25
Propane Hedging
$55.
00 x
$68
.00
$68.
30
$4.6
2 $3.2
6
$69.
83
$39.
26
$34.
37
$66.
50
$3.3
3 x
$3.6
3
$66.
35
63%
19%
4%
30%
14%
3%
67%
0%
20%
40%
60%
80%
100%
2018 2019% o
f Net
Cor
pora
te P
rodu
ctio
n
Hedged Floating ChicagoFloating AECO Floating Station 2
82%
42%
18%
58%
0%
20%
40%
60%
80%
100%
2018 2019% o
f Net
Cor
pora
te P
rodu
ctio
nHedged Unhedged
76%
37%
24%
63%
0%
20%
40%
60%
80%
100%
2018 2019
% o
f Net
Cor
pora
te P
rodu
ctio
n
Hedged Unhedged
18
0%10%20%30%40%50%60%70%80%90%
100%
$0
$2
$4
$6
$8
$10
$12
$14
$0
$2
$4
$6
$8
$10
$12
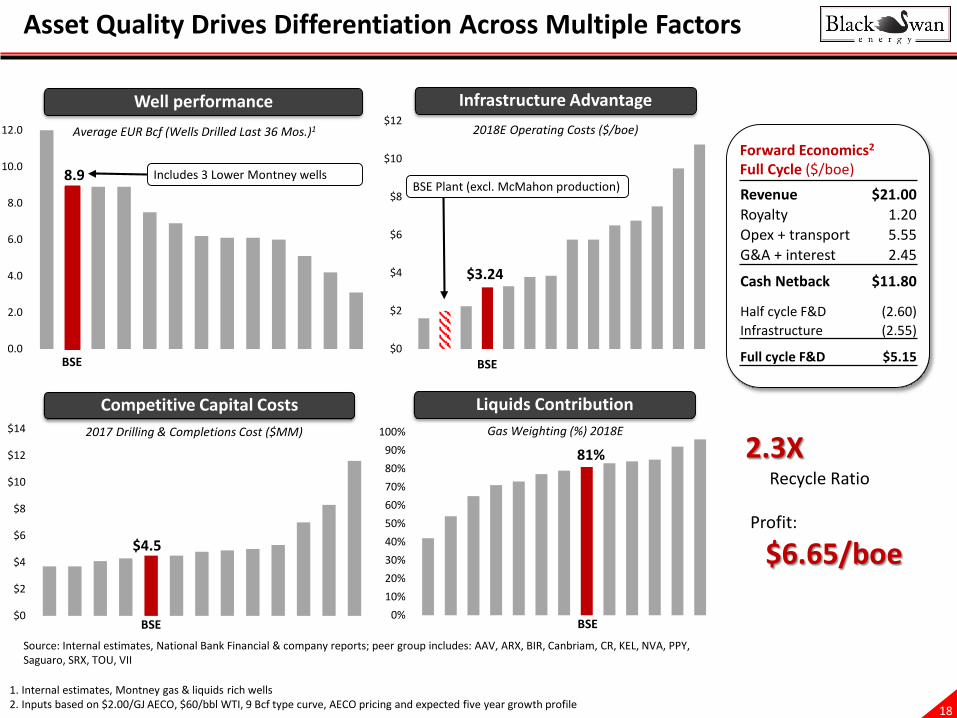
Asset Quality Drives Differentiation Across Multiple Factors
0.0
2.0
4.0
6.0
8.0
10.0
12.0
Well performance
Revenue $21.00Royalty 1.20Opex + transport 5.55G&A + interest 2.45
Cash Netback $11.80
Half cycle F&D (2.60)Infrastructure (2.55)
Full cycle F&D $5.15
1. Internal estimates, Montney gas & liquids rich wells 2. Inputs based on $2.00/GJ AECO, $60/bbl WTI, 9 Bcf type curve, AECO pricing and expected five year growth profile
8.9
$4.5
$3.24
81%
Source: Internal estimates, National Bank Financial & company reports; peer group includes: AAV, ARX, BIR, Canbriam, CR, KEL, NVA, PPY, Saguaro, SRX, TOU, VII
Includes 3 Lower Montney wellsBSE Plant (excl. McMahon production)
Average EUR Bcf (Wells Drilled Last 36 Mos.)1
Infrastructure Advantage2018E Operating Costs ($/boe)
2017 Drilling & Completions Cost ($MM)
Competitive Capital Costs Liquids ContributionGas Weighting (%) 2018E
Forward Economics2
Full Cycle ($/boe)
$6.65/boeProfit:
2.3XRecycle Ratio
BSE BSE
BSE BSE

19
Appendix
Liquids Rich Montney Value | Scale | Growth

20
Black Swan Energy Executive Team
David Maddison, P.Eng.David is President, CEO and founder of Black Swan Energy. He has over 37 years of industry experience focused on conventional and resource plays in Western Canada. Prior to Black Swan, he was with Talisman Energy where he managed multi-disciplinary teams in the WCSB, with production of 100,000 boe/d and annual capital budgets of $1 billion.
Marc Mereau, P.Eng.Marc is Chief Operating Officer and a co-founder of Black Swan Energy. He has over 36 years of experience in the oil and gas industry, both domestically and internationally. Prior to Black Swan, Marc worked at Talisman Energy, where he held progressively larger roles including Senior Vice President of Western Operations for North America.
Michael Wilhelm, B.Comm., CPA, CGAMike is Vice President, Finance and CFO and a co-founder of Black Swan Energy. He has over 30 years experience in the oil and gas industry, with an extensive background in both private and public financings in Canadian and U.S. markets. Mike was involved as a founder and in the ongoing funding of Equatorial Energy and Espoir Exploration. He was also involved with the IPO of Resolute Energy Inc. through the RTO of Equatorial Energy Inc.
Bruce Thornhill, P.GeoBruce is Vice President, Exploration of Black Swan Energy. He has over 35 years of experience in the energy industry focused on conventional and resource play exploration and development throughout Western Canada, primarily in Deep Basin areas. Prior to joining Black Swan, he was a member of the senior management team at TAQA North, first as VP of Exploration and later as VP of the North Asset managing an annual capital budget of $200MM.
Bryan Lang, P.Eng.Bryan is Vice President, Operations of Black Swan Energy. He has over 27 years of experience in the energy industry focused on Western Canadian operations. He started his career at Chevron Canada and at growth oriented operators Northrock Resources and Peyto Exploration. He played a lead role in the development of horizontal multistage resource plays, and has assembled highly efficient teams focused on safe, low cost operations.
Leanne Juneau, B.Comm.Leanne is Vice President, Land and co-founder of Black Swan Energy. She has over 20 years experience negotiating and executing exploration and development agreements and strategic corporate and asset acquisitions and dispositions within Western Canada totaling over $500 million. She has previously held positions at Redcliffe Exploration, Talisman Energy and Northrock Resources.
Diane Shirra, B.Eng., MBA, P.Eng.Diane is Vice President, Business Development of Black Swan Energy. She has over 33 years of experience in the energy industry focused on exploitation and development of both conventional and resource plays throughout Western Canada. Most recently she was VP Montney Gas Development and VP Reserves and Strategic Projects at Pengrowth Energy Corporation.
Christine Ezinga, B.Comm., CFAChristine is Vice President of Strategy & Planning at Black Swan Energy. She has over 16 years of diverse capital markets experience in finance, investor relations and corporate development with direct involvement in over $9 billion of executed M&A deals. Prior to joining Black Swan, she was Team Lead – Finance, Business Development at Sinopec Canada, following the successful sale of Daylight Energy to Sinopec. Christine currently serves on the Board of the Petroleum Acquisition and Divestiture Association.

21
Black Swan Energy Board of Directors
David Maddison, P.Eng.David is President, CEO and founder of Black Swan Energy. He has over 37 years of industry experience focused on conventional and resource plays in Western Canada. Prior to Black Swan, he was with Talisman Energy where he managed multi-disciplinary teams in the WCSB, with production of 100,000 boe/d and annual capital budgets of $1 billion.
Jackie Sheppard, Lead DirectorJackie was the Executive Vice-President, Corporate and Legal and Corporate Secretary for Talisman Energy Inc. She served as Secretary to the Board responsible for Corporate Projects and Acquisitions, Communications and Investor Relations. She currently serves on the Boards of Cairn Energy, Emera Inc. and Seven Generations.
Dr. James BuckeeIn September 1991 Jim was appointed President and Chief Operating Officer for BP Canada Inc. and in May 1993 he was appointed President and Chief Executive Officer of Talisman Energy Inc. (formerly BP Canada). When Jim retired, in October 2007, Talisman was producing over 500,000 boe/d. He also serves on the boards of Magma Global and M-Flow and sits on the advisory Board of Azimuth Capital Management. Jim holds a BSc Honours in Physics from the University of Western Australia and in 1970 he received his PhD in Astrophysics at Oxford University.
Evan Hazell, P. Eng. MBA Evan has been involved in the global oil and gas industry for over 30 years, both as a petroleum engineer and as an investment banker. At present, he serves as a Director of non-profit and community organizations Opera America, Calgary Municipal Land Corporation and Calgary YMCA. From 1998 to 2011, Mr. Hazell acted as a managing director at several financial institutions including HSBC Global Investment Bank and RBC Capital Markets. Mr. Hazell holds a Bachelor of Applied Science degree from Queen's University, a Master of Engineering degree from the University of Calgary, and an MBA degree from the University of Michigan.
Robert MellemaRobert has been with the Canada Pension Plan Investment Board (CPPIB) since 2008 and focuses on Natural Resources investments. Prior to joining CPPIB, Mr. Mellema worked at UBS on the Canadian M & A team. Mr. Mellema serves as a Director on the boards of Livingston International Inc. and Wolf Midstream and has previously been involved in CPPIB’s investments in Teine Energy and Seven Generations Energy. Mr. Mellema holds a MBA from the Wharton School at the University of Pennsylvania and a Bachelor of Commerce degree from Queen’s University.
David B. Krieger, MBA David is a member of the Warburg Pincus Executive Management team, having joined Warburg in 2000, and focuses on energy investments. Previously, he worked at McKinsey & Company. Mr. Krieger is a Director of Kosmos Energy, MainSail Energy, MEG Energy, Osum Oil Sands, Rubicon Oilfield International, Sheridan Production, Trident Energy and Velvet Energy. Mr. Krieger received a B.S. in economics summa cum laude from the Wharton, an M.S. with high honors from the Georgia Institute of Technology and an MBA with distinction from Harvard Business School.
Roy Ben-Dor, MBARoy joined Warburg Pincus in 2011 and previously worked at McKinsey & Company in New York. He is also a director of MainSail Energy and Zenith Energy and works with MEG Energy, Navitas Midstream and Osum Oil Sands. He received his BA cum laude in psychology and economics with Distinction from Duke University, a J.D. magna cum laude from Harvard Law School and a MBA with high distinction from Harvard Business School.
Dave PearceDave is Deputy Managing Partner with Azimuth Capital Management. During his 36 years in the energy sector, Mr. Pearce has worked in a variety of technical and executive roles in Exploration, Production and Corporate Development as well as an Independent Director in Canada and internationally. Mr. Pearce was President and CEO of Northrock Resources, an intermediate Canadian E&P company. Currently, Mr. Pearce is also a Director of TimberRock Energy, Altex Energy Ltd., Kaisen Energy, Kaden Energy, Entrada Resources and Raging River Exploration.
Jim NieuwenburgJim is an Operating Partner at Azimuth Capital Management. He has over 35 years of experience in the energy sector and over 20 years of executive management and corporate governance experience. Previously, he has held positions at Petromet Resources (CEO), Norcen Energy (Vice President) and Amoco Canada. Jim also serves as a Director on the boards of Corex Resources, Monolith Materials, Recovery Energy Services and Rifco Inc.

22
Historical Financial Summary
1. Unaudited, subject to Board approval2. NOI as presented does not include realized hedging gains/(losses)
20171 2017 2016 2016 2015 2015Full Year Q41 Q3 Q2 Q1 Full Year Q4 Q3 Q2 Q1 Full Year Q4 Q3 Q2 Q1
ProductionOil (bbl/d) - - - - - 16 - - - 65 79 54 64 82 116Gas (mcf/d) 88,559 116,138 85,769 66,194 85,832 67,151 74,626 75,484 71,376 46,944 23,538 26,513 24,318 19,431 23,853NGL (bbl/d) 3,166 4,838 3,501 1,868 2,427 2,099 2,254 2,506 2,399 1,232 614 875 539 519 521Total (boe/d) 17,926 24,194 17,796 12,900 16,732 13,307 14,692 15,087 14,295 9,121 4,616 5,348 4,656 3,840 4,612
Financial ($ 000)Net Operating Income2 74,435 23,425 14,130 14,241 22,639 50,484 20,154 16,506 10,188 3,636 13,098 3,082 3,272 3,945 2,799 EBITDA 84,282 30,855 19,631 13,074 20,722 47,513 15,529 16,104 11,452 4,428 6,819 1,571 1,559 2,558 1,131 Cash Flow 71,025 27,132 16,347 9,705 17,841 43,225 14,503 15,138 9,518 4,066 4,881 1,103 1,176 1,598 1,004 Capex (incl. A&D) 180,623 25,735 50,972 54,539 49,377 84,453 28,432 23,499 (2,209) 34,731 402,684 58,667 79,415 222,931 41,671
Capital Structure ($ 000)
Working Capital Deficit (Surplus) 4,688 4,688 23,176 23,916 (8,140) 11,507 11,255 5,875 612 16,981 46,854 46,854 41,707 (7,196) 32,116 Bank Debt 66,147 66,147 48,759 13,091 - 76,555 76,555 68,258 65,180 60,538 - - 555 50,000 25,000 Term Notes 121,322 132,275 121,078 125,645 128,867 - - - - - - - - - -Total Net Debt 192,157 203,110 193,013 162,916 120,727 88,062 87,810 74,133 65,792 77,519 46,854 46,854 41,262 42,804 57,116 Total Credit Facility 270,000 270,000 250,000 200,000 200,000 200,000 200,000 140,000 140,000 130,000 130,000 130,000 80,000 70,000 70,000
Netback Summary ($/boe)Net Revenue 18.99 17.13 15.49 22.13 23.07 17.97 22.65 18.83 14.97 13.60 18.82 16.26 18.19 21.77 20.02 Hedging Gain (Loss) 2.79 5.20 4.06 0.27 (0.20) 0.87 (1.28) 0.44 2.46 2.60 0.33 0.60 (0.04) 0.60 0.15 Royalties (0.89) (0.72) (0.65) (1.02) (1.26) (0.94) (1.44) (1.13) (0.46) (0.57) (0.99) (0.73) (0.76) (0.95) (1.57)Opex (3.73) (2.56) (3.25) (5.74) (4.39) (4.56) (4.01) (3.53) (4.49) (6.34) (9.07) (7.49) (9.24) (8.80) (10.99)Transportation (3.00) (3.32) (2.96) (3.23) (2.34) (2.10) (2.29) (2.28) (2.19) (2.31) (0.98) (1.77) (0.55) (0.73) (0.72)Operating Netback 14.16 15.73 12.69 12.40 14.83 11.24 13.63 12.34 10.29 6.98 8.11 6.87 7.60 11.89 6.89 General & Administrative (1.44) (2.00) (0.83) (1.45) (1.27) (1.76) (2.33) (1.12) (1.68) (2.01) (4.52) (5.28) (3.95) (4.57) (4.17)Processing Income 0.16 0.13 0.14 0.19 0.20 0.27 0.19 0.38 0.19 0.37 0.47 1.61 - - -Interest/Other Expense (2.02) (1.68) (2.02) (2.87) (1.91) (0.87) (0.74) (0.70) (1.48) (0.44) (1.16) (0.96) (0.90) (2.75) (0.30)
Cash Flow From Operations 10.86 12.18 9.98 8.27 11.85 8.88 10.73 10.91 7.32 4.90 2.90 2.24 2.75 4.57 2.42

23
Type Curve Assumptions
1. Station 2 Delivery: Economics assume volumes flow through existing Black Swan owned infrastructure (reflects half cycle) with tolls to Station 2 and a price differential of -$0.50/GJ relative to AECO
2. AECO Delivery: Economics assume volumes flow through new Black Swan owned infrastructure (reflects full cycle) with tolls to AECO on the NGTL system and gas realizations priced equal to AECO
3. FX rate of C$1.25/US$ applied to US$WTI prices4. Economics include equip & tie-in costs of $0.5 MM/well for total well costs of $4.5 MM5. Black Swan pays BC Crown royalties calculated on a sliding scale for gas based on price and production rate & fixed percentage of
revenue for liquids 6. Pricing relative to C$WTI: C5+: 91%, C4: 47%, C3: 33% at US$60/bbl oil (realizations include price offsets; trucking of $4.00/bbl included
in opex & transportation)7. Opex & transportation represent the average cost during the first 12-months
AssumptionsStation 2 Delivery
(reflects existing plant)AECO Delivery
(reflects new plant)D&C Cost ($MM, excl. $0.5 MM tie-in) $4.0 $4.0EUR (Bcf) 9.0 9.0
IP30 - Total (boe/d) 1,160 1,160Heat Content (MMBtu/mcf) 1,150 1,150Liquids Yield (bbl/MMcf) 40 40Price Differential to AECO ($/GJ) -$0.50 -Royalty Drilling Credit ($ MM) $1.05 $1.05 Opex & Transportation ($/boe) $3.95 $4.60 Full Cycle – Infrastructure ($/boe) - $1.34Full Cycle – G&A ($/boe) $0.90 $0.90
B-tax NPV ($MM) $7.0 $5.7B-tax IRR 79% 42%F&D ($/boe) $2.60 $3.95Payout (months) 14 24

24
Completions: Optimization of Design
4,600
5,600
6,600
7,600
2012 2013 2014 2015 2016 20171,400
1,600
1,800
2,000
2,200
2,400
2,600
feet
met
res
Completed Well Length
330
430
530
630
730
830
930
2012 2013 2014 2015 2016 20170.5
0.7
0.9
1.1
1.3
1.5
lbs/
ft
tonn
e/m
Proppant Concentration
0
100
200
300
400
500
600
700
2012 2013 2014 2015 2016 20170
20406080
100120140160180200220
feet
met
res
Stage Spacing
2017 Completion Design
Open hole ball drop• 2,200 m lateral, 34 stages, single port entry• 65 m port spacing• Proppant: 90 tonne/stage, 3,000 tonne/well, 1.33 tonne/m loading• 13,000 m3 recycled slickwater blend
Pad design modifications provide• Optimized landing interval for frac initiation, geometric completion design• Multiple wells with modified zipper frac• Complementary inter-well stage overlap with maximum interference between
wells/stages to enhance stimulated reservoir volume
Early move to short stages, optimizing well length and sand loading in development• 2012/13 – Perf-plug, long stage length, 8 stages x3 perfs/stage, 0.7 t/m• 2014/15 – Open hole, short stage length, 20 stages, 1.0 t/m• 2016/17 – Reduced stage length, increased lateral length, 33 stages,
1.33 t/m• From early development to current design, +33% increase in length, 70%
reduction in stage spacing and 80% increase in sand loading resulting in increasing EUR per well and high recovery factor
Completion Design Evolution
Optimizing Recovery Per DSU• Extended reach wells to reduce capital• Tighter stage spacing (65m vs 90m)• Increased sand intensity with wider inter-well spacing• Fluid additive technology, diversion techniques• Unlimited stage fracturing systems

25
Upper Montney Multi-Well Pad Production Summary
• Black Swan utilizes downhole chokes on all Hz wells for operational purposes
• Data presented is based on actual daily production which has been normalized to adjust for downtime
• Details collapsed for pads where all wells have >365 days of production history, averages represent the average of all Upper Montney wells on the pad
Note: Gas rates shown are raw
Internal UWI Completion Montney IP30 / well IP90 / well IP365 / wellCum to Dec/17 EUR
Reference (Year) Target (mcf/d) (mcf/d) (mcf/d) (Bcf) (Bcf)9 Bcf Type Curve (restricted) 5,900 5,300 3,900 9.072-C Well Pad (6 wells) 2017 Upper 6,438 NA NA 1.6 9.5a-72-C 200/b-059-B 094-H-04/00 2017 Upper 6,545 NA NA 0.3 10.0a-A72-C 200/a-060-B 094-H-04/00 2017 Upper 6,744 NA NA 0.3 10.5a-B72-C 200/d-050-B 094-H-04/00 2017 Upper 6,696 NA NA 0.3 10.0a-C72-C 200/c-093-C 094-H-04/00 2017 Upper 5,321 NA NA 0.2 8.5a-D72-C 200/a-094-C 094-H-04/00 2017 Upper 5,827 NA NA 0.2 8.0a-E72-C 200/c-084-C 094-H-04/00 2017 Upper 7,494 NA NA 0.4 10.042-D Well Pad (8 wells) 2017 Upper 5,373 5,018 NA 1.3 8.0d-42-D 200/a-073-D 094-H-04/00 2017 Upper 5,400 5,018 NA 0.5 8.0d-A42-D 200/b-073-D 094-H-04/00 2017 Upper 5,710 NA NA 0.2 8.0d-B42-D 200/c-063-D 094-H-04/00 2017 Upper 5,480 NA NA 0.4 8.0d-C42-D 200/d-064-D 094-H-04/00 2017 Upper 4,904 NA NA 0.3 8.0d-D42-D 200/d-040-C 094-H-04/02 2018 Upper NA NA NA NA NAd-E42-D 200/a-040-C 094-H-04/02 2018 Upper NA NA NA NA NAd-F42-D 200/b-040-C 094-H-04/02 2018 Upper NA NA NA NA NAd-G42-D 204/d-042-D 094-H-04/00 2018 Upper NA NA NA NA NA2-C Well Pad (6 wells) 2017 Upper 5,997 5,231 NA 4.6 9.4c-E2-C 200/a-091-K 094-A-13/00 2017 Upper 6,641 5,732 NA 0.9 9.5c-D2-C 200/b-100-J 094-A-13/00 2017 Upper 5,815 5,179 NA 0.9 9.0c-C2-C 200/a-100-J 094-A-13/00 2017 Upper 6,076 5,009 NA 0.5 9.0c-B2-C 200/c-025-C 094-H-04/00 2017 Upper 5,463 4,887 NA 0.6 9.5c-A2-C 200/b-035-C 094-H-04/00 2017 Upper 5,178 4,716 NA 0.8 9.5c-2-C 200/a-035-C 094-H-04/00 2017 Upper 6,810 5,862 NA 0.9 10.019-E Well Pad (3 wells) 2016 Upper 4,647 4,674 NA 4.9 9.2b-B19-E 200/b-097-D 094-H-04/00 2016 Upper 3,240 4,444 NA 1.0 9.0a-20-E 200/c-088-D 094-H-04/00 2016 Upper 5,000 4,448 NA 1.2 8.0b-19-E 200/b-098-D 094-H-04/02 2015 Upper 5,701 5,129 4,617 2.7 10.592-C Well Pad (6 wells) 2016 Upper 5,231 4,881 3,892 7.2 8.6a-B92-C 200/c-004-F 094-H-04/00 2016 Upper 5,917 5,577 NA 1.4 11.0a-A92-C 200/a-014-F 094-H-04/00 2016 Upper 6,126 5,614 NA 1.3 11.5a-E92-C 200/b-080-B 094-H-04/00 2016 Upper 4,847 4,309 NA 0.8 6.5a-D92-C 200/a-080-B 094-H-04/00 2016 Upper 4,833 4,317 3,184 1.2 6.5a-C92-C 200/d-080-B 094-H-04/00 2016 Upper 3,774 3,519 NA 0.8 6.0a-92-C 200/d-004-F 094-H-04/02 2013 Upper 5,886 5,951 4,599 1.7 10.022-C Well Pad (6 wells) 2015 Upper 6,786 6,327 4,857 13.2 10.154-D Well Pad (8 wells) 2015 Upper 5,016 4,770 3,766 15.4 8.67-H Well Pad (5 wells) 2014 Upper 6,850 4,645 3,372 8.8 7.3

26
0
1,000
2,000
3,000
4,000
5,000
6,000
7,000
8,000
9,000
10,000
0 60 120 180 240 300 360 420 480 540 600
Pad Operations: Core Area Delineated with High Rate Pads
Upper Montney Pad Performance Tracking Type Curves
2-C
92-C
7-H
19-E
22-C54-D
10 km
Upper Montney Pad Wells
Aitken Core AreaPlot
Legend PadYear
CompletedWells/
Pad
AvgD&C
($MM)
Avg EUR(Bcf)
72-C 2017 6 4.7 10.3
42-D 2017 4 3.9 8.0
2-C 2017 6 4.9 9.4
19-E 2015/16 3 3.72 9.2
92-C 2016 6 3.9 8.6
22-C 2015 7 4.1 11.41
54-D 2015 8 4.6 8.6
7-H 2014 5 6.4 7.31
10.5 Bcf9.0 Bcf7.5 Bcf
Type Curves
Black Swan’s type curves reflect a restricted draw down
42-D
72-C
Normalized Days
Mcf/d

27
Key Western Canadian Pipelines & Market Hubs
NGTL
ENBRIDGE
ALLIANCE
NORTHERNBORDER
TCPL MAINLINE
GREAT LAKESIROQUOIS
VIKING
ROVER
NEXUS
FOOTHILLS
GTN
VECTOR
CHICAGO
DAWN
AECO
MALIN
SKAB
BC
MB
ONQC
WADDINGTONEMERSONSUMAS
STN 2
HENRY HUB
ROCKIES EXPRESS
NIAGRA
OPAL
RUBY
2
3
4
6
5
1
7
8
Infrastructure connects Black Swan to diverse existing and new markets• NEBC Montney is one of the most active natural gas development area
in western Canada • Western Canadian base production declines and new demand will be
predominantly supplied by the Montney• Existing infrastructure capable of delivering ~12 Bcf/d of gas beyond
western Canadian markets (to the US and eastern Canada)
Canadian LNG projects - potential access to offshore markets• Multiple export licenses issued by Canadian government• PETRONAS: PNW cancelled, reviewing other west coast LNG options• LNG Canada (Shell): FID delayed, owners remain supportive• Woodfibre LNG announced approval for funding to proceed Nov 4, 2016
Market2017 FutureBcf/d Bcf/d
1 Westcoast LNG 0 4.0+2 T-South 1.6 1.83 NGTL West Gate 2.1 2.84 Oil Sands 2.6 3.15 Alliance 1.6 2.16 Intra AB Market 3 3.47 Empress/McNeil 4.6 4.6+

28
0.0
0.5
1.0
1.5
2.0
2.5
3.0
3.5
4.0
4.5
5.0
Eagl
e Fo
rd O
il - E
ast (
Top
Qua
rtile
)Bo
ne S
prin
g (T
op Q
uart
ile)
Wol
fcam
p/Sp
rabe
rry
N. M
idla
nd (T
op Q
uart
ile)
Wol
fcam
p - D
elaw
are
(Top
Qua
rtile
)N
orth
Dak
ota
Bakk
en (T
op Q
uart
ile)
Mon
tney
at K
akw
aN
orth
Dak
ota
Thre
e Fo
rks (
Top
Qua
rtile
)SK
Miss
issip
pian
Hz.
Mon
tney
at K
arr
Wol
fcam
p/Sp
rabe
rry
S. M
idla
nd (T
op Q
uart
ile)
Viki
ng H
z. D
odsla
ndCh
arlie
Lak
eM
ontn
ey a
t Ing
a/Fi
rew
eed
Eagl
e Fo
rd O
il - W
est (
Top
Qua
rtile
)Sh
auna
von
Hz.
Kayb
ob D
uver
nay
Top
30 W
ells
Bakk
en H
z. (<
1700
m)
Mon
tney
at B
eg -
Blac
k Sw
anCa
rdiu
m P
embi
na W
est
Mon
tney
at E
lmw
orth
/Wap
itiN
orth
Dak
ota
Bakk
enN
E M
arce
llus D
ryCa
rdiu
m W
illes
den
Gree
nVi
king
Hz.
Alb
erta
Mon
tney
at D
awso
n/Pa
rkla
ndBo
ne S
prin
gW
olfc
amp
- Del
awar
eST
ACK
Mer
amec
Eagl
e Fo
rd O
il - E
ast
Lloy
dmin
ster
Hz.
Wol
fcam
p/Sp
rabe
rry
N. M
idla
ndSW
Mar
cellu
s Liq
uids
Ric
hHa
ynes
ville
Sha
le -
LAEa
gle
Ford
Sha
le -
Gas-
Con
dens
ate
Mon
tney
at B
egM
ontn
ey a
t Gre
ater
Um
bach
STAC
K W
oodf
ord
Nor
th D
akot
a Th
ree
Fork
sM
ontn
ey A
nte
Cree
k Hz
.M
ontn
ey a
t Big
ston
eM
ontn
ey a
t Gla
cier
Glau
coni
te a
t Hoa
dley
Mon
tney
at P
ouce
Cou
peM
ontn
ey a
t Alta
res (
Liqu
ids R
ich)
Wilr
ich
at E
dson
Mon
tney
Tow
erSW
Mar
cellu
s Dry
Wol
fcam
p/Sp
rabe
rry
S. M
idla
ndHa
ynes
ville
Sha
le -
TXTo
rqua
y Fl
at L
ake
Wilr
ich
at R
esth
aven
/Kak
wa
Not
ikew
in S
unda
nce
Eagl
e Fo
rd O
il - W
est
Upp
er M
annv
ille
- Bra
zeau
Mon
tney
at G
roun
dbirc
hKa
ybob
Duv
erna
y Li
quid
s Ric
hM
ontn
ey a
t Tow
n (D
ry)
Eagl
e Fo
rd S
hale
- Dr
y G
as
Year
s
North American Oil and Natural Gas PlaysHalf-Cycle Payout Period
Benchmarking: Ranking Across Commodity
Source: Peters & Co. Limited February 2018, estimates based on US$60/bbl WTI and US$3.00/Mcf NYMEX (C$2.25/Mcf AECO) prices
Median Gas Plays 3.5 Years
Median Oil Plays 2.3 Years

29
$0.00
$1.00
$2.00
$3.00
$4.00
$5.00
$6.00M
ontn
ey -
Pou
ce C
oupe
Mon
tney
- T
ower
Mon
tney
- N
est
2M
ontn
ey -
Att
achi
eEa
gle
Ford
Wet
Tie
r 1
Mon
tney
- D
oeM
ontn
ey -
Ait
ken
Mon
tney
- D
awso
nM
ontn
ey -
Gun
dyN
E M
arce
llus
Dry
Tie
r 1
Mon
tney
- B
ilbo
Mon
tney
- S
unri
seAl
pine
Hig
hM
ontn
ey -
Sun
dow
nM
ontn
ey -
Gro
undb
irch
Mon
tney
- E
lmw
orth
SCO
OP
Woo
dfor
d W
et G
as /
Con
dyM
ontn
ey -
Gor
dond
ale
Mon
tney
- G
laci
erM
ontn
ey -
Tow
nsen
dM
ontn
ey -
Nes
t 1
Mon
tney
- B
lair
Mon
tney
- P
ouce
Cou
peSW
Mar
cellu
s D
ry T
ier
1Te
rryv
ille
/ N
LA
Mon
tney
- W
est
Sept
imus
Eagl
e Fo
rd D
ry G
as T
ier
1M
ontn
ey -
Par
klan
dN
E M
arce
llus
Dry
Tie
r 2
OH
Uti
ca D
ryH
ayne
svill
ePA
Uti
ca D
rySW
Mar
cellu
s D
ry T
ier
2M
arce
llus
Wet
Mon
tney
- G
old
Cree
k ga
sEa
gle
Ford
Wet
Tie
r 2
Mon
tney
- S
epti
mus
Barn
ett
Rich
Uti
ca W
etM
eram
ec W
et G
asPi
neda
leFa
yett
evill
e Co
re /
Moo
refi
eld
Pice
ance
Cana
Wet
Gas
Cana
Lea
n G
asSC
OO
P Sy
cam
ore
Wet
Gas
Uti
ca C
onde
nsat
e
Brea
keve
n H
Hub
Pri
ce (
$/m
cfe)
@ 3
0%
Montney GasMontney OilUS Play
Benchmarking - Key North American Plays
Source: TPH Research, February 2018Assumes: US$50/bbl WTI, US$ -0.95/MMBtu AECO basis, $0.79 USD/CAD for 30% Atax IRR
Relative North American Supply Costs
BSE

30
Substantial Resource to Unlock
Capable of sustaining 2 Bcf/d for 10 years• Gas-in-place supports long-term growth
• Average 250 Bcf/DSU OGIP• 83 Tcf of gas-in-place
• Over 2,600 Hz well inventory and 15 Tcfe of recoverable resource (two horizons only)
• Potential for development of four horizons
Aitken
Laprise/Sojer
Jedney
1. 4.5 wells/DSU/layer (300 m spacing), two layers developed, ranging from 5.0-9.0 Bcf/well, 90% land utilization2. 4.5 wells/DSU/layer (300 m spacing), four layers developed, ranging from 7.0-11.0 Bcf/well, 90% land utilization
Note: Based on management estimates, liquids converted at 1 bbl: 6 Mcf for gas equivalency, 40 bbl/MMcf liquids and 8% shrinkage
DSUs Base Case1 Upside Estimate2
#Hz Locations
#
Recoverable Resource
Tcfe
Hz Locations
#
Recoverable Resource
TcfeAitken 152 1,225 8.3 2,449 19.0
Laprise/Sojer 114 919 4.6 1,837 12.9
Jedney 64 516 2.6 1,031 7.2
Total 330 2,659 15.4 5,318 39
19% Recovery Factor 47% Recovery Factor
Internal Estimate of Resource
10 km
Legend
1
2
3
4

31
Growth Plan Supported by Low Cost Reserves
16%
25%
44%
2%
1%
12%
2016 Reserves: Value1
$0.00
$2.00
$4.00
$6.00
$8.00
$10.00
$12.00
$14.00
PPY AAV ARX BSE BIR CR PEY BNP TOU SRX NVA KEL VII
$/bo
e
Peer Comparison: 3 Year 2P FD&A (incl. FDC)
1. GLJ January 1, 2017 price forecast, includes 1P FDC $0.9 B and 2P FDC $2.4 B2. Natural gas volumes converted to barrels of oil equivalent at 6,000 cubic feet per barrel (6 mcf = 1 boe)
2016 PDP adds replaced 196% of annual production
Avg: $6.43/boe
2016 Company Interest ReservesNet Present
Value1 Before Tax ($MM)
Gas (MMcf)
NGLs (mbbl)
Total (mboe)2 0% 10%
PDP 190,215 6,344 38,046 649 366Total proved 850,804 29,010 170,811 2442 898Proved + probable 2,366,565 83,095 477,522 8,583 2,125
8%
28%
64%
2016 Total Reserves
PDPProved Non-ProducingProbable
32
95
12311
44
104
2016 Reserves: Locations

32
Superior recoveries realized through Black Swan’s North Aitken plant
• Until August 2017 North Aitken was operated to minimize C3 recovery and maximize gas heat content to optimize netbacks (~10 bbl/MMcf C3/C4 vs. design of 20 bbl/MMcf)
• Average McMahon recoveries:• 19 bbl/MMcf (73% C5+); 11% liquids
• Corporate liquids ratio will increase as Black Swan expands its owned and operated processing capacity and McMahon volumes are a smaller percentage
• Long term expected liquids recovery: 30-50 bbl/MMcf (varying based on propane prices)
Black Swan Liquids Yields
0%
10%
20%
30%
40%
50%
60%
70%
80%
Jan
Feb
Mar Ap
rM
ay Jun Jul
Aug
Sep
Oct
Nov De
cJa
nFe
bM
ar Apr
May Jun Jul
Aug
Sep
Oct
Nov De
cJa
nFe
bM
ar Apr
May Jun Jul
Aug
Sep
Oct
Nov De
cJa
nFe
bM
ar Apr
May Jun Jul
Aug
Sep
Oct
Nov De
c
2014 2015 2016 2017
Liquids Revenue as % of Total Revenue
% Liquids Revenue (excl. hedging) % Liquids Revenue (incl. hedging)
North Aitken plant online
Strong gas prices
Weak gas prices
Liquid RecoveriesQ4 2017
bbl/MMcf Corporate North AitkenC5+ 22 24C3/C4 16 21Total 38 45
0
10
20
30
40
50
60
70
80
90
100
Jan/16 Apr/16 Jul/16 Oct/16 Jan/17 Apr/17 Jul/17 Oct/17 Jan/18
Liqu
ids Y
ield
(bbl
/MM
cf)
Black Swan Corporate Liquid Yield
Black Swan Plant McMahon Black Swan Corporate
Black Swan’s plant provides superior liquids yield vs. McMahon

33
0
200
400
600
800
1,000
1,200
1,400
1,600
1,800
Jan-
14
Apr-
14
Jul-1
4
Oct
-14
Jan-
15
Apr-
15
Jul-1
5
Oct
-15
Jan-
16
Apr-
16
Jul-1
6
Oct
-16
Jan-
17
Apr-
17
Jul-1
7
Oct
-17
Avg
Cale
ndar
Day
Gas
(MM
cf/d
)
Production Month
North Montney Production1
ARC
Chinook
CNRL
Conoco
Polar Star
Kelt
Todd
Tourmaline
Saguaro
Storm
BSE
Canbriam
Painted Pony
Progress
NEBC Growth Driven by Junior/Intermediate Producers
1. Historical Tourmaline production represents Shell prior to the Gundy acquisition; UGR combined with historical Painted Pony production; Suncor combined with historical Canbriam
Industry investment• Rig activity: 6 rigs operating Feb 2018 vs. 12 in Feb 2017• North Montney production peak at 1.6 Bcf/d in Dec 2017• Juniors and Intermediates represent ~55% of total North
Montney production, up from ~30% three years ago
June 2015 & 2017 volumes impacted by Enbridge
McMahon turnarounds
Note: Competitor land positions based on public reports and geoSCOUT
20 km
34
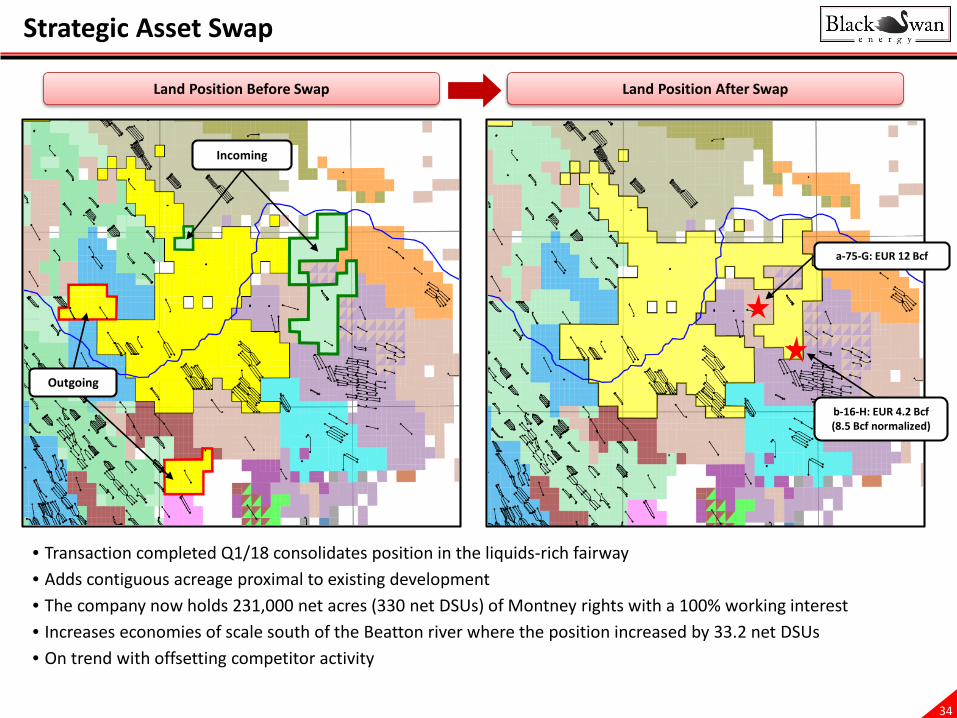
Strategic Asset Swap
• Transaction completed Q1/18 consolidates position in the liquids-rich fairway • Adds contiguous acreage proximal to existing development• The company now holds 231,000 net acres (330 net DSUs) of Montney rights with a 100% working interest• Increases economies of scale south of the Beatton river where the position increased by 33.2 net DSUs• On trend with offsetting competitor activity
Incoming
Outgoing
Land Position Before Swap Land Position After Swap
a-75-G: EUR 12 Bcf
b-16-H: EUR 4.2 Bcf (8.5 Bcf normalized)

35
0
100
200
300
400
500
600
700
800
Blac
k Sw
anPr
ogre
ssCN
QSa
guar
oTO
UCa
nbria
mPo
lar S
tar
CR ARX
ECA
PPY
SRX
CKE
Wom
aRD
SLX
ETO
DD/P
OU
Adur
oCO
PM
UR
KEL
PGF
Prim
aver
a
NET
DSU
s
Repeatable deliverability• Highly over-pressured reservoir 13-16 kPa/m
Liquids-rich• Total liquids of 30-50 bbl/MMcf1 (>50% C5+)
Low capital cost • Shallow target, surface access and drilling characteristics
Low operating costs• Owned & operated infrastructure
Scalable• Large contiguous position
Delivering on a Long-Term Strategy
Upper Montney Oil Window
Normally Pressured
Upper Montney Dry Gas
Alberta
B.C.
Caribou
Umbach
Town
Altares Septimus
Groundbirch
Swan
Parkland
Aitken
Beg
Jedney Laprise
Montney Hz post 2013
Legend
Montney Hz
Black Swan land
Liquids-rich gas window
Dry gas window
Oil window (>75 bbl/MMcf)
Montney TVD contour1600m
25 km
Upper Montney Over-Pressured
Liquids-Rich Fairway
Liquids-rich gas
Largest Holder of Liquids-Rich Montney Rights
Dry gas Oil

36
Corporate Information
Executive Independent Reserve EvaluatorDavid Maddison President & Chief Executive Officer GLJ Petroleum ConsultantsMarc Mereau Chief Operating OfficerBruce Thornhill VP Exploration AuditorsMichael Wilhelm VP Finance & Chief Financial Officer KPMG LLPChristine Ezinga VP Strategy & PlanningLeanne Juneau VP Land Legal CounselBryan Lang VP Operations Norton Rose Canada LLPDiane Shirra VP Business Development
BankersCanadian Imperial Bank of Commerce
Directors Toronto-Dominion BankJackie Sheppard Lead Director Business Development Bank of CanadaDavid Maddison President & Chief Executive Officer Royal Bank of CanadaJim Buckee Independent Director National Bank of CanadaEvan Hazell Independent DirectorJim Nieuwenburg Azimuth Capital Management Head OfficeDavid Pearce Azimuth Capital Management 2700, Bow Valley Square IVRobert Mellema Canada Pension Plan Investment Board 250 6th Avenue SWRoy Ben-Dor Warburg Pincus LLC Calgary, AlbertaDavid Krieger Warburg Pincus LLC T2P 3H7
website: www.blackswanenergy.comPhone: (403) 930-4400
Investor Information Contact
Christine Ezinga (403) 930-4440VP Strategy & Planning [email protected]