literary review and preliminary test design proposal for
TRANSCRIPT

Literary review and preliminary test design
proposal for white shrimp packaging replacement
for a shrimp packaging company from USA
María Elena Villamarín Beltrán
Escuela Agrícola Panamericana, Zamorano
Honduras November, 2020

i
ZAMORANO
FOOD SCIENCE AND TECHNOLOGY MAJOR
Cover page
Literary review and preliminary test design
proposal for white shrimp packaging replacement
for a shrimp packaging company from USA
Special graduation project presented as partial requirement to obtain the Food Science and
Technology Bachelor’s Degree.
Presented by:
María Elena Villamarín Beltrán
Zamorano, Honduras November, 2020

ii
Signature page
Literary review and preliminary test design proposal
for white shrimp packaging replacement for a shrimp
packaging company from USA
Presented by:
María Elena Villamarín Beltrán
Approved:
_______________________________ _______________________________
Adela Acosta, D.Sc.
Principal Advisor
_______________________________
Eddy-M Daniel, Ph.D.
Advisor
Adela Acosta, D.Sc.
Head of Department
Food Science and Technology
_______________________________
Luis Fernando Osorio, Ph.D.
Vicepresident and Academic Dean
por:

iii
Preliminary test design proposal for white shrimp packaging replacement for a shrimp
packaging company from USA
María Elena Villamarín Beltrán
Abstract. Shrimps is one of the most consumed seafood products in USA. The shrimp industry
faces a big challenge due to short shelf life. One of the main trends in the food industry is the
natural products, in which consumers prefer to acquire products that do not use chemical
ingredients during their entire process. For this reason, the food industry currently evaluates
different types of natural preservatives. One of the natural preservatives that has shown promising
results in the meat industry is rosemary extract. In addition, one of the most popular and efficient
methods to extend the products shelf life and maintain their quality is Modified Atmosphere
Packaging (MAP) and vacuum packaging is one of the most used. A packaging system that includes
vacuum atmosphere and rosemary extract is attractive as a fresh product package. During the study,
nine different treatments plus three controls were analyzed, rosemary + polybag, rosemary +
vacuum packaging, vacuum only and control Polybag in three different white shrimp (Litopenaeus
vannamei) presentations (Head-on, Headless, Peeled and deveined). The samples were maintained
in refrigeration. The analysis results show that for microbiological control (Total plate count, Total
coliforms, Salmonella, Staphylococcus aureus, E. coli,), rosemary extract + polybag and Rosemary
extract + vacuum, showed the lower total coliform count at day 6. For color stability, reducing the
color change due to oxidation reaction and quality maintenance, reduce of texture, appearance and
odor change, rosemary+ vacuum in headless presentation was the best.
Key words: Extract, natural, preservatives, rosemary, vacuum.
Resumen. El camarón es uno de los productos marinos más consumidos en USA. La industria
camaronera se enfrenta a un gran desafío debido a la corta vida útil. Una de las principales
tendencias de la industria alimentaria son los productos naturales, en los que los consumidores
prefieren adquirir productos que no utilicen químicos durante todo su proceso. Por esta razón, la
industria alimentaria evalúa diferentes tipos de conservantes naturales. Uno de los conservantes
naturales que ha mostrado resultados prometedores en la industria cárnica es el extracto de romero.
Además, uno de los métodos más populares y eficientes para extender la vida útil de los productos
y mantener su calidad es el envasado en atmósfera modificada (EAM), el envasado al vacío es uno
de los más utilizados. Un sistema de envasado de atmósfera de vacío y extracto de romero es
atractivo para un producto fresco. Durante el estudio, se analizaron nueve tratamientos diferentes
más tres controles, romero + polietileno, romero + envasado al vacío, sólo al vacío y control en
tres presentaciones (con cabeza, sin cabeza, pelado y desvenado) de camarón blanco (Litopenaeus
vannamei). Las muestras se mantuvieron en refrigeración. Los resultados de los análisis mostraron
que para el control microbiológico (Recuento total en placa, Coliformes totales, Salmonella,
Staphylococcus aureus, E. coli), extracto de romero + bolsa de polietileno y extracto de romero +
vacío tuvieron el menor conteo de coliformes totales en el día 6; para la estabilidad del color,
reduciendo el cambio de color por reacciones de oxidación y el mantenimiento de la calidad,
reducción de textura, apariencia y el cambio de olor, extracto de romero + vacío en la presentación
sin cabeza fue el mejor.
Palabras clave: Extracto, romero, natural, preservantes, vacío.

iv
GENERAL INDEX
Cover page ....................................................................................................................... i Signature page ................................................................................................................... ii
Abstract ............................................................................................................................ iii General Index ................................................................................................................... iv List of Tables, Figures, and Appendices .......................................................................... v
1. INTRODUCTION ......................................................................................................... 1
2. MATERIALS AND METHODS .................................................................................. 3
3. RESULTS AND DISCUSION ...................................................................................... 10
4. CONCLUSIONS ............................................................................................................ 37
5. RECOMMENDATIONS............................................................................................... 38
6. REFERENCES ............................................................................................................... 39
7. APPENDICES ................................................................................................................ 50

v
LIST OF TABLES, FIGURES, AND APPENDICES
Tables Page
1. Microbiological limits for raw seafood. .......................................................................... 6 2. Treatments used for the preliminary test. ........................................................................ 7 3. Shrimp presentations in US market................................................................................. 11 4. Packaging materials commonly used in stand-up pouches packaging for fresh raw
shrimp. ............................................................................................................................. 12
5. Packaging alternatives for fresh raw shrimp trade in US summary. ............................... 17 6. Summary of essential oil/extract used for seafood preservation. .................................... 21 7. Total plate count during 0, 6 and 12 days. ...................................................................... 24
8. Total coliforms count during 0, 6 and 12 days HO: Head-on, HL: Headless, PD:
Peeled and deveined. ....................................................................................................... 27 9. E. coli count during days 0, 6, and 12. ............................................................................ 28
10. S. Aureus count during days 0, 6, and 12. ....................................................................... 29 11. Salmonella presence/absence during days 0, 6, and 12. ................................................. 30
12. Headless (HL) shrimp presentation TRT4 and TRT5 L*, a*b* statistical analysis........ 33 13. Headless (HL) shrimp presentation TRT4 and TRT5 L*, a* b* Duncan media
separation per day. .......................................................................................................... 34
14. Control 2, TRT4 and TRT5 in Headless (HL) presentation quality rating during 6
days of storage. ................................................................................................................ 35
Figures Page
1. Process flow American Mariculture, Inc. ....................................................................... 4 2. Head-on (HO) presentation, Control 1: Head-on shrimp + polybag, TRT1: Head-
on shrimp + rosemary extract + polybag, TRT2: Head-on shrimp + rosemary
extract + vacuum packaging, TRT3: Head-on shrimp + vacuum packaging, CFU/g
Colonies Forming Units per gram. .................................................................................. 22
3. Headless (HL) presentation all treatments, Control 2: Headless shrimp + polybag,
TRT4: Headless shrimp + polybag+ rosemary extract, TRT5: Headless shrimp +
rosemary extract + vacuum, TRT6: Headless shrimp +vacuum, total plate count
during time days (0, 6 and 12), CFU/g Colonies Forming Units per gram..................... 23 4. Peeled and deveined (PD) presentation all treatments, Control 3: Peeled and
deveined shrimp + polybag, TRT7: Peeled and deveined shrimp + rosemary +
polybag, TRT8: Peeled and deveined + rosemary extract + vacuum, TRT9: Peeled
and deveined shrimp + vacuum, total plate count during time days (0, 6, and 12),
CFU/g: Colonies Forming Units per gram. ..................................................................... 23
5. Head-on (HO) presentation all treatments, Control 1: polybag only; TRT1: Head-
on shrimp + rosemary extract + polybag, TRT2: Head-on shrimp + rosemary
extract + vacuum, TRT3: Head-on shrimp + vacuum, total coliforms count during
time days (0, 6 and 12), CFU/g Colonies Forming Units per gram. ............................... 25

vi
Figures Page
6. Headless (HL) all treatments, Control 2: Headless shrimp + polybag, TRT4:
Headless shrimp + rosemary extract + polybag, TRT5: Headless shrimp +
rosemary extract + vacuum, TRT6: Headless shrimp + vacuum, CFU/g Colonies
Forming Units per gram. ................................................................................................. 26 7. Peeled and deveined (PD) all treatments, Control 3: Peeled and deveined shrimp
+ polybag, TRT7: Peeled and deveined shrimp + rosemary extract + polybag,
TRT8: Peeled and deveined shrimp + rosemary extract + vacuum, TRT9: Peeled
and deveined shrimp + vacuum, CFU/g Colonies Forming Units per gram. .................. 26 8. Headless (HL) shrimp presentation, TRT4: rosemary extract + polybag, L*(0 to
100), a*(-60 to 60) b*(-60 to 60) color change between days. ....................................... 32
9. Headless (HL) shrimp presentation, TRT5: Headless shrimp + rosemary extract +
vacuum, L*(0 to 100), a*(-60 to 60) b*(-60 to 60) color change between days. ............ 32
Appendices Page
1. Quality rating for raw shrimp. ......................................................................................... 50 2. Organoleptic analysis used for quality rating during 0, 1, 2, 5, and 6 days. ................... 51
3. Images of quality change of Headless (HL) shrimp presentation, Control 2, TRT4,
TRT5 during days 0, 6 and 12. ........................................................................................ 56

1
1. INTRODUCTION
White shrimp (Litopenaeus vannamei) is one of the most important products of the seafood market.
According to IMARC Group (2019), the global farmed shrimp production size reached
4626642174 g (5.10 million tons) in 2019. The United States is one of the main shrimp consumers.
People in the USA increase their consumption level into 1.99 kg (4.4 pounds) per person per day
(NOAA Fisheries 2018). The local market is not supplying the demand of the product. For this
reason, the United States has become one of the bigger shrimp importers and producers. USA
imports increased by 5.1 percent in 2018 against 2017 according to the FAO (2019) shrimp farming
in the USA is increasing, with a shrimp production in 2016 of 1814369.48 kg (4 million pounds),
and the marine aquaculture production increased an average of 3.3 percent per year (NOAA
Fisheries 2018). White shrimp have become the dominant aquaculture species because of their
resistance and survival percentage.
Consumers are demanding natural products. To satisfy these requirements, one of the major
challenges in the food industry consists of reducing conventional chemical additives in food
formulation (Sánchez-González et al. 2011). American Mariculture, Inc. is a shrimp farm that
produces fresh shrimp with no chemical ingredients during its growth and processing, but
packaging and shelf life has proven more challenging. The shelf life of the shrimp varies due to its
presentation. The packed shrimp with a head usually lasts 3-4 days maintaining its organoleptic
and microbiological characteristics, headless approximately 5 days and the peeled and deveined
shrimp 7-10 days. The shelf life of food depends on different factors; one of the main ones is
microbial growth and oxidation. Since consumers expect that, the foods they purchase and consume
will be safe and of high quality, microbial contamination plays a major role as a critical quality
indicator.
Escherichia coli, Klebsiella spp, Vibrio spp., Aeromonas spp., Pseudomonas spp., Listeria spp.,
Shigella, Staphylococcus aureus, and Salmonella typhimurium have been reported as common
spoilage and pathogenic bacteria found in shrimp (Rahman et al. 2016). “Seafood is also known to
have been responsible for a significant percentage of food-borne diseases” (Karunasagar 1994).
Costa (2013) recognized the presence of E. coli in foods as a potential risk for public health. (Jain
et al. 2008) reported an outbreak of enterotoxigenic E. coli associated with consumption of
butterfly shrimp in sushi restaurants in Nevada (USA) in 2004. “Since peeling of shrimp is mostly
carried out by hand, it may be assumed that it will be contaminated with Staphylococcus aureus of
human origin. Enterotoxin production is more often observed in staphylococci of human origin
than in those from other sources.” (Beckers et al. 1985). A few food-poisoning outbreaks have
been ascribed to staphylococcal enterotoxins in cooked peeled shrimp (Gilbert & Wieneke 1973).
“Contamination in shrimp and other seafood products poses both a public health risk as well as an
economic burden associated with lost productivity due to illnesses and increased resource
requirements for monitoring.” (Hamilton et al. 2018). Salmonella spp was the most frequently
reported cause of outbreaks associated with crustaceans from 1998 to 2004 (Hamilton et al. 2018).
Nowadays many different preservation and storage methods are applied to maintain the shrimp
quality (Wan et al. 2010). Investigations have proven that natural antimicrobials and antioxidants
could be used in food processing. (Pisoschi et al. 2018; Preethi 2010). “Several types of Essential
oils and their individual components are used as natural antimicrobial compounds in order to reduce

2
the impact of microbial activities in food products.” (Bhavaniramya 2019). (Helander et al. 1998)
“Promising results have been obtained with essential oils from herbs and aromatic plants. Such
essential oils consist of mixtures of esters, aldehydes, ketones, and terpenes with broad-spectrum
antimicrobial activity.” Oils and extracts are now commonly used. Rosemary extract has been
highly studied. According to Wang and collaborators (2012), rosemary (Rosmarinus officinalis),
contains several important compounds such as one, 8-cineole (27.23%), α-pinene (19.43%),
camphor (14.26%), camphene (11.52%) and β-pinene (6.71%). Just as it is important to take care
of the quality and safety of a food, it is also very important consider its packaging.
Food Industry use a range of packaging attributes, combining, and changing designs, shapes,
colors, and symbols (Nancarrow et al. 1998). These attract and maintain attention and helps
consumers recognize the presented image. Importance of Packaging design and use of packaging
as a means of communication and communication the brand is growing (Rettie & Brewer 2000).
The packaging is similar to other marketing communication elements. One of the reasons is the
fact consumers may not have thought deeply about the brand before entering the store buy. A recent
study estimated that 73% of purchase decisions are made in point of sale (Connolly & Davidson
1996). Prendergast & Pitt (1996) define the basic functions of packaging through the role of
packaging in logistics or marketing. The logistics function of packaging is mainly to protect the
products in the process of moving through distribution channels. This can lead to increase the
packaging cost but can reduce deterioration or loss due to theft or misplacement. The second
function of packaging is essentially marketing role. Packaging provides an attractive way to convey
relevant product attributes to consumers.
Modified Atmosphere Packaging (MAP) is a useful preservation system; it can not only extend the
shelf life of food, but also maintain the natural quality of food (Castellanos 2017). MAP has become
an effective technology that can meet consumers' demands for more and more natural and fresh
foods (Mangaraj & Goswami 2009). One of the most used MAP is vacuum packaging. This system
is subjected to an absence of oxygen. According to Berk (2018), vacuum packaging helps to
prevent oxidation reactions such as lipid oxidation, loss of certain vitamins, oxidative browning,
and loss of pigments. The vacuum also prevents deterioration by aerobic microorganisms and
particularly mold (Berk 2018). Vacuum packaging can be supplement to ice or refrigeration to
delay spoilage, extend the shelf life of fishery products (Shalini et al. 2000)
The objectives of this study were:
To perform a literature review of natural antimicrobials, antioxidants and packaging systems
used in the fresh raw shrimp trade in the USA.
To conduct a preliminary evaluation of three packaging systems for fresh raw shrimp.
To determine the analytical color variables that present the highest variation over time with the
change of the packaging system for fresh raw shrimp in the company.

3
2. MATERIALS AND METHODS
Localization of the study
The literature review, quality analysis, samples preparation and experimental design was carried
out in the processing plant of American Mariculture, Inc. located in 9703 Stringfellow Rd. St.
James City, Florida 33956.The microbial and color analyses were carried out at EMSL Analytical,
Inc. 200 Rout 130 North, Cinnaminson, NJ 08077, external laboratory. Statistical analyses were
performed in Zamorano.
Literature review
Literature review was done by the method (Templier 2015), this method includes different steps:
1. Formulating the problem: the review’s objectives were defined, which justified the need for a
review article; 2. Searching the literature: Sources to use were identified as well as the studies that
were pertinent for the review; 3. Screening for inclusion: The applicability of the studies was
evaluated and then selected or excluded; 4. Assessing quality: the methodological quality of the
primary studies was assessed; 5. Extracting data: applicable information of the primary studies
included in the review were gathered and 6. Analyzing and synthesizing the data: The information
previously extracted were compared, collated, summarized, aggregated and interpreted in order to
suggest a new contribution to knowledge.
Literature review was done by research scientific articles, books, manuals, thesis, and internet
documents. The information was of reliable sources like ResearchGate, Agris, PubMed, Science
direct, Springerlink, and others. The scientific articles used was mostly less than 10 years of
publication, some are older than 10 years but contain relevant information for the study.
Preliminary test
Product description. White shrimp (Litopenaeus vannamei) is usually commercialized as a
refrigerated or frozen raw product. The processing plant processes lots of the same farm. The
product processed in this plant is commercialized fresh, refrigerated, never frozen. One of the most
important characteristics of the product is that no chemical ingredients are added during their raise,
processing, and packaging. The product presentation is the whole shrimp, in three different
presentations (head-on, headless, peeled, and deveined).
Packaging. Shrimp is packed in 1.30 or 2.26 kg (3 or 5 pounds) plastic Low-density polyethylene
(LDPE) tubs placed in Styrofoam box with gel pack or ice, depending on transportation. Styrofoam
box is placed in a corrugated or waxed carton with production traceability code properly indicated.
Preservation method. Cool room 1.1 ± 3 °C (34 ± 3 °F) during plant storage, ice during
processing, and gel pack during transportation. Refrigerated during storage.
Temperature. Shipping-storage in a cold room where temperature variate in 1.1 ± 3 °C (34 ± 3
°F).

4
Organoleptic characteristics. Pieces are selected upon arrival to the plant. All shrimp that fail the
quality control is discarded. Defects pieces during shrimp packaging, damages and broken tails
need to be < 5% of the total production, discolored shrimp < 10% and melanosis presence in < 2%
of the total production.
Flow process. Figure 1 shows the processing lines of the American Mariculture, Inc. plant. The
first line is for Head-on shrimp presentation, and the other line is for Headless and Peeled &
deveined.
Figure 1. Process flow American Mariculture, Inc.
Source: American Mariculture, Inc., HAACP Plan, 2012.
Receiving. Shrimp is received three or four times a week. Shrimp comes from the production
ponds. The company produce white shrimp (Litopenaeus vannamei); this is harvested and then
sacrificed by ice immersion. The shrimp harvested are transported to the processing plant using a

5
heister. Shrimp arrive at the plant with a temperature under the 10 °C (50 °F). When the shrimp
arrive at the plant, a sample was immediately taken, and the shrimp was measured by counting how
many shrimps are into a pound. This measurement was done for the inventory register and to
determine the size of the shrimp. In addition, every bin of shrimp that arrive to the plant was marked
with a code. This code is used for the product traceability.
Wash in tank. All the shrimp that arrives at the processing plant is washed with clean water, this
process is made to eliminate external contaminants like food rests, algae and others. The purpose
of washing the shrimp is to assure that only clean product is introduced to the plant. Once the
shrimp is washed, depending on the requirements of the consumers and clients, the shrimp can
have to different process. Because of the processing plant work under request, shrimp is divided
considering this. For head-on shrimp presentation, the next step of the flow process is size grading.
Size grading. For grading the product, a size grading is used, the shrimp pass through a transporting
band and through the machine. The size grading machine divide the shrimp into three different
sizes small, medium, and large shrimp. Once the shrimp is divided, it is eventually kept into
different bins with ice. For shrimps of headless, peeled, and deveined presentation, there is a
different step before size grading.
Be-heading. After the shrimp is washed with water, it passes through a transporting band to the
be-heading area. This area has the capacity for eight people working. The head is removed by
applying manual pressure behind the head. The removed heads are collected in tanks and then
discarded to the trash. Once shrimp is be-headed, it passes through the transportation band and then
to the size grading machine.
Washing and chill. Once the shrimp is graded by size, it is washed again using water and then
chilled. This step is considered the second critical control point. Since the product passes through
a metal detector to assure elimination of physical hazard for the consumer.
Weight, packaging, and labeling. The product is weighted depending in the order; usually the
shrimp is packaged into 1.36- 2.26 kg (3-5 pounds) Low Density Polyethylene (LDPE) bags. The
bags are packed into a secondary pack. The secondary package contains the product information
like shrimp presentation, size, and number. The product also is packed into a third pack, where the
delivery information, name of the buyer, shrimp presentation and size, is marked.
Cool, storage, and shipping. Shrimp is maintained in a cold room at 0 - 1.1 °C (32-34 °F). Every
day the courier used by the company arrive to the processing plant. The products are shipped to the
consumers.
Microbiological specifications. The processing plant manage their product with the recommended
microbiological specifications by the FDA for raw seafood. Three times per year, samples were
analyzed in an FDA approved laboratory to ensure the microbial quality of the product. The limits
considered to determine if the product is in good or marginal microbiological quality are found in
Table 1.

6
Table 1. Microbiological limits for raw seafood.
Good Marginal
Total plate count < 1000000 CFU/g < 5000000 CFU/g
Total coliforms < 1000CFU/g < 2400 CFU/g
E. Coli < 3CFU/g < 10 CFU/g
S. Aureus < 200CFU/g <1000CFU/g
Salmonella Negative in 25 tests
Source: American Mariculture, Inc., HAACP Plan, 2012.
Materials
Shrimp. Fresh white shrimp (production code: 3377-2) size 10-15 from the production ponds of
the same company were used for this study. The shrimp was harvested the same day of packaging
by ice immersion and immediately transported to the processing plant. A total of 36.28 kg (80
pounds) was used.
The shrimp was divided into three groups: 1. Head-on, 2. Headless, 3. Peeled and deveined. After
beheading, peeling, deveining, and washing with water, shrimps were ready for the experiment.
After the beheading and deveining process, each group weighted 9.07 kg (20 pounds.) with 20
experimental units (EU) per group, each with a weight of 0.45 kg (1 pound).
Rosemary extract. The extract used in this study was the FLAVORSHIELD ® Rosemary extract,
natural (water-soluble), obtained from Silver Cloud States Company.
Packaging system. The packaging was either vacuum bags or poly bags. 30 samples were packed
in poly bags and 30 in vacuum bags. The packaging materials, bags and equipment used for the
preliminary test were:
Five-pound poly bags purchased from Packaging Products Corporation (PPC). Actual
packaging of the company American agriculture. (30 units)
Vacuum bags 0.254 × 0.33 m (10” × 13”). (30 units)
VACMASTER VP215 vacuum sealer.
8 inches, 300W METRONIC Heat sealer.
Methods
Experimental design. A Completely Randomized Design (CRD) with factorial arrangement was
used. Three shrimp presentations, four treatments, including the control, with five replicas per
treatment for a total of 60 experimental units (Table 2).
Different number of experimental units were used for color and microbiological analysis. Color
analysis was done every day in five repetitions of each treatment and presentation. Microbiological

7
analysis was done at days 0, 6 for Head-on presentation control 1 and TRT1, and for days 0, 6 and
12 for Headless and Peeled and deveined all treatments; the analysis was done with just one
repetition, the total of experimental units for color analysis were 60. For microbiological analysis,
34 experimental units were used.
Treatments. Three treatments for three different shrimp presentations plus a control were used for
the experiment. Each treatment was a different kind of packaging or a combination of packaging
and extract. Table 2 shows the packaging specification of for each treatment.
Table 2. Treatments used for the preliminary test.
Treatments Shrimp
presentation Packaging specifications
Control 1
Head-on (HO)
Shrimp + polybag packaging (used in the company)
Treatment 1 (TRT1) Shrimp + rosemary extract + polybag
Treatment 2 (TRT2) Shrimp + rosemary extract + vacuum packaging
Treatment 3 (TRT3) Shrimp + Vacuum packaging
Control 2
Headless (HL)
Shrimp + polybag packaging (used in the company)
Treatment 4 (TRT4) Shrimp + rosemary extract + polybag
Treatment 5 (TRT5) Shrimp + rosemary extract + vacuum packaging
Treatment 6 (TRT6) Shrimp + Vacuum packaging
Control 3
Peeled &
Deveined (PD)
Shrimp + polybag packaging (used in the company)
Treatment 7 (TRT7) Shrimp + rosemary extract + polybag
Treatment 8 (TRT8) Shrimp + rosemary extract + vacuum packaging
Treatment 9 (TRT9) Shrimp + Vacuum packaging
Rosemary extract solution and samples preparation. The recommended concentration of
rosemary extract 0.20% of the total product weight was used. This concentration dosages 100 ppm
of carnosic acid into the product. 4.53 kg (10 pounds) of each shrimp presentation were treated
with the rosemary extract solution, 13.60 kg (30 pounds) in total. Rosemary solution was done by
dilution. The dilution contained 5 L of distilled water and 0.09 kg (0.2 pound) of water-soluble
rosemary extract for each presentation process. The total of rosemary extract used for the
experiment was 0.27 kg (0.6 pounds).
Shrimps were immersed for 60 minutes in the solution, and then removed and left drained for 30
minutes (Rashidaie et al. 2019). Afterwards, all the different treatments of each presentation were
packaged, and stored at 0.5 ± 1 °C (33 ± 1 °F). The samples remained at this temperature throughout
the experiment.

8
Microbiological analysis. Microbiological analysis was performed in 34 of the 60 experimental
units. Of the five repetitions of head-on presentations for control and TRT1, two repetitions were
randomly selected for microbiological analysis. For the rest of the treatments (TRT2 and TRT3) of
head-on presentation and for the other two presentations (headless, peeled, and deveined) all
treatments, three repetitions were randomly selected for microbial analysis.
Microbiological analysis was done at days 0, 6, and 12. This depended on the presentation. Since
the control and TRT1 for the Head-on shrimp presentation presented extended signs of damage
(bad odor and extreme purge) after day 6, the samples from that day forward were discarded for
the experiment. In Head-on presentation, both control and TRT1 samples were analyzed at days 0
and 6. For Head-on shrimp presentation, TRT2 and TRT3, and the rest of the presentations
(Headless, Peeled and deveined) treatments, the analysis was done at days 0, 6 and 12. In the Head-
on presentation, control and TRT1 samples were discarded after day 6, for this reason only days 0
and 6 were analyzed. Samples were randomly chosen from the repetitions of each treatment and
microbial analysis were performed. The microbiological analysis was performed in EMSL
ANALYTICAL, INC. laboratory, the analysis and methods were: Salmonella. V-SPT-AOAC
2013.01. VIDAS SPT Assay is an enzyme immunoassay for the detection of Salmonella receptors
using the ELFA technique (Enzyme-Linked Fluorescent Assay).
E. coli and Total coliforms. Petrifilm AOAC 991.14. 3M Petrifilm (modified violet-red bile media)
contains 2, 3, 5-triphenyltetrazolium chloride and glucuronidase indicator which forms a blue
precipitate around any E. coli colonies that may be present. Plates are hydrated with sample and
gelling agents cause the media to solidify. Gas is formed because of the fermentation of lactose by
coliform bacteria (including E. coli). Glucuronidase negative bacteria form red colonies as a result
of the reduction of 2, 3, 5-triphenyltetrazolium chloride. All blue colonies associated with gas are
counted as E. coli. Red colonies with gas are non-E coli coliforms. The total coliform count is the
sum of red and blue colonies (with gas).
Staphylococcus aureus. Direct plating AOAC 975.55. This method is suitable for the analysis of
foods in which more than 100 S. aureus cells/g may be expected. For each dilution to be plated,
aseptically transfer 1 ml sample suspension to three plates of Baird-Parker agar, distributing 1 ml
of inoculum equitably to three plates (e.g., 0.4, 0.3, and 0.3 mL). Spread inoculum over surface of
agar plate, using sterile bent glass streaking rod. Retain plates in upright position until inoculum is
absorbed by agar (about 10 min on properly dried plates), then count and record colonies.
Total plate count. AOAC 990.12. 3M Petrifilm contains nutrients and 2, 3, 5-triphenyltetrazolium
chloride as an indicator of bacterial growth. Reduction of triphenyltetrazolium by bacteria results
in red colored colonies2. Plates are hydrated with sample and gelling agents cause the media to
solidify. The enumeration has different stages: Inoculation, incubation 35 ± 1 for 48 ± 3 hours and
interpretation.
Color analysis. The values were measured in CIE L*, a* b* where (L) indicates lightness (0 to
100), (+/-a) the degree of redness or greenness (-60 to 60), and (+/-b) the degree of yellowness or
blueness (-60 to 60). The color analysis was done in EMSL ANALYTICS, INC. with Aero’s
spectrophotometer Dual-beam Non-contact Reflectance Spectrophotometer with the method Port
Down; Non-Contact; Rotating platter.

9
Quality analysis. Analysis was performed every day while the samples were inside the cold room,
since the day 0 until the day they were considered not edible. For this test a format was provided
by the HACCP PLAN American Mariculture, INC. Product characteristics measured were
appearance, head, body-shell color, and firmness. The firmness measurement was done by using
the “finger method” (Sigurgisladottir 1999). The linked scale were 1.Good (), 2.Intermediate
(X), or 3.not acceptable (X) and comments were registered for each sample. Comments included
odor and melanosis (Black spots caused by enzyme systems present in shrimp.) presence. Once the
analysis was done, a numerical score from one to nine were given to each sample every day of its
storage. This score was given by using the Shrimp Quality Scale extracted from “Assessing product
quality, shelf-life and consumer acceptance for fresh water, farm raises shrimp (Litopennaeus
vannamei)” Garrido et al. 2000. Where class A shrimp means a score of 1-3, class B 4-6 and class
C 7-9. My person María Elena Villamarín with the guidance of the Processing Plant Manager did
the quality assessing. The processing plant manager manages the company´s quality program.
Statistical analyses. Color (L*, a*, b*) results were analyzed using Analysis of Variance
(ANOVA) and Duncan’s mean separation. The results were analyzed in the Statistical Analysis
System (SAS version 9.4 ®).

10
3. RESULTS AND DISCUSION
Literature review
Worldwide shrimp market. Seafood products are one of the most traded and consumed food
commodities in the world with an expectation to keep on growing (FAO 2007). Seafood trade has
grown up by compound annual growth rate (CAGR) of 4% from 2012 to 2017 (Holland 2019). It
was noticed that the seafood trade grows up more in value than volume. This situation may be the
result of the high value of the salmon and crustacean trade (Holland 2019).
Shrimp is a small, invertebrate marine animal with a laterally compressed and elongated body.
According to IMARC Group's (2019), the global shrimp market reached 4,173,049,804 kg (4.66
million tons) in 2018 and 5.1 million tons in 2019. Due to increased income and healthy lifestyle
and other factors, fresh and frozen shrimp products are very popular among consumers. (IMARC
group 2019). The increase in production and trade may be related to the health benefits of shrimp
consumption, shrimp provides high-quality protein and essential amino acids, minerals and trace
elements, fat-soluble vitamins and essential fatty acids, including long-chain n-3 fatty acids (Syama
2013).
“World production of farmed shrimp reached almost 3,628,738,960 kg (4 million tons) in 2018,
increased by 3 to 5 percent over 2017.” (FAO 2019). The shrimp market is driven by many factors,
such as increasing demand and increasing environmentally friendly production technologies. At
present, Penaeus Vannamei (white shrimp) is the most popular edible shrimp. Others included
Penaeus monodon and Macrobrachium rosenbergii (Holland 2019).
Nowadays, the shrimp production is dominated by China, continued by India, Indonesia, Vietnam,
Thailand and Ecuador (FAO 2019). China shows the major production during the latest years
(IMARC group 2019). In the other side, the principal shrimp consumers are United States, China,
Europe and Japan. The principal shrimp exporters are India, Ecuador, Vietnam, Indonesia,
Argentina, Thailand, China and Mexico on a lesser extent (FAO 2019). According to the FAO
(2019), the seven principal markets imported around USD2.7 million tons of shrimp in 2018; this
amount shows an increase of 31% since 2017. The imports show a little increase in United States
and a decrease in Japan and Australia.
US shrimp market. The US shrimp market reached 691,274.77188 kg (762 tons) in 2019 and is
considered the second largest shrimp consumer after China (FAO 2019). In the United States,
shrimp is the main seafood consumed product, accounting for 25-30% of the country's total seafood
market. Consumers in the United States increased their shrimp consumption to 1.99 kg/day/person
(4.4 pound/day/person), 0.45 kg (one pound) more than the second most popular salmon. Due to
its health benefits, the consumption of shrimp in the United States has been increasing in recent
years. People work hard to consume health products. In the United States, another demand trend is
to buy convenience foods, such ready to cook or ready to eat (IMARC 2019). Because of its high
demand, the United States needs to import products, which is why it is considered one of the largest
shrimp importers. The majority of prawns on the US market are imported from Asia and Latin
America.
11
This increase in demand has caused the US to improve in its local market. The United States is
considered a small-scale aquaculture producer. According to NOAA Fisheries (2018), from 2009
to 2014, aquaculture production increased by an average of 3.3% per year and maintained a growth
trend. Since many years ago, different states in the United States, such as Georgia, Florida,
Alabama, Louisiana, Texas and other areas began to experiment, research and improve shrimp
farming. According to Gonzales (2019), Texas is the largest producer of farmed shrimp, with
production in 2017 of approximately 3.2 million pounds. Alabama is the second largest farmed
shrimp, producing 138,151.1 kg (304,571 pounds) in the same year. Farmed shrimp imports
account for most of the shrimp supply in the United States.
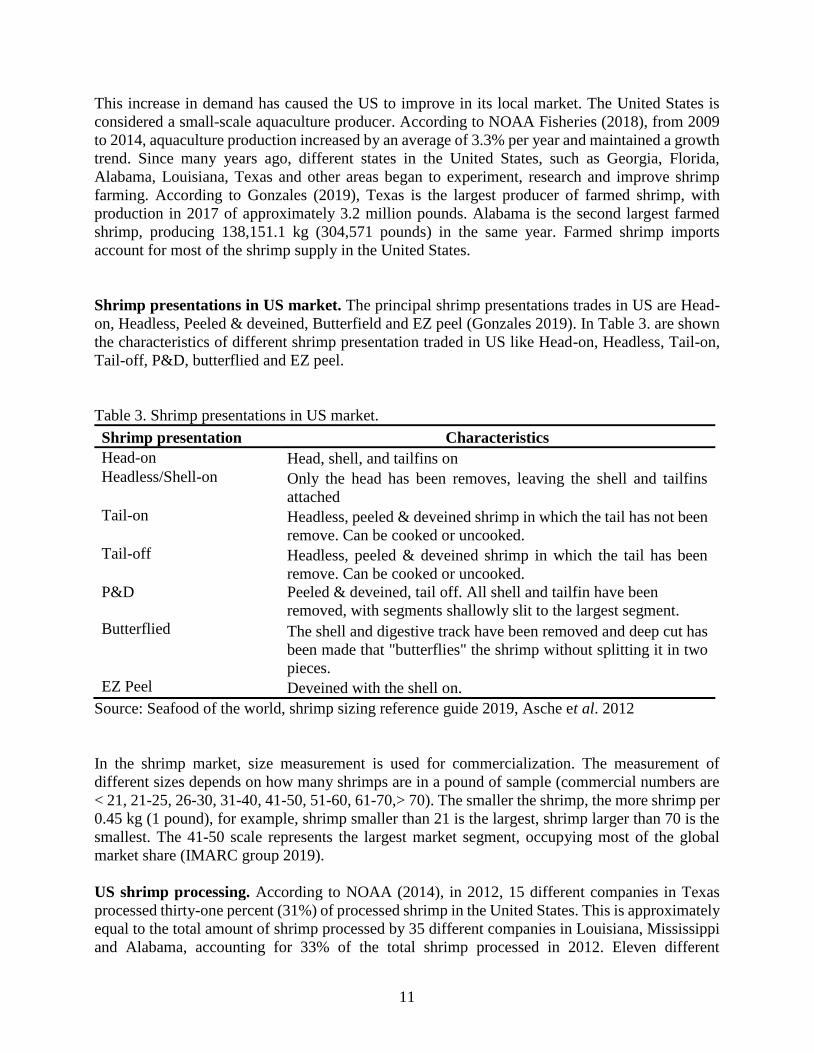
Shrimp presentations in US market. The principal shrimp presentations trades in US are Head-
on, Headless, Peeled & deveined, Butterfield and EZ peel (Gonzales 2019). In Table 3. are shown
the characteristics of different shrimp presentation traded in US like Head-on, Headless, Tail-on,
Tail-off, P&D, butterflied and EZ peel.
Table 3. Shrimp presentations in US market.
Shrimp presentation Characteristics
Head-on Head, shell, and tailfins on
Headless/Shell-on Only the head has been removes, leaving the shell and tailfins
attached
Tail-on Headless, peeled & deveined shrimp in which the tail has not been
remove. Can be cooked or uncooked.
Tail-off Headless, peeled & deveined shrimp in which the tail has been
remove. Can be cooked or uncooked.
P&D Peeled & deveined, tail off. All shell and tailfin have been
removed, with segments shallowly slit to the largest segment.
Butterflied The shell and digestive track have been removed and deep cut has
been made that "butterflies" the shrimp without splitting it in two
pieces.
EZ Peel Deveined with the shell on.
Source: Seafood of the world, shrimp sizing reference guide 2019, Asche et al. 2012
In the shrimp market, size measurement is used for commercialization. The measurement of
different sizes depends on how many shrimps are in a pound of sample (commercial numbers are
< 21, 21-25, 26-30, 31-40, 41-50, 51-60, 61-70,> 70). The smaller the shrimp, the more shrimp per
0.45 kg (1 pound), for example, shrimp smaller than 21 is the largest, shrimp larger than 70 is the
smallest. The 41-50 scale represents the largest market segment, occupying most of the global
market share (IMARC group 2019).
US shrimp processing. According to NOAA (2014), in 2012, 15 different companies in Texas
processed thirty-one percent (31%) of processed shrimp in the United States. This is approximately
equal to the total amount of shrimp processed by 35 different companies in Louisiana, Mississippi
and Alabama, accounting for 33% of the total shrimp processed in 2012. Eleven different

12
processors in Florida accounted for 13% of the shrimp processed that year. Overall, in 2012, shrimp
processors in Texas, Louisiana, Florida, Mississippi, and Georgia accounted for 78% of shrimp
processing. In other words, the NOAA report (2014) shows that for every 2.26 kg (5 pounds) of
shrimp processed in the United States in 2012, 1.81 kg (4 pounds) were processed in the Gulf of
Mexico or the South Atlantic.
The US shrimp processing industry has already encountered some economic challenges. The
shrimp processing line is its existing business (Kuhar et al. 2016), but the increase in imports of
processed shrimp products has had a negative impact on the country. Especially in the business of
shrimp processors. The processing sector generally welcomes the import of unprocessed shrimp as
they represent the source of raw materials for domestic processing activities (Keithly & Poudel
2008).
Packaging alternatives for raw shrimp in US trade. Packaging is an important factor to consider,
not only in the extension of the shelf life of fish and fishery products but also improving their
marketability (Srinivasa et al. 1993). Packaging and combination process for food preservation can
be used to improve the quality of conventional products or develop new products. They ensure
stability and safety, so that the product has sufficient sensory and nutritional properties (Leistner
1992).
The Food and Drug Administration supervises the production, manufacturing, processing,
packaging, and labeling of food and drugs. Food packaging manufacturers must prove to the
respective agency (Food and Drug Administration [FDA]) that all materials that encounter food
are safe (FDA 2004). For some foods, this does not seem to be that important for example, nuts in
the shell, foods that need to be washed before eating. However, for other foods, packaging is
essential to ensure that the food is safe to eat (Marinac 2013).
Packaging materials. The most used packaging materials are shown in Table 4 for raw seafood
are PET/PVDC/LDPE/LLDPE, PA/PVDC/LDPE/LLDPE, PC/EVOH/EVA, MOPP, and
OPP/PVDC, because of its good barrier and resistance (Sharma 2019).
Table 4. Packaging materials commonly used in stand-up pouches packaging for fresh raw shrimp.
Packaging materials Full name
PET Polyethylene terephthalate
PVDC Polyvinyl chloride
LDPE Low density polyethylene
LLDPE Linear low-density polyethylene
PA Polyamide
PC Polycarbonate
EVOH Ethylene vinyl alcohol
EVA Ethylene vinyl acetate
MOPP Mono-oriented polypropylene
OPP Oriented polypropylene
Source: Sharma 2019.

13
Shrimp packaging requirements. Appropriate fresh seafood packaging should keep it moist and
prevent dehydration, prevent chemical and bacterial deterioration, provide a barrier for moisture
and oxygen, to reduce fat oxidation and prevent external odor penetration (Bindu & Sreejith 2018).
Stand-up pouches. Stand-up pouches are welded bags with a good shape at the bottom and can be
placed upright. They are made of various laminates printed on the middle layer, and their multi-
color printing is very important for marketing. The retort bag is a type of bag made of laminate,
plastic film, and aluminum foil. They can be formed by welding from four sides (pillow-shaped
bags), or they can be formed as upright bags with a bottom. (Izdebska 2016). This kind of
packaging is one of the most used for fresh and frozen seafood including shrimp. The stand-up
pouch also is called barrier bag and Mylar® film bag. This packaging is built by laminating together
multiple layers of scientifically formulated film (Marinac 2013). The laminated process results in
a puncture and moisture resistant package. Stand up pouches are capable to protect seafood from
odor, bacteria, vapor, and oxygen. This kind of packaging reduces the oxygen present in the
packaging environment. This oxygen reduces keep safe the product during it travel to the
distribution channel and then to home. (Vera et al. 2020)
The basic components of most multilayer structures are polyolefin, such as polyethylene (PE) or
polypropylene (PP). This is due to its rich content, wide range of uses, flexible processing,
moderate price, excellent moisture resistance and chemical inertness. However, these substances
have poor barrier properties to oxygen, flavor, and aroma molecules (Vera et al. 2020). In addition
to other specific barrier effects, the inner and outer layers of the packaging also bear other
responsibilities, the inner layer is in direct contact with food ingredients, so it is important that the
ingredients are inert and must not react with any food ingredients. The inner layer should also have
good sealing properties at lower temperatures. On the other hand, in addition to the barrier function,
the outer layer must also provide mechanical stability and printability (Morris 2016).
According to Fredonia group (2017), flexible packaging like stand-up pouches is now used in
different kind of food like beverages; candy & snacks; cheese; fresh produce; meat, poultry, &
seafood; pet food; processed foods. The demand for stand-up pouches in the U.S. will grow almost
6% year over year to USD2.9 billion by 2022. The high demand of this packaging is due to its
multiple benefits (Morris 2016).Stand-up pouches offer many advantages such as product
freshness, in some cases clear film that allow consumers to see the product quality for themselves.
(Morris 2016; Sharma 2019). This packaging can keep food fresh because it provides an excellent
barrier control to prevent the intrusion of elements in the food. Stand up pouches allow using
puncture resistant films to protect the product during transportation. The stand-up pouch is very
sturdy and can withstand all losses except the most important impact, falling (Marinac 2013).
One of the most important features of this packaging is that it helps to build the company brand in
different ways. On the other hand, this packaging can provide free marketing. The company's brand
will be enhanced because the stand-up pouch allows printing and design, and manufacturers can
add brand and other information about the product. Graphics can be placed on the stand-up pouches
make the customer feel an impulse for buying the product (Robat 2017).
MAP. Modified atmosphere packing (MAP) refers the replacing of the air in a food pack with a
different mixture of gases (Cann 2001; FAO 2001). Modified atmosphere packaging technology is
used since 1930 and has been a critical area of research especially because of the waste and money

14
lost due to the fast spoilage in fishery products (DeWitt 2016). Along the latest decades, there has
been an increase in gas packaged food products in the market. This increase has brought
improvements to the packaging industry, which has led to the development of high barrier polymers
and thermomould packaging equipment. Gas packaging is considered an extension of vacuum
packaging. Food packaging under modified atmosphere use different gases, such as CO2, N2, and
O2, with CO2 (Silliker & Wolfe 1980).
One of the biggest challenges is choosing the right gas mixture. The appropriate MAP must be
selected to prevent bacterial growth, because some bacteria are aerobic or facultative under aerobic
or anaerobic conditions, while others are anaerobic (Silliker & Wolfe 1980). Soccol (2003)
mentioned than the optimal modified atmosphere for packaging of Pacific white shrimp
(Litopenaeus vannamei) under controlled storage conditions, it is determined to be 75% CO2, 10%
O2 and 15% N2. Using this gas mixture, the growth of microorganisms, pH and TVB-N content
are reduced. Sufficient gas composition can make the product form the most suitable exudate,
reduce the content of TVB-N, and inhibit the growth of microbial flora. In addition, it maintains a
high odor and appearance score in the packaged Pacific white shrimp, and the shelf life is extended
to 11-12. The results of this study are very similar to those of the FAO (2001), indicating that the
recommended mixed gas for white fish, shrimp and scallops is approximately 40% carbon dioxide,
30% oxygen and 30% nitrogen. Flexible and semi-rigid plastics and plastic laminates are the most
common materials used for MAP foods. Plastic materials account for approximately one-third of
the total materials demand for food packaging applications, and their use is forecast to grow
(Mullan 2003).
The three main commercial gases in modified atmosphere packaging are carbon dioxide (CO2),
nitrogen (N2) and oxygen (O2) (Giménez et al. 2002). Carbon dioxide can inhibit the bacterial
deterioration of fish, but a high proportion of carbon dioxide can cause fish schools to collapse and
excessive dripping. Oxygen can help prevent color changes, while nitrogen is an inert gas used to
dilute the mixture (Cann 2001; FAO 2001). CO2 is soluble in water and lipids, which is the main
reason for the antibacterial effect of MAP. “CO2 concentration in MAP has been extended the
shelf-life of foods by inhibiting the microbial growth of Enterobacteria and H2S-producing
bacteria” (López-Caballero et al. 2002) In foods high in fat such as seafood, beef and poultry,
excessive absorption of carbon dioxide may lead to a phenomenon known as "package collapse"
(Parry 1993). N2 is an inert gas with low solubility to water and lipids. It is used to replace oxygen
in packaging, reduce oxidative rancidity and inhibit the growth of aerobic microorganisms (Farber
1991). Because of its low solubility, it is usually used as a filling gas. Although anaerobic
microorganisms have different sensitivity to oxygen, O2 usually stimulates the growth of aerobic
bacteria and may inhibit the growth of only anaerobic bacteria (Farber 1991).
According to Cann (2001) and FAO (2001), MAP has many advantages and disadvantages.
Improved atmospheric packaging has some advantages. For example, it extends the storage life.
When the modified atmospheric packaging is at 0 °C, the fresh-keeping time of raw shelled shrimp
and shrimp is 30% longer than that of other types of packaging. The generation of fast-effect dark
spots is suppressed (FAO 2001). The appearance of the packaging is very attractive, because the
packaging is transparent, the buyer can clearly see the product, and the MAP is tasteless, easy to
label and easy to handle, and the appearance of the packaging is very attractive. Transparent
packaging, buyers can clearly see the product (Cann 2001).

15
MAP shows different shortcomings. For example, this is a relatively expensive technology, about
twice as much as vacuum packaging (with regards to packaging material). Equipment is also more
expensive, usually fourfold (Mullan 2003). Modified atmospheric packaging is usually heavier
than other types of packaging. Therefore, transportation and storage are more complicated, and the
packaging walls may collapse due to When the collapsed carbon dioxide content is high, the high
carbon dioxide content will cause dripping, and the shelf life may be lost if the cold chain is
ignored.
Vacuum Skin Pack (VSP). The technology is used for fresh and processed meats, ready-to-eat
meals, poultry, and seafood. This technology tightly wraps the product and couples its shape into
a second skin. VSP packaging uses heat and vacuum to tighten the flexible top film to the product
and seal it to the tray. Remove all atmosphere from the inside of the package and fix the product in
this second skin. By heating the skin to shrink, the formation of air is avoided, the formation of
visible exudate is reduced, and the shelf life of microorganisms is extended (Carreira et al. 2004).
According to Soccol et al. (2003), compared with traditional outer packaging, vacuum skin
packaging reduces fish rancidity and lipid hydrolysis.
Packaging material. The structure of this packaging consists of three layers: exterior, middle, and
interior. The outer layer has strength, heat resistance and printing ability, the middle layer is a
barrier layer, and the inner layer has heat sealing, pressure resistance and drip resistance properties.
LDPE, PVC and Surlyn ionomers are commonly used for skin packaging; this technology is used
in thermoformed containers (Li 2012).
Thermoforming in skin packaging has advantages such as longer shelf life. The shelf life of VSP
products is almost twice that of traditional MAP. Retailers will reduce its shrinkage, reduce
consumer food waste, present a beautiful appearance, high-definition, and smooth film to focus on
the product and make it in Supermarkets stand out, and a small part of commercialization can be
purchased at retail (Vasquez et al. 2004). The main disadvantage is cost. The smallest continuous
thermoforming machines usually round the USD 100,000 or more.
LDPE bags. Usually, the order of packing fresh or frozen seafood stars together is with the main
inner packaging and ends with the main packing box or the third packing. The main packaging
material in contact with food is usually low-density polyethylene (LDPE). Depending on the
product, the packaging can be bag-like or film-like. Usually, the packaged product is about 0.90 –
2.26 kg. (2-5 pounds). The glaze is about 10-20% (Bindu & Sreejith 2018).
LDPE bags are often used for food packaging due to their transparency and water permeability.
Although they are not as strong as HDPE, the FDA approved LDPE bags for processing and food
packaging (FDA 2004). Low-density polyethylene bags are also commonly used for heat-sealing
purposes due to their low melting point. LDPE is chemically resistant, repels microorganisms, and
does not leach harmful toxins when storing food at various temperatures (Willige 2010).
LDPE packaging shrimp has many advantages, such as low cost, good flexibility, and melting
point: 105 to 115 °Celsius (221 -239 °F) that allows heat sealing, high transparency, high
elongation, softness, low water absorption, chemical resistance to alcohol, minerals, and oils, high
impact strength at low temperatures, and meets FDA requirements (Bindu & Sreejith 2018; Willige
2010). Some of the disadvantages of LDPE bags are susceptible to stress cracking, highly
flammable, high gas permeability, and low strength. When LDPE bags are used as primary

16
packaging, this is generally wrap into a secondary packaging. The most used secondary packaging
is a strong corrugated paper carton box (Bindu & Sreejith 2018).
Corrugated paper carton box. The shape of the box and the materials used allow the use of colors
and graphics to promote the company's brand, which helps achieve marketing goals. One of the
main reasons why companies use this secondary packaging is low cost. The low cost of packaging
is related to the low cost of transportation, which is attributed to the facilities used to deliver
products flat, packaging material principally is composed of Paper/PE/paper laminates (Bindu &
Sreejith 2018; Mena 2014).
Vacuum packaging. The vacuum packaging process involves evacuating air from the package
before sealing (O'Sullivan 2016). Its main purpose is to remove oxygen by pulling the packaging
material in contact with the product. According to Berk (2013), vacuum packaging is an ancient
technology used for food packaging (especially meat). The main purpose of this packaging is to
prevent oxidation reactions, such as lipid oxidation, oxidative browning, pigment loss and certain
vitamins. The purpose of vacuum packaging is also to prevent deterioration caused by aerobic
microorganisms and molds. The shelf life of vacuum-packed products has been extended by several
weeks. Vacuum packaging also offers different advantages, such as reducing the volume of the
packaging and increasing its flexibility.
Vacuum packaging is a natural preservative packaging method that can greatly extend the shelf life
and overall quality of muscle foods for a long time (Sahoo & Kumar 2005). This is the most feasible
packaging method to obtain a longer shelf life (Dey 2003). Vacuum packaging can be
supplemented with ice cubes or refrigerated to delay deterioration and extend the shelf life of
fishery products (Shalini et al. 2000). Keeping food materials under vacuum conditions restricts
the use of oxygen for microbial growth and oxidation. This technology will help double the shelf
life of products under cold storage conditions. This technique is commonly used for fatty fish.
Uncommon odors are usually produced due to fat oxidation. Compared with ordinary air
packaging, the shelf life of vacuum-packed refrigerated and refrigerated fish has doubled (Mohan
et al. 2018).
One of the important aspects of vacuum packaging is to use the right materials with good barrier
properties. Usually polyester-polyethylene or nylon-polyethylene laminates are used. Polyester and
nylon have good strength and good oxygen resistance. Polyethylene is heat-sealable and resistant
to water transmission. Materials for the bags are required to be ones into which air does not
penetrate even when they are stored for a long period, and which do not deteriorate or deform under
steam of 100 °C. A bag made at a laminated film of polyvinylidene chloride resin layers is
preferred, because of its high air shutoff properties and transparency (McElhatton & Marshall
2007).
Vacuum packaging has different advantages, such as reducing fat oxidation, reducing microbial
growth, reducing evaporation to reduce the drying of frozen products and burning in the freezer,
extending the shelf life, reducing the volume of bulk packaging containing lighter materials. Its
transparency makes the product beautiful to the appearance, good quality presentation, and low
cost compared with the other MAP (Stammen 1990). Also vacuum packaging technology shows
some disadvantages like difficulty in use of products with sharp edges, requires high barrier

17
packaging material, anaerobic condition caused because of the packaging may allow the growth
and toxin production of Clostridium botulinum and Listeria monocytogenes (Stammen 1990).
For refrigerated, reduced-oxygen packaged raw, unpreserved fish and unpasteurized raw fish
products, Clostridium botulinum type C and non-proteolytic type B and F during the storage and
distribution of finished products, the only obstacle to the formation of toxins is cold storage (Cann
2001). These types of Clostridium botulinum will grow at temperatures as low as 3.3 °C (38 °F).
As mentioned earlier, there is generally no guarantee that the product will remain at a temperature
or below after leaving the processor control device. A time temperature integrator on each
consumer's packaging may be a suitable method to provide this control (FDA 2001).
A summary of the packaging alternatives used in fresh raw shrimp trade in US are shown in Table
5, the summary includes packaging type, principal characteristics, and the sources of the
information. The packaging types described below are Stand-up pouches, MAP, Vacuum Skin
Packaging (VSP), LDPE bags, corrugated paper carton box and vacuum packaging.
Table 5. Packaging alternatives for fresh raw shrimp trade in US, summary.
Packaging Principal Characteristics Sources
Stand-up pouches Laminated of multiple layers
packaging, can be placed upright,
maintain product freshness, reduce
cost, build the company brand.
(Izdebska 2016; Marinac
2013; Vera et al. 2020;
Morris 2016)
MAP Use different gas mixtures, extends
storage life, attractive appearance,
expensive.
(Cann 2001; DeWitt 2016;
Silliker & Wolfe 1980)
Vacuum Skin Packaging
(VSP)
Forms a second skin, extends shelf
life, beautiful appearance, high
equipment cost.
(Marcilene et al. 2003; Li
2012; Vasquez et al. 2004)
LDPE bags Transparency, water permeability, low
cost, good flexibility, allows heat
sealing.
(Bindu & Sreejith 2018;
Willige 2010; FDA 2004)
Corrugated paper carton
box
Used as secondary packaging,
promotes the company brand, low
cost.
(Bindu & Sreejith 2018;
Mena 2014; McElhatton &
Marshall 2007)
Vacuum packaging Reduce/eliminate oxygen, prevent
oxidation reactions, extends shelf life,
laminated multiple layers, reduce
microbial growth.
(O'Sullivan 2016; Berk
2013; Sahoo & Kumar
2005; Dey 2003; Shalini et
al. 2000; Mohan et al.
2018; McElhatton &
Marshall 2007)
Essential oils and extracts for food preservation. Food processers works constantly with food
preservatives to extend the shelf life of their products. Consumer demand for natural and safe
preservatives to control microbial growth and reduce negative effects on health and environment
have increased (Burt 2004). The principal challenges associates with fresh food processing are

18
focused on the consumers’ demand. Consumers insist in safe, long shelf life, and high-quality
products (Brul 1999). The use of natural extracts and essential oils provides a potential solution to
food processors, due to it antimicrobial properties (Lazar et al. 2010).
Plant extracts have been used in seafood to maintain its quality and extend its shelf life by reducing
microorganisms and chemical reactions. According to the microbial load, TMA and thiobarbituric
acid reactive substances (TBARS), the shelf life of sardine fillets treated with 10% cactus peel
extract was extended to 12 days, while the control (untreated sample) was 7 day (Besbes et al.
2016). Adding 2% grape seed or 2% clove bud extract can delay lipid oxidation and reduce the
brightness (L*), redness (a*), salt-soluble protein content and total sulfhydryl changes of silver fish
fillets at 4 °C Under 18 days storage, compared with the control group, the shelf life of fish fillets
was extended by 3 days l (Shi et al. 2014; Hu 2014). Algal extracts have also been used for the
shelf‐life extension of seafood (El-shemy 2020). According to Li et al. (2017), during cold storage,
the increase of total volatile basic nitrogen (TVB-N), TBARS and K-value (amount of adenosine
triphosphate and related compounds) in Pacific white shrimp treated with algae (Porphyra
yezoensis) extract (5 g/L) Inhibit storage (4 °C). Moreover, compared with the control group, the
total survival (TVC) and polyphenol oxidase activity in the treated samples were significantly
reduced, and the shelf life of the treated samples was extended to 8 days, which was better than the
untreated counterparts were 3 days.
For ease of implementation, plant extracts can be incorporated into ice used to preserve seafood.
After the ice melts, the active ingredients will be released from the plant extract, thus preserving
the stored seafood. Bensid et al. (2014) Store a fish in ice containing thyme (0.04% w/v), oregano
(0.03% w/v) and cloves (0.02% w/v) respectively. The shelf life of gastrointestinal and decapitated
and fish stored in ice containing a single extract is 12 days, while the shelf life of those fish stored
in traditional ice is only 5 days. For fish and meat products, it has been established that different
Extracts and oils works as better antibacterial than other preservatives (Tassou et al 1995, Hammer
et al. 1999). Commonly used extracts for fish preservation are oregano (Origanum vulgare), thyme
(Thymus vulgaris) and rosemary (Rosmarinus officinalis) however its efficacy depends on different
factors like pH, storage temperature, oxygen presence and the concentration of the extract or oil
(Tajkarimi et al. 2010). Oregano is one such herb that has been approved in the United States as a
spice and natural flavor that can reduce oxidation. A recent study reports that oregano extract can
maintain the physical, chemical, and sensory receptivity of lamb meat after freezing for 120 days
and reduce its lipid and protein oxidation (Fernandes et al. 2017). In addition to maintaining the
physical and chemical properties of the meat, consumers have also received good sensory
acceptance. These results indicate that oregano prepared using multiple extraction methods may be
a promising alternative to synthetic food preservatives (Veenstra et al 2019).
Research on the antibacterial and antioxidant properties of Mediterranean aromatic plants
concluded that Thymus (Thymus vulgaris) is located between these plants and has an inhibitory
effect on the growth of all microorganisms. (Piccaglia & Marotti 1993). Some other researchers
(Albarracin et al. 2012) It is reported that the concentration of thyme essential oil in water,
propylene glycol and emulsifier solutions is low (2.5 and 8% respectively), when used in Nile
tilapia fillets, at refrigerated temperature and when the fillets are placed, showing highly effective
antioxidants immersed in the solution. By using essential oils, the oxidation process of tilapia fillets
is reduced by 5.0 to 96.5%. This shows that it has a high efficacy even at low concentrations
(Albarracín et al 2012). Silva et al. (2013) recently, the antibacterial activity of thyme against ten

19
food-borne and degenerative bacteria Bacillus cereus was demonstrated. Clostridium perfringens;
Enterococcus faecalis; Enterococcus faecalis; Escherichia coli; Listeria; Pseudomonas
aeruginosa; Salmonella enterica; Staphylococcus aureus; and Staphylococcus epidermidis.
Rosemary extract. Rosemary (Rosmarinus officinalis), which originates from the Mediterranean,
belongs to the Lamiaceae and is one of the largest and most outstanding flowering plant families,
including about 236 genera and 6,900-7200 species worldwide (Laham 2013, Hölihan 1985). The
Lamiaceae includes many plants containing phenolic acids, such as rosmarinic acid, which have
antibacterial, antiviral, antioxidant, and anti-inflammatory properties (Laham 2013). Murcia
(southeast of Spain) is one of the main processors and importers of rosemary. Rosemary is a dense
shrub with branches, evergreen, and blue-white flowers, reaching a height of about 1 m (Xinfang
1993; Löliger 1991). In the past 20 years, the number of articles about R. officinalis L has increased
significantly. The interest in this plant has transformed into many studies conducted since 2010,
with an average of 120 times a year, and the number tends to increase.
Rosemary extract has been used due to its hepatoprotective effect (Rašković et al. 2014); the
therapeutic potential of Alzheimer’s disease (Habtemariam 2016) and its anti-angiogenic effect
(Kayashima et al. 2012) to treat diseases. On the other hand, because they can prevent oxidation
and microbial contamination, they are used for food preservation (Djenane et al. 2002).
In order to obtain bioactive compounds from rosemary, it is necessary to obtain plant extracts or
essential oils and perform phytochemical characterization. Use selective solvents and standard
procedures to apply the extraction method to the most active part of the plant (leaf, root, stem or
flower) (Aruoma et al. 1992). These techniques produce complex mixtures in liquid and semi-solid
forms or in dry powder form after solvent removal (Inatani et al. 1983). The most important factors
affecting the extraction process are related to the nature of the plant, the solvent used, temperature,
extraction pressure and extraction time (Inatani et al. 1983; Cui 2012). There are classic extraction
methods, such as Soxhlet extraction, maceration, decocting and infusion; and modern methods,
such as supercritical fluid extraction and solid phase microextraction (Aruoma et al. 1992, Cui
2012). After analyzing the collected items, the commonly used extraction method is to extract
biologically active compounds from medicinal materials, including maceration, hydrodistillation,
distillation and Soxhlet extraction.
The main constituents of the rosemary essential oil are camphor (5.0 – 21%), 1,8-cineole (15 –
55%), α-pinene (9.0 – 26%), borneol (1.5–5.0%), camphene (2.5 – 12%), β-pinene (2.0 – 9.0%)
and limonene (1.5 – 5.0%) in proportions that vary according to the vegetative stage and bioclimatic
conditions (Gordon 1990, Löliger, 1991). Regarding the extracts, the phytochemicals mainly
present in R. officinalis are rosmarinic acid, camphor, caffeic acid, ursolic acid, betulinic acid,
carnosic acid and carnosol (Gordon 1990). Therefore, R. officinalis is mainly composed of
phenolic compounds, di- and triterpenes, and essential oils (Wenkert 1965).
Other common compounds in rosemary are terpenes, usually present in essential oils and resins,
which include over 10,000 compounds divided into mono-, di-, tri- and sesquiterpenes, depending
on the number of carbon atoms and isoprene groups (C5H8) (Lovkova et al. 2001). It is possible
to find in rosemary terpenes such as epirosmanol, carnosol, carnosic acid (tricyclic diterpenes),
ursolic acid and oleanolic acid (triterpenes) (Gordon 1990). However, the carnosic acid, which is

20
converted to carnosol by oxidation, has physicochemical, thermal and photolabile properties, which
can be avoided by a supercritical fluid extraction (low temperature operation) (Madsen et al. 1998).
The antimicrobial properties of essential oils and extracts are closely related to their chemical
composition. Phenolic compounds (such as carvacrol, thymol and eugenol) have the highest
antibacterial activity (Lovkova et al. 2001). Another class of effective active compounds are
alcohols: terpineol-4-ol, gamma terpineol, geraniol, citronellol, menthol and linalool. Plants in the
Lamiaceae family synthesize many of them (Arraz 2013). According to Fang (1993), rosemary oil
resists the Gram-positive bacteria Staphylococcus aureus, Enterococcus faecalis molecules and
Listeria monocytogenes, as well as the Gram-negative bacteria Escherichia coli. The antibacterial
effects of Ersenia and Salmonella are food-borne bacterial strains. Mihajilov et al. (2019) Shows
that essential oils and extracts mainly contain carvacrol (67.0%) and -terpinene (15.3%), such as
basil and rosemary, which are effective against Gram-negative strains (including E. coli).
The antimicrobial effect is the result of the action of the principal rosemary compounds: rosmarinic
acid, carnosol, rosmaridiphenol, rosmanol, epirosmanol, and isorosmanol. These compounds
interact with the cell membrane, causing changes in the genetic material and nutrients, altering the
transport of electrons, leakage of cellular components and changes in fatty acid. In addition, it
produced an interaction with the membrane of proteins that produce the loos of membrane
functionality and its structure (Arraz 2013). (Vegara et al. 2011) reported that the effectiveness of
carnosic acid against pathogenic bacteria is superior to that of any other major extra component,
including rosmarinic acid. Rosemary was tested in different food studies. Gómez-Estaca et al. 2010
reported that rosemary inhibited the growth of common food bacteria contributing to food spoilage.
The antibacterial effect of rosemary has been demonstrated in different food studies: beef meatballs
(Fernandez & López 2005), cooked beef (Ahn 2007), Frankfurters (Resurreccion 1990). Also,
Rosemary contains several antioxidants, mainly phenolic acids, flavonoids and diterpenoids.
Höulihan et al. (1984) and Wu et al (1982) determined that the antioxidant properties of rosemary
were due to its rich content of isoprenoid quinones, which acted as a chain terminator of free
radicals and a chelator of reactive oxygen species (Rosemary Extract). In addition, Gordon pointed
out in 1990 that the phenolic compounds present in commercial extracts of rosemary act as the
main antioxidants when they react with lipids and hydroxyl radicals to convert them into stable
products. According to Löliger (1991), carnosic acid and carnosol act as potent scavengers of
peroxyl radicals. This fact explains the conclusions obtained by Chen et al. 1992, who confirmed
that the effect of both compounds on peroxidation of membrane lipids is higher than the effect
reported by artificial antioxidants such as BHA, BHT and propyl gallate (Arouma 1992).
One of the most important aspects of the antioxidant activity of rosemary is between diterpene and
free radical scavenging activity. In this regard, a (2001) study by Munné-Bosch and Alegre
described the antioxidant capacity of diterpenes in rosemary. The most important element in the
structure of rosemary is the aromatic ring (C11-C12) in the catechol group and the conjugation of
the three basic rings. The catechol group is responsible for scavenging free radical electrons formed
by oxidation. The skeleton formed by the three loops allows charge delocalization. The presence
of carboxyl groups (in the case of creatine) will increase this conjugation, especially in aqueous
systems. However, in a less polar medium such as fat, the lactone structure seems to have greater
stability.

21
Creatine, inositol, rosmanol and epirosmanol are the main phenolic diterpenes responsible for the
antioxidant properties of rosemary (Nieto & Castillo 2018). Wijerante et al. (2007) reported that
creatine and carnosol inhibit lipids, respectively. The percentage of peroxidation is 88-100% and
38-89% under oxidative stress conditions. Generally, the antioxidant effect of natural extracts is
higher than synthetic antioxidants, regardless of the medium, which differs in water or oil.
Table 6 shows a summary of the literature review of natural oils and extracts used for seafood
preservation. Essential oil or extract name, benefits and the source of the information are presented
in the table below. The essential oil/extract presented are cactus peel, grape seed, algal, thyme,
oregano, and rosemary.
Table 6. Summary of essential oil/extract used for seafood preservation.
Essential oil / Extract Benefit as food preservative Source
Cactus peel
Extends shelf life, reduce
TBARS and TMA.
(Besbes et al. 2016; Brul 1999;
Lazar et al. 2010)
Grape seed
Delay lipid oxidation, reduce
brightness (L*), redness (a*).
(Besbes et al. 2016; Burt 2004;
Min hu 2004)
Algal
Extend shelf life; reduce TVC
and polyphenol oxidase
activity.
(Li et al. 2017; Tassou et al. 1995)
Thyme
Reduce oxidation process,
antibacterial properties against
the ten food-borne and Bacillus
cereus
(Bensid et al. 2014; Piccaglia &
Marotti 1993, Albarracín et al.
2012)
Oregano
Maintain lipid and protein
oxidation; maintain physical
and chemical properties of the
product, good sensory
acceptance by consumers.
(Tajkarimi et al. 2010; Fernandes
et al. 2017; Veenstra et al 2019)
Rosemary
Prevent oxidation and microbial
contamination; resist Gram-
positive bacteria
Staphylococcus aureus,
Enterococcus faecalis
molecules and Listeria
monocytogenes, as well as the
Gram-negative bacteria
Escherichia coli.
(Lovkova et al. 2001; Mihajilov et
al. 2019; Arraz 2013; Vegara et al.
2011; Fernandez & López 2005;
Ahn 2007; Resurreccion 1990)

22
Preliminary test
Microbiological analysis
Total plate count. For the FDA, 2020. The total number of plates is very important because it not
only indicates good manufacturing practices in the feeding, harvesting and processing process, but
also indicates the level of viable microorganisms that can produce colonies in the product during
analysis (Maturin & Peeler 2001). Total plate count growth of Head-on presentation TRT1, TRT2,
TRT3 and control 1 are presented in Figure 2. The results presented for TRT1 and control 1 were
of days 0, 6 and for TRT2 and TRT3 of days 0, 6 and 12. Figure 2 shows that all of the treatments
plus the control growth in a similar way. TRT1 and Control were analyzed at days 0 and 6
presenting the same count at day 6 of equal or more than 25000 CFU/g, TRT1 and Control were
discarded because of extreme damage signs. TRT2 and TRT3 presented the same count at days 6
and 12, the results showed that these two treatments count were equal or more than 25000 CFU/g.
Figure 2. Head-on (HO) presentation, Control 1: Head-on shrimp + polybag, TRT1: Head-on
shrimp + rosemary extract + polybag, TRT2: Head-on shrimp + rosemary extract + vacuum
packaging, TRT3: Head-on shrimp + vacuum packaging, CFU/g Colonies Forming Units per gram.
Total plate count results of Headless shrimp presentation during 0, 6 and 12 days storage for TRT4,
TRT5, TRT6 and Control 2 are presented in Figure 3, It shows that total plate count was maintained
equal or more than 25000 CFU/g in all of the treatments including the control in the different days
evaluated (0, 6, 12).
12000
25000 25000
0
5000
10000
15000
20000
25000
30000
0 2 4 6 8 10 12 14
CF
U/G
DAYS
CONTROL 1
TRT1
TRT2
TRT3

23
Figure 3. Headless (HL) presentation all treatments, Control 2: Headless shrimp + polybag, TRT4:
Headless shrimp + polybag+ rosemary extract, TRT5: Headless shrimp + rosemary extract +
vacuum, TRT6: Headless shrimp +vacuum, total plate count during time days (0, 6 and 12), CFU/g
Colonies Forming Units per gram.
The total plate count analysis for Peeled and deveined presentation, done at days 0, 6 and 12 for
TRT7, TRT8, TRT9 and Control 3 can be found in Figure 4. Figure 4 shows that the control 3,
TRT7, TRT8 and TRT9 begun at day 0 with 25000 CFU/g and then maintained a total plate count
of equal or more than 25000 CFU/g in all of days 6 and 12.
Figure 4. Peeled and deveined (PD) presentation all treatments, Control 3: Peeled and deveined
shrimp + polybag, TRT7: Peeled and deveined shrimp + rosemary + polybag, TRT8: Peeled and
deveined + rosemary extract + vacuum, TRT9: Peeled and deveined shrimp + vacuum, total plate
count during time days (0, 6, and 12), CFU/g: Colonies Forming Units per gram.
All shrimp presentations (Head-on, Headless, Peeled, and deveined) for all treatments Total plate
count are presented in Table 7. It can be observed that the total plate number of head-on (HO)
25000 25000 25000
0
5000
10000
15000
20000
25000
30000
0 2 4 6 8 10 12 14
CF
U/G
DAYS
CONTROL 2
TRT4
TRT5
TRT6
0
5000
10000
15000
20000
25000
30000
0 5 10 15
CF
U/G
DAYS
CONTROL 3
TRT7
TRT8
TRT9

24
shrimp on day 0 is lower than that of headless (HL), peeled, and deveined (PD) shrimp. This result
could be associate with an incorrect handling and processing inside the plant for Headless and
Peeled and deveined presentations.
According to the FDA (2019), “a very low “total” count may therefore lead to false conclusions
about the hygienic quality of the product”. The TPC test can be used to measure the conditions of
raw materials, the effectiveness and sanitary conditions of procedures during processing, the
sanitary conditions of equipment and utensils, and the time x temperature curve during storage and
distribution (Huss 1994).
Headless and Peeled and Deveined presentations had the same CFU/g at the day 0. For days, 6 and
12 all the presentations and treatments maintained the same count. Is important to mention that
during the three days of analysis all the presentations and treatments maintain the limits proposed
as good quality by the company HACCP PLAN (<100000CFU/g). In a similar study done by Irkin
(2011) in minced beef meat at 4 degrees Celsius, total plate counts in vacuum packaging were
found insignificantly (P > 0.05) from the control samples. The highest values were obtained for
control samples.
Table 7. Total plate count during 0, 6, and 12 days.
Total plate count CFU/g
Samples Day 0 Day 6 Day 12
HO-Control 1 12000 ≥ 25000
HO-TRT1 12000 ≥ 25000
HO-TRT2 12000 ≥ 25000 ≥ 25000
HO-TRT3 12000 ≥ 25000 ≥ 25000
HL-Control 2 ≥ 25000 ≥ 25000 ≥ 25000
HL-TRT4 ≥ 25000 ≥ 25000 ≥ 25000
HL-TRT5 ≥ 25000 ≥ 25000 ≥ 25000
HL-TRT6 ≥ 25000 ≥ 25000 ≥ 25000
PD-Control 3 25000 ≥ 25000 ≥ 25000
PD-TRT7 25000 ≥ 25000 ≥ 25000
PD-TRT8 25000 ≥ 25000 ≥ 25000
PD-TRT9 25000 ≥ 25000 ≥ 25000
HO: Head-on, HL: Headless, PD: Peeled and deveined. Control 1: Head-on shrimp + polybag,
TRT1: Head-on shrimp + rosemary extract + polybag, TRT2: Head-on shrimp + rosemary extract
+ vacuum packaging, TRT3: Head-on shrimp + vacuum packaging , Control 2: Headless shrimp +
polybag, TRT4: Headless shrimp + rosemary extract + polybag, TRT5: Headless shrimp +
rosemary extract + vacuum, TRT6: Headless shrimp + vacuum, Control 3: Peeled and deveined
shrimp + polybag, TRT7: Peeled and deveined shrimp + rosemary extract + polybag, TRT8: Peeled
and deveined shrimp + rosemary extract+ vacuum, TRT9: Peeled and deveined shrimp + vacuum,
CFU/g: Colony-forming units per gram, ≥: equal or more than.
Total coliforms. Coliform flora, gram-negative, rod-shaped facultative anaerobic or aerobic, non-
spore formation and lactose-fermenting bacteria are the commonly used indicators. The total

25
number of coliforms is the count of coliforms and fecal coliforms. The coliforms are distributed in
the environment, while the coliforms are present in the intestines of warm or cold-blooded
vertebrae (Tortorello et al. 2015). The organisms considered coliforms are Escherichia coli,
Enterobacter, Klebsiella, Serratia, Citrobacter and Proteus (Soccol 2014).
In Figure 5 total coliforms for Head-on shrimp presentation TRT1, TRT2, TRT3 and control 1 are
presented. The analysis was done at days 0, 6 and 12. Figure 5 shows that at day 6, TRT2 presented
the lowest total coliforms count, and Control 1 presented the highest total coliforms count. At day
12, TRT3 and TRT2 presented equal or more than 25000 CFU/g. It is important to mention that
Control 1 and TRT1 been analyzed at day 0 and 6, after day 6 the samples were discarded because
extreme damage sings.
Figure 5. Head-on (HO) presentation all treatments, Control 1: polybag only; TRT1: Head-on
shrimp + rosemary extract + polybag, TRT2: Head-on shrimp + rosemary extract + vacuum, TRT3:
Head-on shrimp + vacuum, total coliforms count during time days (0, 6 and 12), CFU/g Colonies
Forming Units per gram.
Figure 6 shows Headless shrimp presentation Total coliform count. Treatments analyzed were
TRT4, TRT5, TRT6 and control 2. The analysis was done at days 0, 6, and 12. Figure 6 shows that
the lowest total coliforms count at day 6 was presented by TRT5 and the highest count by TRT6.
At day 12, all the treatments plus the control showed more than or equal of 25000 CFU/g.
260
14000
260
5800
25000
260
20000
25000
0
5000
10000
15000
20000
25000
30000
0 2 4 6 8 10 12 14
CF
U/G
DAYS
CONTROL 1
TRT1
TRT2
TRT3

26
Figure 6. Headless (HL) all treatments, Control 2: Headless shrimp + polybag, TRT4: Headless
shrimp + rosemary extract + polybag, TRT5: Headless shrimp + rosemary extract + vacuum, TRT6:
Headless shrimp + vacuum, CFU/g Colonies Forming Units per gram.
Figure 7 shows Peeled and deveined shrimp presentation total coliform count during days 0, 6 and
12. In Figure 7. We can observe that all the treatments and control 3 maintained the same count at
day 0. TRT7 and TRT9 maintained the same count at day 6 and 12. In addition, TRT7 and control
maintained the same count at day 6 and 12. We can observe that at day 6, TRT 7 and control 3
showed the lowest count of total coliforms CFU/g. At day 12, all the treatments (7, 8, 9) and the
control 3 showed equal or more than 25000 CFU/g.
Figure 7. Peeled and deveined (PD) all treatments, Control 3: Peeled and deveined shrimp +
polybag, TRT7: Peeled and deveined shrimp + rosemary extract + polybag, TRT8: Peeled and
deveined shrimp + rosemary extract + vacuum, TRT9: Peeled and deveined shrimp + vacuum,
CFU/g Colonies Forming Units per gram.
25000
350 770
25000
350
5100
25000
350
5350
10350
15350
20350
0 2 4 6 8 10 12 14
CF
U/G
DAYS
CONTROL 2
TRT4
TRT5
TRT6
0
5000
10000
15000
20000
25000
30000
0 2 4 6 8 10 12 14
CF
U/G
DAYS
CONTROL 3
TRT7
TRT8
TRT9

27
All shrimp presentations (Head-on, Headless, Peeled, and deveined) Total coliforms count are
presented in Table 8. In all the different treatments it is noticeable the difference in the microbial
growth. At day 0, Peeled and deveined presentation showed the lowest count. At day 6 head-on
(HO) TRT2 (vacuum + rosemary extract), headless (HL) TRT5 (vacuum + rosemary extract) and
peeled and deveined (PD) TR8 (vacuum + rosemary extract) showed the lowest CFU/g values.
Then they continue growing up. At day 12 all the treatments of all the presentations, showed equal
or more than 25000 CFU/g.
Table 8. Total coliforms count during 0, 6, and 12 days HO: Head-on, HL: Headless, PD: Peeled
and deveined.
Total coliforms CFU/g
Samples Day 0 Day 6 Day 12
HO-Control 1 260 ≥ 25000 HO-TRT1 260 14000 HO-TRT2 260 5800 ≥ 25000
HO-TRT3 260 20000 ≥ 25000
HL-Control 2 350 4500 ≥ 25000
HL-TRT4 350 2000 ≥ 25000
HL-TRT5 350 770 ≥ 25000
HL-TRT6 350 5100 ≥ 25000
PD-Control 3 70 18000 ≥ 25000
PD-TRT7 70 ≥ 25000 ≥ 25000
PD-TRT8 70 18000 ≥ 25000
PD-TRT9 70 ≥ 25000 ≥ 25000
Control 1: Head-on shrimp + polybag, TRT1: Head-on shrimp + rosemary extract + polybag,
TRT2: Head-on shrimp + rosemary extract + vacuum packaging, TRT3: Head-on shrimp + vacuum
packaging , Control 2: Headless shrimp + polybag, TRT4: Headless shrimp + rosemary extract +
polybag, TRT5: Headless shrimp + rosemary extract + vacuum, TRT6: Headless shrimp + vacuum,
Control 3: Peeled and deveined shrimp + polybag, TRT7: Peeled and deveined shrimp + rosemary
extract + polybag, TRT8: Peeled and deveined shrimp + rosemary extract+ vacuum, TRT9: Peeled
and deveined shrimp + vacuum, CFU/g: Colony-forming units per gram, ≥ equal or more than.
Rosemary + polybag and rosemary + vacuum in all shrimp presentations were the ones with the
slowest microbial growth during all the experiment. These results can be associated with the
presence of rosemary extract. The antimicrobial properties of rosemary extract allow controlling
the microbial growth during storage. Elżbieta et al. (2011) who in their study tittle the effect of
rosemary preparations on the microbial quality and TBARS value of model pork batter found that
with the use of rosemary as an antimicrobial the coliforms count growth in a slowest way than the
control.
Between rosemary + polybag and rosemary + vacuum, the slowest microbial growth was found on
(rosemary + vacuum). This result could be associated with the vacuum technology that control
different kind of bacteria growth. Similar results were found in the study of filleted rainbow trout
and Baltic herring done by Randell et al. (1995), they found that vacuum packaging extend slightly

28
the microbiological shelf life of trout fillets. Other study that showed similar results was in minced
beef storage at 4 degrees Celsius done by Irkin (2011); he shows that coliforms count in vacuum
samples were different statically from the control samples. TRT2 contains rosemary extract and
vacuum, it means that the combination of these two technologies’ may be the reason of the slowest
coliforms growth but there is no literature that proved this yet. Headless shrimp presentation TRT4
and TRT5 were the only one that maintain the CFU/gr admitted by the HACCP Plan American
Mariculture, Inc. until day 6.
E. coli. According to the FDA (2019), “E. coli are mostly harmless bacteria that live in the
intestines of people and animals and contribute to intestinal health. However, eating or drinking
food or water contaminated with certain types of E. coli can cause mild to severe gastrointestinal
illness”. “Due to its high prevalence in the gut, E. coli is used as the preferred indicator to detect
and measure fecal contamination in the assessment of food and water safety” FAO (2011).
In Table 9 all shrimp presentations (Head-on, Headless, Peeled and deveined) E. coli count are
presented. The Analysis was done at days 0, 6 and 12 during storage. Table 9 indicates that all
shrimp presentations and all the treatments present < 10 CFU/gr during days 0, 6 and 12. This value
is inside the limits approved by the HACCP PLAN American Mariculture, Inc. (< 3 - < 10 CFU/gr).
Table 9. E. coli count during days 0, 6, and 12.
E.coli CFU/g
Samples Day 0 Day 6 Day 12
HO-Control 1 <10 <10 HO-TRT1 <10 <10 HO-TRT2 <10 <10 <10
HO-TRT3 <10 <10 <10
HL-Control 2 <10 <10 <10
HL-TRT4 <10 <10 <10
HL-TRT5 <10 <10 <10
HL-TRT6 <10 <10 <10
PD-Control 3 <10 <10 <10
PD-TRT7 <10 <10 <10
PD-TRT8 <10 <10 <10
PD-TRT9 <10 <10 <10
HO: Head-on, HL: Headless, PD: Peeled and deveined. Control 1: Head-on shrimp + polybag,
TRT1: Head-on shrimp + rosemary extract + polybag, TRT2: Head-on shrimp + rosemary extract
+ vacuum packaging, TRT3: Head-on shrimp + vacuum packaging , Control 2: Headless shrimp +
polybag, TRT4: Headless shrimp + rosemary extract + polybag, TRT5: Headless shrimp +
rosemary extract + vacuum, TRT6: Headless shrimp + vacuum, Control 3: Peeled and deveined
shrimp + polybag, TRT7: Peeled and deveined shrimp + rosemary extract + polybag, TRT8: Peeled
and deveined shrimp + rosemary extract+ vacuum, TRT9: Peeled and deveined shrimp + vacuum,
CFU/g: Colony-forming units per gram

29
These results could be associated with the application of Good agricultural practices, Good
manufacturing practices, Good hygiene practices and Hazard analysis critical control point
(HACCP) in all the chain. As FAO (2011) mention, “Prevention and control require a
multidisciplinary approach in animal and plant production as well as risk-based approaches along
the entire food supply chain. These include the application of Good Agricultural Practices (GAP),
Good Manufacturing Practices (GMP), Good Hygiene Practices (GHP) and Hazard Analysis
Critical Control Point (HACCP) from the farm to the consumer”.
Processed food may be contaminated by raw materials, unsanitary water treatment and treatment,
and cross-contamination (FDA 2001). Sales (2020) and Sienkiewics et al. (2013) demonstrated in
their studies the effectiveness of rosemary extract on E. coli control due to its antimicrobial
properties. In the other hand, studies shown that vacuum packaging control E. coli growth. E. coli
count is a useful indicator of the quality of vacuum-packed meat. High E. coli counts (greater than
100 CFU per g) on stored meat could indicate temperature abuse because E. coli does not grow
below 7 °C. A high E. coli count may also indicate a food safety issue (Egan 1988).
Staphylococcus Aureus. Due to the combination of toxin-mediated virulence and antibiotic
resistance, Staphylococcus aureus is considered an important pathogen. Table 10 shows S. Aureus
count during 0, 6 and 12 days of storage for all presentations (Head-on, Headless, Peeled and
deveined). Results shows that all the shrimp presentations and treatments maintain a CFU/g of <
10 at days 0, 6 and 12.
Table 10. S. Aureus count during days 0, 6, and 12.
S. Aureus CFU/g
Samples Day 0 Day 6 Day 12
HO-Control 1 <10 <10
HO-TRT1 <10 <10 HO-TRT2 <10 <10 <10
HO-TRT3 <10 <10 <10
HL-Control 2 <10 <10 <10
HL-TRT4 <10 <10 <10
HL-TRT5 <10 <10 <10
HL-TRT6 <10 <10 <10
PD-Control 3 <10 <10 <10
PD-TRT7 <10 <10 <10
PD-TRT8 <10 <10 <10
PD-TRT9 <10 <10 <10
HO: Head-on, HL: Headless, PD: Peeled and deveined. Control 1: Head-on shrimp + polybag,
TRT1: Head-on shrimp + rosemary extract + polybag, TRT2: Head-on shrimp + rosemary extract
+ vacuum packaging, TRT3: Head-on shrimp + vacuum packaging , Control 2: Headless shrimp +
polybag, TRT4: Headless shrimp + rosemary extract + polybag, TRT5: Headless shrimp +
rosemary extract + vacuum, TRT6: Headless shrimp + vacuum, Control 3: Peeled and deveined
shrimp + polybag, TRT7: Peeled and deveined shrimp + rosemary extract + polybag, TRT8: Peeled
and deveined shrimp + rosemary extract+ vacuum, TRT9: Peeled and deveined shrimp + vacuum,
CFU/g: Colony-forming units per gram.

30
This facultative anaerobic Gram-positive bacterium is one of the main causes of hospital infections.
Staphylococcus aureus is usually found in the nostrils, skin, or hair of warm-blooded animals (Le
Loir et al. 2003). Results could be associated with the storage temperature 0.55±1 °C (33 ± 1 °F)
that is under the temperature that allow S. aureus growth. According to (Schmitt el al. 1990) S.
aureus growth temperature, range is from 7 to 48.5 °C (44.6 – 119.3 °F). In addition, the results
founded may be associated with the vacuum packaging and rosemary extract use. Christiansen et
al. (1965) mentioned the growth of S. aureus was markedly inhibited by vacuum packaging
obtained similar results. In other study, Issabeagloo et al. (2012) results founded that rosemary
showed synergistic activity against S. aureus and L. monocytogenes.
Salmonella. According to the FDA (2020), “Salmonella is a group of bacteria that can cause
gastrointestinal diseases and fever, called salmonellosis. Food handlers who do not wash their
hands and/or use surfaces and tools between food preparation steps when people eat Salmonella
can be spread from raw or undercooked food. Salmonella can also be spread from animals to
people". In Table 11 results shows that Salmonella was absent for all shrimp presentations (Head-
on, Headless, Peeled, and deveined) in all the treatments and controls.
Table 11. Salmonella presence/absence during days 0, 6, and 12.
Salmonella CFU/g
Samples Day 0 Day 6 Day 12
HO-Control 1 Absent Absent
HO-TRT1 Absent Absent HO-TRT2 Absent Absent Absent
HO-TRT3 Absent Absent Absent
HL-Control 2 Absent Absent Absent
HL-TRT4 Absent Absent Absent
HL-TRT5 Absent Absent Absent
HL-TRT6 Absent Absent Absent
PD-Control 3 Absent Absent Absent
PD-TRT7 Absent Absent Absent
PD-TRT8 Absent Absent Absent
PD-TRT9 Absent Absent Absent
HO: Head-on, HL: Headless, PD: Peeled and deveined. Control 1: Head-on shrimp + polybag,
TRT1: Head-on shrimp + rosemary extract + polybag, TRT2: Head-on shrimp + rosemary extract
+ vacuum packaging, TRT3: Head-on shrimp + vacuum packaging , Control 2: Headless shrimp +
polybag, TRT4: Headless shrimp + rosemary extract + polybag, TRT5: Headless shrimp +
rosemary extract + vacuum, TRT6: Headless shrimp + vacuum, Control 3: Peeled and deveined
shrimp + polybag, TRT7: Peeled and deveined shrimp + rosemary extract + polybag, TRT8: Peeled
and deveined shrimp + rosemary extract+ vacuum, TRT9: Peeled and deveined shrimp + vacuum,
CFU/g: Colony-forming units per gram.
Salmonella absence during days 0, 6 and 12 in all treatments and presentations could be associated
with the temperature used during storage 0.55 ± 1 °C (33 ± 1 °F) which is under the appropriate
conditions for Salmonella growth. According to the Appendix 3 (Bacterial Pathogen Growth and

31
Inactivation) by FDA, the limit condition for Salmonella growth is 5.2 - 46.2 °C (41.4 – 115.2 °F)
in a facultative anaerobic environment. In addition, studies showed that vacuum packaging and
rosemary extract were able to control Salmonella growth. Jiyoun K. & Kyung (2004), in their study
effect of vacuum packaging on the microbial profile of chilled chicken during storagefound that
Vacuum packaging effectively retarded microbial growth of total bacteria, Pseudomonas, mold and
yeast, and Salmonella. In the other hand, many authors studied Rosemary extract antimicrobial
activity against Salmonella. Abramovi et al. (2012) in their study titled antioxidant and
antimicrobial activity of extracts obtained from rosemary (Rosemarinus officinals) and vine (Vitis
viniferina) leaves. Confirmed the antimicrobial activity of rosemary extract by the broth
microdilution test using minimal inhibitory (MIC) concentrations against gram-positive
(Staphylococcus aureus, Bacillus cereus, Listeria monocytogenes) and gram-negative bacteria
(Campylobacter jejuni, Salmonella, Escherichia coli O157:H7).
Color analysis
When discussing quality, color is an important feature. The color of the body and exoskeleton
depends on different factors, especially the increase in nutrition. Carotenoids are fat-soluble
pigments that give shrimps a unique color. Astaxanthin is the main carotenoid responsible for the
pigmentation of seafood (Wang et al. 2006). Shrimp cannot produce carotenoids by themselves, so
they are obtained through nutrition. In the wild and farm-raised environment, shrimp absorb
different microorganisms, such as microalgae rich in carotenoids. In addition, carotenoids can be
added to the diet of shrimp. To ensure a good color at harvest, 50-100 ppm (mg/kg) of astaxanthin
should be included in the finishing diet (Meyers and Latscha 1997; Wan et al. 2006). According to
(Haard 1992), shrimp carotenoids are sensitive to oxidation, which is why the color disappears and
changes significantly in a cold atmosphere.
The color loss occurs due to the oxidation of the unsaturated bonds of astaxanthin (Niamnuy et al.
2008). Another important sign that determines damage is the known black spots or melanosis,
which is caused by the oxidation of phenolic compounds into quinines because of the feniloxidasa
action. This endogenous enzyme can work under cold storage and coagulation conditions. The
main signs of melanosis are small black spots around the stomach, feet and head and chest of the
shrimp (Haard 1992). The data analyzed presented in Figure 8 correspond to Headless (HL)
presentation TRT 4. Results shows that at day 1, variables L*, a* and b* presented variations. In
the case of L* value, it maintained with no variation since day 2 until day six. a* and b* maintained
their values with no variation until day 5 and at day 6, presented variations.

32
Figure 8. Headless (HL) shrimp presentation, TRT4: rosemary extract + polybag, L*(0 to 100),
a*(-60 to 60) b*(-60 to 60) color change between days.
Headless shrimp presentation TRT5 values L*(0 to 100), a*(-60 to 60) b*(-60 to 60) during 6 days
of storage are presented (Figure 9). Figure 9 shows that L* value maintained with no variation until
day 1, then presented a low increase at day 2 and maintained with the increase until day 5 and
finally decrease at day 6. a* value maintained with no variation until day 1 and the showed decrease
ad day 2, from day 2 to day 5 showed no changes and then at day 6 showed increase. b* value
decrease a little at day 1, then at day 2 presented an increase and from day 2 to day 5 maintained
with no changes, finally at day 6 showed a high decrease.
Figure 9. Headless (HL) shrimp presentation, TRT5: Headless shrimp + rosemary extract +
vacuum, L*(0 to 100), a*(-60 to 60) b*(-60 to 60) color change between days.
-60
-40
-20
0
20
40
60
80
0 1 2 3 4 5 6 7
L*,A
*B
* V
AL
UE
S
DAYS
L
A
B
-20
-10
0
10
20
30
40
50
60
0 1 2 3 4 5 6 7L*
,A*B
* V
AL
UE
DAYS
L
A
B

33
In Table 12. Statistical analysis for L*, a*b*, L*(0 to 100), a*(-60 to 60) b*(-60 to 60) values are
presented. Shrimp presentation used was Headless in TRT5: Headless shrimp + rosemary extract
+ vacuum. Variables L* (Luminosity) and b* (yellow-blue) are the ones that been affected by the
treatment.
Table 12.Headless (HL) shrimp presentation TRT4 and TRT5 L*, a*b* statistical analysis.
F
R
SQUARE
V.C.
MEAN PROBABILITY
MODEL TRT REP DAY TRT*DAY
L* 1.83 0.397866 6.01 % 43.713 0.076 0.036 0.297 0.298 0.087
a* 0.65 0.190207 2.32 % -0.280 0.795 0.509 0.240 0.866 0.991
b* 3.95 0.587594 3.93 % -6.871 0.001 0.000 0.225 0.000 0.761
L* lightness (0 to 100), a* positive value =red, negative value=green (-60 to 60), b* positive
value=yellow, negative value=blue (-60 to 60), V.C.: variation coefficient, TRT: treatment, REP:
repetitions, TRT*DAY: interaction between treatment and day, PROBABILITI: (P < 0.05), TRT4:
Headless shrimp presentation + rosemary extract + polybag, TRT5: Headless shrimp + rosemary
extract + vacuum.
Considering that TRT4 (rosemary extract + polybag) and TRT5 (rosemary extract + vacuum) were
treated with rosemary, this result means that the different packaging used, polybag and vacuum
may be the ones that made L* and b* values change. In addition, it is important to notice that any
of the variables (L*, a* b*) been affected by the time storage. Interaction TRT*DAY was no
significant for any variable.
Table 13 shows that L* and a* b* of TRT5 (headless shrimp + rosemary extract + vacuum) values
haven´t show statistically difference and don´t presented changes during the 6 days analyzed. In
the other hand, TRT4 (rosemary extract + polybag) showed changes in b* value during the days
analyzed.
Madhusudana et al. (2017) found that the consumers preference for fresh raw shrimp is (L* 37.1 ±
14 a, a* 4.8 ± 0.3 b, b* 10.2 ± 0.5a), in the results, the treatment that maintained similar results
with Madhusudana et al. (2017) was TRT5 (headless shrimp + rosemary extract + vacuum). This
result was similar to Senepati et al. (2017) analysis, where yellowness increase (b* 8.93) after 5th
day of storage under MAP, also found that the control (no MAP) changed its color in yellow,
attributing this change to the oxygen presence.

34
Table 13. Headless (HL) shrimp presentation TRT4 and TRT5 L*, a* b* Duncan media separation per day.
Color Analysis L*, a*, b*
V.C.
Day 0 Day 1 Day 2 Day 5 Day 6
Mean ± S.D. Mean ± S.D. Mean ± S.D. Mean ± S.D. Mean ± S.D.
TRT4 L* 15.73% 43.74 ± 6.32 a 43.56 ± 7.19 a 40.15 ± 3.52 a 41.07 ± 6.74 a 41.00 ± 9.08 a
a* 772.15% (0.22) ± 0.55 a 0.51 ± 1.63 a 0.12 ± 1.08 a 0.45 ± 1.67 a (0.41) ± 1.09 a
b* 24.59% 4.82 ± 2.24 b 3.95 ± 1.64 b 4.54 ± 0.59 b 4.14 ± 1.24 b 9.29 ± 0.84 a
TRT5 L* 12.17% 43.80 ± 3.76 ab 43.50 ± 6.37 ab 52.08 ± 3.95 a 49.23 ± 5.57 a 39.53 ± 8.11 b
a* 349.64% 0.69 ± 0.62 a 0.63 ± 1.20 a 0.61 ± 1.76 a 0.25 ± 1.76 a (0.1) ± 1.47 a
b* 35.34% 9.02 ± 6.74 ab 5.42 ± 2.20 b 8.21 ± 2.23 ab 7.74 ± 1.55 ab 11.55 ± 2.09 a
L* lightness (0 to 100), a* positive value =red, negative value=green (-60 to 60), b* positive value=yellow, negative value=blue (-60 to
60), S.D.: Standard Deviation, MEANS with different letters (a-b) in the same row present statistical difference (P < 0.05), V.C.: variation
coefficient, numbers in parenthesis () means negative numbers
Quality rating
The quality characteristics of white shrimp (Litopenaeus vannamei) are mainly color, flavor, smell, and texture, as well as its hygienic
and nutritional qualities (Haard 1992). Quality is a product that must meet the characteristics of consumers (Praxiom 2004). The quality
and acceptance of shrimp may be affected by different factors, such as growth conditions, and management during processing according
to (Dunajski 1980; Tsuchiya et al. 1992).
In Table 14 quality rating results of Headless shrimp presentation Control 2, TRT4 and TRT5 for 6 days storage. As shown in Table 14
during the experiment, the treatments evaluated presented different behavior in their characteristics and damage signs. TRT 5 maintained
its quality rating in one value; it means class A product during all the 6 days testing. In the other hand, TRT4 maintained its quality rating
in 1 value until day 5 of storage, then begun to show more damage signs and change its quality rating into 2 value. It means that TRT4
also maintain its quality into class A during the 6 days testing but begun to present damage signs earlier than TRT5.

35
Table 14. Control 2, TRT4 and TRT5 in Headless (HL) presentation quality rating during 6 days
of storage.
Quality Rating
Treatments Day 0 Day 1 Day 2 Day 5 Day 6
Headless (HL)-Control 2 1 1 2 2 3
Headless (HL)-TRT4 1 1 1 2 2
Headless (HL)-TRT5 1 1 1 1 1
Control 2: Headless shrimp + polybag, TRT4: Headless shrimp + rosemary extract + polybag,
TRT5: headless shrimp + rosemary extract + vacuum packaging, quality rating present different
values, 1-3 class A shrimp, 4-6 class B shrimp, 7-9.
According to Garrido et al. (2000), the most important characteristics that determine the shrimp
quality are odor, texture, color, and melanosis presence. Before determining the quality rating for
each treatment, texture, color, odor, and melanosis were measured. During the measurement of this
characteristics along the 6 days, some important changes been noticed.
Texture. The postmortem texture change is considered as one of the most unfavorable
characteristics in the quality of the product, texture change affect more in seafood than in other
kind of meat because of their high endogen enzymatic activity and the low content of collagen in
their muscle structure. During texture, analysis is important to mention that the TRT4 and TRT5
showed a better texture maintenance. This result could be associated with the antioxidant properties
of rosemary extract. Estévez et al. (2005) determine the antioxidant properties of rosemary can
avoid or reduce texture changes caused by the direct reaction between enzymatic action and texture
changes. Rosemary extract can prevent changes in protein function due to oxidation, which may
affect the color and texture characteristics of the meat.
Melanosis. Dark spots or melanosis in shrimps is a harmless but unpleasant discoloration or
blackening that occurs mainly on swimmers, heads, tails, and nearby shell areas, and then spreads
further along the shell edges and through the body. Black spots are caused by enzyme systems
naturally present in shrimp. These enzymes can chemically convert the colorless compounds in the
shrimp into complex brown pigments on the surface and near the shell of the shrimp in the air.
(Bell 2015).
According to the result obtained during the analysis, TRT4 and TRT5 melanosis appearance was
slowest against the control. Also is important to mention that TRT5 melanosis appearance was the
slowest in general. This result could be associated with the rosemary extract antioxidant properties
and the control of oxidation reactions because of the vacuum packaging. “Antioxidants are used to
preserve food, such as delaying rancidity or discoloration, which is result of oxidation” (Gokoglu
2008). Yatmaz & Gokoglu (2016) obtained similar results in his study, where rosemary extract
indicated a good protective effect against melanosis compared to green tea extract and showing the
lowest values at the end of the storage.
In the other hand, melanosis control also could be the result of the vacuum packaging, due to
melanosis is a natural mechanism caused by enzymatic reactions, where the oxygen in the
atmosphere can promote the development of melanosis (Gonçalves & Menezes 2016). Kumar et

36
al. (2012), shows similar results in their study effect of antimelanotic treatment and vacuum
packaging on melanosis and quality condition of ice stored farmed tiger shrimp (Penaeus
monodon) where vacuum packaging retard the melanosis appearance in two days against control
(bag with air). TRT5 also could has the slowest melanosis appearance due to the combination of
rosemary extract and vacuum. According to Kumar et al. (2012), the effects of natural extracts and
vacuum packaging on storage can control the characteristics of cultured tiger prawns, especially
the occurrence of melanosis and the extension of shelf life.
Odor. The two treatments (TRT4 and TRT5) maintained odorless during the day’s storage. This
result could be associated with the antioxidant properties of rosemary extract and oxidation
reactions control of vacuum packaging. Oxidative reactions changes in lipids and proteins in
muscles may affect the sensory and the quality of the product, such as smell, rancidity, dehydration,
weight loss, color, and texture (Tsironi et al. 2009).
Quality. In similar investigations, Peiretti et al. (2012), sign that the results of the application of
rosemary significantly extend the shelf life. In addition, the presence of terpenoids of rosemary in
fish meat improves the quality. As shown in Table 14, TRT5 was the treatment that better
maintained the shrimp quality during the time storage. This treatment maintained its quality in a
one value during the 6 days storage; it means that this treatment had no bad odor, no melanosis
presence and good texture (Garrido et al. 2000). This result could be associated with the better
maintenance and control of melanosis, odor and texture mentioned before

37
4. CONCLUSIONS
A literature review of 100 scientific papers from 46 journals and 10 internet pages from leading
institutions was done.
Rosemary extract solution (0.2%) immersion control the total coliforms growth in fresh raw
headless shrimp presentation up to six days; vacuum packaging in combination with rosemary
extract solution (0.2%) immersion control coliform growth, maintain color and quality in fresh
raw headless shrimp presentation.
With the use of rosemary extract in a polybag packaging, b* value presented changes during
the days analyzed, with the combination of rosemary extract + vacuum any value (L*, a*, b*)
presented changes during the days analyzed.

38
5. RECOMMENDATIONS
To determine acceptance and preference of Headless shrimp presentation treated with rosemary
extract + vacuum and of Headless shrimp treated with rosemary extract + polybag packaging
through a sensory analysis.
To develop a cost-benefit analysis; to define the benefits will be possible obtained with the
packaging change.
To develop a TBARS test to determine lipid oxidation.
To analyze Total coliforms in days between 0-6 in Head-on, Headless control and treatment
with vacuum only and Peeled and deveined presentations, and between days 6-12 in Headless
presentation treated with rosemary and packaging in polybag and vacuum to determine the
exact microbial life extension of the product.
To conduct a quality blind analysis with a group of experts to determine the quality change of
fresh raw headless shrimp treated with rosemary and packaging in polybags or vacuum.

39
6. REFERENCES
Abramovi H, Terpinc P, Generalić I, Skroza D, Klancnik A, Katalinić V, Smole S. 2012.
Antioxidant and antimicrobial activity of extracts obtained from rosemary (Rosmarinus
officinalis) and vine (Vitis vinifera) leaves. Croatian journal of food science and
technology. 4:1–8.
Albarracin H, Alfonso A, Iván C, Sanchez B. 2012. Application of essential oils as a preservative
to improve the shelf life of nile tilapia (Oreochoromisniloticus). Vitae. 19:34–40.
Aruoma O, Halliwell B, Aeschbach R, Löligers J. 1992. Antioxidant and pro-oxidant properties of
active rosemary constituents: carnosol and carnosic acid. Xenobiotica. 22(2):257–268. eng.
doi:10.3109/00498259209046624.
Asche F, Roll K, Sandvold H, Sørvig A, Zhang D. 2013. Salmon aquaculture: larger companies
and increased production. Aquaculture Economics & Management. 17(3):322–339.
doi:10.1080/13657305.2013.812156.
Beckers H, Van Leusden F, Tips P. 1985. Growth and enterotoxin production of Staphylococcus
aureus in shrimp. J Hyg (Lond). 95(3):685–693. eng. doi:10.1017/s0022172400060794.
Bell W. 2015. Melanosis (Blackspot) and Control in Shrimp in Louisiana. La Sea Grant Louisiana
Direct Program.
Bensid A, Ucar Y, Bendeddouche B, Özogul F. 2014. Effect of the icing with thyme, oregano and
clove extracts on quality parameters of gutted and beheaded anchovy (Engraulis
encrasicholus) during chilled storage. Food Chemistry. 145:681–686. eng.
doi:10.1016/j.foodchem.2013.08.106.
Berk Z. 2018. Food Process Engineering and Technology. [place unknown]: Elsevier. ISBN:
9780128120187.
Berk Z. 2013. Food process engineering and technology. Second edition. Amsterdam: Academic
Press. xxix, 690 pages (Food science and technology international series). ISBN: 978-0-12-
415923-5.
Besbes N, Joffraud J, Ben K, Amri M, Sadok S 2016. Antimicrobial and antioxidant activities of
cactus polyphenols extract on seafood preservation. Biointerface Research In Applied
Chemistry (2069-5837) (Biointerface Research Applied Chemistry). 6(6):1612–1620.
Bhavaniramya S, Vishnupriya S, Saleh M, Vijayakumar R, Baskaran D. 2019. Role of essential
oils in food safety: Antimicrobial and antioxidant applications. Grain & Oil Science and
Technology. 2:49–55.
Bindu J, Sreejith S. 2018. Packaging of Seafood products. ICAR-Central Institute of Fisheries
Technology. 53–60.
Brul S. 1999. Preservative agents in foods Mode of action and microbial resistance mechanisms.
International journal of food microbiology. 50(1-2):1–17. doi:10.1016/S0168-
1605(99)00072-0.

40
Burt S. 2004. Essential oils: their antibacterial properties and potential applications in foods--a
review. International journal of food microbiology. 94(3):223–253. eng.
doi:10.1016/j.ijfoodmicro.2004.03.022.
Cann C. 2001. Packing Fish in a Modified Atmosphere. US: [publisher unknown]; [accessed 2020
May 26]. http://www.fao.org/3/x5956e/x5956e00.htm.
Carreira L, Franco C, Fente C, Cepeda A, Barros J, Vázquez B. 2004. Shelf life extension of beef
retail cuts subjected to an advanced vacuum skin packaging system. European Food
Research and Technology. 218(2):118–122. doi:10.1007/s00217-003-0837-6.
Castellanos D, Herrera A. 2017. Modified Atmosphere Packaging: Design and Optimization
Strategies for Fresh Produce. In: Kahramanoglu I, editor. Postharvest Handling. [place
unknown]: InTech.
Christiansen L, Foster E. 1965. Effect of vacuum packaging on growth of Clostridium botulinum
and Staphylococcus aureus in cured meats. Appl Microbiol. 13(6):1023–1025. eng.
Connolly A, Davidson L. 1996. “How does design affect decisions at point of sale?”. Journal of
Brand Management, Vol. 4 No. 2, pp. 100-7. 4(2):100–107.
Costa R. 2013. Escherichia coli in seafood: A brief overview. ABB. 04(03):450–454.
doi:10.4236/abb.2013.43A060.
Cui L, Kim M, Seo J, Kim I, Kim N, Lee S, Park J, Kim J, Lee H. 2012. Abietane diterpenoids of
Rosmarinus officinalis and their diacylglycerolacyltransferase-inhibitory activity. Food
Chem. 132:1775–1780.
DeWitt C, Oliveira A. 2016. Modified Atmosphere Systems and Shelf Life Extension of Fish and
Fishery Products. Foods (Basel, Switzerland). 5(3). eng. doi:10.3390/foods5030048.
Dey V. 2003. Seafood packaging and presentation undergo a transformation. INFOFISH Int. 33-36
Djenane D, Sánchez A, Beltrán J, Roncalés P. 2002. Ability of α-tocopherol, taurine and rosemary,
in combination with vitamin C, to increase the oxidative stability of beef steaks packaged
in modified atmosphere. Food Chemistry. 76(4):407–415. doi:10.1016/s0308-
8146(01)00286-2.
Dunajski E. 1980. Texture of fish muscle. J Texture Studies. 10(4):301–318. doi:10.1111/j.1745-
4603.1980.tb00862.x.
Egan A, Eustace I, Shay B. 1988. Meat packaging - maintaining the quality and prolonging the
storage life of chilled beef, pork and lamb. Proceedings of Industry Day. 34:68–75.
El-Shemy H, editor. 2020. Essential Oils - Oils of Nature. [place unknown]: IntechOpen. ISBN:
978-1-78984-640-9.
Elżbieta H, Lipińska E, Stasiuk M. 2011. The effect of rosemary preparations on the microbial
quality and TBARS value of model pork batters. Acta Sci. Pol., Technol. Aliment.
10(2):165–174.
Estévez M, Ventanas S, Cava R. 2005. Protein oxidation in frankfurters with increasing levels of
added rosemary essential oil: Effect on color and texture deterioration. Journal of food
science. 70(7):427–432.
[FAO] Food and Agricultural Organization of the United Nations 2011. Preventing E.coli in food.
[place unknown]: [publisher unknown]; [accessed 2020 Oct 2]. http://www.fao.org/

41
fileadmin/user_upload/fcc/news/1_FAO_Preventing-E.Coli-inFood_FCC_
2011.06.23.pdf.
[FAO] Food and Agriculture Organization of the United Nations. 2007. International seafood trade:
challenges and opportunities. University of Akureyri Symposium. Akureyri, Iceland.:
[publisher unknown]; [accessed 2020 Apr 25]. http://www.fao.org/3/a-i0584e.pdf.
[FAO], Food and Agricultural Organization of the United Nations. 2019. An estimated 3 million
tonnes of shrimp entered the international trend in 2018. GLOBEFISH: [publisher
unknown]; [accessed May 26 of 2019]. http://www.fao.org/in-action/globefish/market-
reports/resource-detail/en/c/1199292/
Farber J. 1991. Microbiological aspects of modified-atmosphere packaging technology – a review.
Journal of Food Protection. 54:58–70.
[FDA] Food and Drug Administration. 2004. Overview of Food Ingredients, Additives & Colors.
[place unknown]: International Food Information Council (IFIC) and U.S. Food and Drug
Administration; [updated April 2010]. https://www.fda.gov/food/food-ingredients-
packaging/overview-food-ingredients-additives-colors.
[FDA] Food and Drug Administration. 2018. Hazard Analysis and Risk-Based Preventive Controls
for Human Food: Draft Guidance for Industry: Appendix 3: Bacterial Pathogen Growth and
Inactivation. [place unknown]: [publisher unknown]; [accessed April 25 of 2020].
[FDA] Food and Drug Administration. 2020. Foodborne pathogens. [place unknown]: [publisher
unknown]. https://www.fda.gov/food/outbreaks-foodborne-illness/foodborne-pathogens.
Fernandes R, Trindade M, Tonin F, Pugine S, Lima C, Lorenzo J, Melo M . 2017. Evaluation of
oxidative stability of lamb burger with Origanum vulgare extract. Food Chemistry.
233:101–109. eng. doi:10.1016/j.foodchem.2017.04.100.
Fernández J, Zhi N, Aleson L, Pérez J, Kuri V. 2005. Antioxidant and antibacterial activities of
natural extracts: application in beef meatballs. Meat Sci. 69(3):371–380. eng.
doi:10.1016/j.meatsci.2004.08.004.
Fortune Business Insights. 2020. Stand-up Pouches Market Size to Hit USD 20.12 Billion by
Increasing Adoption of Sustainable Packaging to Stoke Demand, Says Fortune Business
Insights. [place unknown]: [publisher unknown]. https://www.globenewswire.com/news-
release/2020/06/02/2042363/0/en/Stand-up-Pouches-Market-Size-to-Hit-USD-20-12-
Billion-by-2026-Increasing-Adoption-of-Sustainable-Packaging-to-Stoke-Demand-Says-
Fortune-Business-Insights.html.
Fredonia group. 2018. Pouches. US: [publisher unknown]. https://www.freedoniagroup.com/
industry-study/pouches-3665.htm.
Garrido L, Benner R, Ross P, Otwell W. 2000. Assessing product quality, shelf-life and consumer
acceptance for fresh water, farm raises shrimp (Litopennaeus vannamei). University of
Florida, Aquatic Food products Lab.
Gilbert J, Wieneke A. 1973. Staphylococcal food poisoning with special reference to the detection
of enterotoxin in food. In The Microbiological Safety of Food. (ed. B. C. Hobbs and J. H.
B. Christian):273–285.

42
Giménez B, Roncalés P, Beltrán J. 2002. Modified atmosphere packaging of filleted rainbow trout.
J. Sci. Food Agric. 82(10):1154–1159. doi:10.1002/jsfa.1136.
Gokoglu N, Yerlikaya P. 2008. Inhibition effects of grape seed extracts on melanosis formation in
shrimp (Parapenaeus longirostris ). International Journal of Food Science & Technology.
43(6):1004–1008. doi:10.1111/j.1365-2621.2007.01553.x.
Gómez J, López de Lacey A, López-Caballero M, Gómez M, Montero P. 2010. Biodegradable
gelatin-chitosan films incorporated with essential oils as antimicrobial agents for fish
preservation. Food Microbiol. 27(7):889–896. eng. doi:10.1016/j.fm.2010.05.012.
Gonçalves A, Oliveira A de. 2016. Melanosis in crustaceans: A review. LWT - Food Science and
Technology. 65:791–799. doi:10.1016/j.lwt.2015.09.011.
Gonzales R. 2019. Grim prognosis for US farmed shrimp sector. US: [publisher unknown];
[accessed 2020 Sep 14]. https://www.aquaculturenorthamerica.com/grim-prognosis-for-us-
farmed-shrimp-sector-2214/.
Gordon M. 1990. The Mechanism of Antioxidant Action in Vitro. In: Hudson BJF, editor. Food
Antioxidants. Vol. 13. Dordrecht: Springer Netherlands. p. 1–18.
Haard N. 2002. The role of enzymes in determining seafood color, flavour and texture. In: Safety
and Quality Issues in Fish Processing. [place unknown]: Elsevier. p. 220–253.
Habtemariam S. 2016. The Therapeutic Potential of Rosemary (Rosmarinus officinalis) Diterpenes
for Alzheimer's Disease. Evid Based Complement Alternat Med. 2016:2680409. eng.
doi:10.1155/2016/2680409.
Hamilton K, Chen A, De-Graft Johnson E, Gitter A, Kozak S, Niquice C, Zimmer A, Weir M,
Mitchell J, Gurian P. 2018. Salmonella risks due to consumption of aquaculture-produced
shrimp. Microbial risk analysis. 9:22–32. eng. doi:10.1016/j.mran.2018.04.001.
Hammer K, Carson C, Riley T. 1999. Antimicrobial activity of essential oils and other plant
extracts. Journal of applied microbiology. 86(6):985–990. eng. doi:10.1046/j.1365-
2672.1999.00780.x.
Helander L; Alakoni H; Latva-Kala K; Mattila T; Pol L; Smid E ; Gorris L, Von Wright A. 1998,
Characterization of the action of selected essential oil components on gram-negative
bacteria. Journal of Agriculture and Food Chemistry, 46:3590-3595.
Hölihan C, Ho C, Chang S. 1984. Elucidation of the chemical structure of a novel antioxidant,
rosmaridiphenol, isolated from rosemary. J. Am. Oil Chem. Soc. 61, 1036–1039.
Holland J. 2019. Rabobank: Global seafood trade now worth USD 153 billion. Seafood source.
[place unknown]: [publisher unknown]; [accessed May 23 of 2020]. https://
www.seafoodsource.com/news/supply-trade/rabobank-global-seafood-trade-now-worth-
usd-153-billion.
Hu M, McClements D, Decker E. 2004. Antioxidant activity of a proanthocyanidin-rich extract
from grape seed in whey protein isolate stabilized algae oil-in-water emulsions. J Agric
Food Chem. 52(16):5272–5276. eng. doi:10.1021/jf049486j.
Huss H. 1994. Assurance of seafood quality. Rome: FAO. 169 s (FAO fisheries technical paper;
vol. 334). ISBN: 92-5-103446-X.

43
IMARC Group. 2019. Shrimp Market:Global Industry Trends, Share, Size, Growth, Opportunity
and Forecast 2020-2025. US: [publisher unknown]; [accessed September 26 of 2019].
https://www.imarcgroup.com/prefeasibility-report-shrimp-processing-plant.
Irkin R, Esmer K, Degirmencioglu. 2011. Influence of packaging conditions on some microbial
properties of minced beef meat at 4°c storage. Bulgarian journal of agricultural science.
17(5):655–663.
Issabeagloo E. 2012. Antimicrobial effects of rosemary (Rosmarinus officinalis L.) essential oils
against Staphylococcus spp. Afr. J. Microbiol. Res. 6(23). doi:10.5897/AJMR12.741.
Izdebska J. 2016. Applications of Printed Materials. ScienceDirection. [place unknown]: [publisher
unknown]; [accessed May 24 of 2020]. https://www.sciencedirect.com/topics/engineering/
flexible-package.
Jain S, Chen L, Dechet A, Hertz A, Brus D, Hanley K, Wilson B, Frank J, Greene K, Parsons M.
2008. An outbreak of enterotoxigenic Escherichia coli associated with sushi restaurants in
Nevada, 2004. Clin Infect Dis. 47(1):1–7. eng. doi:10.1086/588666.
Jiyoun K, Kyung B. 2004. Effect of vacuum packaging on the microbiological profile of chilled
chicken during storage. Journal of Applied Biological Chemistry. 47:35–37.
Karunasagar I, Pai R, Malathi GR, Karunasagar I. 1994. Mass mortality of Penaeus monodon
larvae due to antibiotic-resistant Vibrio harveyi infection. Aquaculture. 128(3-4):203–209.
doi:10.1016/0044-8486(94)90309-3.
Kayashima T, Matsubara K. 2012. Antiangiogenic effect of carnosic acid and carnosol,
neuroprotective compounds in rosemary leaves. Biosci Biotechnol Biochem. 76(1):115–
119. eng. doi:10.1271/bbb.110584.
Keithly W, Poudel P. 2008. The Southeast U.S.A. Shrimp Industry: Issues Related to Trade and
Antidumping Duties. Marine Resource Economics, 23(4).
Kuhar C, Linda Lin, Erik Matthia. 2016. Feasibility Study for a Shrimp Processing Line. US:
[publisher unknown]; [accessed August 5 of 2020]. https://cefs.ncsu.edu/wp-content/
uploads/NCGT-Shrimp-Processing-Feasibility-Study-FINAL-8-2016.pdf?x77888.
Kumar S, Pradnya A. Shinde, Faisal R. Sofi. 2013. Effect of antimelanotic treatment and vacuum
packaging on melanosis and quality condition of ice stored farmed tiger shrimp (Penaeus
monodon). SAARC J. Agri. 11(2):33–47.
Kumar Y, Yadav D, Ahmad T, Narsaiah K. 2015. Recent Trends in the Use of Natural Antioxidants
for Meat and Meat Products. COMPREHENSIVE REVIEWS IN FOOD SCIENCE AND
FOOD SAFETY. 14(6):796–812. doi:10.1111/1541-4337.12156.
Laham S, Al Fadel F. 2014. Antibacterial Activity of Various Plants Extracts Against Antibiotic-
resistant Aeromonas hydrophila. Jundishapur journal of microbiology. 7(7):e11370. eng.
doi:10.5812/jjm.11370.
Lazar E, Jobling J, Benkeblia N. 2010. Postharvest disease management of horticultural produce
using essential oils: today’s prospects. Stewart Postharvest Review. 6(3):1–10.
doi:10.2212/spr.2010.3.15.
Le Loir Y, Baron F, Gautier M. 2003. Staphylococcus aureus and food poisoning. Genetics and
Molecular Research. 2(1):7–28.

44
Leistner L. 1992. Food preservation by combined methods. Food Reseurch International. 25:151–
158.
Li X, Lindahl G, Zamaratskaia G, Lundström K. 2012. Influence of vacuum skin packaging on
color stability of beef longissimus lumborum compared with vacuum and high-oxygen
modified atmosphere packaging. Meat Sci. 92(4):604–609. eng.
doi:10.1016/j.meatsci.2012.06.006.
Li Y, Yang Z, Li J. 2017. Shelf-life extension of Pacific white shrimp using algae extracts during
refrigerated storage. J. Sci. Food Agric. 97(1):291–298. eng. doi:10.1002/jsfa.7730.
Löliger J. 1991. The use of antioxidants in foods. Aruoma OI, Halliwell B (eds) Free radicals and
food additives. 1:121–150.
López M, Gonçalves A, Nunes M. 2002. Effect of CO2/O2-containing modified atmospheres on
packed deepwater pink shrimp (Parapenaeus longirostris). Eur Food Res Technol.
214(3):192–197. doi:10.1007/s00217-001-0472-z.
Madhusudana B, Rao B, Viji P, Debbarma J. 2017. Shell colour variation in farmed Litopenaeus
vannamei: Comparison of white shell (regular) and brown shell (unusual) L. vannamei.
Markets & Trade. 21(1):24–26.
Mangaraj S, Goswami T. 2009. Modified atmosphere packaging - an ideal food preservation
technique. Journal of Food Science and Technology (Mysore). 46(5):399–410.
Marinac D. 2013. Seafood packaging using stand-up pouches. 1st ed. US: [publisher unknown].
http://cdn2.hubspot.net/hub/70169/file-444313358-pdf/docs/seafood_packaging_
ebook.pdf.
Maturin L. (ret.), James T. 2001. BAM Chapter 3: Aerobic Plate Count. U.S. Food and Drug
Administration: [publisher unknown]. https://www.fda.gov/food/laboratory-methods-food/
bam-chapter-3-aerobic-plate-count.
McElhatton A, Marshall R, editors. 2007. Food Safety. Boston, MA: Springer US. ISBN: 978-0-
387-33509-4.
Mena H. 2014. Packaging development process for cardboard packages with direct food contact.
Lund: Packaging Logistics, Lund University. PDF (xiii, 64 sidor). ISBN: 978-91-7623-052-
7.
Meyers S, Latscha. 1997. Carotenoids. L.R. D'Abramo, D.E. Conklin & D.M. Akiyama, eds.
Crustacean nutrition World Aquaculture Society. 6:164–193.
Mohan C. 2018. Modern practices in seafood packaging. ICAR-Central Institute of Fisheries
Technology [In: Protocols for the production of high value secondary products from
industrial fish and shell fish processing (Eds. Bindu, J., Sreejith, S. and Sarika, K.)]. 1:163–
174.
Morris B. 2016. The science and technology of flexible packaging: Multilayer films from resin and
process to end use. Boston MA: Elsevier. pages cm. ISBN: 978-0323242738.
Mullan M. 2003. Modified atmosphere packaging, in Food and Beverage Packaging Technology.
Modified atmosphere packaging in Food Packaging Technology.

45
Munné-Bosch S, Alegre L. 2001. Subcellular compartmentation of the diterpene carnosic acid and
its derivatives in the leaves of rosemary. Plant Physiol. 125(2):1094–1102. eng.
doi:10.1104/pp.125.2.1094.
Nancarrow C, Tiu Wright L, Brace I. 1998. Gaining competitive advantage from packaging and
labelling in marketing communications. British Food Journal. 100(2):110–118.
doi:10.1108/00070709810204101.
Niamnuy C, Devahastin S, Soponronnarit S, Vijaya Raghavan GS. 2008. Kinetics of astaxanthin
degradation and color changes of dried shrimp during storage. Journal of Food Engineering.
87(4):591–600. doi:10.1016/j.jfoodeng.2008.01.013.
Nieto G, Ros G, Castillo J. 2018. Antioxidant and Antimicrobial Properties of Rosemary
(Rosmarinus officinalis, L.): A Review. Medicines (Basel). 5(3). eng.
doi:10.3390/medicines5030098.
NOAA Fisheries, National Oceanic and Atmosphere Administration. 2014. Domestic shrimp
processing in 2012. Southern Shrimp Alliance. US: [publisher unknown]; [accessed
September 27 of 2020]. https://www.shrimpalliance.com/where-is-shrimp-processed-in-
the-united-states-noaa-data-confirms-resurgence-of-the-domestic-shrimp-processing-
industry-in-the-south/.
NOAA Fisheries, National Oceanic and Atmosphere Administration. 2018. U.S. Aquaculture. US:
[publisher unknown]; [updated updated by Office of Aquaculture on 01/30/2019; accessed
February 7 of 2020]. https://www.fisheries.noaa.gov/national/aquaculture/us-aquaculture.
O'Sullivan M. 2016. A handbook for sensory and consumer-driven new product development:
Innovative technologies for the food and beverage industry / Maurice O'Sullivan. Oxford:
Woodhead Publishing (Woodhead publishing series in food science, technology and
nutrition). ISBN: 0081003528.
Parry RT. 1993. Principles and applications of modified atmosphere packaging of food. Blakie.
1:1–18.
Peiretti P, Gai F, Ortoffi M, Aigotti R, Medana C. 2012. Effects of Rosemary Oil (Rosmarinus
officinalis) on the Shelf-Life of Minced Rainbow Trout (Oncorhynchus mykiss) during
Refrigerated Storage. Foods (Basel, Switzerland). 1(1):28–39. eng.
doi:10.3390/foods1010028.
Piccaglia R, Marotti M. 1993. Characterization of several aromatic plants grown in northern Italy.
Flavour Fragr. J. 8(2):115–122. doi:10.1002/ffj.2730080208.
Pisoschi A, Pop A, Georgescu C, Turcuş V, Olah N, Mathe E. 2018. An overview of natural
antimicrobials role in food. Eur J Med Chem. 143:922–935. eng.
doi:10.1016/j.ejmech.2017.11.095.
Praxiom Research Group Limited. 2004. ISO 9000-2000: A review: Cambios post-mortem en el
músculo de camarón patiblanco (Litopenaeus vannamei) y el efecto de procesos post-
cosecha en su textura, 2006. [place unknown]: [publisher unknown]; [accessed 18 March
of 220]. http://praxiom.com/iso-definition.htm.

46
Preethi R, Devanathan V, Loganathan M. 2010. Antimicrobial and Antioxidant Efficac y of Some
Medicinal Plants Against Food Borne Pathogens. Advances in Biological Research.
4(2):122–125.
Prendergast G, Pitt L. 1996. Packaging, marketing, logistics and the environment: are there trade‐
offs?. International Journal of Physical Distribution & Logistics Management. 26(6):60–
72.
Rahman M, Rahman F, Afroze F, Yesmin F, Fatema KK, Das KK, Noor R. 2016. Prevalence of
Pathogenic Bacteria in Shrimp Samples Collected from Hatchery, Local Markets and the
Shrimp Processing Plant. Bangla. J. Microbiol. 29(1):7–10. doi:10.3329/bjm.v29i1.28422.
Randell K, Ahvenainen R, Hattula T. 1995. Effect of the gas/product ratio and CO2 concentration
on the shelf-life of MA packed fish. Packag. Technol. Sci. 8(4):205–218.
doi:10.1002/pts.2770080404.
Rashidaie S, Ariaii P, Charmchian M. 2019. Effects of encapsulated rosemary extract on oxidative
and microbiological stability of beef meat during refrigerated storage. Food science &
nutrition. 7(12):3969–3978. eng. doi:10.1002/fsn3.1258.
Rašković A, Milanović I, Pavlović N, Ćebović T, Vukmirović S, Mikov M. 2014. Antioxidant
activity of rosemary (Rosmarinus officinalis L.) essential oil and its hepatoprotective
potential. BMC Complement Altern Med. 14:225. eng. doi:10.1186/1472-6882-14-225.
Resurreccion A, Reynolds A. 1990. Evaluation of Natural Antioxidants in Frankfurters Containing
Chicken and Pork. J Food Science. 55(3):629–631. doi:10.1111/j.1365-
2621.1990.tb05193.x.
Rettie R, Brewer C. 2000. The verbal and visual components of package design. Jnl of Product &
Brand Mgt. 9(1):56–70. doi:10.1108/10610420010316339.
Robat J. 2017. Why Stand-Up Pouch Is The Best Option For Sea Food Packaging? [place
unknown]: [publisher unknown]; [accessed 2020 Oct 2]. https://sites.google.com/site/
printservicesdubai/online-printing/why-stand-up-pouch-is-the-best-option-for-seafood-
packaging.
Sahoo J, Kumar N. 2005. Quality of vacuum packaged muscle foods stored under frozen
conditions: A review. Journal of Food Science and Technology. 42:209–213.
Sales J, Pashazadeh M. 2020. Study of chemical composition and antimicrobial properties of
rosemary (rosmarinus officinalis) essential oil on staphylococcus aureus and escherichia
coli in vitro. International journal of life sciences and biotechnology.
Doi:10.38001/ijlsb.693371.
Sánchez L, Chiralt A, González C, Cháfer M. 2011. Effect of essential oils on properties of film
forming emulsions and films based on hydroxypropylmethylcellulose and chitosan. Journal
of Food Engineering. 105(2):246–253. doi:10.1016/j.jfoodeng.2011.02.028.
Schmitt M, Schuler U, Schmidt W. 1990. Temperature limits of growth, TNase and enterotoxin
production of Staphylococcus aureus strains isolated from foods. International journal of
food microbiology. 11(1):1–19. doi:10.1016/0168-1605(90)90036-5.
Seafoods of the world. 2019. shrimp sizing reference guide. [place unknown]: [publisher
unknown]. http://seafoodsoftheworld.com/about/shrimp/shrimp-sizing-reference-guide/.

47
Senapati S, Kumar G, Singh C, Xavier K, Chouksey M, Nayak B, Balange A. 2017. Melanosis and
quality attributes of chill stored farm raised whiteleg shrimp (Litopenaeus vannamei).
JANS. 9(1):626–631. doi:10.31018/jans.v9i1.1242.
Shalini R, Jasmine G, Shanmugam S, Ramkumar K. 2000. Sodium acetate and vacuum packaging
to improve shelf life of refrigerated Lethrinus lentjan fillets. Fishery Technology. 37:8–14.
Sharma A. 2019. Stand-Up Pouches Market Size, Dynamics and Forecast Report to 2025.
Shi C, Cui J, Yin X, Luo Y, Zhou Z. 2014. Grape seed and clove bud extracts as natural antioxidants
in silver carp (Hypophthalmichthys molitrix) fillets during chilled storage: Effect on lipid
and protein oxidation. Food Control. 40:134–139. doi:10.1016/j.foodcont.2013.12.001.
Sienkiewicz M, Łysakowska M, Pastuszka M, Bienias W, Kowalczyk E. 2013. The potential of
use basil and rosemary essential oils as effective antibacterial agents. Molecules.
18(8):9334–9351. eng. doi:10.3390/molecules18089334.
Sigurgisladottir S, Hafsteinsson H, Jonsson A, Lie Ø, Nortvedt R, Thomassen M, Torrissen O.
1999. Textural properties of raw salmon fillets as related to sampling method. J Food Sci.
64(1):99–104.
Silliker J, Wolfe S. 1980. Microbiological safety considerations in controlled atmosphere storage
of meats. Food technol. 34(3):59–63.
Silva N, Alves S, Gonçalves A, Amaral J, Poeta P. 2013. Antimicrobial activity of essential oils
from Mediterranean aromatic plants against several foodborne and spoilage bacteria. Food
science and technology international = Ciencia y tecnologia de los alimentos internacional.
19(6):503–510. eng. doi:10.1177/1082013212442198.
Soccol M, Oetterer M. 2003. Use of modified atmosphere in seafood preservation. Food Chemistry.
46(4):569–580. doi:10.1590/S1516-89132003000400011.
Srinivasa T. 1993. Packaging materials for shrimp, fish and fish products, their properties, selectiiin
and effect [if different packaging materials [in their shelf life. India: cochin university of
science and technology; [accessed may 11 of 2020]. Https://dyuthi.cusat.ac.in/xmlui/
bitstream/handle/purl/3233/dyuthi-t1207.pdf?sequence=1.
Stammen K, Gerdes D, Caporaso F. 1990. Modified atmosphere packaging of seafood. Crit Rev
Food Sci Nutr. 29(5):301–331. eng. doi:10.1080/10408399009527530.
Syama J, Dayal A, Ponniah H, Imran K, Ebin B, Ambasankar K, Kumarguru V. 2013. Shrimps - a
nutritional perspective. Current science. 104(11):1847-1491.
Tajkarimi M, Ibrahim S, Cliver D. 2010. Antimicrobial herb and spice compounds in food. Food
Control. 21(9):1199–1218. doi:10.1016/j.foodcont.2010.02.003.
Tassou C, Drosinos E, Nychas G. 1995. Effects of essential oil from mint (Mentha piperita) on
Salmonella enteritidis and Listeria monocytogenes in model food systems at 4 degrees and
10 degrees C. The Journal of applied bacteriology. 78(6):593–600. eng. doi:10.1111/j.1365-
2672.1995.tb03104.x.
Templier M, Paré G. 2015. A Framework for Guiding and Evaluating Literature Reviews. CAIS.
37. doi:10.17705/1CAIS.03706.

48
Tsironi T, Dermesonlouoglou E, Giannakourou M, Taoukis P. 2009. Shelf life modelling of frozen
shrimp at variable temperature conditions. LWT - Food Science and Technology.
42(2):664–671. doi:10.1016/j.lwt.2008.07.010.
Tsuchiya M, Scita G, Freisleben H, Kagan V, Packer L. 1992. [44] Antioxidant radical-scavenging
activity of carotenoids and retinoids compared to α-tocopherol. In: Carotenoids Part A:
Chemistry, Separation, Quantitation, and Antioxidation. Vol. 213. [place unknown]:
Elsevier. p. 460–472 (Methods in Enzymology).
Veenstra J, Johnson J. 2019. Oregano (Origanum vulgare) extract for food preservation and
improvement in gastrointestinal health. International journal of nutrition. 3(4):43–52. eng.
doi:10.14302/issn.2379-7835.ijn-19-2703.
Vegara S, Funes L, Martí N, Saura D, Micol V, Valero M. 2011. Bactericidal activities against
pathogenic bacteria by selected constituents of plant extracts in carrot broth. Food
Chemistry. 128(4):872–877. doi:10.1016/j.foodchem.2011.03.109.
Vera P, Canellas E, Nerín C. 2020. Compounds responsible for off-odors in several samples
composed by polypropylene, polyethylene, paper and cardboard used as food packaging
materials. Food Chem. 309:125792. eng. doi:10.1016/j.foodchem.2019.125792.
Wan Norhana M, Poole S, Deeth H, Dykes G. 2010. Prevalence, persistence and control of
Salmonella and Listeria in shrimp and shrimp products: A review. Food Control.
21(4):343–361. doi:10.1016/j.foodcont.2009.06.020.
Wang L, Liu Z, Yang H, Huang L, Zeng M. 2016. Optimal Modified Atmosphere for Packaging
and its Effects on Quality and Shelf-life of Pacific White Shrimp (Litopenaeus vannamei)
under Controlled Freezing-point Storage at −0.8 °C. FSTR. 22(2):173–183.
doi:10.3136/fstr.22.173.
Wang W, Li N, Luo M, Zu Y, Efferth T. 2012. Antibacterial activity and anticancer activity of
Rosmarinus officinalis L. essential oil compared to that of its main components. Molecules.
17(3):2704–2713. eng. doi:10.3390/molecules17032704.
Wang Y, Chien Y, Pan C. 2006. Effects of dietary supplementation of carotenoids on survival,
growth, pigmentation, and antioxidant capacity of characins, Hyphessobrycon callistus.
Aquaculture. 261(2):641–648. doi:10.1016/j.aquaculture.2006.08.040.
Wenkert E, Fuchs A, McChesney JD. 1965. Chemical Artifacts from the Family Labiatae. J. Org.
Chem. 30(9):2931–2934. doi:10.1021/jo01020a012.
Wijeratne S, Cuppett S. 2007. Potential of rosemary (Rosemarinus officinalis L.) diterpenes in
preventing lipid hydroperoxide-mediated oxidative stress in Caco-2 cells. J Agric Food
Chem. 55(4):1193–1199. eng. doi:10.1021/jf063089m.
Willige V, Linssen J, Legger-Huysman A, Voragen A. 2003. Influence of flavour absorption by
food-packaging materials (low-density polyethylene, polycarbonate and polyethylene
terephthalate) on taste perception of a model solution and orange juice. Food Addit Contam.
20(1):84–91. eng. doi:10.1080/0265203021000031582.
Wu J, Lee M, Ho C, Chang S. 1982. Elucidation of the chemical structures of natural antioxidants
isolated from rosemary. J Am Oil Chem Soc. 59(8):339–345. doi:10.1007/BF02541016.

49
XinFang S. 1993. Enhancing the antioxidant effect of α-tocopherol with rosemary in inhibiting
catalyzed oxidation caused by Fe2+ and hemoprotein. Food Research International.
26(6):405–411.

50
7. APPENDICES
Appendix 1. Quality rating for raw shrimp.
Source: Garrido et al. 2000.
Score Quality Rating
1 A
2 A
3 A
4 B
5 B
6 B
7 C
8 C
9 C
Fair shrimp - similar to score 5 yet more pronounced
Poor shrimp - most quality attributes objectionable (Class III Decomposition) Putrid, ammoniacal or
fecal odor, cooked appearance and/or heavy melanosis, and soft-mushy texture
Very poor shrimp - very objectionable
Rather poor shrimp - objectionable changes in odor (Class 2 Decomposition), appearance and
texture Musty, fishy, “old socks” or ammoniacal odor, heavy melanosis, heat abused appearance,
soft texture
Description
Best shrimp - No odor to fresh shrimp odor (Class I Decomposition) Firm texture No melanosis
Excellent shrimp - very slight noticeable changes in odor, appearance, or texture
Very good shrimp - some noticeable but not objectionable changes
Good shrimp - noticeable changes in odor, appearance, and texture, but not objectionable
Good to fair shrimp - more noticeable changes, with some slightly objectionable, slightly stale or
fishy odor, moderate melanosis, or slight soft texture (Class I Low Quality Decomposition)

51
Appendix 2. Organoleptic analysis used for quality rating during 0, 1, 2, 5, and 6 days.

52
Appendix 2 continuation.

53
Appendix 2 continuation.

54
Appendix 2 continuation.
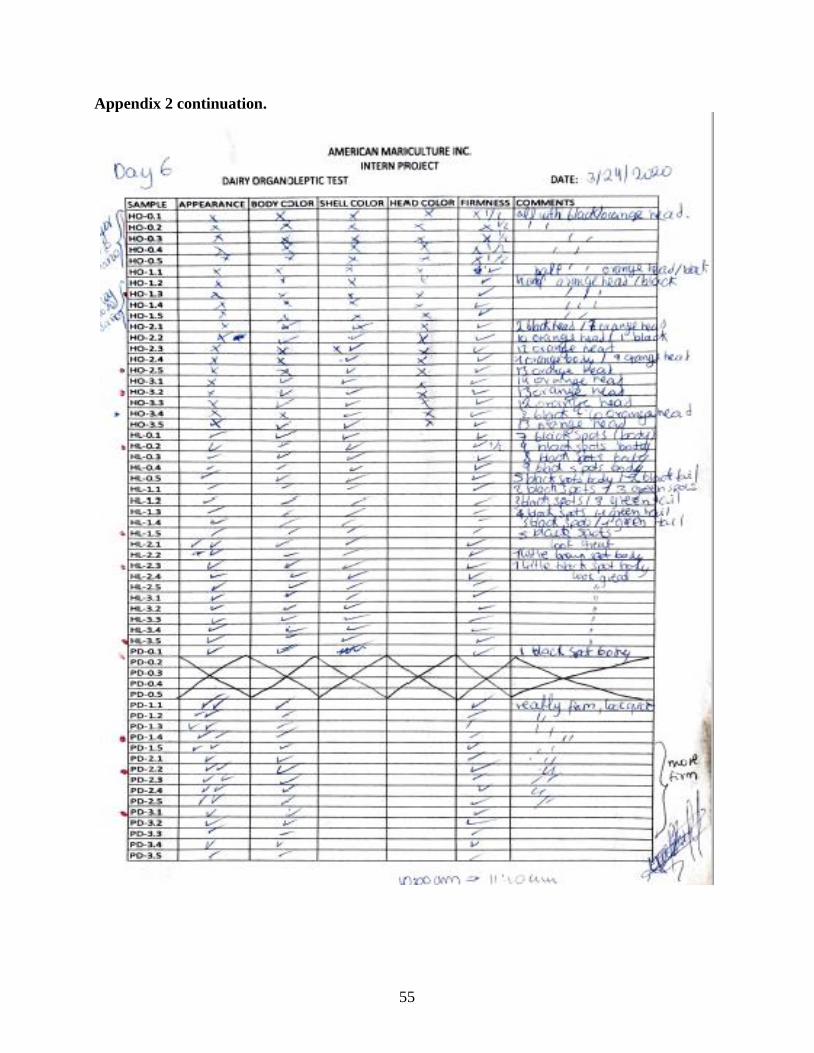
55
Appendix 2 continuation.

56
Appendix 3. Images of quality change of Headless (HL) shrimp presentation, Control 2, TRT4, TRT5 during days 0, 6 and 12.