living arrangements of children: 2004
TRANSCRIPT
U S C E N S U S B U R E A UHelping You Make Informed Decisions
U.S.Department of CommerceEconomics and Statistics Administration
U.S. CENSUS BUREAU
Living Arrangements of Children: 2004Household Economic Studies
P70-114
Issued February 2008
CurrentPopulationReports
By Rose M. Kreider
Highlights
This report provides a detailed overviewof children’s living arrangements in theUnited States in 2004. Data in the Surveyof Income and Program Participation(SIPP) that allow the identification ofdetailed relationships among all house-hold members show a variety of livingarrangements for children by their raceand Hispanic origin, by the number ofparents with whom they live, and othercharacteristics.
In 2004, 73.2 million children under age18 lived in American households. Themajority of these children (70 percent)lived with two parents. Most (87 percent)of the children who lived with two par-ents lived with their biological motherand father. Twenty-six percent of all chil-dren (19.3 million) lived with one parent.The majority (88 percent) of these chil-dren lived with their mother.
The number of parents children livedwith varied by race and Hispanic origin—87 percent of Asian children lived withtwo parents, as did 38 percent of Blackchildren. While 1 percent of White non-Hispanic children lived with their grand-parents with no parent present, this wastrue for 5 percent of Black children.
Overall, 94 percent of children lived withat least one biological parent, while 8percent lived with at least one steppar-ent and 2 percent lived with at least oneadoptive parent.
From the point of view of the parents,30.2 million fathers had their childrenunder age 18 living with them, while
37.8 million mothers lived with at leastone of their children under age 18. Ahigher percentage of the mothers livedwith their biological children (94 percent)than did the fathers (85 percent). Ahigher percentage of fathers than moth-ers lived with their stepchildren oradopted children.
Children are defined in this reportas all noninstitutionalized individu-als under 18 years old.
Adopted children are identified bythe survey respondent alone andnot from any administrativerecords.
Stepchildren are identified by thesurvey respondent and their step-parent may not be currently marriedto the child’s other coresidentialparent.
Stepsiblings share a parent, butthat parent is the biological parentof one child and the stepparent ofthe other child.
Foster children are only identifiedin the relationship to householderitem and not via the edited vari-ables that identify if the child’smother/father is present in thehousehold and whether themother/father is the child’s biologi-cal, step, or adoptive parent.
Half siblings share one biologicalparent.

Most children lived with at least onesibling (79 percent). The majority(64 percent) lived with one or twosiblings, while 5 percent lived withfour or more siblings. Twelve per-cent of children under age 18 livedwith at least one half sibling.
The presence of a half siblingresulted in the creation of a blendedfamily for half (49 percent) of thechildren in blended families.Seventeen percent of all childrenunder age 18 (12.2 million) lived inblended families. Forty-six percentof the children in blended families,or 5.5 million, lived with at leastone stepparent.
About 6.5 million children livedwith at least one grandparent, and1.6 million of these children hadno parent present. Children livingwith grandparents were more oftenliving in families in poverty thanwere children living in householdswith no grandparents present (22 percent and 17 percent, respec-tively). Among children living withtheir mother only, those living inhouseholds with a grandparentpresent were in poverty 23 percentof the time, lower than the percent-age of children living with a singlemother and no grandparent present(39 percent).
Approximately 2.2 million childrenwere living with a mother who hada marital event in the year prior tothe survey date. About 1.1 millionchildren were living with a parentwho had experienced a divorce inthe last year.
At the household level, 40.0 millionhouseholds included children under18—95 percent had at least onechild and his or her biological par-ent, 9 percent had at least one childand his or her stepparent, and 4percent had at least one child andhis or her adoptive parent.
Introduction
Children live in a variety of familyarrangements that usually reflectthe marriage, divorce, and remar-riage patterns of their parents. Inaddition, one-third of childrentoday are born to unmarried moth-ers and may grow up in single-parent families or spend significantportions of their lives with otherrelatives or stepparents.1 Thisreport examines the diversity ofchildren’s living arrangements inAmerican households.2 The dataare from the household relation-ship module of the SIPP collectedin 2004 and they update an earlier
2 U.S. Census Bureau
1 “The Council of Economic Advisers onthe Changing American Family,” Populationand Development Review, Vol. 26, No. 3,2000, pp. 617–628.
2 The data in this report were collectedfrom June through September of 2004 in thesecond wave (interview) of the 2004 Surveyof Income and Program Participation. Thepopulation represented (the population uni-verse) is the civilian noninstitutionalizedpopulation under 18 living in the UnitedStates. Detailed tables for this report can beaccessed on the U.S. Census Bureau’s Website, <www.census.gov/population/www/socdemo/child/la-child.html>.
report based on data from the2001 SIPP Panel.3
Detailed information was obtainedon each person’s relationship toevery other person in the house-hold, permitting the identificationof various types of relatives and ofparent-child and sibling relation-ships. This report describesextended family households withrelatives and nonrelatives (whosepresence may influence a child’sdevelopment and contribute to thehousehold’s economic well-being).It also examines the degree towhich children are living in single-parent families or with step-parents, adoptive parents, or noparents while in the care ofanother relative or a guardian.
The statistics in this report arebased on national-level estimatesof children and their living situa-tions from June through September
3 Rose M. Kreider and Jason Fields, LivingArrangements of Children: 2001, CurrentPopulation Reports, P70-104, Washington,DC: U.S. Census Bureau, 2005.
Parents are defined in this report as a mother or father of the childwho may be married or unmarried, biological, step, or adoptive.
Unmarried partners are people who are at least 15 years old, whoare not currently living with a spouse, and who are sharing a closepersonal relationship with another adult in the household. This termand its definition were first developed by Arthur J. Norton of the U.S.Census Bureau for use in the 1990 Census of Population.
The partner may or may not be the parent of any children in thehousehold.
Blended families are formed when remarriages occur or when chil-dren living in a household share only one or no biological parents.The presence of a stepparent, stepsibling, or half sibling designatesa family as blended.
An extended family household is a household where a child liveswith at least one parent and someone other than a parent or sibling,either relatives or nonrelatives.

2004. The findings pertain to allnoninstitutionalized individualsunder age 18, regardless of theirmarital or parental status.
Various factors influence the diver-sity of children’s living arrange-ments, including parental death,divorce, remarriage, births tounmarried women, cohabitation (ofunmarried parents), and multigen-erational families. Immigration mayalso influence the type of house-hold and family in which childrengrow up (when families providehousing for their immigrant rela-tives and friends, for instance).This factor is evident in the livingarrangements of Hispanic children,and Hispanics constitute a largecomponent of new immigrants tothe United States.4 Cultural factors,demographic characteristics, andfamily formation patterns underliedifferences in current and futurefamily structure.5
Children Living With One,Two, or No Parents
In 2004, 70 percent of the 73.2million children under age 18 livedwith two parents, 26 percent livedwith one parent, and the remaining4 percent lived with no parent (see
U.S. Census Bureau 3
4 Because Hispanics may be any race,data in this report for Hispanics overlap withdata for the White, Black, and Asian popula-tions. Based on the population under 18 inthe 2004 SIPP, 23 percent of the White-alonepopulation, 4 percent of the Black-alone pop-ulation, and 2 percent of the Asian-alonepopulation were also Hispanic.
Larsen, Luke J. The Foreign-BornPopulation in the United States: 2003,Current Population Reports, P20-551,Washington, DC: U.S. Census Bureau, 2004.Available at <www.census.gov/prod/2004pubs/p20-551.pdf>.
5 S. Philip Morgan et al., “Racial differencesin household and family structure at the turnof the century,” American Journal of Sociology,Vol. 98, January 1993, pp. 798–828.
Table 1).6 Figure 1 illustrates thedistribution of all children acrossthe number and type of parentswith whom they lived, while Table 1 details living arrangementsof children by race groups andHispanic origin.
A large majority of White non-Hispanic (78 percent) and Asian (87percent) children lived with two par-ents, higher than the proportion forHispanic children (68 percent) andmore than twice as high as the pro-portion for Black children (38 per-cent).7 A higher proportion of Black
6 The estimates in this report (which maybe shown in text, figures, and tables) arebased on responses of a sample of the pop-ulation and may differ from the actual val-ues because of sampling variability or otherfactors. As a result, apparent differencesbetween the estimates for two or moregroups may not be statistically significant.All comparative statements have undergonestatistical testing and are significant at the90-percent confidence level unless other-wise noted.
7 Federal surveys now give respondentsthe option of reporting more than one race.Therefore, two basic ways of defining a racegroup are possible. A group such as Asianmay be defined as those who reported Asianand no other race (the race-alone or single-race concept) or as those who reported Asianregardless of whether they also reportedanother race (the race-alone-or-in-combinationconcept). The body of this report (text, fig-ures, and tables) shows data for people whoreported they were the single race White andnot Hispanic, those who reported the singlerace White, those who reported the singlerace Black, and those who reported the singlerace Asian. Use of the single-race populationsdoes not imply that it is the preferred methodof presenting or analyzing data. The CensusBureau uses a variety of approaches.
For further information, see the Census2000 Brief Overview of Race and HispanicOrigin: 2000 (C2KBR/01-1) at<www.census.gov/population/www/cen2000/briefs.html>. Hispanics may be any race.Data for the American Indian and AlaskaNative population are not shown in this reportbecause of their small sample size in the SIPP.
This report will refer to the White-alonepopulation as White, the Black-alone popula-tion as Black, the Asian-alone population asAsian, and the White-alone non-Hispanicpopulation as White non-Hispanic.
children than White non-Hispanic orHispanic children lived with oneparent in 2004 (54 percent com-pared with 20 percent and 28 per-cent, respectively).
In 2004, 5.5 million children livedwith at least one stepparent. Inaddition, 2.9 million lived with noparents; this figure included308,000 children living with one ormore foster parents. Over half (56percent) of the children living withno parents were living with grand-parents. This proportion also var-ied by race and Hispanic origin—61percent of Black children, 57 per-cent of White non-Hispanic children,and 43 percent of Hispanic childrenlived with grandparents, of thosewho had no parents present.8
Children Living With TwoParents: Biological, Step, and Adoptive
In 2004, of the 51.0 million childrenwho lived with two parents, 87 per-cent (44.5 million) lived with theirbiological mother and biologicalfather (Table 1).9 An additional 10 percent (5.3 million) lived with abiological parent and a stepparent,usually with a biological motherand a stepfather (4.1 million). About2 percent of children living with
8 The percentages of Black children andWhite non-Hispanic children living with noparents who lived with their grandparentsdo not differ statistically.
9 One hundred ninety-three thousandweighted children’s records were adjustedwhere they pointed to two parents, but theseparents were not married and were notreported as cohabiting with each other. In thetables, these children are shown as living withcohabiting parents. Eight thousand weightedchildren’s records were adjusted where theypointed to a married parent but pointed toanother parent in the household who was notmarried to the first. These children weremade to point to the married parents’ spouseas their second parent.

4 U.S. Census Bureau
Table 1.Children by Presence and Type of Parent(s) and Race and Hispanic Origin: 2004(Numbers in thousands)
Living arrangements
2004
2001,total
1996,total
Total Race and Hispanic origin
Num-ber Percent
Marginof
1errorWhitealone
Whitealone,
non-His-
panicBlackalone
Asianalone
His-panic(any
race)
Children . . . . . . . . . . . . . . . . . . . . . . . . . . . . . 73,227 55,901 43,079 11,354 2,279 13,984 72,501 71,494Percent . . . . . . . . . . . . . . . . . . . . . . . . . . . . . . . . . . 100.0 100.0 100.0
Living with—Two parents2 . . . . . . . . . . . . . . . . . . . . . . . . . . . 51,013 69.7 0.7 42,469 33,518 4,268 1,987 9,508 70.5 70.9
Married parents . . . . . . . . . . . . . . . . . . . . . . . 48,787 66.6 0.7 40,893 32,523 3,850 1,952 8,869 67.6 68.8Unmarried parents. . . . . . . . . . . . . . . . . . . . . 2,227 3.0 0.3 1,576 995 417 35 639 2.9 2.1
Biological mother and father . . . . . . . . . . . . 44,541 60.8 0.8 37,258 29,213 3,537 1,865 8,511 62.2 62.5Married parents . . . . . . . . . . . . . . . . . . . . . 42,727 58.3 0.8 35,968 28,409 3,198 1,834 7,980 59.7 60.7
Biological mother and stepfather . . . . . . . . 4,149 5.7 0.4 3,399 2,818 484 31 640 5.6 5.2Biological father and stepmother . . . . . . . . 1,106 1.5 0.2 920 734 128 17 196 1.1 1.4Biological mother and adoptive father . . . . 407 0.6 0.1 336 282 25 – 61 0.6 0.7Biological father and adoptive mother . . . . 49 0.1 – 38 38 11 – – 0.1 0.1Adoptive mother and father . . . . . . . . . . . . . 668 0.9 0.1 457 392 62 67 74 0.8 1.0Other3 . . . . . . . . . . . . . . . . . . . . . . . . . . . . . . . 95 0.1 – 62 41 21 7 26 0.1 0.0
One parent . . . . . . . . . . . . . . . . . . . . . . . . . . . . . 19,336 26.4 0.7 11,816 8,496 6,090 250 3,861 25.5 25.4Mother only. . . . . . . . . . . . . . . . . . . . . . . . . . . 16,973 23.2 0.7 10,037 6,953 5,717 201 3,578 22.5 22.9
Biological. . . . . . . . . . . . . . . . . . . . . . . . . . . 16,574 22.6 0.7 9,829 6,803 5,545 198 3,500 22.0 22.5Father only . . . . . . . . . . . . . . . . . . . . . . . . . . . 2,363 3.2 0.3 1,779 1,542 373 49 283 3.0 2.6
Biological. . . . . . . . . . . . . . . . . . . . . . . . . . . 2,280 3.1 0.3 1,721 1,494 359 46 273 2.9 2.4No parent . . . . . . . . . . . . . . . . . . . . . . . . . . . . . . 2,878 3.9 0.3 1,616 1,066 996 43 614 4.0 3.7
Grandparents only. . . . . . . . . . . . . . . . . . . . . 1,598 2.2 0.2 838 603 610 12 263 1.9 1.8Other relatives only . . . . . . . . . . . . . . . . . . . . 641 0.9 0.1 328 200 252 12 144 1.2 1.0Nonrelatives only . . . . . . . . . . . . . . . . . . . . . . 558 0.8 0.1 395 230 114 20 184 0.7 0.9Other arrangement . . . . . . . . . . . . . . . . . . . . 81 0.1 – 56 33 20 – 23 0.1 0.1
At least 1 biological parent . . . . . . . . . . . . . . . 69,105 94.4 0.4 53,501 41,382 10,090 2,157 13,182 94.5 94.7At least 1 stepparent. . . . . . . . . . . . . . . . . . . . . 5,532 7.6 0.4 4,499 3,661 691 56 917 7.0 6.9At least 1 adoptive parent . . . . . . . . . . . . . . . . 1,504 2.1 0.2 1,034 880 244 79 187 1.9 2.1At least 1 foster parent. . . . . . . . . . . . . . . . . . . 308 0.4 0.1 231 135 60 4 96 0.4 0.4
– Represents or rounds to zero.1 This number, when added to or subtracted from the estimated total number of children under 18 in each category, represents the 90-percent confidence
interval around the estimate.2 In the SIPP, two coresident parents can be identified regardless of their marital status. This means that both married and unmarried parents are included
in this category in this table. This represents a difference from the Current Population Survey (CPS), where, up through 2006, only married parents are recordedin two-parent households. As a result, there are more children in two-parent households in the SIPP and more in single-parent households in the CPS.
3 Includes children living with one adoptive parent and one stepparent or with two stepparents.
Source: U.S. Census Bureau, Survey of Income and Program Participation, 2004 Panel, Wave 2.

two parents (1.2 million) lived witheither two adoptive parents or acombination of an adoptive parentand a biological parent or an adop-tive parent and a stepparent.10
Roughly 1 in 10 children livingwith two parents lived with a step-parent or adoptive parent. In 2004,5.7 million children lived with onebiological parent and either a
U.S. Census Bureau 5
10 Estimates from the 2004 panel of thenumber of children living with adoptive par-ents and those living with stepparents differfrom the 2001 panel estimates for severalreasons. In the 2004 panel, if respondentsreported that a child was their stepchild,they were also asked whether this child wasnow also their adopted child. The malfunc-tion of this follow-up question resulted in
the need to hold constant the type of rela-tionship between the same child and parentfrom Wave 1 when the same child and par-ent were present in Wave 2. The 2001 datawere longitudinally edited, and the type ofrelationship reported in Wave 4, or latestinterview during Waves 1 through 4, wasused for Waves 1 through 4.
stepparent or adoptive parent (11 percent of all those living withtwo parents). This percentage wasstatistically unchanged from 11percent of children living with twoparents in 2001 and 10 percent in 1996.
In 2004, 94 percent of Asian chil-dren living with two parents livedwith both biological parents, higherthan any of the other groups shownin Table 1. Black children had the
Figure 1.Percentage of Children Aged 0–17 Living in Various Family Arrangements: 2004
1 Child points to one parent, biological or adoptive. 2 Child points to two parents, who are married to each other—either two biological, two adoptive, or one biological and one adoptive.3 Child points to two parents, who are not married to each other—either two biological, two adoptive, or one biological and one adoptive. 4 Child points to two parents, either married or cohabiting—one is a biological or adoptive parent; one is a stepparent; or both are stepparents.
Source: U.S. Census Bureau, Survey of Income and Program Participation, 2004 Panel, Wave 2.
One biological/adoptive parent and stepparent4 10.5
Single stepparent 0.9
Other relatives 19.0No parents4%
One parent26%
Two parents70%
Grandparent 55.5
Householder or partner of householder 1.6
Foster parent(s) 10.7
Other relatives and nonrelatives 5.4
Nonrelatives 7.8
Single mother1 78.7Single mother with partner1 8.3
Single father1 10.1Single father with partner1 1.9
Two biological/adoptive married parents2 85.9Two biological/adoptive cohabiting parents3 3.6
2004

lowest percentage (83 percent) liv-ing with both biological parents, ofthose living with two parents.
In 2004, 538,000 children lived withone adoptive parent and a non-adoptive parent (biological or step).Seventy-six percent of these childrenwere living with their biologicalmother and an adoptive father; it ispossible that many of these adop-tive fathers were initially stepfa-thers.11 Often, living arrangementsof children are dichotomized by
6 U.S. Census Bureau
11 In 1992, 42 percent of all adoptions inthe United States, whether public, private, orintercountry, were stepparent adoptions. Seethe following report for further details: U.S.Department of Health and Human Services,2004, How many children were adopted in2000 and 2001? Washington, DC: ChildWelfare Information Gateway. This report canbe accessed at: <www.childwelfare.gov/pubs/s_adopted/index.cfm>.
whether children live with one ortwo parents. Details in the SIPP dataillustrate that even among childrenliving with two parents, consider-able variation exists in the combina-tions of parental types, whether bio-logical, step, or adoptive parents.
Children Living WithUnmarried Parents:Differences by CohabitationStatus, Poverty, and Race andHispanic Origin
Numerous factors, including non-marital childbearing, death, anddivorce, affect whether childrenlive with an unmarried parent forsome portion of their childhood.Because this report is focused onliving arrangements and becausethe data only show coresidentialparents, “unmarried” parents
include those who are marriedspouse absent, widowed, divorced,separated, or never married.Based on children’s living arrange-ments in the 1990s, Heuveline, etal. estimated that about half ofchildren under 16 might live in asingle-parent household at sometime before reaching age 16.12
Table 2 shows that in 2004, 21.6 million children (29 percent ofall children) lived with one or twounmarried parents. Three percent(2.2 million) of all children livedwith both their mother and father
12 Heuveline, Patrick, Jeffrey M.Timberlake and Frank F. Furstenberg, Jr.“Shifting Childbearing to Single Mothers:Results from 17 Western Countries,”Population and Development Review,Vol. 29,1, 2003, pp. 47–71.
Table 2.Children by Presence and Type of Parents by Poverty Status: 2004(Numbers in thousands)
Living arrangements of childrenChildren Percent of children below
poverty level
Number Percent Estimate 1Margin of error
Total. . . . . . . . . . . . . . . . . . . . . . . . . . . . . . . . . . . . . . . . 73,227 100.0 17.7 0.6Living with married parents . . . . . . . . . . . . . . . . . . . . . . . . . . 48,787 66.6 10.0 0.6Living with no parent. . . . . . . . . . . . . . . . . . . . . . . . . . . . . . . . 2,878 3.9 28.5 1.5Living with an unmarried parent2 . . . . . . . . . . . . . . . . . . . . . 21,563 29.4 33.7 1.3
Living with unmarried mother and father . . . . . . . . . . . 2,227 3.0 31.4 1.5Living with unmarried mother only . . . . . . . . . . . . . . . . . 16,973 23.2 36.5 1.4Living with unmarried father only . . . . . . . . . . . . . . . . . . 2,363 3.2 16.6 1.5
Parent has an unmarried partner . . . . . . . . . . . . . . . . . . 3,857 5.3 31.8 3.2Biological mother and father . . . . . . . . . . . . . . . . . . . . 1,814 2.5 32.4 4.6Biological mother, step or adoptive father . . . . . . . . 324 0.4 26.9 10.4Biological father, step or adoptive mother . . . . . . . . 87 0.1 28.7 20.4Biological mother, partner . . . . . . . . . . . . . . . . . . . . . . 1,271 1.7 36.2 5.7Biological father, partner . . . . . . . . . . . . . . . . . . . . . . . 308 0.4 19.8 9.6Step or adoptive parent, partner . . . . . . . . . . . . . . . . 51 0.1 (B) (B)
Parent has no unmarried partner . . . . . . . . . . . . . . . . . 17,705 24.2 34.2 1.5Biological mother. . . . . . . . . . . . . . . . . . . . . . . . . . . . . . 15,303 20.9 36.6 1.6Living with other adult relative3. . . . . . . . . . . . . . . . . 3,197 4.4 23.9 3.2Living with opposite sex adult nonrelative4 . . . . . . 380 0.5 32.1 10.1
Biological father . . . . . . . . . . . . . . . . . . . . . . . . . . . . . . . 1,972 2.7 15.8 3.5Living with other adult relative3. . . . . . . . . . . . . . . . . 375 0.5 15.5 7.9Living with opposite sex adult nonrelative4 . . . . . . 66 0.1 (B) (B)
Stepparent or adoptive parent . . . . . . . . . . . . . . . . . . 429 0.6 31.9 9.5
B Base less than 75,000.1 This number, when added to or subtracted from the estimate, represents the 90-percent confidence interval around the estimate.2 Unmarried includes married spouse absent, widowed, divorced, separated, and never married.3 The category ‘‘other adult relative’’ does not include the child’s siblings.4 Only includes adult nonrelatives who are not in the category ‘‘married spouse present.’’Source: U.S. Census Bureau, Survey of Income and Program Participation, 2004 Panel, Wave 2.
who were not married to eachother.
Twenty-three percent of all childrenlived with their unmarried motheronly (17.0 million), while 3 percent(2.4 million) lived with theirunmarried father without theirmother present.
The overall pattern of livingarrangements of children withunmarried parents clearly indicatesthat women are the primary custo-dial parents of these children andthat these children usually haveunmarried mothers living without apartner present. Of the 18.7 mil-lion children living with theirunmarried biological mothers, 3.4 million (18 percent) had moth-ers who were living with unmar-ried partners. In comparison, ofthe 4.2 million children living withtheir unmarried biological fathers,2.2 million (53 percent) were livingwith fathers who were living withan unmarried partner, of whom
1.8 million were also the child’sbiological mother.
The percentage of children livingbelow the poverty level varied bythe number of parents with whomthey lived. In 2004, 18 percent ofchildren lived in families that werebelow the poverty level.13 Whileone-tenth of children living withmarried parents were below thepoverty level, this was the case for29 percent of children living withno parents and 34 percent of thoseliving with one or two unmarriedparents. Among children living withtwo unmarried parents, 31 percentwere living in poverty. Children liv-ing with their unmarried motheronly were twice as likely to live in
U.S. Census Bureau 7
13 The SIPP poverty estimate compareswell with the 2005 Annual Social andEconomic Supplement to the CurrentPopulaton Survey estimate of 17.3 percent ofchildren under 18 living in families who werebelow the poverty level, based on 2004income; see <http://pubdb3.census.gov/macro/032005/pov/new02_100_01.htm>.The two estimates do not differ statisticallyfrom each other.
poverty (37 percent) as childrenliving with their unmarried fatheronly (17 percent).
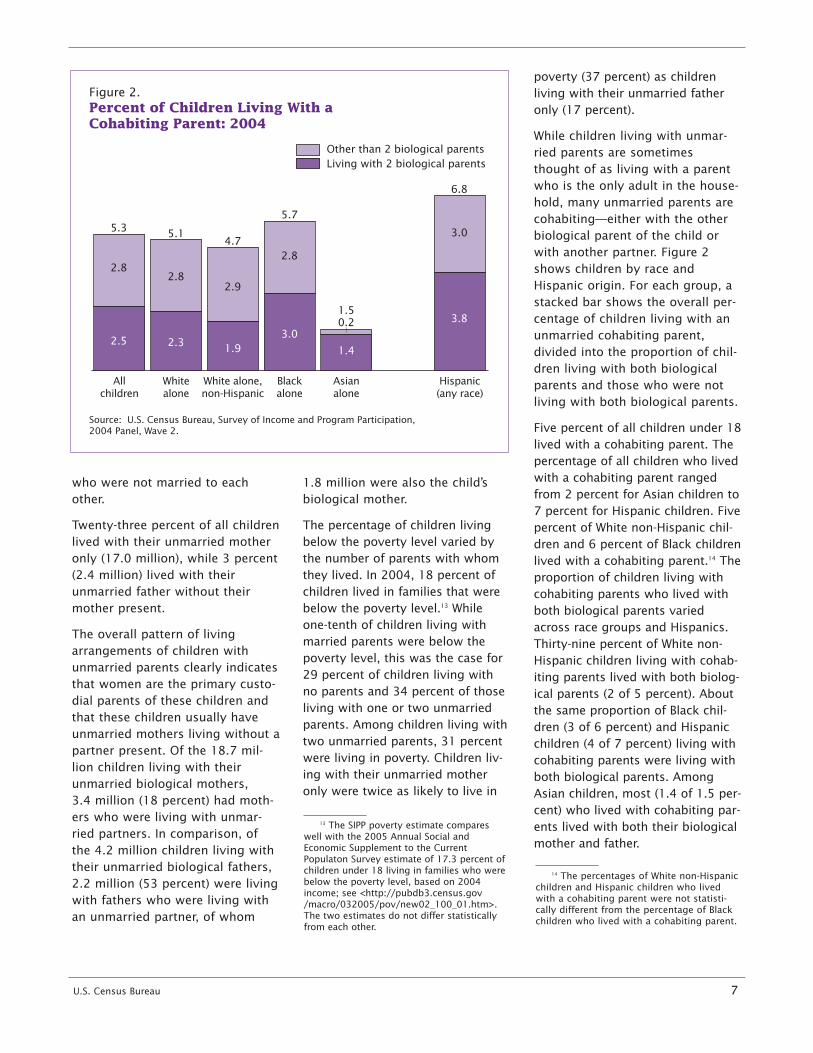
While children living with unmar-ried parents are sometimesthought of as living with a parentwho is the only adult in the house-hold, many unmarried parents arecohabiting—either with the otherbiological parent of the child orwith another partner. Figure 2shows children by race andHispanic origin. For each group, astacked bar shows the overall per-centage of children living with anunmarried cohabiting parent,divided into the proportion of chil-dren living with both biologicalparents and those who were notliving with both biological parents.
Five percent of all children under 18lived with a cohabiting parent. Thepercentage of all children who livedwith a cohabiting parent rangedfrom 2 percent for Asian children to7 percent for Hispanic children. Fivepercent of White non-Hispanic chil-dren and 6 percent of Black childrenlived with a cohabiting parent.14 Theproportion of children living withcohabiting parents who lived withboth biological parents variedacross race groups and Hispanics.Thirty-nine percent of White non-Hispanic children living with cohab-iting parents lived with both biolog-ical parents (2 of 5 percent). Aboutthe same proportion of Black chil-dren (3 of 6 percent) and Hispanicchildren (4 of 7 percent) living withcohabiting parents were living withboth biological parents. AmongAsian children, most (1.4 of 1.5 per-cent) who lived with cohabiting par-ents lived with both their biologicalmother and father.
14 The percentages of White non-Hispanicchildren and Hispanic children who livedwith a cohabiting parent were not statisti-cally different from the percentage of Blackchildren who lived with a cohabiting parent.
Figure 2.Percent of Children Living With a Cohabiting Parent: 2004
Source: U.S. Census Bureau, Survey of Income and Program Participation, 2004 Panel, Wave 2.
Other than 2 biological parentsLiving with 2 biological parents
Hispanic(any race)
Asianalone
Blackalone
White alone,non-Hispanic
Whitealone
Allchildren
3.05.3 5.14.7
5.7
1.5
6.8
2.5 2.3 1.93.0
1.4
3.8
2.82.8
2.9
2.8
0.2

Parents by Type ofRelationship With TheirCoresident Children
Table 3 shows estimates of thenumber of parents with coresidentchildren in 2004 by type of relation-ship with their children. The datasuggest that more fathers live inblended families that include chil-dren from their spouse’s or partner’sprevious relationships. While 94percent of the 37.8 million motherswith coresident children were livingwith biological children only, thiswas true for 85 percent of the 30.2million fathers with coresident chil-dren. A higher percentage of fathersthan mothers lived with both theirbiological and stepchildren and noother children (6 percent comparedwith 2 percent). The percentage offathers who lived with theirstepchildren only (4 percent) wasalso higher than that of mothers (1percent). Fathers were more likelyto live with any stepchildren (11percent) or adopted children (4 per-cent) than were mothers, of whom3 percent lived with any stepchil-dren and 2 percent lived with anyadopted children. For both fathersand mothers, less than 1 percentliving with children lived with foster children.
Children With Siblings
In addition to the number of par-ents with whom children live,another aspect of growing up isthe presence of brothers and sis-ters (Table 4). About 21 percent ofchildren (15.5 million) in 2004were currently living with no othersiblings in the household. Another28.4 million children lived withonly one sibling, while the remain-ing 29.3 million lived with two ormore siblings.
Of the 57.7 million children livingwith siblings, 51.8 million lived
only with full siblings (children whohad the same biological mother andfather). Twelve percent of all chil-dren lived with at least one half sib-ling, 2 percent with at least onestepsibling, and another 2 percentwith at least one adopted sibling.15
A larger proportion of childrenliving with two parents had siblings(84 percent) than was the case forchildren living with their motheronly (74 percent) or their fatheronly (62 percent). Among the 2.9
8 U.S. Census Bureau
15 The percentage of children who livedwith at least one stepsibling does not differstatistically from the percentage of childrenwho lived with at least one adopted sibling.
million children living with no par-ents, 36 percent lived with siblings.
Adopted Children
The number of adopted children isdifficult to estimate accurately. SIPPestimates rely on the relationshipsreported by the respondent—administrative records are notused. This collection method couldmiss some legalized adoptions andinclude informal adoptions whereno legal adoption exists.
Because of the small number ofadopted children and potential diffi-culties in counting them accurately
Table 3.Parents With Specified Types of Coresident Children:2004(Numbers in thousands. Types of coresident children of any age for parents with at leastone coresident child under 18)
Parent-child relationship
Number
PercentMargin of
1Estimate error
Fathers . . . . . . . . . . . . . . . . . . . . . . . . . . . . . . . . . . . . . . . .Biological children only. . . . . . . . . . . . . . . . . . . . . . . .Stepchildren only. . . . . . . . . . . . . . . . . . . . . . . . . . . . .Adopted children only. . . . . . . . . . . . . . . . . . . . . . . . .Foster children only . . . . . . . . . . . . . . . . . . . . . . . . . .Biological children and stepchildren only . . . . . . . .Biological children and adopted children only . . . .Other combinations. . . . . . . . . . . . . . . . . . . . . . . . . . .
Any biological children . . . . . . . . . . . . . . . . . . . . . . . .Any stepchildren . . . . . . . . . . . . . . . . . . . . . . . . . . . . .Any adopted children . . . . . . . . . . . . . . . . . . . . . . . . .Any foster children . . . . . . . . . . . . . . . . . . . . . . . . . . .
Mothers . . . . . . . . . . . . . . . . . . . . . . . . . . . . . . . . . . . . . . .Biological children only. . . . . . . . . . . . . . . . . . . . . . . .Stepchildren only. . . . . . . . . . . . . . . . . . . . . . . . . . . . .Adopted children only. . . . . . . . . . . . . . . . . . . . . . . . .Foster children only . . . . . . . . . . . . . . . . . . . . . . . . . .Biological children and stepchildren only . . . . . . . .Biological children and adopted children only . . . .Other combinations. . . . . . . . . . . . . . . . . . . . . . . . . . .
Any biological children . . . . . . . . . . . . . . . . . . . . . . . .Any stepchildren . . . . . . . . . . . . . . . . . . . . . . . . . . . . .Any adopted children . . . . . . . . . . . . . . . . . . . . . . . . .Any foster children . . . . . . . . . . . . . . . . . . . . . . . . . . .
30,23125,622
1,30255376
1,910564203
28,2093,3551,257
156
37,78635,673
34945771
751364121
36,8831,128
861173
6836361529937
18310060
66324214953
748731799036
1158046
741141123
55
100.084.8
4.31.80.36.31.90.7
93.311.14.20.5
100.094.40.91.20.22.01.00.3
97.63.02.30.5
1 This number, when added to or subtracted from the estimate, represents the 90-percentconfidence interval around the estimate.
Note: All of the parents in this table have at least one coresident child under 18. Some also havecoresident children who are 18 and older, and the type of relationship between the parent and theseolder children is also reflected in the table.
Source: U.S. Census Bureau, Survey of Income and Program Participation, 2004 Panel, Wave 2.

in the SIPP, only basic information ispresented in Table 5. The numberof adopted children rose from 1.1million in 1991 to 1.5 million in2004.16 In 2004, 20 percent ofadopted children lived with one par-ent, compared with 26 percent ofall children. The majority (80 per-cent) of adopted children lived withtwo parents—44 percent lived withtwo adoptive parents, 30 percentlived with an adoptive parent and abiological parent, and 6 percentlived with an adoptive parent and astepparent. Many children who livewith one adoptive parent and onebiological parent have beenadopted by their stepparent.
U.S. Census Bureau 9
16 Stacy Furukawa, The Diverse LivingArrangements of Children: Summer 1991,Current Population Reports, P70-38,Washington, DC: U.S. Census Bureau, 1994.
Table 4.Children Living With Siblings by Type of Relationship and Presence of Parent: 2004(Numbers in thousands)
Presence of siblings
Total Two parents Mother only Father only No parents
Num-ber
Marginof1error
Per-cent
Num-ber
Per-cent
Num-ber
Per-cent
Num-ber
Per-cent
Num-ber
Per-cent
Children . . . . . . . . . . . . . . . . . . . . . . . . . . . . . . . 73,227 940 100.0 51,013 100.0 16,972 100.0 2,363 100.0 2,878 100.0
Living with at least one sibling . . . . . . . . . . . 57,703 875 78.8 42,730 83.8 12,486 73.6 1,463 61.9 1,024 35.6Living with only full siblings . . . . . . . . . . . 51,799 844 70.7 38,701 75.9 10,809 63.7 1,392 58.9 897 31.2Living with at least one stepsibling . . . . 1,263 149 1.7 927 1.8 225 1.3 75 3.2 37 1.3Living with at least one adoptedsibling . . . . . . . . . . . . . . . . . . . . . . . . . . . . 1,128 141 1.5 853 1.7 222 1.3 49 2.1 3 0.1
Living with at least one half sibling . . . . 8,587 383 11.7 6,142 12.0 2,273 13.4 45 1.9 127 4.4
Living with—No siblings . . . . . . . . . . . . . . . . . . . . . . . . . 15,524 507 21.2 8,283 16.2 4,487 26.4 900 38.1 1,854 64.41 sibling. . . . . . . . . . . . . . . . . . . . . . . . . . . . 28,368 664 38.7 21,004 41.2 5,917 34.9 863 36.5 584 20.32 siblings . . . . . . . . . . . . . . . . . . . . . . . . . . 18,145 545 24.8 13,201 25.9 4,276 25.2 393 16.6 275 9.63 siblings. . . . . . . . . . . . . . . . . . . . . . . . . . . 7,493 359 10.2 5,686 11.1 1,524 9.0 162 6.9 121 4.24 or more siblings . . . . . . . . . . . . . . . . . . . 3,697 254 5.0 2,839 5.6 769 4.5 45 1.9 44 1.5
1 This number, when added to or subtracted from the estimate, represents the 90-percent confidence interval around the estimate.Note: Children are under 18. Their siblings may be any age.Source: U.S. Census Bureau, Survey of Income and Program Participation, 2004 Panel, Wave 2.
Table 5.Adopted Children by Race and Hispanic Origin and LivingArrangements: 2004(Numbers in thousands)
Characteristics of children
Number
PercentEstimateMargin of
1error
Adopted children . . . . . . . . . . . . . . . . . . . . . . . . . . . . . 1,504 163 100.0
Race and Hispanic OriginWhite alone . . . . . . . . . . . . . . . . . . . . . . . . . . . . . . 1,034 135 68.8
Non-Hispanic . . . . . . . . . . . . . . . . . . . . . . . . . . . 880 125 58.5Black alone. . . . . . . . . . . . . . . . . . . . . . . . . . . . . . . 244 66 16.2Asian alone. . . . . . . . . . . . . . . . . . . . . . . . . . . . . . . 79 37 5.2
Hispanic (any race). . . . . . . . . . . . . . . . . . . . . . . . 187 58 12.4
Living ArrangementsTwo parents . . . . . . . . . . . . . . . . . . . . . . . . . . . . . . 1,206 146 80.2
Two adoptive parents . . . . . . . . . . . . . . . . . . . . 668 109 44.4One adoptive and one biological . . . . . . . . . . 456 90 30.3Other (one adoptive and one stepparent) . . 82 38 5.5
One parent . . . . . . . . . . . . . . . . . . . . . . . . . . . . . . 298 73 19.8Mother only. . . . . . . . . . . . . . . . . . . . . . . . . . . . . 259 68 17.2Father only . . . . . . . . . . . . . . . . . . . . . . . . . . . . . 39 26 2.6
1 This number, when added to or subtracted from the estimate, represents the 90-percentconfidence interval around the estimate.
Source: U.S. Census Bureau, Survey of Income and Program Participation, 2004 Panel, Wave 2.
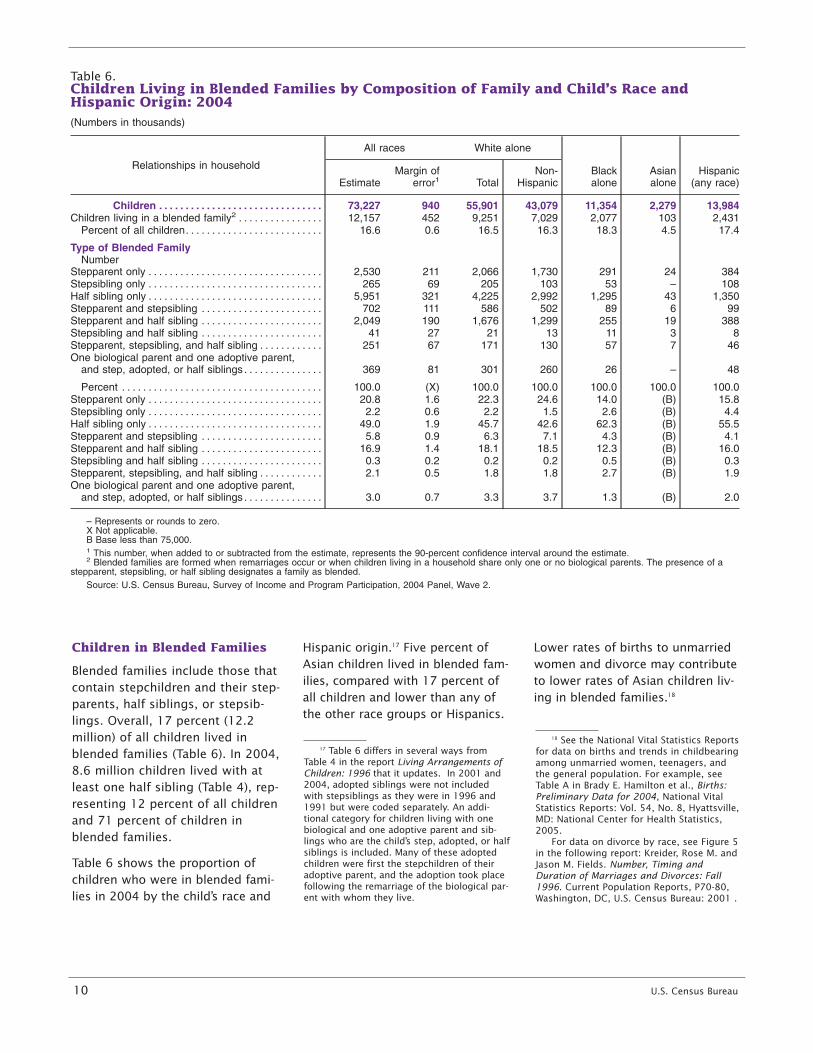
Children in Blended Families
Blended families include those thatcontain stepchildren and their step-parents, half siblings, or stepsib-lings. Overall, 17 percent (12.2million) of all children lived inblended families (Table 6). In 2004,8.6 million children lived with atleast one half sibling (Table 4), rep-resenting 12 percent of all childrenand 71 percent of children inblended families.
Table 6 shows the proportion ofchildren who were in blended fami-lies in 2004 by the child’s race and
Hispanic origin.17 Five percent ofAsian children lived in blended fam-ilies, compared with 17 percent ofall children and lower than any ofthe other race groups or Hispanics.
10 U.S. Census Bureau
17 Table 6 differs in several ways fromTable 4 in the report Living Arrangements ofChildren: 1996 that it updates. In 2001 and2004, adopted siblings were not includedwith stepsiblings as they were in 1996 and1991 but were coded separately. An addi-tional category for children living with onebiological and one adoptive parent and sib-lings who are the child’s step, adopted, or halfsiblings is included. Many of these adoptedchildren were first the stepchildren of theiradoptive parent, and the adoption took placefollowing the remarriage of the biological par-ent with whom they live.
Lower rates of births to unmarriedwomen and divorce may contributeto lower rates of Asian children liv-ing in blended families.18
18 See the National Vital Statistics Reportsfor data on births and trends in childbearingamong unmarried women, teenagers, andthe general population. For example, seeTable A in Brady E. Hamilton et al., Births:Preliminary Data for 2004, National VitalStatistics Reports: Vol. 54, No. 8, Hyattsville,MD: National Center for Health Statistics,2005.
For data on divorce by race, see Figure 5in the following report: Kreider, Rose M. andJason M. Fields. Number, Timing andDuration of Marriages and Divorces: Fall1996. Current Population Reports, P70-80,Washington, DC, U.S. Census Bureau: 2001 .
Table 6.Children Living in Blended Families by Composition of Family and Child’s Race andHispanic Origin: 2004(Numbers in thousands)
Relationships in household
All races White alone
Blackalone
Asianalone
Hispanic(any race)Estimate
Margin of1error Total
Non-Hispanic
Children . . . . . . . . . . . . . . . . . . . . . . . . . . . . . . . 73,227 940 55,901 43,079 11,354 2,279 13,984Children living in a blended family2 . . . . . . . . . . . . . . . . 12,157 452 9,251 7,029 2,077 103 2,431
Percent of all children. . . . . . . . . . . . . . . . . . . . . . . . . . 16.6 0.6 16.5 16.3 18.3 4.5 17.4
Type of Blended FamilyNumber
Stepparent only . . . . . . . . . . . . . . . . . . . . . . . . . . . . . . . . . 2,530 211 2,066 1,730 291 24 384Stepsibling only . . . . . . . . . . . . . . . . . . . . . . . . . . . . . . . . . 265 69 205 103 53 – 108Half sibling only . . . . . . . . . . . . . . . . . . . . . . . . . . . . . . . . . 5,951 321 4,225 2,992 1,295 43 1,350Stepparent and stepsibling . . . . . . . . . . . . . . . . . . . . . . . 702 111 586 502 89 6 99Stepparent and half sibling . . . . . . . . . . . . . . . . . . . . . . . 2,049 190 1,676 1,299 255 19 388Stepsibling and half sibling . . . . . . . . . . . . . . . . . . . . . . . 41 27 21 13 11 3 8Stepparent, stepsibling, and half sibling . . . . . . . . . . . . 251 67 171 130 57 7 46One biological parent and one adoptive parent,
and step, adopted, or half siblings . . . . . . . . . . . . . . . 369 81 301 260 26 – 48
Percent . . . . . . . . . . . . . . . . . . . . . . . . . . . . . . . . . . . . . . 100.0 (X) 100.0 100.0 100.0 100.0 100.0Stepparent only . . . . . . . . . . . . . . . . . . . . . . . . . . . . . . . . . 20.8 1.6 22.3 24.6 14.0 (B) 15.8Stepsibling only . . . . . . . . . . . . . . . . . . . . . . . . . . . . . . . . . 2.2 0.6 2.2 1.5 2.6 (B) 4.4Half sibling only . . . . . . . . . . . . . . . . . . . . . . . . . . . . . . . . . 49.0 1.9 45.7 42.6 62.3 (B) 55.5Stepparent and stepsibling . . . . . . . . . . . . . . . . . . . . . . . 5.8 0.9 6.3 7.1 4.3 (B) 4.1Stepparent and half sibling . . . . . . . . . . . . . . . . . . . . . . . 16.9 1.4 18.1 18.5 12.3 (B) 16.0Stepsibling and half sibling . . . . . . . . . . . . . . . . . . . . . . . 0.3 0.2 0.2 0.2 0.5 (B) 0.3Stepparent, stepsibling, and half sibling . . . . . . . . . . . . 2.1 0.5 1.8 1.8 2.7 (B) 1.9One biological parent and one adoptive parent,
and step, adopted, or half siblings . . . . . . . . . . . . . . . 3.0 0.7 3.3 3.7 1.3 (B) 2.0
– Represents or rounds to zero.X Not applicable.B Base less than 75,000.1 This number, when added to or subtracted from the estimate, represents the 90-percent confidence interval around the estimate.2 Blended families are formed when remarriages occur or when children living in a household share only one or no biological parents. The presence of a
stepparent, stepsibling, or half sibling designates a family as blended.Source: U.S. Census Bureau, Survey of Income and Program Participation, 2004 Panel, Wave 2.

After living with half siblings, liv-ing with a stepparent is the next-largest living arrangement thatcontributes to children living in ablended family—8 percent of allchildren and 46 percent of childrenin blended families lived with astepparent. In blended families,stepparents were more commonlyfound living with White non-Hispanic children (52 percent) thanwith Black children or Hispanicchildren (33 percent and 38 per-cent, respectively). This isexpected, since White women havebeen found to remarry more oftenthan Black or Hispanic women.19
U.S. Census Bureau 11
19 Bramlett, Matthew and William Mosher.Cohabitation, Marriage, Divorce andRemarriage in the United States. Vital HealthStatistics 23(22), Hyattsville, MD: NationalCenter for Health Statistics, 2002.
Figure 3 details the percentage ofchildren living in blended familiesby race and number of parents.Overall, 17 percent of childrenlived in a blended family—14 per-cent of those living with one par-ent and 18 percent of those livingwith two parents were in blendedfamilies. Percentages are found tobe higher for children living withtwo parents because of the higherpotential for one of these parentsto be a stepparent. Among childrenliving with two parents, Black chil-dren had the highest percentageliving in a blended family (28 per-cent), while Asian children had thelowest percentage (4 percent).
Children Living WithGrandparents
Grandparents play an important rolein providing care for children—they
are the most frequently mentionedcare providers for children under 5among all types of relatives.20 In2004, 6.5 million children lived inhouseholds with at least one grand-parent present (9 percent of all chil-dren, Table 7). Twelve percent ofHispanic children and 14 percent ofBlack children lived with a grand-parent, while 6 percent of Whitenon-Hispanic children lived with agrandparent.21
20 Overturf Johnson, Julia. Who’s Mindingthe Kids? Child Care Arrangements: 2002,Current Population Reports, P70-101, Washington, DC: U.S. Census Bureau, 2005,Table 1.
21 The percentage of Asian children wholived with a grandparent (15 percent) wasnot statistically different from the percent-age of Black or Hispanic children who livedwith a grandparent.
Figure 3.Percent of Children Living in Blended Families by Race and Hispanic Origin and Number of Parents: 2004
Note: The category for all children includes those living with no parents.
Source: U.S. Census Bureau, Survey of Income and Program Participation , 2004 Panel, Wave 2.
2 parents
Hispanic(any race)
Asian aloneBlack aloneWhite alone,non-Hispanic
White aloneAll
All 1 parent
181714
18 1714
18 1612
18 1813
28
49
4
17 18

The arrangements when grandpar- This characteristic differs by the Children living with grandparentsents and grandchildren live in the number of parents. Thirty-nine per- more often lived in families insame household vary. The child’s cent of children living with a poverty than children living inparents are sometimes present and grandparent and two parents were households with no grandparentsthe household may be maintained living in households maintained by present (22 percent and 17 percent,either by the child’s parents or the grandparent, while 79 percent respectively). The association
grandparents. In 2004, 75 percent of children living with a single between children’s coresidence with
of children (4.9 million) living with a mother and a grandparent were liv- their grandparent and the poverty
grandparent were also living with a ing in the grandparent’s household. level is not simple. A grandchild
parent in the household, and 62 per- Among the 1.6 million children liv- may live with a grandparent to alle-
cent of these children (3.0 million) ing in households with grandpar- viate financial hardship of a parent.
were in a household where their ents but no parents present, the Alternatively, the grandparent may
grandparent was the householder. grandparent was the householder move in with their child and grand-98 percent of the time. child if they need assistance.
12 U.S. Census Bureau
Table 7.Children Below the Poverty Level by Presence of Parents and Grandparents and by Raceand Hispanic Origin: 2004(Numbers in thousands)
Living arrangements
All races
Whitealone
Whitealone,
non-Hispanic
Blackalone
Asianalone
Hispanic(any race)Estimate
Margin of1error
Children . . . . . . . . . . . . . . . . . . . . . . . . . . . . . . . . . . . . . . . . 73,227 940 55,901 43,079 11,354 2,279 13,984
Children living with at least one grandparent. . . . . . . . . . . . . . 6,471 334 4,108 2,592 1,590 301 1,643Percent of all children. . . . . . . . . . . . . . . . . . . . . . . . . . . . . . . . 8.8 0.4 7.3 6.0 14.0 13.2 11.7
Presence of ParentsTwo parents . . . . . . . . . . . . . . . . . . . . . . . . . . . . . . . . . . . . . . . . . . 2,091 192 1,593 950 130 244 684
Grandparent is householder . . . . . . . . . . . . . . . . . . . . . . . . . 825 121 614 407 85 56 229Mother only. . . . . . . . . . . . . . . . . . . . . . . . . . . . . . . . . . . . . . . . . . . 2,450 207 1,409 806 825 46 654
Grandparent is householder . . . . . . . . . . . . . . . . . . . . . . . . . 1,925 184 1,126 662 641 27 503Father only . . . . . . . . . . . . . . . . . . . . . . . . . . . . . . . . . . . . . . . . . . . 331 77 268 233 25 – 43
Grandparent is householder . . . . . . . . . . . . . . . . . . . . . . . . . 279 70 227 205 17 – 30Neither parent . . . . . . . . . . . . . . . . . . . . . . . . . . . . . . . . . . . . . . . . 1,599 168 838 603 610 11 263
Grandparent is householder . . . . . . . . . . . . . . . . . . . . . . . . . 1,563 166 819 587 597 11 260
Percent of Children Below Poverty LevelAll children . . . . . . . . . . . . . . . . . . . . . . . . . . . . . . . . . . . . . . . . . . . 17.7 0.6 14.3 10.9 33.8 15.7 26.0
Two parents . . . . . . . . . . . . . . . . . . . . . . . . . . . . . . . . . . . . . . . 10.9 0.6 10.1 7.4 17.5 14.6 20.1Mother only. . . . . . . . . . . . . . . . . . . . . . . . . . . . . . . . . . . . . . . . 36.5 1.6 30.7 26.0 46.2 22.0 41.8Father only . . . . . . . . . . . . . . . . . . . . . . . . . . . . . . . . . . . . . . . . 16.6 3.2 14.1 14.2 29.2 (B) 17.0Neither parent . . . . . . . . . . . . . . . . . . . . . . . . . . . . . . . . . . . . . 28.5 3.5 23.6 20.5 35.0 (B) 29.0
Children living with grandparents . . . . . . . . . . . . . . . . . . . . . . . . 22.0 2.2 18.4 16.4 30.3 22.6 22.0Two parents . . . . . . . . . . . . . . . . . . . . . . . . . . . . . . . . . . . . . . . 13.8 3.2 12.8 11.8 13.8 19.3 14.6Mother only. . . . . . . . . . . . . . . . . . . . . . . . . . . . . . . . . . . . . . . . 23.0 3.6 19.1 15.6 28.5 (B) 24.6Father only . . . . . . . . . . . . . . . . . . . . . . . . . . . . . . . . . . . . . . . . 16.3 8.6 16.4 18.9 (B) – (B)Neither parent . . . . . . . . . . . . . . . . . . . . . . . . . . . . . . . . . . . . . 32.5 4.9 28.5 23.7 36.9 (B) 38.0
Children living in grandparents’ household. . . . . . . . . . . . . 25.3 2.7 21.4 17.9 32.3 40.0 27.4Two parents . . . . . . . . . . . . . . . . . . . . . . . . . . . . . . . . . . . . . 17.1 5.5 16.1 14.0 15.3 (B) 18.8Mother only. . . . . . . . . . . . . . . . . . . . . . . . . . . . . . . . . . . . . . 23.7 4.1 19.5 14.7 30.3 (B) 27.2Father only . . . . . . . . . . . . . . . . . . . . . . . . . . . . . . . . . . . . . . 16.1 9.3 16.3 18.0 (B) – (B)Neither parent . . . . . . . . . . . . . . . . . . . . . . . . . . . . . . . . . . . 33.2 5.0 29.2 24.4 37.7 (B) 38.5
Children not living with grandparents . . . . . . . . . . . . . . . . . . . . 17.3 0.6 14.0 10.6 34.4 14.7 26.5Two parents . . . . . . . . . . . . . . . . . . . . . . . . . . . . . . . . . . . . . . . 10.8 0.6 9.9 7.2 17.6 13.9 20.5Mother only. . . . . . . . . . . . . . . . . . . . . . . . . . . . . . . . . . . . . . . . 38.7 1.7 32.6 27.3 49.1 20.0 45.7Father only . . . . . . . . . . . . . . . . . . . . . . . . . . . . . . . . . . . . . . . . 16.6 3.5 13.7 13.4 30.2 (B) 20.0Neither parent . . . . . . . . . . . . . . . . . . . . . . . . . . . . . . . . . . . . . 23.5 5.0 18.4 16.4 32.1 (B) 22.2
– Represents or rounds to zero.B Base less than 75,000.1 This number, when added to or subtracted from the estimate, represents the 90-percent confidence interval around the estimate.Souce: U.S. Census Bureau, Survey of Income and Program Participation, 2004 Panel, Wave 2.

Among children living with theirgrandparents, 14 percent of thoseliving in households with two par-ents present were in poverty, notstatistically different from the 16percent of those living with theirfather only who were in poverty.Twenty-three percent were inpoverty among those who livedonly with their mother, and 33 per-cent of those who lived with theirgrandparents when neither parentwas present were in poverty.22
U.S. Census Bureau 13
22 The percentage of children in povertyfor those who lived with a grandparent andtheir mother did not differ statistically fromthe percentage of children in poverty forthose who lived with a grandparent andtheir father.
Children living with neither parentwere more often in poverty whenthey lived with a grandparent (33percent) than when they did not (24percent). Many states allow grand-parents raising grandchildren toreceive foster care or kinship carepayments. However, some grandpar-ents may be unable to supplementthese payments with paid work ifthey are elderly or disabled. Othersmight be unaware of the availabilityof kinship care payments.
Children Living WithGrandparents: Differences inArrangements by Race andHispanic Origin
Figure 4 illustrates that amongchildren living with their motherbut not their father, grandparents
may offer economic resources toreduce the proportion of childrenliving in poverty. Overall, 23 per-cent of children living with a singlemother and a grandparent were inpoverty compared with 39 percentfor those not living with a grand-parent. This pattern appears for allrace groups and Hispanics.
Overall, 6 percent of White non-Hispanic children lived with one ormore grandparents, less than thatof Black, Asian, or Hispanic chil-dren. Variations in frequency ofparents living in grandparent-grandchild households by the raceof the child illustrate the differentdynamics of extended householdformation for different racialgroups and Hispanics in the United States.
About half (52 percent) of Blackchildren who lived with grandpar-ents lived in households with singlemothers and grandparents, a largerproportion than for any of the othergroups shown in Figure 5. Another38 percent of Black children wholived with grandparents had noparents living with them, the high-est percentage for any of thegroups in Figure 5. These childrenlived with their grandparents underconditions often characterized bybirths to unmarried mothers,marital disruption, and the absenceof both parents from their daily liv-ing arrangements.23
23 See the following report, page 14 for anote about how marital status is determinedwhen births to unmarried women are calcu-lated: Brady E. Hamilton et al., Births:Preliminary Data for 2004, National VitalStatistics Reports: Vol. 54, No. 8, Hyattsville,MD: National Center for Health Statistics,2005. In most states, a question on the birthcertificate asks “Mother married? (At birth,conception, or any time between) (Yes or no).”
Figure 4.Percentage of Children Below the Poverty Level for Those Living With Mother Only by Presence of Grandparents and the Child's Race and Hispanic Origin: 2004
Note: These children do not have a father present in the household. Base less than 75,000 for Asian-alone children, so this group cannot be shown in this figure.
Source: U.S. Census Bureau, Survey of Income and Program Participation, 2004 Panel, Wave 2.
Children living with grandparents Children not living with grandparents
Hispanic(any race)
Black aloneWhite alone,non-Hispanic
White aloneAll races
23.019.1
15.6
28.524.6
38.7
32.6
27.3
49.1 45.7

In contrast, the majority (81 per-cent) of Asian children who livedwith grandparents also lived withboth parents. Another 15 percentof these children lived with theirmother and their grandparents,while 4 percent lived with grand-parents and no parent present.Twenty-three percent of Asian chil-dren in grandparent-grandchildhouseholds with two parents pres-ent were living in householdswhere the grandparent was thehouseholder (Table 7).
Thirty-seven percent of White non-Hispanic children living with theirgrandparents also lived with twoparents and an additional 31 per-cent lived with grandparents andtheir mother (Figure 5).24 Forty-three percent of the children livingwith two parents and grandparentslived in a household in which theirgrandparent was the householder.
Hispanic children were about aslikely to live with both parents anda grandparent (42 percent) as theywere to live with their mother onlyand a grandparent (40 percent). Thegrandparent was the householderfor about one- third (33 percent) ofHispanic children who lived withtwo parents and grandparents.
14 U.S. Census Bureau
24 The percentage of White non-Hispanicchildren living with grandparents and twoparents did not differ statistically from thepercentage of White non-Hispanic childrenwho lived with their grandparents and theirmother.
Relatives in Extended Families
Children may grow up living notonly with their parents or grand-parents but also with other rela-tives. When relatives other than thechild’s parents or siblings are livingtogether, this type of family unit iscalled an extended family.
Table 8 presents data on the differ-ent types of relatives living with
children. The estimates of specificrelationship categories are notmutually exclusive. A child livingwith a grandmother, an uncle, andan aunt is counted separately ineach of those categories.25 Thelargest group of children living
25 Among the three subcategories ofgrandparents in Table 8, however, a child istabulated in only one of these categories.
Figure 5.Percent Distribution of Children Living With Grandparents by Presence of Parents and Race and Hispanic Origin1: 2004
1 Hispanics may be any race.
Source: U.S. Census Bureau, Survey of Income and Program Participation, 2004 Panel, Wave 2.
(Percent distribution)
No parents
Father only
Mother only
Two parents
Hispanic(any race)
Asianalone
Blackalone
White alonenon-Hispanic
Whitealone
All races
16
3239
37
8
81
42
3834
31
52
15
40
57
9
2
0
325
20 23
38
4

with another relative were living About 20 percent of children living be in poverty than children whowith a grandparent—6.5 million in extended families (2.7 million) lived with no parents and theirchildren were living with one or were not living with a parent. A grandmother only (20 percent andboth grandparents. While 2.3 mil- higher percentage of children in 45 percent, respectively). Thelion children lived with their extended families with no parents lower percentage of children inuncles, 2.0 million lived with their present were in poverty (29 per- poverty when both grandparentsaunts. The category of other rela- cent) than those who lived with at were present may reflect thetives includes more distant rela- least one parent (23 percent). higher number of potential earnerstives. These responses did not con- Children who lived with no parents in these households.tain enough cases to allow them to but with both their grandmotherbe shown with more specificity. and grandfather were less likely to
U.S. Census Bureau 15
Table 8.Children Living With Relatives by Type of Relative, Presence of Parents, and WhetherBelow Poverty Level: 2004(Numbers in thousands)
Total No parent present Parent(s) present1
Living arrangements MarginIn poverty In poverty
Esti- of Num- Per- Num- Per- Num- Per- Num- Per-mate 2error ber cent ber cent ber cent ber cent
Total. . . . . . . . . . . . . . . . . . . . . . . . . . . . . . . . . . . . 73,227 940 2,878 100.0 820 28.5 70,349 100.0 12,157 17.3
Presence of other relatives and nonrelatives3 . . . . 13,446 474 2,741 95.2 780 28.5 10,705 15.2 2,493 23.3Other relatives only . . . . . . . . . . . . . . . . . . . . . . . . . 9,648 405 2,002 69.6 678 33.9 7,646 10.9 1,621 21.2Other relatives and nonrelatives. . . . . . . . . . . . . . 779 117 181 6.3 55 30.4 598 0.9 127 21.2Nonrelatives only . . . . . . . . . . . . . . . . . . . . . . . . . . . 3,019 230 558 19.4 47 8.4 2,461 3.5 745 30.3
Specific Category of Relative4
Living with—Grandparent(s). . . . . . . . . . . . . . . . . . . . . . . . . . . . . 6,472 334 1,598 55.5 519 32.5 4,873 6.9 907 18.6
Grandmother and grandfather. . . . . . . . . . . . . . 2,527 211 788 27.4 160 20.3 1,739 2.5 268 15.4Grandmother only . . . . . . . . . . . . . . . . . . . . . . . . 3,371 243 751 26.1 338 45.0 2,621 3.7 533 20.3Grandfather only . . . . . . . . . . . . . . . . . . . . . . . . . 574 101 59 2.1 20 (B) 514 0.7 106 20.6
Uncle . . . . . . . . . . . . . . . . . . . . . . . . . . . . . . . . . . . . 2,327 202 287 10.0 90 31.4 2,040 2.9 520 25.5Aunt . . . . . . . . . . . . . . . . . . . . . . . . . . . . . . . . . . . . . . 1,998 188 311 10.8 91 29.3 1,687 2.4 450 26.7Nephew . . . . . . . . . . . . . . . . . . . . . . . . . . . . . . . . . . . 517 96 64 2.2 35 (B) 453 0.6 156 34.4Niece . . . . . . . . . . . . . . . . . . . . . . . . . . . . . . . . . . . . . 494 94 68 2.4 30 (B) 426 0.6 170 39.9Brother-in-law. . . . . . . . . . . . . . . . . . . . . . . . . . . . . . 121 46 28 1.0 14 (B) 94 0.1 13 13.8Sister-in-law . . . . . . . . . . . . . . . . . . . . . . . . . . . . . . . 87 39 27 0.9 11 (B) 61 0.1 15 (B)Other relative . . . . . . . . . . . . . . . . . . . . . . . . . . . . . . 3,443 245 1,092 37.9 380 34.8 2,351 3.3 582 24.8
B Base less than 75,000.1 Parents include biological, step, and adoptive parents.2 This number, when added to or subtracted from the estimate, represents the 90-percent confidence interval around the estimate.3 The child’s parents, siblings, and children are not included in other relatives.4 These categories are independent and not mutually exclusive. Relationship listed is to the child, (the child’s grandmother, aunt, etc.).Source: U.S. Census Bureau, Survey of Income and Program Participation, 2004 Panel, Wave 2.

Children Whose CoresidentParent’s Marital StatusChanged in the Last Year
Because the marital history of thechild’s coresident parents is col-lected in the SIPP, it is possible toestimate the number of childrenwho lived with a parent who mar-ried, divorced, or was widowed inthe last year. Table 9 shows thatabout 2.2 million children livedwith a mother who experienced amarital event in the last year.26 Ofthese children, 1.4 million livedwith their mothers who married inthe last year. For 794,000 of thesechildren, their biological father andmother married each other andboth were still living with the childat the time of the survey (Table 9).
Estimates of the number of childrenwhose parents divorced during ayear were previously tracked by theNational Center for Health Statistics(NCHS) as part of its vital statisticsprogram. Currently, NCHS does notreceive information from enoughstates to make these estimates.Previous NCHS data estimated thatthe number of children affected bydivorce had grown since 1950.Divorce rates increased in the late1970s and into the 1980s and sub-sequently leveled off in the late1980s and into the 1990s.27 An esti-mated 299,000 children were
16 U.S. Census Bureau
26 The number of children experiencingtheir mother’s or father’s marriage in the lastyear is not exactly equal due to the fact thatif the couple had separated by the time ofthe interview and the child is not currentlyliving with both mother and father, they willnot appear in both estimates.
27 Kathryn A. London, Children ofDivorce. Vital and Health Statistics. Series21, No. 46. DHHS Pub. No. (PHS) 89-1924,Hyattsville, MD: National Center for HealthStatistics, 1989.
Joshua R. Goldstein, “The Leveling ofDivorce in the United States,” Demography,Vol. 36, 1999, pp. 409-414.
involved in the divorces finalized in1950, or a rate of 6.3 per 1,000children. This number increased toa little over 1 million children by1972 (at a rate of 14.7 per 1,000children), and stayed just over 1million through 1984, when therate was a bit higher, at 17.2 per1,000 children.
Table 9 shows an estimated 1.1million children were living witheither their mother or father whodivorced in the year prior to theSIPP interview in 2004, or a rate of15 per 1,000 children. Seventy-four percent of these children livedwith their mother (791,000).
Composition of HouseholdsWith Children
While most of the tables in thisreport are shown from the child’spoint of view, Table 10 shows theliving arrangements of children atthe household level. In 2004, 40.0million households included chil-dren under 18—95 percent had atleast one child and his or herbiological parent, 9 percent had atleast one child and his or her step-parent, and 4 percent had at leastone child and his or her adoptiveparent. These categories are notmutually exclusive. For example,households can have children with
Table 9.Children Whose Coresident Parent’s Marital StatusChanged in the Last Year: 2004(Numbers in thousands)
Number
Marital event Esti- Margin1mate of error Percent
Children living with their mother2 . . . . . . . . . . . . . . . . . . . . . . . . 67,986 921 100.03Mother had marital event in last year . . . . . . . . . . . . . . . . . . . 2,214 197 3.3
Mother married in last year . . . . . . . . . . . . . . . . . . . . . . . . . . . 1,438 159 2.1First marriage . . . . . . . . . . . . . . . . . . . . . . . . . . . . . . . . . . . . . 854 123 1.3Married the child’s biological father and still married . . . 794 119 1.2
Average age of the child (in years) . . . . . . . . . . . . . . . . . 3.2 (X) (X)Mother divorced in last year . . . . . . . . . . . . . . . . . . . . . . . . . . 791 118 1.2
Divorce from first marriage . . . . . . . . . . . . . . . . . . . . . . . . . 637 106 0.9Mother changed residence in last year . . . . . . . . . . . . . . . 304 73 0.4
Mother widowed in last year . . . . . . . . . . . . . . . . . . . . . . . . . . 54 31 0.1
Children living with their father2 . . . . . . . . . . . . . . . . . . . . . . . . . 53,376 852 100.03Father had marital event in last year . . . . . . . . . . . . . . . . . . . . 1,629 169 3.1
Father married in last year . . . . . . . . . . . . . . . . . . . . . . . . . . . 1,368 155 2.6First marriage . . . . . . . . . . . . . . . . . . . . . . . . . . . . . . . . . . . . . 826 121 1.5Married the child’s biological mother and still married . . 794 119 1.5
Average age of the child (in years) . . . . . . . . . . . . . . . . . 3.2 (X) (X)Father divorced in last year. . . . . . . . . . . . . . . . . . . . . . . . . . . 278 70 0.5
Divorce from first marriage . . . . . . . . . . . . . . . . . . . . . . . . . 214 62 0.4Father changed residence in last year . . . . . . . . . . . . . . . 89 40 0.2
Father widowed in last year . . . . . . . . . . . . . . . . . . . . . . . . . . 31 23 0.1
X Not applicable.1 This number, when added to or subtracted from the estimate, represents the 90-percent
confidence interval around the estimate.2 All of the children in the table live with at least one parent—biological, step, or adoptive.3 More than one marital event may have occurred in the last year, so individual event categories
may add to more than the total.
Note: Sufficient data to measure incidence of separation are not available.Source: U.S. Census Bureau, Survey of Income and Program Participation, 2004 Panel, Wave 2.

both a biological parent and a child other than his or her parentsstepparent. There were 4.7 million or siblings. households with blended families
While 14 percent of all householdsand 1.7 million households with
with a child under 18 were belowadoptive families.
the poverty level, the percentagesEight percent of households with for blended households and house-children under 18 (3.3 million) had holds containing a child and his orgrandparents and grandchildren her stepparent were lower, at aboutpresent, with 89 percent of these 11 percent. This difference likelycomposed of a child, his or her reflects the fact that stepfamiliesparent(s), and the child’s grandpar- are often formed by remarriage, soent(s). An additional 3 percent, or these households are more likely to1.0 million, included a child and have two parents and two earnershis or her grandparent(s) but not than households with children andthe child’s parent(s). About 1 in 5 biological parents, which includehouseholds with children included single parents. Households innonrelatives or relatives of the which children lived without a
parent present had a poverty rate of23 percent. Twenty-seven percentof households with children, theirgrandparent(s), and no parent(s)were below the poverty level.
Overall, 44 percent of householdswith children received some type ofpublic assistance (Table 10).28 Ahigher percentage of grandparent-grandchild households and
U.S. Census Bureau 17
28 Cash and noncash public assistance areincluded. Noncash benefits include foodstamps; the Special Supplemental NutritionProgram for Women, Infants, and Children;Medicaid; rent for public housing; lower rentdue to government subsidy; energy assis-tance; and free or reduced-price lunches orbreakfasts.
Table 10.Composition of Households With Children: 2004(Numbers in thousands)
Characteristic
Households with children under 18Percent of
householdsbelow the
povertylevel2
Percent ofhouseholds
receivingpublic
assistance
Number
PercentEstimateMargin of
1error
Households with children under 18 . . . . . . . . . . . . . . . . . . . . . . . . . . . . 40,011 766 100.0 14.0 43.7
Households containing—Parent and child present3 . . . . . . . . . . . . . . . . . . . . . . . . . . . . . . . . . . 38,777 756 96.9 13.8 42.8No parent and child. . . . . . . . . . . . . . . . . . . . . . . . . . . . . . . . . . . . . . . . 1,234 148 3.1 22.9 72.2
Biological parent, biological child present. . . . . . . . . . . . . . . . . . . . . 38,044 750 95.1 13.8 42.7Stepparent, stepchild present . . . . . . . . . . . . . . . . . . . . . . . . . . . . . . . 3,642 252 9.1 10.8 46.1Adoptive parent, adopted child present. . . . . . . . . . . . . . . . . . . . . . . 1,461 161 3.7 7.2 47.1Foster parent, foster child present . . . . . . . . . . . . . . . . . . . . . . . . . . . 208 61 0.5 12.0 83.7
Blended household (stepchild, stepparent, half sibling, orstepsibling present)4 . . . . . . . . . . . . . . . . . . . . . . . . . . . . . . . . . . . . . . 4,661 285 11.6 10.7 48.7
Adoptive household (adoptive parent, adopted child, oradopted siblings present)5. . . . . . . . . . . . . . . . . . . . . . . . . . . . . . . . . 1,656 171 4.1 7.3 46.1
Grandparent-grandchild households . . . . . . . . . . . . . . . . . . . . . . . . . 3,316 241 8.3 15.5 70.0Child, grandparent present, parent(s) present . . . . . . . . . . . . . . . 2,958 228 7.4 14.4 68.7Child, grandparent present, no parent(s) present . . . . . . . . . . . . 1,006 133 2.5 26.6 77.4
Extended households6 . . . . . . . . . . . . . . . . . . . . . . . . . . . . . . . . . . . . . 7,203 352 18.0 18.8 70.4Other relatives only . . . . . . . . . . . . . . . . . . . . . . . . . . . . . . . . . . . . . . 5,125 298 12.8 17.6 70.6Other relatives and nonrelatives. . . . . . . . . . . . . . . . . . . . . . . . . . . 340 78 0.8 19.7 83.8Nonrelatives only . . . . . . . . . . . . . . . . . . . . . . . . . . . . . . . . . . . . . . . . 1,738 175 4.3 22.2 67.2
1 This number, when added to or subtracted from the estimate, represents the 90-percent confidence interval around the estimate.2 Based on the poverty status of the householder.3 Includes biological, step, adoptive, and foster parents of children under 18.4 These households include a stepparent and stepchild. The stepchild may be any age; however, at least one child under 18 is in the household.5 These households include an adoptive parent and adopted child. The adopted child may be any age; however, at least one child under 18 is in the
household.6 Extended households include those that contain a child under 18 who has a relative who is not his or her parent or sibling or who has a nonrelative
present.Note: Except for ‘‘parent and child present’’ plus ‘‘no parent and child,’’ percents may add to more than 100 percent since categories are not mutually
exclusive.Source: U.S. Census Bureau, Survey of Income and Program Participation, 2004 Panel, Wave 2.

extended households received pub-lic assistance (about 70 percent).Among extended households, 84 percent of those that includedchildren living with other relativesand nonrelatives received publicassistance.29
Historical Trends
Today’s family and household struc-tures may be placed in historicalcontext by comparing them withfamily and household structuressince the late nineteenth century.Based on decennial censuses for1880 through 1960 using data fromthe Integrated Public Use MicrodataSeries, Current Population Survey
18 U.S. Census Bureau
29 The percentage of households includ-ing other relatives and nonrelatives thatreceived public assistance does not differstatistically from the percentage of house-holds including a grandparent and grand-child that received public assistance.
data for 1968 through 1995, andSIPP data from the 1996, 2001, and2004 panels, Figure 6 presentslong-term trends in parent-childliving arrangements.30
The data from 1880 to 1970 showthat the distribution of children’sliving arrangements changed little.The proportion of children wholived without parents declinedfrom 6 percent in 1880 to about 3 percent in 1970. During thissame period, the proportion ofchildren who lived with their moth-ers only increased from 8 percent
30 Steven Ruggles and Matthew Sobek etal., Integrated Public Use Microdata Series:Version 2.0, Minneapolis: Historical CensusProjects, University of Minnesota, 1997—<www.ipums.umn.edu>. See Internet Table 2<www.census.gov/population/socdemo/child/p70-114/tab02.pdf> for additionalyears of data not included in Figure 4. For1880–1940, children in group quarters areincluded (1 percent or less of all children).
to 11 percent. Between 83 percentand 85 percent of children livedwith two parents during this entire period.
Major shifts in living arrangementsoccurred between 1970 and 1990,when the proportion of childrenliving only with their mother dou-bled from 11 percent to 22 per-cent. Since 1990, the changes inchildren’s living arrangements haveleveled off.
Source of the Data
The population represented (thepopulation universe) in the 2004Survey of Income and ProgramParticipation is the civilian noninsti-tutionalized population living in theUnited States. The SIPP is a longitu-dinal survey conducted at 4-monthintervals. The data in this reportwere collected from June through
0
10
20
30
40
50
60
70
80
90
100
2004199019801970196019501940193019201910190018901880
Figure 6. Historical Living Arrangements of Children: Selected Years, 1880 to 2004
Percent distributionNo parents
Two parents
Mother only
Father only
Source: 1880–1960: Integrated Public Use Microdata Series: Version 2.0 made available by the Historical Census Projects; 1968–1995: U.S. Census Bureau, Current Population Survey; 1996–2004: U.S. Census Bureau, Survey of Income and Program Participation, Wave 2. For 1880–1940, children in group quarters are included (1 percent or less of all children).

September 2004 in the second surveys, the wording of questions, More Informationwave (interview) of the 2004 SIPP. the review of the work of inter-
A copy of this report along withThe data come primarily from the viewers and coders, and the statis-
detailed tables is available on themain survey and the household tical review of reports.
Census Bureau’s Web site atrelationship topical module. The The Survey of Income and Program <www.census.gov>. Children’s datainstitutionalized population, which Participation weighting procedure can be accessed by clicking on theis excluded from population uni- uses ratio estimation, whereby “C” in the “Subjects A-Z” index,verse, is composed primarily of sample estimates are adjusted to selecting “Children” and thenpeople in correctional institutions independent estimates of the “Living Arrangements of Children.”and nursing homes (91 percent of national population by age, race, The previous reports based onthe 4.1 million institutionalized peo- sex, and Hispanic origin. This 2001 and 1996 data are also avail-ple in Census 2000). weighting partially corrects for able at this site.
bias due to undercoverage, butAlthough the main focus of the
biases may still be present when ContactsSIPP is information on labor forcepeople who are missed by the sur-
participation, jobs, income, and For additional living arrangementsvey differ from those interviewedparticipation in federal assistance or children’s family information,in ways other than age, race, sex,programs, information on other you may contact the Fertility andand Hispanic origin. How thistopics is also collected in topical Family Statistics Branch at 301-weighting procedure affects othermodules on a rotating basis. 763-2416. You may also contactvariables in the survey is not pre-
cisely known. All of these consider- the author of this report by e-mailAccuracy of the Data
ations affect comparisons across at <[email protected]>.Statistics from surveys are subject different surveys or data sources. to sampling and nonsampling User Comments
For further information on theerror. All comparisons presented in The Census Bureau welcomes thesource of the data and accuracy ofthis report have taken sampling comments and advice of users of
error into account and are signifi- the estimates, including standardits data and reports. If you have
cant at the 90-percent confidence errors and confidence intervals,any suggestions or comments,
level unless otherwise noted. This see <www.census.gov/sippplease write to:
means the 90-percent confidence /sourceac/2004sanda.pdf >
interval for the difference between or contact Stephen Mack of the Chief, Household and Housingthe estimates being compared Census Bureau’s Demographic Economic Statistics Divisiondoes not include zero. Statistical Methods Division U.S. Census Bureau Nonsampling errors in surveys may via e-mail at Washington, DC 20233be attributed to a variety of <[email protected]>.sources, such as how the survey or send an e-mail inquiry to:
Additional information on the was designed, how respondents <[email protected]>.
SIPP can be found at the followinginterpret questions, how able and
Web sites: Suggested Citationwilling respondents are to provide<www.sipp.census.gov/sipp/>
correct answers, and how accu- Kreider, Rose M. 2007. Living(main SIPP Web site),rately the answers are coded and Arrangements of Children: 2004.<www.sipp.census.gov/sippclassified. To minimize these Current Population Reports, /workpapr/wp230.pdf>, errors, the Census Bureau employs P70-114. U.S. Census Bureau,(SIPP Quality Profile), andquality control procedures during Washington, DC.<www.sipp.census.gov/sippall stages of the production/usrguide/sipp2001.pdf> process, including the design of(SIPP User’s Guide).
U.S. Census Bureau 19

U.S. Department of CommerceFIRST-CLASS MAILEconomics and Statistics Administration
POSTAGE & FEES PAIDU.S. CENSUS BUREAU U.S. Census BureauWashington, DC 20233 Permit No. G-58
OFFICIAL BUSINESS
Penalty for Private Use $300