livre blanc de la spectrométrie de masse introduction methods vulcanization is a cross-linking...
TRANSCRIPT

Livre blanc de la
Spectrométrie de MasseSpécial ASMS 2012
«Plus de 30 applications LC-MS/MS, GC-MS/MS, MALDI-TOF...»
©Shimadzu Corporation 2012

Fondé en 1875, Shimadzu est un groupe multinational japo-nais de 3 milliards de dollars côté à la bourse de Tokyo. Avec près de 10000 employé s dans le monde Shimadzu Corpora -tion regroupe trois activités principales : l’instrumentation ana-lytique et physique, le diagnostic médical et l’aéronautique. Présent dans plus de 100 pays, Shimadzu est un fabricant d’ins-trumentation analytique et d’équipement de contrôle environne-mental. En ef fet Shimadzu dispose d’une large gamme d’ins-truments analytiques : Chromatographie liquide et gazeuse, spectrométrie de masse, une gamme complète de Maldi, des robots de préparation, spectrométrie UV-Vis, FTIR, analyse élé-mentaire.
A propos de Shimadzu
Shimadzu Corporation confirme ses capacités d’innovation dans le domaine de la spectrométrie de masse Ultra Rapide en commercialisant simultanément un nouveau GCMS-TQ8030 Triple Quad et deux sys-tèmes LCMS Triple Quad (LCMS-8040 et LCMS-8080).Le lancement de ces trois systèmes pendant l’ASMS-2012 renforce le rôle joué par Shimadzu sur le marché mondial de la spectrométrie de masse. Appelée UFMS (Ultra Fast Mass Spectrometry), cette gamme conjugue haute sensibilité, excellente qua-lité des données et cycles ultra rapides.
Shimadzu, acteur mondial majeur en spectrométrie de masse
Shimadzu est aussi un fabricant mondial de machines de caractérisation de matériaux et d’essais méca-niques. En effet Shimadzu offre une large gamme de machines électromécaniques ou hydrauliques, sta-tiques ou dynamiques, de traction, compression, flexion, pelage, cisaillement fatigue…
Fondé en 1968 en Allemagne, Shimadzu Europe fourni des solutions analytiques aux scientifiques euro-péens. Aujourd’hui Shimadzu Europe représente plus de 9 filiales et 13 distributeurs répartis à travers l’Eu-rope dont Shimadzu France, filiale de plus de 65 personnes en forte croissance depuis sa création en 2002.

GCMS-TQ8030 : Système Triple Quadrupôle
• Mode SCAN / MRM pour éviter les faux positifs/négatifs• Gain x10 en sensibilité par rapport à la GCMS SQ• Permet de suivre 600 transitions MRM/s
LCMS-8030: Triple quadripôle ultra rapide
• Ultra rapide (jusqu’à 500 transitions MRM par seconde)• Cycles d’acquisition du signal ultra rapide (<2 ms)• Pas de compromis entre vitesse, sensibilité et robustesse
LCMS-8040: Encore plus de sensibilité
• Evolution du LCMS-8030 pour plus de sensibilité• Plateforme idéale pour les applications « Qual/Quant »,• Ultra rapide (jusqu’à 555 transitions MRM par seconde)
Spectromètres de masse Shimadzu utilisés dans ce livre
LCMS-IT-TOF: MSn à haute résolution
• Couplage unique Ion Trap - TOF• Haute résolution & précision de masse < 5 ppm• Changement de polarité 100 ms
LCMS-8080: Système LC-MS/MS le plus sensible
• Nouvelle source d’ionisation • Nouvelle interface qui réduit le bruit de fond chimique• Robustesse exceptionnelle

PAGE TECHN. APPLICATION5 LCMS-IT-
TOFDifferential Analysis in vulcanizing accelerators for rubber products by High mass Accuracy MSn and Multivariate Statistical Technique
10 LC-MS/MS Multi-component quantitative analysis of pharmaceuticals and personal care products in the environment by LC-MS/MS with fast polarity switching
16 LC-MS/MS Evaluation of the higher sensitive LC/MS/MS incorporates novel desolvation technologies to achieve low femto-gram LOQ
21 LC-MS/MS Multi-class pesticides analysis in challenging vegetable matrices using fast 5 msec MRM with 15 msec polarity switching
26 LC-MS/MS Exploring the application of a universal method for pesticide screening in foods using a high data acquisition speed MS/MS
31 LC-MS/MS Rapid and Highly Sensitive Quantitative Analysis and Screening of Aflatoxins in Foods Using Liquid Chromatography Triple Quadrupole Mass Spectrometry
39 LC-MS/MS High throughput analysis of anion surfactant using ultra-high speed LC-MS/MS and 1 mm inside diameter column
45 LC-MS/MS Simultaneous analysis of anionic, amphoteric and non-ionic surfactants using ultra-high speed LC-MS/MS
51 LC-MS/MS Screening analysis for drugs of abuse by LC-MS/MS enables fast polarity switching MRM triggered product ion scanning on the fly
57 GC-MS/MS Comprehensive Two-dimensional Gas Chromatograph Quadruple Mass Spectrometer for PlantMetabolite Analysis
62 LCMS-IT-TOF
Analysis of degradation products in electrolyte for rechargeable lithium-ion battery through high mass accuracy MSn and multivariate statistical technique
67 LCMS/MS Sensitive detection and quantification of hydrogen sulfide as a gasotransmitter by combi-ning monobromobimane-based derivatization to triple quadrupole LC/MS/MS
72 MALDI-TOF Metabolite maps reconstructed using a quantitative data by capillary electrophoresis-mass spectrometry (CE-MS)
77 LC-MS/MS Quantitative analysis of hydrophilic metabolite using ion-paring chromatography with a high-speed triple quadrupole mass spectrometer
83 LC-MS-IT-TOF
Analysis of trace amount of 17-β-Estradiol and its metabolites in aqueous samples using online-SPE and accurate MSn analysis
88 LCMS/MS Analysis of phthalate esters in environmental water samples by online-SPE-LC coupled with high-speed triple quadruple mass spectrometer
93 LC-MS/MS Development of an ion transmission enhanced tandem ion guide system for triple quadruple mass spectrometer
98 LC-MS/MS High Throughput Quantitative Analysis of Multi-mycotoxin in Beer-based Drinks using UH-PLC-MS/MS
104 DART/MS High throughput molecular weight confirmation of Pharmaceutical Compounds using DART MS analysis with ultra-fast polarity switching
110 DART/MS Componential analysis of pepper of various origins using DART-MS using ultra-fast polarity switching
116 LC-MS/MS Identification of the modified amino acid residue in the modified heme protein using LC/MS/MS
121 LC-MS/MS Identification of triazolam, etizolam and their metabolites in biological samples by liquid chromatography tandem mass spectrometry
127 LCMS-IT-TOF
Development of an LC-Based Metabolomic Approach for Polar Compounds in Brewage Samples using Fast Polarity Switching TOFMS Acquisition
134 MALDI-TOF Differentiation of isobaric residues in SPITC-derivatized tryptic peptides using MS/MS tech-nique in a Curved Field Reflectron.

Takahiro Goda, Hiroki Nakajima, Satoshi Yamaki,
Tsutomu Nishine, Masaru Furuta, Naoki Hamada
Shimadzu Corporation, Kyoto, JAPAN
Differential Analysis in vulcanizing accelerators for rubber products by High mass Accuracy MSn and Multivariate Statistical Technique
ASMS 2012 ThP21 - 455

2
Introduction
Methods
Vulcanization is a cross-linking reaction for forming bridges between individual polymer chains via addition of sulfur (Fig. 1). The purpose of vulcanization is to convert the rubber into a more durable material. In general, a reaction rate of vulcanization is increased by adding vulcanizing accelerator to mixture of rubber and sulfur.Each tire manufacturer employs one particular accelerator from among many commercially available reagents in order to meet set standards .Therefore, analyzing vulcanizing
accelerator compounds is a key stage in the tire manufacturing process, however, it is difficult to detect differences in similar structures when produced by different manufacturers. In this study we show differential analysis of similar structured sulfenamide-based vulcanizing accelerators (Fig. 2) produced by different manufacturers using high mass accuracy MSn and multivariate statistical technique.
Five N-(tert-butyl)-2-benzothiazole sulfenamide (NS; NS-1,
NS-2, NS-3, NS-4, NS-5) and five
N-cyclohexyl-2-benzothiazole sulfenamide (CZ; CZ-1, CZ-2,
CZ-3, CZ-4, CZ-5) were used in this study. Each NS and
each CZ were produced by different manufacturers.
Sample solutions were prepared at 100 mg/L dissolved in
tetrahydrofuran and acetonitrile. Equal amount of NS
solutions were mixed and used as a quality control (QC)
sample for NS analysis to identify robust and reproducible
ion signals. The QC sample for CZ analysis also was
prepared by the same method. LCMS measurement was
performed by LCMS-IT-TOF (Shimadzu Corporation, Kyoto,
Japan). SIMCA-P+ (Umetrics) and MetID Solution (Shimadzu
Corporation) were used for multivariate statistical analysis
and for searching structural analogues using MSn data
acquired by LCMS-IT-TOF measurement, respectively.
Formula Predictor (Shimadzu Corporation) was used for
predicting the formulae of characteristic compounds (Fig. 3).
Fig. 3 Work flow of the analysis of vulcanizing accelerators.
Fig. 2 Typical sulfenamide-based vulcanizing accelerators.
Differential Analysis in vulcanizing accelerators for rubber products by High mass Accuracy MSn and Multivariate Statistical Technique
Profiling Solution (SHIMADZU)
Automatic construction of peak matrixHigh mass accuracy MSn data
LCMS-IT-TOF (SHIMADZU)
Searching out statistical analogues
MetID Solution (SHIMADZU)
Formula prediction
Structural analogues of main compound which are characteristic to each sample
Multivariate analysis
SIMCA-P+ (Umetrics)
Formula Predictor(SHIMADZU)
cross-linking point
N-(tert-butyl)-2-benzothiazole sulfenamide
N, N'-Dicyclohexyl-2-benzothiazolyl sulfenamide
N-cyclohexyl-2-benzothiazole sulfenamide
N-Oxydiethylene-2- benzothiazole sulfenamide
polymer chains
vulcanizationvulcanization
N
S
S NH
N
S
S NH CH3
CH3
CH3
N
S
S NN
S
S N O

3
Differential Analysis in vulcanizing accelerators for rubber products by High mass Accuracy MSn and Multivariate Statistical Technique
Results and discussionAs a result of principal component analysis (PCA) for NS, the groups of each sample type were located at the different sites on the score plot (Fig. 4a) showing that they were comprised of different components. The unique peaks of each sample were observed on the loading plot (Fig. 4b). Candidates of the structural analogues of NS were
identified using unique peaks based on fragment ions and neutral losses (Fig. 5).The extracted ion chromatograms (EICs) suggested that these were characteristic components of each sample (Fig. 6). By the same method, each sample of CZ was identified as containing characteristic components.
Table 1 LCMS analytical conditions.
Fig. 4 Result of PCA for NS (a: score plot, b: loading plot). Fig. 6 EICs of characteristic peaks of each samples.
Fig. 5 Analysis window of MetID Solution.
Column Flow rate Column temperature Mobile phaseA Mobile phaseB Time program Injection volume
Ionization modeProbe voltage CDL temperature BH temperature Nebulizing gas flow Drying gas pressureScan range
: Shim-pack XR-ODS (2.0 mmI.D.x75 mmL、 2.2 mm) : 0.45 mL/min : 40°C: water containing 5 mmol ammonium acetate: acetonitrile : 0%B(0 min) – 100%B(9 – 12 min) – 0%B(12.01 – 15 min) :1 mL
: ESI(+) : 4.5kV : 200°C : 200°C : 1.5 L/min : 0.1 MPa : m/z 100 - 1000
0.0 0.5 1.0 1.5 2.0 2.5 3.0 3.5 4.0 4.5 5.0 5.5 6.0 6.5 7.0 7.5 8.0 8.5 9.0 9.5 10.0 10.5 11.0 11.5 min0.00
0.25
0.50
0.75
1.00
1.25
1.50
1.75
2.00
(x100,000,000)
0.0 0.5 1.0 1.5 2.0 2.5 3.0 3.5 4.0 4.5 5.0 5.5 6.0 6.5 7.0 7.5 8.0 8.5 9.0 9.5 10.0 10.5 11.0 11.5 min0.00
0.25
0.50
0.75
1.00
1.25
1.50
1.75
2.00
(x100,000,000)
0.0 0.5 1.0 1.5 2.0 2.5 3.0 3.5 4.0 4.5 5.0 5.5 6.0 6.5 7.0 7.5 8.0 8.5 9.0 9.5 10.0 10.5 11.0 11.5 min0.00
0.25
0.50
0.75
1.00
1.25
1.50
1.75
2.00
(x100,000,000)
0.0 0.5 1.0 1.5 2.0 2.5 3.0 3.5 4.0 4.5 5.0 5.5 6.0 6.5 7.0 7.5 8.0 8.5 9.0 9.5 10.0 10.5 11.0 11.5 min0.00
0.25
0.50
0.75
1.00
1.25
1.50
1.75
2.00
(x100,000,000)
0.0 0.5 1.0 1.5 2.0 2.5 3.0 3.5 4.0 4.5 5.0 5.5 6.0 6.5 7.0 7.5 8.0 8.5 9.0 9.5 10.0 10.5 11.0 11.5 min0.00
0.25
0.50
0.75
1.00
1.25
1.50
1.75
2.00
(x100,000,000)
507.0859 (25.00) 372.0657 (50.00) 404.0403 (25.00) 253.0828 (25.00)
358.1076 (10.00) 300.9922 (25.00) 183.9885 (50.00) 271.0569 (50.00) TIC (1.00)
NS -1
NS -2
NS -3
NS -4
NS -5
No. 1
No. 7
No. 3
No. 5
No. 6
507.0859 (25.00) 372.0657 (50.00) 404.0403 (25.00) 253.0828 (25.00)
358.1076 (10.00) 300.9922 (25.00) 183.9885 (50.00) 271.0569 (50.00) TIC (1.00)
507.0859 (25.00) 372.0657 (50.00) 404.0403 (25.00) 253.0828 (25.00)
358.1076 (10.00) 300.9922 (25.00) 183.9885 (50.00) 271.0569 (50.00) TIC (1.00)
507.0859 (25.00) 372.0657 (50.00) 404.0403 (25.00) 253.0828 (25.00)
358.1076 (10.00) 300.9922 (25.00) 183.9885 (50.00) 271.0569 (50.00) TIC (1.00)
507.0859 (25.00) 372.0657 (50.00) 404.0403 (25.00) 253.0828 (25.00)
358.1076 (10.00) 300.9922 (25.00) 183.9885 (50.00) 271.0569 (50.00) TIC (1.00)
-18000000
-16000000
-14000000
-12000000
-10000000
-8000000
-6000000
-4000000
-2000000
0
2000000
4000000
6000000
8000000
10000000
12000000
14000000
16000000
18000000
-25000000 -20000000 -15000000 -10000000 -5000000 0 5000000 10000000 15000000 20000000 25000000
t[2]
t[1]
NS_1000ppm_20110901_01.M1 (PCA-X)t[Comp. 1]/t[Comp. 2]
R2X[1] = 0.566677 R2X[2] = 0.270169 Ellipse: Hotelling T2 (0.95)
nsa01nsa02
nsa03
nsb04nsb05nsb06 nsc07
nsc08
nsc09nsd10nsd11
nsd12
nse13nse14nse15
nsmix16nsmix17nsmix18
NS-2
NS-1
NS-3 NS-4
NS-5
QA/QC
a
-0.2
-0.1
-0.0
0.1
0.2
0.3
0.4
0.5
0.6
0.7
0.8
-0.2 -0.1 -0.0 0.1 0.2 0.3 0.4 0.5 0.6 0.7 0.8
p[2]
p[1]
NS_1000 ppm_20110901_01.M1 (PCA-X)p[Comp. 1]/p[Comp. 2]Colored according to model terms
R2X[1] = 0.566677 R2X[2] = 0.270169
100.063100.071100.081100.101100.09100.091100.108100.11100.119100.114100.11100.998101.049101.069101.052101.069101.073101.109102.038105.035107.056107.059107.061107.074107.968107.998108.007108.002108.009108.009108.014108.014108.051108.077108.071108.076108.993109.003109.009109.101110.012111.055111.061111.114111.116112.038112.044112.049112.053112.05112.049112.056112.089112.113113.045113.097113.137114.079114.082114.086115.023115.043115.057115.061115.064115.074115.103115.114115.122115.117116.044116.054116.053116.061116.058116.067117.08117.099118.046118.057118.085118.088119.055119.061119.085119.082119.098120.074120.075121.021121.059121.089121.099121.097121.995121.996122.01122.026122.059122.097123.001123.017123.061123.08124.028124.027124.036124.038124.046124.072124.077124.081124.085124.093124.093125.088125.087125.112126.062126.069127.039127.047127.047127.069127.058127.062127.072127.07127.078128.046128.045128.051128.058128.064128.076128.077128.094129.046129.054129.059129.062129.086129.1130.036130.046130.049130.061130.063130.076130.083130.098130.093130.093130.106130.135130.157130.151130.16130.166131.053131.059131.089131.102132.037132.055132.055132.102132.101132.103132.114132.987132.993132.998133.053133.052133.056133.066133.061133.062133.063133.071133.07133.076133.081133.085133.095133.104134.006134.075135.039135.097135.122136.021136.02
136.021136.021136.031136.044136.062136.065136.057136.067136.08136.109136.097137.018137.058137.057137.064137.086137.096138.065138.055138.061138.097138.11138.123138.141138.144139.025139.048139.049139.047139.085139.075139.08139.108139.122139.118139.115139.141139.137140.001140.005140.014140.016140.035140.101140.963141.072141.07141.089141.079141.1141.09141.109141.123141.121141.124141.126141.983141.986142.087142.099142.101142.108143.048143.06143.048143.059143.063143.061143.069143.072143.077143.077143.082143.125143.127144.001143.996144.068144.068144.07144.069144.1144.956144.979144.981144.98144.984145.075145.059145.079145.082145.08145.077145.073145.083145.085145.083145.12145.108145.111145.113145.12145.12145.131145.122145.132146.067146.08146.099146.101146.101146.974146.985146.984146.987147.096147.077147.073147.101147.1147.111147.112148.044148.094148.113148.124149.019149.017149.018149.028149.027149.033149.028149.025149.082149.075149.072149.086149.098149.109149.109149.12149.123149.145150.053150.072150.087150.092150.089150.118150.118150.128150.14151.03151.026151.026151.046151.058151.081151.096151.096151.113151.117152.013152.034152.045152.05152.051152.052152.06152.05152.057152.119152.131153.008152.998152.999153.019153.021153.086153.095153.133153.132153.142153.995154.001154.006154.067154.078154.091154.08154.08154.083154.093155.082155.07155.083155.083155.101155.113155.967155.982156.041156.058156.074156.073156.085156.1156.099156.112156.118157.084157.079157.066157.074157.074157.09157.093157.088157.096157.093157.117157.098157.127157.133157.136157.133157.143157.138157.144157.993158.078158.097158.101158.105158.114158.118158.125158.154158.189159.047159.097159.091159.109159.107159.132159.969161.111161.112162.06162.079162.097162.114162.124163.043163.047163.08163.077163.093163.1163.112163.123163.117163.133163.136163.132163.135163.134164.089164.095164.115164.119165.049165.05165.05165.058165.054165.068165.077165.079165.1165.099165.091165.104165.119165.115165.119165.124165.133165.979165.97165.978166.067166.083166.066166.103166.112166.116166.115166.98166.988166.983166.986167.03167.043167.064167.067167.077167.087167.09167.105167.109167.13167.13167.155167.986167.979167.995167.987167.989167.991168.053168.084168.096168.092168.122168.111168.127168.14168.148168.97168.984169.077169.084169.09169.099169.112169.104169.11169.11169.142170.072170.093170.085170.115170.125170.129171.078171.085171.084171.106171.122171.111171.11171.112171.156171.151171.15171.148171.14171.151171.156171.152171.147171.166171.173172.086172.089172.08172.092172.105172.109172.119172.111172.114172.131172.134172.128172.152172.151172.149172.161172.171173.071173.074173.105173.095173.122173.126173.152173.149173.984173.995174.036174.046174.053174.102174.095174.095174.133175.035175.04175.078175.09175.084175.111175.111175.111175.116175.122175.135176.026176.024176.056176.105176.125176.127176.115176.13176.144176.942177.056177.074177.061177.068177.114177.097177.121177.117177.107177.129177.124177.145178.028178.031178.068178.101178.122178.126178.128178.132178.154178.156178.168178.177178.17179.051179.074179.083179.095179.124179.111179.124179.117179.124179.127179.121179.142179.146179.161180180.041180.084180.083180.076180.086180.095180.107180.096180.096180.108180.121180.12180.158180.134180.158180.158180.171180.174180.176180.984180.983180.993181.027181.039181.036181.096181.099181.128181.125181.125181.15181.165181.166181.217181.229181.971181.973181.978181.998182.02182.044182.081182.093182.082182.095182.124182.123182.133182.147182.143182.19182.192182.742182.991183.008183.011183.077183.079183.091183.12183.092183.119183.12183.134183.151183.128183.144183.196183.198183.203183.259183.803
183.989183.98183.995184.012184.012184.064184.07184.111184.131184.34184.994185.001185.008185.003185.012185.028185.011185.02185.045185.083185.097185.109185.123185.131185.133185.135186.054186.075186.076186.094186.133186.129186.143186.979187.061187.074187.109187.085187.122187.139187.138188.039188.055188.044188.059188.089188.097188.104188.129188.13188.137188.14188.148188.149188.193189.045189.053189.054189.055189.115189.125189.124189.137189.135189.144189.153190.055190.054190.079190.075190.122190.119190.126190.126190.117190.13190.16190.951191.055191.08191.092191.084191.115191.096191.123191.111191.108191.136191.149191.164191.176191.991192.095192.107192.127192.12192.116192.133192.132192.137192.177192.173192.17193193.089193.087193.092193.104193.103193.122193.111193.132193.137193.131193.142193.146193.147193.149193.152193.169193.158194.023194.04194.107194.092194.106194.104194.119194.116194.123194.119194.124194.138194.135194.132194.173195.035195.074195.081195.098195.09195.087195.12195.12195.119195.122195.135195.146195.151196.005196.019196.018196.057196.08196.089196.099196.125196.132196.14196.151196.147196.136196.147196.159196.161196.983197.023197.082197.094197.097197.11197.123197.129197.134197.161197.199198.007198.038198.065198.065198.105198.109198.123198.12198.193198.952198.999198.997199.005199.003199.002199.002199.006199.008199.017199.019199.035
199.094199.094199.104199.122199.105199.178199.184199.178199.175199.182199.206199.631199.985200.005200.012200.009200.029200.05200.08200.083200.074200.127200.13200.118200.105200.12200.159200.16200.135200.147200.157200.158200.166200.193201.012201.063201.058201.131201.165202.072202.072202.071202.085202.109202.134202.135202.148202.169202.193202.992203.029203.059203.079203.108203.111203.107203.139203.132203.158203.162204.001204.065204.093204.08204.089204.085204.089204.111204.118204.098204.128204.154204.167204.172204.99205.087205.067205.085205.096205.085205.077205.087205.101205.103205.115205.142205.154205.164206.051206.062206.066206.067206.121206.148206.146206.141206.15206.151206.162206.175206.175206.191206.987207.007206.998207.006207.008207.011207.087207.095207.097207.115207.123207.12207.129207.146207.164207.154207.171207.153207.17207.184207.194207.198207.982208.002208.008208.014208.014208.085208.086208.122208.113208.126208.134208.132208.15208.124208.152208.182209208.984208.987208.996209.012209.025209.111209.116209.12209.143209.142209.142209.149209.167209.166209.193210.075210.103210.107210.104210.132210.107210.139210.161210.146210.149210.181210.166210.169210.177210.199210.942210.988211.053211.111211.124211.113211.129211.123211.131211.15211.148211.188212.083212.114212.134212.142212.144212.157212.928212.94212.957213.085213.096213.089213.091213.101213.093213.107213.108213.107213.12213.128213.121213.14213.153213.191213.191214.064214.119214.111214.137214.168214.177214.992214.992214.995215.091215.093215.101215.097215.104215.116215.13215.136215.16215.181
215.977215.976216.059216.071216.09216.105216.105216.122216.157217.104217.083217.12217.104217.15217.127217.17217.15217.156217.144217.158217.186217.182217.187217.974218.003218.104218.11218.106218.106218.142218.149218.162218.172218.193218.163218.183218.177218.177218.198218.191219.028219.098219.121219.102219.123219.12219.132219.129219.158219.156219.174219.191219.191219.198219.212220.066220.08220.109220.108220.094220.097220.108220.122220.127220.152220.155220.162220.155220.179221.016221.024221.055221.063221.085221.077221.113221.078221.117221.164221.158221.162222.047222.087222.072222.108222.105222.137222.121222.137222.118222.132222.153222.162222.178222.217223.036223.048223.064223.091223.098223.108223.083223.096223.095223.148223.147223.16223.17224.024224.042224.064224.065224.07224.086224.122224.136224.132224.173225.02225.037225.101225.084225.093225.09225.094225.14225.132225.128225.118225.149225.164225.177225.179
225.194
225.195225.203225.214226.004226.037226.043226.092226.141226.156226.169226.178226.183226.219226.221227.052
227.064
227.094227.063227.071227.091227.118227.124227.14227.146227.956228.062228.089228.113228.112228.105228.143228.16228.166228.184228.183228.192228.187228.19228.232228.227228.266228.956
229.019229.06229.062229.089229.093229.124229.142229.148229.172229.194230.068230.089230.109230.132230.123230.154230.149230.138230.139230.179230.167230.196230.21230.956231.073231.07231.091231.113231.1231.113231.142231.117231.157231.158232.057232.077232.132232.142232.144232.137232.163232.178232.199232.969 233.004233.015233.028233.086
233.111
233.127233.123233.144233.145233.995234.026234.068234.085234.138234.132234.135234.131234.176234.176234.187234.949235.001235.114235.125235.124235.114235.126235.156235.147235.174235.155235.167235.173235.195235.185235.21235.229236.014236.016236.021236.004236.012236.008236.024
236.02
236.02
236.024236.009236.023236.032236.026236.026236.03236.062236.098236.11236.126236.15236.163236.171236.995237.002237.027237.024237.052237.056237.109237.124237.127237.142237.136237.15237.18237.192238.034238.021238.019238.023238.059238.082238.077238.077238.109238.112238.148238.139238.186238.637238.775238.841238.961238.983239.146239.193239.216239.962239.96240.004240.017240.068240.069240.073240.073240.169240.168240.167240.174240.174240.192240.207240.218240.303240.372240.917240.983240.981240.986241.06241.06241.069241.131241.13241.159241.165241.186241.176241.182241.193241.182241.187241.194241.209241.26241.343242.063242.07242.076242.086242.101242.102242.164242.202242.18242.195243.067243.063243.084243.083243.095243.09243.11243.122243.133243.149243.135243.158243.163243.165243.195243.207243.202244.065244.095244.111244.126244.123244.159244.172244.183244.199244.215244.238245.08245.099245.101245.117245.122245.161245.174245.187245.208245.21245.234245.233246.063246.079246.096246.087246.101246.108246.106246.129246.137246.141246.167246.179246.165246.181246.186246.201246.21247.019247.021247.089247.114247.152247.144247.18247.178247.176247.186247.193247.203247.204248.065248.101248.144248.14248.159248.157248.171248.19248.187248.212249.083249.107249.081249.1249.129249.139249.148249.168249.201249.201249.211249.208249.209249.213249.502250.097250.12250.123250.174250.202250.17250.178250.179250.191250.195251.128251.135251.128251.155251.159251.175251.185251.174251.181251.186251.277251.968252.013252.026252.092252.084252.084252.105252.101252.12252.126252.161252.16252.191252.202252.204252.206252.956252.999253.044253.029253.057253.065253.07
253.082
253.088253.1253.105253.112253.111253.13253.133253.134253.15253.148253.161253.178253.169253.166253.926253.942253.995
254.031
254.029253.994254.012254.032254.018254.01254.052254.048254.037254.059254.083254.171254.174254.205254.225254.224254.905254.933254.951255.031255.029255.035
255.062
255.049255.054255.062255.072255.087255.076255.149255.189255.195255.2255.236255.946255.953255.967255.986255.994256.01256.063256.079256.097256.177256.191256.189256.267256.268256.258257.069257.077257.075257.084257.107257.114257.119257.155257.162257.155257.16257.179257.189257.191257.196257.258257.281258.027258.035258.077258.102258.101258.107258.146258.155258.161258.224258.224258.216258.236258.983259.008259.037
259.036259.034259.043259.071259.12259.156259.198259.935259.963260.04260.063260.075260.102260.171260.173260.186260.95260.962261.026261.019261.037261.081261.092261.122261.128261.117261.133261.148261.148261.166261.169261.195261.211261.214261.229262.048262.084262.146262.146262.165262.172262.188262.192262.206263.022263.018263.066263.069263.068263.09263.09263.113263.109263.139263.136263.152263.157263.203263.229263.247264.072264.074264.087264.088264.133264.145264.186264.172264.224264.197264.227264.229264.226264.242264.992265265.083
265.083
265.082265.163265.204265.233265.234265.233265.233265.369265.951266.028266.092266.187266.227266.206266.236266.234266.231266.237266.472266.998267.095267.083267.111267.089267.136267.143267.154267.15267.186267.165267.167267.228267.184267.21267.209267.242267.252267.252267.267267.246267.244267.26267.262267.997268.055268.06268.093268.065268.075268.1268.1268.106268.109268.095268.105268.13268.132268.178268.182268.17268.198268.217268.974268.995269.017269.018
269.028269.02269.019269.099269.088269.082269.152269.167269.132269.166269.199269.192269.217269.216269.26269.255269.257269.953270.001270.018269.998270.023270.027270.029270.032270.053270.136270.168270.174270.188270.188270.2270.207270.202270.233270.248270.977270.977271.005271.01
271.038271.029
271.056
271.057
271.057271.058
271.099271.117271.131271.148271.159271.147271.146271.161271.167271.228271.214271.225271.254271.934271.963271.97272.103272.105272.129272.142272.161272.151272.157272.184272.19272.188272.237272.269272.959273.01273.051273.094273.125273.112273.185273.199273.238273.977274.035274.041274.092274.204274.187274.938275.06275.133275.175275.155275.16275.181275.193275.191275.236275.254275.268275.929275.938275.953276.031276.035276.077276.147276.24276.24276.272276.922277.078277.053277.083277.1277.085277.161277.197278.07278.12278.108278.124278.155278.194278.188278.2278.206278.224278.237278.239278.252278.252279.074279.095279.094279.099279.092279.096279.137279.124279.13279.159279.138279.147279.161279.26279.421279.942280.005280.049280.091280.091280.095280.158280.157280.168280.169280.17280.265280.255280.275280.966281.064
281.079
281.151281.114281.11281.118281.118281.127281.151281.224281.232281.254281.233281.232281.245281.26281.28282.111282.105282.121282.169282.223282.224282.219282.224282.231282.234282.25282.247282.28282.257282.287282.298283.035283.035283.082283.141283.164283.173283.187283.183283.198283.196283.211283.261283.263283.268283.266284.041284.063284.09284.134284.122284.156284.192284.212284.219284.245284.243284.245284.289284.286284.293284.307284.931284.963
285.02
285.036285.054
285.13285.077285.124285.156285.125285.142285.168285.165285.179285.204285.197285.188285.188285.215285.223285.225285.24285.275286.018
286.016
286.019
286.051286.061286.065286.098286.124286.13286.179286.159286.147286.185286.168286.179286.229286.246286.244286.988286.977287.077287.082287.085287.127287.143287.163287.192287.204287.222287.236287.247287.256287.251288.051288.097288.113288.127288.132288.146288.161288.16288.164288.19288.252288.221288.25288.249288.263288.276288.981288.996289.081289.104289.1289.14289.159289.169289.189289.211289.205289.253289.241289.245289.242289.261289.251289.254290.103290.154290.16290.183290.168290.176290.199290.25290.252290.908291.008291.027291.031291.079291.105291.105291.126291.152291.195291.228291.217291.918291.917291.99291.992292.007292.03292.105292.134292.124292.159292.18292.202292.242292.249292.247292.263292.289292.904292.903292.923292.915293.069293.083293.103293.123293.133293.133293.149293.16293.176293.18293.192293.227293.215293.249293.901293.971293.975293.963294.02294.102294.119294.18294.168294.217294.204294.222294.221294.242294.265294.277294.91294.912294.967294.979295.076295.091295.127295.123295.166295.181295.156295.207295.181295.221295.185295.215295.189295.229295.239295.226295.236295.241295.238295.982296.074296.096296.097296.115296.158296.185296.205296.198296.214296.213296.228296.228
297.063
297.081297.146297.159297.126297.168297.181297.158297.198297.238297.225297.236297.245297.239297.252297.265297.963297.997298.063298.104298.117298.126298.144298.197298.179298.217298.251298.259298.971299.06299.097299.102299.149299.17299.156299.189299.176299.18299.205299.197299.239300.109300.182300.186300.22300.253300.269300.304300.303300.99
300.991
300.995 300.99
300.993
300.993300.996301.049301.102301.146301.135301.156301.149301.158301.168301.188301.226301.244301.24301.295301.995302.045302.023302.039302.034302.164302.133302.165302.167302.228302.279302.986303.024303.029303.062303.104303.168303.202303.228303.238303.245303.995303.99303.989304.044304.034304.071304.066304.087304.121304.145304.142304.18304.175304.174304.171304.171304.192304.203304.224304.239304.248304.258305.009305.019305.025305.103305.109305.113305.142305.159305.242305.243305.242305.247305.271305.277305.276305.293306.131306.168306.162
306.271
306.263306.265306.267306.265306.534307.082307.142307.155307.21307.26307.259307.243307.26307.271307.262307.269307.277307.295307.999
308.002307.993308.092308.084308.12308.162308.193308.182308.206308.205308.232308.238308.263308.262308.261308.268308.957309.119309.092309.109309.145309.184309.176309.188309.209309.193309.226309.211309.229309.234309.239309.243309.255309.275310.016310.018310.026310.089310.126310.134310.158310.147310.181310.172310.203310.198310.211310.225310.249310.268310.279310.276310.307311.149311.118311.152311.148311.169311.192311.239311.238311.275311.972311.996311.999312.161312.203312.207312.235312.238312.237312.242313.093313.133313.128313.137313.169313.205313.187313.215313.236313.254313.258313.899313.973314.1314.131314.136314.185314.201314.201314.215314.205314.222314.245314.263314.258314.266314.239314.285314.307314.902314.972315.018315.07315.085315.098315.104315.159315.126315.15315.158315.158315.172315.178315.193315.209315.961316.061316.118316.108316.163316.182316.189316.214316.249316.269316.283316.987316.995317.063317.076317.109317.146317.138317.176317.183317.241317.922317.947318.076318.096318.12318.158318.145318.177318.187318.167318.193318.179318.205318.215318.261318.264318.284319.005319.002319.026319.017319.034319.075319.086319.117319.122319.138319.15319.207319.227319.247319.26319.997320.081320.161320.16320.169320.184320.274320.232320.252320.269321.094321.192321.182321.18321.197321.262321.236321.248321.258321.247321.268321.272321.95322.096322.149322.173322.23322.267322.303322.995322.991323.073323.125323.152323.179323.169323.211323.195323.245323.242323.261323.292323.28323.278323.269323.279324.07324.079324.126324.126324.126324.159324.227324.231324.254324.246324.253324.269324.277324.286324.298325.074325.102325.145325.145325.172325.163325.177325.183325.202325.214325.232325.232325.29325.286325.291325.294325.315325.914326.085326.133326.131326.176326.202326.223326.255326.237326.259326.274326.276326.301327.008327.038327.061327.088327.075327.077327.117327.09327.099327.147327.194327.154327.172327.231327.222327.238327.291327.283328.112328.165328.153328.212328.214328.245328.248328.248328.295328.296328.322328.932328.998328.992329.005329.08329.1329.104329.132329.152329.151329.16329.19329.26329.274329.944330.151330.159330.177330.167330.184330.289330.937330.946330.954330.978331.076331.095331.16331.186331.213331.247331.261331.273331.987332.14332.199332.187332.233332.276332.301332.82332.857332.873332.961
332.964332.967332.967333.099333.275333.973334.214334.92334.936334.951334.974334.967335.124335.163335.165335.183335.197335.213335.241335.223335.24335.243335.905335.934335.933335.963336.093336.111336.218336.224336.205336.22336.957337.135337.207337.236337.25337.224337.274337.288337.932337.946338.051338.139338.213338.255338.257338.266338.257338.279338.921338.898338.924338.934339.009339.146339.147339.154339.154339.19339.214339.263339.279339.273339.587340.032340.025340.067340.086340.102340.118340.148340.153340.164340.176340.274340.286340.279340.9340.942341.029341.073341.098341.14341.193341.201341.184341.214341.241341.261341.286341.292341.286341.288341.304341.303341.931342.043342.026342.031342.099
342.111342.143342.142342.156342.226342.286342.261342.295342.275342.29342.315343.037343.115343.126343.121343.133343.131343.169343.203343.211343.225343.232343.253343.235343.288343.312343.314343.301343.305343.309343.647344.026344.02344.043344.083344.077344.107344.109344.109344.169344.214344.22344.296344.306344.303344.318344.322345.109345.173345.172345.19345.208345.223345.239345.257345.249345.322346.098346.154346.146346.167346.176346.191346.196346.214346.212346.236346.229346.254346.229346.274346.285346.299346.976346.98346.977346.98347.104347.127347.145
347.158
347.172347.194347.247347.247347.265347.311347.953347.979348.109348.134348.165348.174348.227348.278348.267348.303348.957348.936348.955349.073349.111349.159349.163349.196349.212349.205349.216349.229349.267349.297349.949349.954350.168350.203350.221350.221350.272350.239350.25350.246350.257350.28350.324350.293350.296350.31350.32350.877350.948351.116351.162351.137351.137351.157351.2351.229351.235351.242351.256351.263351.301351.319351.941351.948351.96352.122352.144352.162352.198352.246352.262352.253352.278352.298352.27352.341352.345352.335352.624352.879352.911352.908352.931353.135353.139353.167353.249353.255353.259353.248353.278353.259353.282353.264353.326353.338353.346353.34353.365353.909353.96353.951354.08354.097354.126354.126354.219354.248354.25354.252354.251354.299354.307354.288354.289354.938355.059355.072355.082355.086355.099355.178355.227355.179355.196355.269355.27355.278355.277355.275355.297355.934355.94355.966355.964355.959356.169356.179356.196356.22356.22356.269356.254356.259356.259356.29356.328356.953357.094357.095357.083357.128357.146357.192357.187357.188357.237357.305357.938357.927357.936357.947
358.107
358.104358.092358.108358.145358.157358.21358.201358.283358.255358.287359.121359.181359.183359.203359.184359.207359.239359.293359.281359.301359.314359.307359.327360.071360.135360.248360.251360.256360.273360.301360.904361.105361.103361.131361.159361.196361.224361.211361.245361.243361.266361.244361.251361.311361.304361.312361.273361.318361.313361.31362.081362.099362.24362.272362.3362.261362.289362.338362.92362.927362.934363.09363.147363.281363.273363.267363.294363.259363.286363.317363.281363.906364.119364.159364.214364.264364.279364.283364.281364.269364.29364.296364.342364.348365.115365.178365.168365.192365.185365.225365.205365.201365.208365.269365.305365.298365.29366.097366.114366.129366.167366.177366.201366.216366.211366.233366.255366.267366.308366.299366.314366.983367.085367.116367.184367.198367.219367.232367.241367.232367.29367.324367.323367.965368.134368.145368.16368.172368.177368.202368.213368.207368.271368.253368.278368.286368.322368.886369.145369.206369.184369.245369.221369.238369.259369.289369.269369.314369.351369.906369.961370.08370.143370.206370.221370.215370.247370.297370.316370.307370.321370.306370.89370.915370.972370.975371.001371.061371.102371.102371.102371.106371.205371.209371.212371.254371.247371.274371.253371.333371.288371.309371.251371.317371.298371.317371.329371.323371.949371.945371.961371.984372.064372.067372.095372.091372.112372.192372.245372.222372.884372.958372.942373.086373.09373.116373.15373.152373.175373.211373.231373.226373.223373.22373.266373.279373.277373.303373.952373.943374.073374.1374.103374.11374.119374.19374.18374.212374.24374.254374.31374.862375.063375.09375.09375.117375.178375.167375.196375.211375.24375.263375.242375.304375.337375.896375.951376.061376.101376.083376.155376.232376.256376.271376.284376.339377.085377.13377.167377.2377.235377.307377.308377.31377.899377.902377.93378.167378.237378.3378.255378.318378.315378.333378.336378.333378.914378.941378.981379.167379.235379.275379.305379.313379.271379.331379.316379.312379.886379.941380.191380.249380.949381.08381.136381.115381.169381.177381.163381.213381.214381.229381.288381.306381.302381.332381.352382.064382.195382.233382.232382.281382.317382.949383.137383.166383.218383.301383.989384.128384.129384.175384.181384.182384.288384.294384.305385.117385.141385.227385.226385.229385.321385.34385.331385.993386.091386.161386.197386.241386.272386.238386.261386.267386.332386.348386.991387.086387.172387.171387.208387.24387.278387.309388.061388.133388.134388.19388.199388.25388.281388.29388.282388.286388.34388.88388.886388.943388.963388.962388.994389.176389.196389.216389.218389.256389.255389.273389.283389.294389.321389.306389.9389.92389.978390.018390.064390.179390.246390.303390.282390.35390.926390.916390.944390.969391.092391.181391.171391.203391.22391.283391.283391.308391.874391.939391.954391.941391.978392.023392.14392.285392.287392.293392.299392.298392.314392.302392.299392.332392.362392.549392.578393.106393.119393.166393.27393.292393.285393.251393.251393.25393.296393.315393.324393.301393.319393.912393.947394.218394.213394.237394.256394.301394.328394.277394.345394.341394.341394.357394.364394.356394.887394.899395.18395.184395.218395.242395.292395.284395.283395.341395.35396.199396.266396.221396.293396.313396.882396.894396.906397.056397.275397.277397.21397.289397.288397.29397.298397.307397.321397.894397.899398.073398.079398.08
398.073398.157398.277398.264398.293398.298398.318398.378398.375398.894398.895399.079399.165399.207399.227399.275399.289399.263399.292399.247399.322399.35399.358399.359400.075400.121400.204400.215400.247400.287400.3400.325400.964401.002401.158401.248401.211401.254401.21401.263401.235401.27401.26401.284401.275401.31402.015402.058402.169402.185402.249402.264402.276402.33403.216403.166403.242403.271403.269403.232403.268403.3403.349403.613403.955403.968403.979404.036
404.039
404.037404.036
404.191404.197404.258404.275404.286404.27404.274404.324404.908404.953404.958404.969405.035
404.969405.026405.027405.043405.185405.275405.271405.36405.938405.962406.034405.987406.026406.038
406.179406.181406.223406.287406.941407.036407.036407.077407.119407.165407.255407.33407.928407.931408.287408.286408.309408.334408.361409.219409.237409.294409.289409.329410.134410.247410.252411.186411.224411.26411.301411.966411.976412.149412.142412.178412.194412.21412.225412.224412.223412.243412.261412.261412.263412.283412.326412.921413.115413.182413.265413.274413.277413.312413.919413.963414.063414.22414.221414.269414.262414.279414.323
414.352414.94414.945415.151415.187415.243415.22415.249415.287415.313415.296415.312415.939416.162416.169416.164416.239416.28416.304416.318416.916416.945416.94417.036417.128417.178417.196417.257417.272417.278417.399418.138418.231418.242418.236418.238418.259418.278418.284418.996418.999
419.174419.158419.264419.261419.261419.265419.267419.264419.294419.319419.709419.898419.983420.007420.033420.035420.276420.264420.276420.312420.304420.35420.993421.176421.162421.251421.268421.275421.306421.316421.344421.994422.01422.151422.227422.28422.284422.298422.285422.327422.263422.328422.344422.97423.031423.243423.216423.215423.272423.271423.32423.346423.961424.011424.198424.201424.243424.308424.286424.319424.31424.356424.921424.951425.198425.213425.236425.211425.24425.272425.269425.272425.29425.337425.358425.379425.929425.936425.94425.932425.986425.957426.014426.044426.145426.212426.204426.223426.211426.245426.25426.282426.275426.31426.949427.175427.254427.237427.232427.276427.286427.291427.312427.31427.945428.16428.205428.236428.281428.242428.294428.283428.33428.389428.878428.967428.98428.99428.997429.011429.216429.246429.256429.265429.281429.264429.285429.96429.982429.961430.052430.056
430.055430.056430.232430.238430.884430.967430.943
430.947
430.943431.046431.22431.235431.235431.233431.317431.315431.958432.212432.222432.22432.266432.284432.269432.293432.315432.852432.985433.238433.258433.265433.304433.904433.946433.998434.208434.251434.229434.253434.304434.339434.358435.012435.131435.138435.139435.183435.259435.248435.27435.272435.384
436.006
436.025436.024436.335436.301436.253436.249436.261436.333436.347436.302436.341436.358436.368436.359436.361436.404436.885436.897437.027437.181437.263437.223437.257437.282437.346437.308437.356437.381437.878438.128438.269438.307438.341438.388439.002439.209439.29439.307439.322439.329440.234440.268440.311440.316441.124441.266441.317441.309441.326441.322442.025442.168442.189442.253442.318442.346443.012443.274443.178443.249443.246443.287444.005444.067444.285444.305444.325445.057445.117445.119445.116445.207445.275445.24445.98445.999445.995446.052446.119446.198446.249446.283446.275446.3446.323446.859446.993447.116447.234447.237447.245447.272
447.976
448.3448.29448.306448.348449.003449.225449.241449.25449.34449.875449.999450.269450.333450.947451.019451.219451.25451.27451.379452.008452.188452.327452.273452.317452.4453.179453.261453.93454.284454.286454.303454.295455.274455.304455.979456.302456.317456.967457.281457.299457.309458.262
458.344
458.326458.821459.194459.209459.264459.263459.294460.296460.315461.193461.267461.26461.265461.286461.292461.999462.217462.274462.28462.381462.956463.128463.27463.262463.316464.128464.371464.372464.384465.137465.269465.303465.958465.961465.964465.96465.989466.321466.244466.266466.337466.297466.265466.35466.346466.411467.244467.996467.957468.003468.293468.338468.936469.169470.285470.345470.345470.935471.226471.245472.217472.357472.366472.905473.278473.355474.076474.232474.232474.272474.287474.301474.337475.085475.241475.236475.297475.366475.862475.859476.244476.283476.306477.23477.283478.213478.241478.302479.262479.359479.864479.965479.98480.158480.32480.328480.832480.84481.162481.222481.232481.221481.271481.314481.334481.949482.224482.274482.318482.401484.233484.279484.269485.276485.329485.347485.356486.357487.106487.226487.202487.218487.292487.979488.203488.232488.244488.233489.131489.128489.226489.305490.854491.231491.205491.209491.216492.062492.838492.863493.138493.227493.27493.301494.048
494.319494.443496.038496.056496.21496.243496.254496.413496.444496.98497.255497.928497.939
497.93
497.934
497.95498.069498.085498.096498.248498.275498.27498.936499.156499.928500.243500.935500.942501.215501.928501.947502.214
502.372
502.35502.851502.905503.189503.268503.918503.971505.033505.189505.267505.397506.07506.286
507.083
507.069507.086507.246507.3507.379507.872508.258508.854508.872509.873510.083510.439510.885510.856511.075512.119512.363512.362512.404512.834514.372514.421514.859514.863515.357515.848515.858516.281516.378516.348516.412517.395519.148519.305520.306522.245523.076523.089523.223523.348524.071524.352524.863525.27526.271526.871527.042527.052527.407527.902529.368529.382529.903529.911531.324532.072
532.1
532.106532.391533.108533.392534.05535.108535.471535.699536.071536.294537.052537.145537.21537.267538.319539.053539.061539.412540.056540.448540.484541.043542.323542.323542.844544.394546.105546.274
546.393
546.367546.391546.395546.42546.868547.921548.287548.731548.922549.41551.012552.875553.036553.239553.859554.175
554.276554.468554.849554.866555.18556.173556.406556.436557.947558.128559.22560.41563.07563.352563.356563.367563.41564.363564.337565.102568.038568.392568.882569.305571.294571.454571.918572.28573.178573.265573.302573.376573.389574.323574.337575.346575.794576.407576.424579.426581.034581.88582.315582.828583.039583.808584.475585.006588.327588.338588.869589.313589.411589.723590.323590.296
590.417
590.419590.432591.323591.323591.457593.289593.444593.855594.825598.016600.978
601.446601.85601.968602.841602.844602.977603.25603.383603.97604.43604.455604.843604.856605.007605.443605.828606.014609.275611.402612.424615.453619.115619.753620.453623.462625.084625.893626.362628.197628.489629.197630.196633.421634.069634.308
634.447
634.454637.505638.233638.783639.31641.331642.244642.769645.464646.331647.273648.451651.562651.594652.311652.324652.356654.348657.284662.949
663.09665.921667.449667.484667.765667.903670.38677.449677.953
678.477
678.476679.454680.308680.816682.264691.325691.598692.49693.494697.069702.212703.219704.214705.223706.344706.361712.299721.613721.802
722.503
722.527724.221724.37724.373725.335725.537726.25727.357730.3735.652738.371758.432758.455766.535
785.332785.35796.424797.395807.542808.752810.558
810.572812.614812.6812.62812.625812.626812.667813.62813.661814.594814.609814.63826.612826.61836.761854.58855.583855.607856.366856.376856.407876.374898.609899.616942.638944.641962.639962.652962.663963.652963.656963.637964.655964.648964.675964.656964.676
SIMCA-P+ 12.0.1 - 2011-09-07 06: 13:54 (UTC+9)
SIMCA-P+ 12.0.1 - 2011-09-07 06:15:37 (UTC+9)
NS-2
NS-1
b

4
The formula of peak No. 7 (Fig.6) of NS-2 was predicted as C12H16N2S2. Considering MSn spectra and neutral loss ions, it was determined that peak No. 7 has the structure of NS with addition of –CH2 to the phenyl group (Fig. 7). We also
determined the structures of other characteristic compounds and thought to be either impurities or by-products in the process of synthesis.
Fig. 7 MSn spectra of NS (left) and peak No. 7 (right) detected from NS-2 sample (see Fig. 6).
Table 2 Predicted formulae and structures of characteristic components of NS (left) and CZ (right).
ConclusionDifferences in similar structured sulfenamide-based vulcanizing accelerators were identified from different manufacturers with characteristic components of each sample detected using high mass accuracy MSn and multivariate statistical techniques. The structural analogues of main compounds were
detected using MSn data analysis software (MetID Solution).Formulae and structures of the analogues were assigned using Formula Predictor software.The impurities detected from each sulfenamide-based vulcanizing accelerator differed from manufacture to manufacture.
AcknowledgementWe wish to thank Dr. Fumito Yatsuyanagi and Ms.Yuko Sekine of THE YOKOHAMA RUBBER CO.,LTD. for supplying the samples and their constructive comments.
Differential Analysis in vulcanizing accelerators for rubber products by High mass Accuracy MSn and Multivariate Statistical Technique
No. R.T. (min)
Predicted formula and structure
ions
Sample Measured value (m/z )
Theoretical value (m/z)
Error (ppm)
1 5.62
C11H14N2O2S 2
271.0567 271.0569 -0.74 1
2 6.35
C7H5NOS 2
183.9887 183.9885 1.09 4
3 6.48
C14H8N2S 3
300.9923 300.9922 0.33 3
4 6.50 C15H23N3OS3 358.1062 358.1076 -3.91 2
5 6.72
C11H14N2O2S 2
271.0582 271.0569 4.80 4
6 7.52 C14H8N2S 3
300.9921 300.9922 -0.33 5
7 7.58
C12H16N2S 2
253.0831 253.0828 1.24 2
8 8.48 C14H17N3O5S 2 404.0399 404.0403 -0.99 4 9 8.85 C18H17N3S 3 372.0647 372.0657 -2.69 4
10 9.17 C18H26N4O5S 4 507.0850 507.0859 -1.77 4
No. R.T. (min)
Predicted formula and structure
ions
Sample Measured value (m/z)
Theoretical value (m/z)
Error (ppm)
1 3.62 C10H17NO3
200.1280 200.1281 -0.50 4
2 4.78 C11H11NO2S 2 254.0308 254.0304 1.57 4
3 5.07 C11H11NO4S 2
286.0207 286.0202 1.75 4
4 6.25 C13H10N2S 227.0628 227.0637 -3.96 4
5 6.83
C11H14N2S 2(NS)
239.0671 239.0671 0.00 1
6 7.30
C14H8N2S 4
332.9648 332.9643 1.50 4
7 8.25 C30H49N3O 468.3956 468.3948 1.71 1
8 8.31
C12H12N2O5S
297.0533 297.0540 -2.36 4
9 8.36
C14H18N2S 2
279.0985 279.0984 0.36 1
10 8.90 C24H25N3OS 4 500.0950 500.0953 -0.3 4
50 100 150 200 300 350 400 450 500 550 600 650 700 750 800 850 900 950 m/z0.0
1.0
2.0
3.0
4.0
5.0
6.0
7.0Inten. (x1,000,000)
239.0666(1)
183.00 332.9620(1) 459.2364(1)
50 100 15 250 300 350 400 450 500 550 600 650 700 750 800 850 900 950 m/z0.0
1.0
2.0
3.0
4.0Inten. (x1,000,000)
183.0042
9.0664(1)
50 100 150 200 250 300 350 400 450 500 550 600 650 700 750 800 850 900 950 m/z0.00
0.25
0.50
0.75
1.00
1.25
Inten. (x1,000,000)
165.9778
7.0053
50 100 150 200 250 300 350 400 450 500 550 600 650 700 750 800 850 900 950 m/z0.0
0.5
1.0
1.5
Inten. (x100,000)
122.0045
90.0369
50 100 150 200 300 350 400 450 500 550 600 650 700 750 800 850 900 950 m/z0.0
1.0
2.0
3.0
4.0
5.0
Inten. (x1,000,000)
341.2860(1)
239.0663(1)420.0319(1)253.0830(1)
118.0851 569.2763(1)
50 100 150 200 250 300 350 400 450 500 550 600 650 700 750 800 850 900 950 m/z0.00
0.25
0.50
0.75
1.00
Inten. (x1,000,000)
17 . 3
50 100 150 200 250 300 350 400 450 500 550 600 650 700 750 800 850 900 950 m/z0.0
0.5
1.0
1.5
Inten. (x100,000)
136.0212
147.0128
92.4451
50 100 150 250 300 350 400 450 500 550 600 650 700 750 800 850 900 950 m/z0.0
0.5
1.0
1.5
2.0Inten. (x1,000,000)
197.021
17
MS1
MS2
MS3
MS4
C11H15N2S 2+
NL :-56
NL :-17
NL :-44
:-56
NL :-17
NL :-44
N
S
S NH CH3
CH3
CH3
CH3
150000000000 0 20
212 NN
C7H7N2S 2+
C7H4NS 2+
C6H4NS +
N
S
S NH CH3
CH3
CH3
N
S
S NH CH3
CH3
CH3
N
S
S NH CH3
CH3
CH3
N
S
S NH CH3
CH3
CH3
N
S
S NH CH3
CH3
CH3
N
S
S NH CH3
CH3
CH3
N
S
S NH CH3
CH3
CH3
CH3
CH3
CH3
MS1
MS2
MS3
MS4
OH× 2
N
S
S NH CH3
CH3
CH3
OH× 2 N
S
S NH CH3
CH3
CH3
CH3
N
S
S NH CH3
CH3
CH3
+O
N
S
S H
+C7H3NS
N
S
S H
+C7H3NS
N
S
S H
N
S
S NH CH3
CH3
CH3
+C4H6O4S
N
S
+C7H3NS 2
N
S
S H
+C7H7NO5
N
S
N
S
S NH
CH3
+C4H5NO3

For Research Use Only. Not for use in diagnostic procedures.The content of this publication shall not be reproduced, altered or sold for any commercial purpose without the written approval of Shimadzu. The information contained herein is provided to you "as is" without warranty of any kind including without limitation warranties as to its accuracy or completeness. Shimadzu does not assume any responsibility or liability for any damage, whether direct or indirect, relating to the use of this publication. This publication is based upon the information available to Shimadzu on or before the date of publication, and subject to change without notice.
© Shimadzu Corporation, 2012
First Edition: May, 2012
www.shimadzu.com/an/

Natsuyo Asano, Kiyomi Arakawa, Shinjiro Fujita,
Kazuo Mukaibatake, Ichiro Hirano SHIMADZU
CORPORATION, Kyoto, Japan
Multi-component quantitative analysis of pharmaceuticals and personal care products in the environment by LC-MS/MS with fast polarity switching
ASMS 2012 MP22-532

2
IntroductionPharmaceuticals and personal care products (PPCPs) constitute a group of emerging contaminants which have received considerable attention in recent years. Monitoring of PPCPs in the environment is vital as many of these compounds are ubiquitous, persistent and biologically active with recognised endocrine-disruption functions. Given the hazardous nature of these compounds, there is a need to provide fast and sensitive multi-residue methods
that are able to analyze multiple classes of compound within one analytical procedure. Here we report a new multi-residue UHPLC-ESI-QqQ method that utilizes fast polarity switching with an optimized chromatographic gradient that removes matrix effects and results in excellent ng/L detection levels. Furthermore, we have evaluated the performance of polarity switching in comparison to dedicated single polarity experiments.
Materials and MethodsNatural river and lake water was collected from the Shiga region (Japan) and spiked, without any sample
pre-treatment, at a range of concentration levels (1 – 10000 ng/L) with 15 PPCPs.
A higher sensitivity triple quadruple mass spectrometer (LCMS-8080, Shimadzu, Japan) operating in SRM mode
with fast polarity switching (20 msec) was used for the detection of positively and negatively charged analytes.
Table 1. Analytical conditions.
UHPLC
LC system:
Analysis Column:
Mobile Phase A:
Mobile Phase B:
Gradient Program:
Flow rate:
Column Temperature:
Injection Volume:
MS
MS system:
Ionization:
Nebulizing Gas Flow:
Curtain Gas Flow:
Heating Gas Flow:
Probe Temperature :
HSID Temperature :
Nexera (Shimadzu, Japan)
Shim-pack XR-ODSIII (2.0 mmI.D. x 50 mmL., 1.6 µm)
0.1% Formic acid - Water
Acetonitrile
0%B (0-6 min) – 80%B (16 min) – 100%B (16.01-18 min) – 0%B (18.01-21 min)
0.4 mL/min
40°C
40 µL
LCMS-8080 (Shimadzu, Japan)
ESI (positive/negative)
3.00
3.50
12.00
450°C
300°C
Multi-component quantitative analysis of pharmaceuticals and personal care products in the environment by LC-MS/MS with fast polarity switching

3
ResultsAnalysis of PPCPs spiked in environmental water
Fig. 1 Gradient program of LC.
Table 2 MRM mode parameters and analysis results for each PPCPs.
As a result of the complex matrix in which PPCPs are present, the occurrence of ion suppression/enhancement can reduce MS/MS detection limits. For this reason, an optimized gradient was developed that focused target
analytes at the head of the chromatographic column while allowing the interfering environmental matrix to be eluted (Fig. 1).
All compounds were measured by SRM with fast polarity switching (20 msec) for multi-component analysis. Excellent limits of quantification were achieved in the range 1 – 50 ng/L for nearly all studied compounds, with outstanding
linearity (R2 > 0.999). The analysis results of 15 PPCPs are shown in Table 2, Fig. 2 shows calibration curves for three selected PPCPs: Carbamazepine, Albeterol and Ibprofen.
Before the organic phase was increased, the aqueous mobile phase held at 100% for 6min.
Albuterol
Acetaminophen
Trimethoprim
Sulfamethoxazole
Carbamazepine
Dehydronifedipine
Naproxen
Antipyrine
Doxycycline
Isopropylantipyrine
Warfarin
Ibuprofen
Gemfibrozil
Triclocarban
Triclosan
pos
pos
pos
pos
pos
pos
pos
pos
pos
pos
pos
neg
neg
neg
neg
neg
240.20>148.20
152.10>110.30
291.20>230.20
254.00>92.30
237.10>194.20
345.20>284.10
231.10>185.20
189.00>56.20
445.00>428.00
231.00>189.00
309.00>163.00
307.00>161.20
205.30>161.40
249.30>121.30
313.10>160.20
287.00>34.90
5
50
5
25
1
5
10
10
100
2.5
5
25
50
25
25
50
LOQ (ng/L)TransitionPolarityCompound
River Lake River Lake
%Recoery (100 ng/L)
5
50
25
50
2.5
25
25
25
50
5
10
50
50
50
25
100
148
80
143
104
94
97
99
106
79
103
86
91
106
114
120
105
112
87
118
76
68
75
76
82
56
82
60
103
87
77
98
74
Multi-component quantitative analysis of pharmaceuticals and personal care products in the environment by LC-MS/MS with fast polarity switching

4
(a) Carbamazepine (b) Albuterol
(a) Polarity Switching: 20 ms (b) Non-polarity Switching
(c) Ibprofen
Fig. 2 Calibration curves for Carbamazepine (a), Albeterol (b) and Ibprofen (c); (a) was spiked in river water, (b) and (c) were spiked in lake water.
Fig. 3 Comparison of polarity switched analysis (a) and non-polarity switched analysis (positive only or negative only analysis) (b).
Multi-component quantitative analysis of pharmaceuticals and personal care products in the environment by LC-MS/MS with fast polarity switching
Polarity SwitchingTo evaluate the capability of polarity switching the data quality obtained was compared to dedicated positive or negative analysis. Data quality obtained during polarity switching experiments was directly comparable to that achieved during dedicated
positive or negative analysis (Fig. 3). Long term stability was investigated by making 100 injections over 10 hours. Polarity switching data indicates excellent stability over the analysis time (Fig. 4, Table 3).
Fig. 4 Results for area variation across the 100 serial analyses.
0.0 25.0 50.0 75.0 Conc. (ng/L) 0
2.0
4.0
6.0
8.0 1 – 100 ng/L
R2 = 0.9996
0 250 500 750 Conc. (ng/L) 0
0.5
1.0
1.5
2.0
2.5
3.0
Area (×100,000) Area (×100,000) Area (×100,000)
5 – 1000 ng/L
R2 = 0.9994
0 1000 2000 3000 4000 Conc. (ng/L) 0
0.25
0.50
0.75
1.00
1.25
1.50
1.75 50 – 5000 ng/L
R2 = 0.9999
1.50 2.00 2.50 3.00 min 0
5.0
10.0
15.0 ×104 ×104 ×104
Inte
nsi
ty
1: Carbamazepine (pos)
2: Dehydronifedipine (pos)
3: Gemfibrozil (neg)
4: Triclocarban (neg)
1.50 2.00 min 0
5.0
10.0
15.0
Inte
nsi
ty
1: Carbamazepine (pos) 2: Dehydronifedipine (pos)
2.75 3.00 min 0
5.0
10.0
15.0
Inte
nsi
ty
3: Gemfibrozil (neg)
4: Triclocarban (neg)
0
0.5
1.0
1.5
2.0
2.5
3.0
0 20 40 60 80 100 Injection
Are
a
Carbamazepine
Dehydronifedipine
Gemfibrozil
Triclocarban
100 injections (10hours)

5
Table 3 Analysis results for respective compounds.
CarbamazepineDehydronifedipine
GemfibrozilTriclocarban
posposnegneg
237.10 > 194.20345.20 > 284.10249.30 > 121.30313.10 > 160.20
2.703.943.103.52
Transition %RSDPolarityCompound
ConclusionOptimization of the LC gradient program resulted in the reduction of matrix effect and the recoveries of 70 – 120 % for almost all studied compounds.Using LCMS-8080, excellent sensitivity and linearity were obtained for PPCPs spiked in environmental water samples.
Fast polarity switching results were shown to be comparable to dedicated single polarity experiments for the analysis of PPCPs in environmental samples.
Multi-component quantitative analysis of pharmaceuticals and personal care products in the environment by LC-MS/MS with fast polarity switching

For Research Use Only. Not for use in diagnostic procedures.The content of this publication shall not be reproduced, altered or sold for any commercial purpose without the written approval of Shimadzu. The information contained herein is provided to you "as is" without warranty of any kind including without limitation warranties as to its accuracy or completeness. Shimadzu does not assume any responsibility or liability for any damage, whether direct or indirect, relating to the use of this publication. This publication is based upon the information available to Shimadzu on or before the date of publication, and subject to change without notice.
© Shimadzu Corporation, 2012
First Edition: May, 2012
www.shimadzu.com/an/

Shinjiro Fujita, Natsuyo Asano, Kazuo Mukaibatake
SHIMADZU CORPORATION, Kyoto, JAPAN
Evaluation of the higher sensitive LC/MS/MS incorporates novel desolvation technologies to achieve low femto-gram LOQ
ASMS 2012 ThP26-566

2
IntroductionThe triple quadrupole mass spectrometer is widely used in various application fields to quantify the trace amount of compounds because of excellent sensitivity and selectivity. In order to exceed the low femto-gram barrier, many researchers have been developing new desolvation technologies at either ESI sprayer or MS inlet. In this paper we present the development novel
desolvation devices coupled to a highly sensitive triple quadrupole mass spectrometer utilizing a coaxial hot gas ion source and the heated multi-orthogonal interface (Hot Source Induced Desolvation: HSID) mounted at the inlet of mass spectrometer. The combination of the coaxial hot gas and the HSID enhanced desolvation efficiency which resulted in low femto-gram limit of quantitation.
Methods7 commercially available drug samples (Verapamil, Alprazolam, Carbamazepine, Cilostazol, Lidocaine, Fluticasone and Testosterone) were prepared for the sensitivity evaluation of LCMS-8080 triple quadrupole mass spectrometer (Shimadzu Corporation, Japan) equipped with coaxial hot gas and HSID interface. All samples were analyzed by the Multiple Reaction Monitoring (MRM). MRM parameters including MRM transitions and collision energy as well as compound dependent ion transfer voltages were optimized through automatic MRM optimization functionality incorporated in LabSolution software (Shimadzu Corporation, Japan). The temperatures of
coaxial hot gas and HSID were optimized for each sample. Chromatographic separations were carried out on a Nexera MP system (Shimadzu Corporation, Japan) using a Shim-pack XR-ODSIII (50 mmL.× 2.0 mmI.D., 1.6 mm).
functionality incorporated in LabSolution software (Shimadzu Corporation, Japan). The temperatures of
High temperature gas blowing around the electro spray coaxially achieves highly efficient desolvation and accelerates ionization, resulting in larger volumes of ions introduced into the mass spectrometer.
Noise derived from neutral species or unwanted ions are strongly reduced in the multi orthogonal region which is heated to a high temperature and achieves excellent signal to noise ratio.
Evaluation of the higher sensitive LC/MS/MS incorporates novel desolvation technologies to achieve low femto-gram LOQ
Fig. 1 LCMS-8080 triple quadrupole mass spectrometer. Fig. 2 Coaxial hot gas and HSID.
Coaxial Hot Gas
HSID (Hot Source Induced Desolvation)
Coaxial hot gas (<500 degrees C)
Ionization Probe
HSID
Multi Orthogonal
Heated atHigh Temperature(<300 degrees C)

3
ResultsMRM chromatogram for verapamil at 0.5 fg/ µL. Extremely high sensitivity has been achieved with the lower limit of detection in the region of below femto-gram level.
Coaxial Hot GasHSIDMobile phase AMobile phase BFlow rate
: 500 degrees C: 280 degrees C: 5mM Annmonium acetate-water: Acetonitrile: 0.5 mL/min
MRM chromatogram for testosterone, a type of steroid. At 2 fg/ µL, at the LOQ region, the RSD is 4.34% for 6 repeated analysis.
Coaxial Hot GasHSIDMobile phase AMobile phase BFlow rate
Coaxial Hot GasHSIDMobile phase AMobile phase BFlow rate
: 450 degrees C: 240 degrees C: 0.1 % formic acid - water: Acetonitrile: 0.4 mL/min
MRM chromatogram for 3 drugs at 5 fg/ µL. In each case, the area repeatability (RSD) was less than 6%, a low noise level has been achieved, and with excellent selectivity, the LOQ is several femto-gram or less.
: 500 degrees C: 280 degrees C: 5mM Annmonium acetate-water: Acetonitrile: 0.4 mL/min
5 fg/uL
Verapamil 0.5 fg/ μL m/z 455.50 > 165.10 S/N = 16
Testosterone 2fg/ μL m/z 289.10 > 97.00 4.34 %RSD (Area, n=6)
Lidocaine m/z 235.10>86.20 Carbamazepine m/z 237.10>194.00 Cilostazol m/z 370.10>288.00
5 fg/ μL
Fig. 3 MRM chromatograms at lower concentration.
Table 2 ynamic range, linearity (R2) and Area %RSD for each compound
Compounds Dynamic Range (fg/ µL) R2 Area %RSD
Verapamil
Alprazolam
Carbamazepine
Cilostazol
Lidocaine
Fluticasone
Testosterone
0.5-200,000
2-100,000
2-20,000
2-50,000
5-50,000
5-200,000
2-20,000
0.9995
0.9998
0.9999
0.9999
0.9996
0.9999
0.9997
0.08-10.70
1.78-7.92
0.93-6.54
0.42-12.38
0.36-8.10
0.39-18.63
0.40-4.34
Evaluation of the higher sensitive LC/MS/MS incorporates novel desolvation technologies to achieve low femto-gram LOQ

4
With cilostazol calibration curves, an extremely good linearity value of R2 = 0.9999 was obtained across a dynamic range from 2 fg/ µL to 50,000 fg/ µL. In addition,
even at low concentrations, a relative error under 10 % and RSD under 15 % were achieved.
Using LCMS-8080 equipped with coaxial hot gas and HSID, low femto-gram LOQs were achieved for all 7 drugs (Verapamil, Alprazolam, Carbamazepine, Cilostazol,
Lidocaine, Fluticasone and Testosterone) delivering excellent linearity of R2 > 0.999 across wide range from low to high concentrations.
Conclusions
Evaluation of the higher sensitive LC/MS/MS incorporates novel desolvation technologies to achieve low femto-gram LOQ
Concentration, ×103 fg/ µL 0 10 20 30 40 50
0
2.0
4.0
6.0
8.0
10.0 Cilostazol
m/z 370.10>288.00
0.002 - 50 ng/ mL
R2 = 0.9999
Table 3 Relative Error (RE) and Area %RSD for each concentration of Cilostazol.
Fig. 4 Calibration curves for Cilostazol.
Perared Concentration x103 fg/ µL
Measured Concentration x103 fg/ µL
Rerative Error (RE) %
Area %RSD (N=5)
0.002
0.005
0.05
0.2
0.5
5
20
50
0.0021
0.0048
0.049
0.20
0.50
4.99
20.09
49.93
5.89
-3.76
-1.62
-1.35
-0.20
-0.24
0.43
-0.14
12.38
5.03
2.78
1.47
1.46
0.42
0.93
0.57

For Research Use Only. Not for use in diagnostic procedures.The content of this publication shall not be reproduced, altered or sold for any commercial purpose without the written approval of Shimadzu. The information contained herein is provided to you "as is" without warranty of any kind including without limitation warranties as to its accuracy or completeness. Shimadzu does not assume any responsibility or liability for any damage, whether direct or indirect, relating to the use of this publication. This publication is based upon the information available to Shimadzu on or before the date of publication, and subject to change without notice.
© Shimadzu Corporation, 2012
First Edition: May, 2012
www.shimadzu.com/an/

Yuka Fujito1, Yusuke Inohana2, Kiyomi Arakawa2,
Ichiro Hirano2 1Shimadzu Analytical & Measuring Center, Inc.,
Kyoto, Japan ; 2Shimadzu Corporation, Kyoto, Japan
Multi-class pesticides analysis in challenging vegetable matrices using fast 5 msec MRM with 15 msec polarity switching
ASMS 2012 WP27-575

2
IntroductionMany regulatory authorities have established multi-class residual pesticides methods for the analysis of vegetables, fruits and other food stuffs. There is, however no global agreement on the provision of a target list of pesticides and this presents a risk with products moving between different regulatory requirements. In order to eliminate this risk, food safety laboratories need to ideally screen as many compounds as possible in a single run which may reach
maximum residual limits (MRL); typically 10 ppb in food matrices. In this study, we report the application of ultra-fast 5 msec MRM with 15 msec polarity switching for the analysis of 138 pesticides in vegetable matrices (72 and 66 compounds measured by LC-QqQ and GC-QqQ in the European Union Reference Laboratory (EURL) method) .
Materials and Methods
Multi-class pesticides analysis in challenging vegetable matrices using fast 5 msec MRM with 15 msec polarity switching
Sample Preparation (QuEChERS EU method) LC/MS/MS analysis
Vegetables
Paprika (Sweet pepper)Leek (Garlic chives)
Origin
New ZealandJapan
ColumnMobile phase
Gradient program
Flow rateColumn temperature
IonizationIon spray voltageMRM
: Shim-pack XR-ODSII (75 mm x 2 mmI.D., 2.2 um): A ; 2 mM ammonium formate containing 0.1% formic acid – water B ; Methanol: 5% B (0-2.5 min.)→55% B (2.51-6 min.)→80% B (6.01-12 min.) →100% (12-15 min.)→5% (15.01-20 min.): 0.2 mL / min.: 40°C
: ESI (Positive / Negative): +4.5 kV / -3.5 kV: 276 MRM transitions (2 MRMs / compound) Dwell time 5 msec. / Pause time 1 msec.
Food sample Analytical Conditions
Features of LCMS-8040
HPLC : Nexera UHPLC system
MS : LCMS-8040 Triple quadrupole mass spectrometer
Step 1 : Sample Extraction
1. Homoginize vegetables with food processor and homoginizer
2. Weigh 10 g homoginized sample
Add 10 mL acetonitrile
Add Salt-mixture*1
・4 g MgSO4
・1 g NaCl ・0.5 g Na2H citrate ・1.5H2O ・1 g Na3 citrate ・2H2O
Extract 13. Shake vigorously by hand 1 min.
4. Centrifuge for 5 min. at 4000 rpm (Extract 1)
*1 : Citrate Extraction Tube (SIGMA ALDRICH)
Add 200 uL acetonitrile
1
3
4
Step 2 : Sample Clean up
5. Transfer 6 mL Extract 1 into Dispersive SPE tube*2
6. Shake vigorously by hand 2 min.
YellowPaprika
RedPaprika
containing ・ 900 mg MgSO4
・ 150 mg PSA ・ 45 mg ENVI-Carb
Leek
Extract 2
*2 : PSA/ENVI-Carb SPE Clean Up Tube 2 (SIGMA ALDRICH) Fig. 1 LCMS-8040 Triple Quadrupole Mass Spectrometer
7. Centrifuge for 5 min. at 3000 rpm (Extract 2)
8. Transfer 1 mL Extract 2 into a vial
9. Vortex sample to mix it
10. Filtrate sample with disposable filter
6
7
8
5 times higher sensitivity compared to LCMS-8030An ultra fast scan speed of 15000 u / sec.An ultra fast polarity switching of 15 msec.An ultra fast MRM transition speed of 555 ch./ sec.
LCMS-8040Ultra Fast Mass Spectrometer

3
ResultsMRM of pesticide standards
Compounds for LC-QqQ Compounds for GC-QqQ
Multi-class pesticides analysis in challenging vegetable matrices using fast 5 msec MRM with 15 msec polarity switching
Technique(on the EURL method)
by LC-QqQby GC-QqQ
LOQs < 10 ppb LOQs > 10 ppb Not Ionization
72 (100%)47 (71%)
0 (0%)6 (9%)
0 (0%)13 (20%)
Table 1 LOQs of 138 pesticides in the EURL method by LCMS-8040
Fig. 2 Calibration curves and MRM chromatograms of typical pesticides
・ 71 % of pesticides measured by GC-QqQ in the EURL method could achieved excellent LOQs (0.08-10 ppb) .
1-1000 ppbr2=0.9999
S/N 38 (1ppb)
S/N 82 (1ppb)
S/N 73 (1ppb)
S/N 73 (1ppb)
1-1000 ppbr2=0.9992
1-1000ppbr2=0.9999
1-1000ppbr2=0.9996
0 500 Conc. 0.0
1.0
2.0
3.0
4.0
5.0
6.0
7.0
8.0
9.0
Area (x10,000,000)
Azoxystrobin Carbofuran Ethion Methidathion
0 500 Conc. 0.00
0.25
0.50
0.75
1.00 Area (x100,000,000)
0 500 Conc. 0.0
2.5
5.0
7.5
Area (x10,000,000)
0 500 Conc. 0.0
2.5
5.0
7.5
Area (x10,000,000)
5.0 6.0
0.0
0.5
1.0
1.5
2.0 (x100,000)
0.00
0.25
0.50
0.75
1.00
1.25
1.50
1.75
2.00 (x100,000)
9.0 10.0 6.0 7.0
0.00
0.25
0.50
0.75
1.00
1.25
1.50
1.75
(x100,000)
6.0 7.0
0.00
0.25
0.50
0.75
1.00
1.25
1.50
1.75
2.00 (x100,000)
1 ppb
5 ppb
10 ppb

4
Fig. 3 Recovery of pesticides in the vegetable matrices (5 ppb spiked)
Recovery of pesticides in vegetable matrices
Multi-class pesticides analysis in challenging vegetable matrices using fast 5 msec MRM with 15 msec polarity switching
Approximately 90% of pesticides represented good recoveries in the range of 70-120% in all studied matrices.Some pesticides indicating up to 120% of recovery were also detected in the matrix blank (Fig. 4).
Azoxystrobin
5 ppb standards spikedMatrix blank
Imidacloprid Clothianidin
Azoxystrobin8.19 ppb3.77 ppb
5 ppm
Imidacloprid8.99 ppb3.19 ppb
3 ppm
Clothianidin21.39 ppb25.78 ppb
15 ppm
Fludioxonil556.58 ppb550.92 ppb
10 ppm
Fig. 4 MRM Chromatograms and quantitative results of 4 pesticides
5ppb standards spikedMatrix blankMRL (Japan)
ConclusionMRL of pesticide in vegetable matrices pre-treatment by QuEChERS method could be measured successfully using fast 5 msec MRM with 15 msec polarity switching.
Majority of pesticides being suggested to GC-QqQ technology on the EURL method was successfully covered by LC-QqQ.
Azoxytrobin
Imidacloprid
Kresoxim -methyl
Trichlorfon
Dichlorvos Flutriafol
Triacloprid
Recovery (%)
0
20
40
60
80
100
120
140
160
180
200
220
240
▲
(out of range)
Fludioxonil Clothianidin
▲ (622 %)
(11439 %)
■ Red paprika
◆ Yellow paprika
▲ Leek
Fludioxonil6.5 7.0 7.5
0
50000
100000
150000
200000
250000
300000
3.5 4.0 4.5
0
10000
20000
30000
40000
50000
60000
70000
80000
3.5 4.0 4.5
0
2500
5000
7500
10000
12500
15000
17500
20000
6.0 6.5 7.0
0
25000
50000
75000
100000
125000
150000

For Research Use Only. Not for use in diagnostic procedures.The content of this publication shall not be reproduced, altered or sold for any commercial purpose without the written approval of Shimadzu. The information contained herein is provided to you "as is" without warranty of any kind including without limitation warranties as to its accuracy or completeness. Shimadzu does not assume any responsibility or liability for any damage, whether direct or indirect, relating to the use of this publication. This publication is based upon the information available to Shimadzu on or before the date of publication, and subject to change without notice.
© Shimadzu Corporation, 2012
First Edition: May, 2012
www.shimadzu.com/an/

Ichiro Hirano1 Yuka Fujito2, Kiyomi Arakawa1,
Yusuke Inohana1 1Shimadzu Corporation, Kyoto, Japan, 2Shimadzu Analytical & Measuring Center, Inc.,
Kyoto, Japan
Exploring the application of a universal method for pesticide screening in foods using a high data acquisition speed MS/MS
ASMS 2012 WP27-574

2
IntroductionEffective management, use, and disposal of agrochemicals, particularly pesticides, is an increasingly important health and environment issue in developing countries where economies may be heavily reliant on agriculture. The conventional approach to monitor these pesticides is to develop highly optimized triple quadrupole MRM methods to achieve the required levels of sensitivity, selectivity and
speed of analysis whilst still providing confidence in pesticide identification. In this study LCMS technology, developed for ultra-fast scanning MRM analysis, allows the possibility of a single generic ‘universal’ method. High speed MRM analysis and a generic parameters were used for screening 172 pesticides (344 MRM transitions) with 5 msec dwell and 1 msec pause times in food matrices.
Materials and Methods
Exploring the application of a universal method for pesticide screening in foods using a high data acquisition speed MS/MS
Sample Preparation
Analytical Conditions
Setting of MRM analysis & integration parameter
ColumnMobile phase
Gradient program
Flow rateColumn temperature
IonizationIon spray voltageMRM
: Shim-pack XR-ODSII (75 mm x 2 mmI.D., 2.2 um): A ; 5 mM ammonium acetate – water B ; 5 mM ammonium acetate – methanol: 30% B (0 min.) → 80% B (4 min.) → 95% B (10-15 min.) → 30% B (15.01-20 min.): 0.2 mL / min.: 40°C
: ESI (Positive / Negative): +4.5 kV / -3.5 kV: 344 MRM transitions (2 MRMs / compound)
HPLC : Nexera UHPLC system
Positive
Negative
Features of LCMS-8040
MS : LCMS-8040 Triple quadrupole mass spectrometer
Sample: 5 g
Homogenize
Extraction
Suction Filtration
Salting-out
Dehydration
Concentration
Purification by ENVI-Carb/LC-NH2 column
Concentration
Analyte
LC/MS analysis
Addition of 20 mL of water and then left to stand for 15 min.
Addition of 50 mL of acetonitrile
Preparation of 100 mL solution of supernatant with acetonitlie.
Partitioned 20 mL of extracted solution (equivalent to 1 g of sample)
Addition of 10 g of NaCl and 20 mL of 0.5 mol/L phosphate buffer (pH 7.0)
Shaking for 10 min after adding adequate amount of anhydrous sodium sulfate.
Filtration
FiltrInstrument Parameters View (Realtime analysis)
167 compounds from ‘Residual pesticide
method package’+
5 compounds
Acquisition time set to the entire chromatographic run (0-20 min.).
‘Largest peak’ selected for identification.
Dwell 5 msec.Pause 1 msec.Loop time 2.058 sec.
MS Data Processing View (Postrun analysis)
Residue dissolved in 2 mL of 25% toluene / acetonitrile
Conditioned with 10 mL of 25% toluene / acetonitrile
Elution with 20 mL of 25% toluene / acetonitrile
4 mL of solution was prepared by dissolving in methanol
(Method reported by Japan’ s Ministry of Health, Labour and Welfare)
Fig. 1 LCMS-8040 Triple Quadrupole Mass Spectrometer
5 times higher sensitivity compared to LCMS-8030An ultra fast scan speed of 15000 u / sec.An ultra fast polarity switching of 15 msec.An ultra fast MRM transition speed of 555 ch./ sec.
In this study, no scheduling of MRM transitions was applied; thereby creating a universal generic method.
LCMS-8040Ultra Fast Mass Spectrometer

3
ResultsScreening of 10 pesticides in food matrices
10 ppb of pesticides spiked in the leek extract
Mevinphos
5.0(×100,000)
4.5
4.0
3.5
3.0
2.5
2.0
1.5
1.0
0.5
0.0
0.0 2.5 5.0 7.5 10.0 min
Tricyclazole
Propoxur
Carbofuran
Fosthiazate
Indanofan
Lufenuron
Pyrimidifen
Hexythiazox
Chlorfluazuron
Fig. 2 MRM chromatogram of 10 pesticides
Table 2 Result of 10 pesticides screening (10 ppb spiked in each matrices)
・ All peaks were automatically selected as the target compound to permit automatic identification of target analytes without retention time information. (* Number of false positives out of 172 screened pesticides.)
Exploring the application of a universal method for pesticide screening in foods using a high data acquisition speed MS/MS
LeeK Paprika Green tea leaves
8 7 10
Compounds
False positives*
Carbofuran
Chlorfluazuron
Fosthiazate
Hexythiazox
Indanofan
Lufenuron
Mevinphos
Propoxur
Pyrimidifen
Tricyclazole

4
Fig. 3 Result of automatic identification (10 ppb spiked in the green tea leaves)
ConclusionPesticides spiked in all matrices at 10 ppb (10 compounds) could be automatically detected using fast 5 msec MRM with 15 msec polarity switching without retention time information.
Exploring the application of a universal method for pesticide screening in foods using a high data acquisition speed MS/MS
Mevinphos
Tricyclazole
Propoxur
Carbofuran
Fosthiazate
Indanofan
Lufenuron
Pyrimidifen
Hexythiazox
Chlorfluazuron

For Research Use Only. Not for use in diagnostic procedures.The content of this publication shall not be reproduced, altered or sold for any commercial purpose without the written approval of Shimadzu. The information contained herein is provided to you "as is" without warranty of any kind including without limitation warranties as to its accuracy or completeness. Shimadzu does not assume any responsibility or liability for any damage, whether direct or indirect, relating to the use of this publication. This publication is based upon the information available to Shimadzu on or before the date of publication, and subject to change without notice.
© Shimadzu Corporation, 2012
First Edition: May, 2012
www.shimadzu.com/an/

Manami Kobayashi, Satoshi Yamaki, Ayako Nomura,
Kyoko Watanabe, Yoshihiro Hayakawa, Tsutomu
Nishine Shimadzu Corporation, Kyoto, Japan
Rapid and Highly Sensitive Quantitative Analysis and Screening of Aflatoxins in Foods Using Liquid Chromatography Triple Quadrupole Mass Spectrometry
ASMS 2012 WP27-585

2
IntroductionAflatoxins (AFs) are the most harmful mycotoxins produced by the fungi Aspergillus flavus and Aspergillus parasiticus and can contaminate foods such as cereals and nuts. To reduce the risk of the ingestion from foods, analyses of the AFs are carried out in many countries. It is necessary to quantitate the total aflatoxin (B1, B2, G1, G2) in foods by the regulation in JAPAN. The conventional LC/MS method proposed by the Ministry of Health, Labour and Welfare of Japan has a total analysis time of 30 minutes. In this study, we examined two alternative high-throughput LC-MS/MS methods. The first optimized for sensitivity & quantification; the second, a rapid screening method, using UHPLC for the purpose of increasing work flow.
Materials and MethodsThe system consisted of a SHIMADZU “Nexera” HPLC system, and “LCMS-8030” triple quadrupole mass spectrometer, equipped with an electrospray ionization (ESI) used in the positive ion MS/MS mode. AFs standard solution were obtained from Biopure, MYCOTOXIN MIX5(AFLATOXINS) and Wako Chemicals, Aflatoxins Mixture Solution 1. Sample preparation work flow (Fig. 2) shows how AFs in roast peanut was prepared by an immunoaffinity column (AFLAKING, HORIBA, JAPAN). Based on starting material 50g (roast peanut powder) spiked Aflatoxin B1 and G1(4 µg/Kg), B2 and G2 (1 µg/Kg) standard solution, final concentration of the sample solutions became: 2 µg/L B1 and G1, 0.5 µg/L B2 and G2.
Rapid and Highly Sensitive Quantitative Analysis and Screening of Aflatoxins in Foods Using Liquid ChromatographyTriple Quadrupole Mass Spectrometry
Fig. 2 Sample preparation work flow.
Fig. 1 Structure of Aflatoxins.
Aflatoxin G1
Aflatoxin B1
Aflatoxin B2
Aflatoxin G2
O O
O
O O
OCH3
O O
O
O O
OCH3
O O
O
O
OCH3
O
O
O O
O
O
OCH3
O
O
5 g NaCl
Mixing for 5 min
Centrifugation
Roast Peanut 50.0 g
10 mL up to 50 mL with water
Clean -up by immunoaffinity column “ AFLAKING”
Filtration with glass micro filter
10 mL
Sample solution
Evaporation by N2 gas
1.0 mL water / acetonitrile=9/1 (v/v)
Elution with acetonitrile (3 mL)
200 mL water / methanol= 2 / 8 (v / v)
Add AFs standard solution

3
ExperimentAnalysis Standard Solution
Rapid and Highly Sensitive Quantitative Analysis and Screening of Aflatoxins in Foods Using Liquid ChromatographyTriple Quadrupole Mass Spectrometry
Rapid and Highly Sensitive Quantitative Analysis and Screening of Aflatoxins in Foods Using Liquid ChromatographyTriple Quadrupole Mass Spectrometry
The chromatogram and analytical conditions of the conventional method (Fig. 3, Table 1) were compared to and the high-speed method with using ultra-fast liquid chromatography (Fig. 4, Table 3). The flow rate was raised
to 0.45 mL/min accelerating AFs elution to 4 minutes (operating back pressure 44-50 Mpa). MRM transitions summarized in Table 2.
Column:
Mobile Phase A:Mobile Phase B: Gradient Program:
Flow Rate: Column Temp. :Injection Vol.:
Probe Voltage: Nebulizing Gas Flow:Drying Gas Flow:DL Temp.:Heat Block Temp.:
Table 1 Analytical conditions (typical 30 minute method).
HPLC
MS
Shim-pack FC-ODS (150 mm L. × 2.0 mm i.d., 3 µm)10 mmol/L Ammonium acetate-water Methanol 40%B(0-15 min) → 100%B(15.01-20 min) → 40%B (20.01-30 min)0.2 mL/min 40°C6 µL
+4.5 kV ESI-Positive mode3 L/min15 L/min 250°C 400°C
Column:
Mobile Phase A:Mobile Phase B: Gradient Program:
Flow Rate: Column Temp.:Injection Vol.:
Probe Voltage: Nebulizing Gas Flow:Drying Gas Flow:DL Temp.:Heat Block Temp.:
Table 3 Analytical conditions (optimized fast method).
HPLC
MS
Shim-pack XR-ODS II (100 mm L. ×2.0 mm i.d., 2.2 µm)10 mmol/L Ammonium acetate-water Methanol 40%B (0-4.5 min)→ 100%B(4.51-6.5 min)→ 40%B (6.51-12 min)0.45 mL/min 50°C6 µL
+4.5 kV ESI-Positive mode3 L/min15 L/min 250°C 400°C
Fig. 3 Chromatograms of AFs (0.5 µg/L each).
Fig. 4 Chromatograms of AFs (0.5 µg/L each).
1.0 2.0 3.0 4.0 min
- 0.1
0.0
0.1
0.2
0.3
0.4
0.5
0.6
0.7
0.8
0.9
1.0
1.1
1.2
(x1,000)
■Peaks 1. Aflatoxin G2 :331.10>245.00(+) 2. Aflatoxin G1 :328.90>242.95(+) 3. Aflatoxin B 2 :315.10>258.95(+) 4. Aflatoxin B 1 :313.10>240.95(+)
1
2
3
4
0.0 2.5 5.0 7.5 10.0 12.5 min
0.0
0.5
1.0
1.5
2.0
2.5
3.0
3.5
4.0
4.5
(x100)
Peaks 1. Aflatoxin G2 :331.10>245.00(+) 2. Aflatoxin G1 :328.90>242.95(+) 3. Aflatoxin B 2 :315.10>258.95(+) 4. Aflatoxin B1 :313.10>240.95(+)
4
3
2
1
Table 2 MRM Parameter.
Compound Transition Pause time
Dwell time CE
(V) Resolution (Q1,Q3) (ms) (ms)
Aflatoxin B1 313.10 > 240.95 3 100 -40 Unit Aflatoxin B2 315.10 > 258.95 3 100 -33 Unit Aflatoxin G1 328.90 > 242.95 3 100 -30 Unit Aflatoxin G2 331.10 > 245.00 3 100 -32 Unit

4
Fig. 5 Callibration curves AFs (linearity beyond R2=0.999 was acquired).
Fig. 6 Chromatographic optimization of column temperature.
Rapid and Highly Sensitive Quantitative Analysis and Screening of Aflatoxins in Foods Using Liquid ChromatographyTriple Quadrupole Mass Spectrometry
B1 B2 G1 G2
0.0 2.5 5.0 7.5 Conc. 0.0
0.5
1.0
1.5
2.0
2.5
3.0
3.5
4.0 Area (x10,000)
0.0 2.5 5.0 7.5 Conc. 0.0
0.5
1.0
1.5
2.0
2.5
3.0
3.5
4.0 Area (x10,000)
0.0 2.5 5.0 7.5 Conc. 0.0
1.0
2.0
3.0
4.0
5.0
6.0 Area (x10,000)
0.0 2.5 5.0 7.5 Conc. 0.00
0.25
0.50
0.75
1.00
1.25
1.50
1.75
2.00 Area (x10,000)
µg/L µg/L µg/L µg/L
Table 4 L.O.Q. and Linearity (n=6). Compound L.O.Q. (µg/L) Linearity R^2
Aflatoxin B1 0.1 0.1-10 µg/L 0.9995372
Aflatoxin B2 0.1 0.1-10 µg/L 0.9997556
Aflatoxin G1 0.05 0.05-10 µg/L 0.9994336
Aflatoxin G2 0.1 0.1-10 µg/L 0.9992275
Effect of Column TemperatureColumn temperature was optimized in order to accelerate compound elution without compromising peak shape or intensity. Finally a column temperature of 50°C was chosen (Fig. 6).
0.0 1.0 2.0 3.0 4.0 5.0 min
0.00
0.25
0.50
0.75
1.00
1.25
1.50
(x1,000)
40°C
50°C
60°C
0.0 1.0 2.0 3.0 4.0 5.0 min
0.00
0.25
0.50
0.75
1.00
1.25
1.50
(x1,000)
0.0 1.0 2.0 3.0 4.0 5.0 min
0.00
0.25
0.50
0.75
1.00
1.25
1.50
(x1,000)
Peaks 1. Aflatoxin G2 :331.10>245.00(+) 2. Aflatoxin G1 :328.90>242.95(+) 3. Aflatoxin B2 :315.10>258.95(+) 4. Aflatoxin B1 :313.10>240.95(+)
1
2
3
4

5
Effect of ESI Probe Position
Rapid and Highly Sensitive Quantitative Analysis and Screening of Aflatoxins in Foods Using Liquid ChromatographyTriple Quadrupole Mass Spectrometry
Rapid and Highly Sensitive Quantitative Analysis and Screening of Aflatoxins in Foods Using Liquid ChromatographyTriple Quadrupole Mass Spectrometry
Further optimisation was achieved through optimization of ESI probe position ranging from -2 mm to +3 mm from the central position (Fig. 7). Chromatographic comparison (Fig. 8) illustrates both peak intensity and level of noise are
influenced by probe position. Optimization required highest S/N and minimum noise at +1 mm (Fig. 9 & 10). [Noise was calculated by ASTM method with 3 blocks of 0.5 min around each
Fig. 8 Chromatograms comparison of a ESI probe position difference.
Fig. 7 ESI probe of LCMS-8030.
0
10
20
30
40
50
60
70
central +0.5 +1 +1.5 +2
probe position (mm)
S/N
AF G2AF G1AF B2AF B1
0
50
100
150
200
250
central +0.5 +1 +1.5 +2
Noi
se
AF G2AF G1AF B2AF B1
G2 G1
Central
+0.5 mm
+1.0 mm
+1.5 mm
+2.0mm
Fig. 9 S/N of probe position difference.
Fig. 10 Noise of probe position difference.
Probe Position
1.0 2.0 min
(x1,000)
0.0
0.1
0.2
0.3
0.4
0.5
0.6
0.7
0.8
0.9
1.0
1.1
1.2
1.3
1.4
2.0 min
0.00
0.25
0.50
0.75
1.00
1.25
1.50
1.75
2.00
2.25
2.50
2.75
(x1,000)

6
1.0 2.0 3.0
0.0
0.5
1.0
1.5
2.0
2.5
(x1,000)
2.0 3.0 4.0
0.0
1.0
2.0
3.0
4.0
(x100)
3.0 4.0
0.00
0.25
0.50
0.75
1.00
1.25
(x1,000)
1.0 2.0 3.0
0.0
0.5
1.0
1.5
2.0
2.5
3.0
3.5 (x100)
G2 G1 B2 B1
0.43 µg/L 1.64 µg/L 1.54 µg/L 0.34 µg/L
Fig. 11 Chromatograms of AFs in roast peanut matrix.
Table 5. Results of quantity analysis. Aflatoxin B1 Aflatoxin B2 Aflatoxin G1 Aflatoxin G2
Conc. (µg/L) (µg/L) (µg/L) (µg/L)
Recovery (%)
Conc.
Recovery (%)
Conc.
Recovery (%)
Conc.
Recovery (%)
Sample1 1.54 75 0.34 69 1.64 82 0.43 86
Sample2 1.44 70 0.34 69 1.64 82 0.37 74
Rapid and Highly Sensitive Quantitative Analysis and Screening of Aflatoxins in Foods Using Liquid ChromatographyTriple Quadrupole Mass Spectrometry
ResultsAnalysis of Roast Peanut Matrix The recovery test of AFs spiked into the roast peanut powder was performed in duplicate experiments. Overlaid chromatograms of spiked AFs in roast peanut matrix to un-spiked were shown (Fig. 11). Solid line - spiked compared to dotted line - un-spiked. Interference peaks were not detected in un-spiked samples. Quantitation results using external standard method show the recovery rate was in the range of 69-86% (Table 5). This relatively low recovery rate is a known problem when extracting AFs with a solvent from the powder of a roast peanut. Further method development is underway to increase recovery rate.

7
Rapid and Highly Sensitive Quantitative Analysis and Screening of Aflatoxins in Foods Using Liquid ChromatographyTriple Quadrupole Mass Spectrometry
Ultra High-speed Method For Screening Analysis
Further improvements to speed of analysis were made using a reduced column particle size and length (1.6 µm, Shim-pack XR-ODS III 50 mm × 2.0 mm). With these
conditions, AFs eluted within 2 minutes with L.O.Q. of 0.5 µg/L. This ultra high-speed analysis could prove useful when screening many samples.
Conclusion Analysis of AFs in the roast peanut was studied.
Accelerated method was developed due to capacity of ultra high pressure liquid chromatography (Nexera).New choice of Shim-pack column enabled faster elution times. Two high-speed methods were developed eluting AFs within 4 and 2 min.
Column temperature and ESI probe position were important conditions of AFs analysis.Immunoaffinity column was useful for cleanup from the roast peanut matrix.The results of recovery test was 69-86%.
Column:
Mobile Phase A:Mobile Phase B: Gradient Program:
Flow Rate: Column Temp. :Injection Vol.:
Probe Voltage: Nebulizing Gas Flow:Drying Gas Flow:DL Temp.:Heat Block Temp.:
Table 6. Analytical conditions.
HPLC
MS
Shim-pack XR-ODS III (50 mm L. ×2.0 mm i.d., 1.6 µm)10 mmol/L Ammonium acetate-water Methanol 40%B(0-2.25 min)→ 100%B(2.26-3.25 min)→ 40%B(3.26-6.00 min)0.45 mL/min 50°C 6 µL
+4.5 kV ESI-Positive mode3 L/min15 L/min 250°C400°C
0.5 1.0 1.5 2.0 min
0.0
0.5
1.0
1.5
2.0
2.5
3.0
3.5
4.0
4.5
5.0
(x100)
■Peaks 1. Aflatoxin G2 :331.10>245.00(+) 2. Aflatoxin G1 :328.90>242.95(+) 3. Aflatoxin B 2 :315.10>258.95(+) 4. Aflatoxin B 1 :313.10>240.95(+)
4
3
1
2
Table 7 MRM Parameters.
Fig. 12 Chromatograms of AFs (0.5 mg/L each).
Compound Transition Pause time
Dwelltime CE
(V) Resolution (Q1,Q3)
(ms) (ms)
Aflatoxin B1 313.10 > 240.95 1 50 -40 Unit
Aflatoxin B2 315.10 > 258.95 1 50 -33 Unit
Aflatoxin G1 328.90 > 242.95 1 50 -30 Unit
Aflatoxin G2 331.10 > 245.00 1 50 -32 Unit

For Research Use Only. Not for use in diagnostic procedures.The content of this publication shall not be reproduced, altered or sold for any commercial purpose without the written approval of Shimadzu. The information contained herein is provided to you "as is" without warranty of any kind including without limitation warranties as to its accuracy or completeness. Shimadzu does not assume any responsibility or liability for any damage, whether direct or indirect, relating to the use of this publication. This publication is based upon the information available to Shimadzu on or before the date of publication, and subject to change without notice.
© Shimadzu Corporation, 2012
First Edition: May, 2012
www.shimadzu.com/an/

Keiko Matsumoto1, Jun Watanabe1, Manabu
Yukiyama1, Junko Iida1, Itatu Yazawa2 1SHIMADZU CORPORATION; 2Imtakt Corporation
High throughput analysis of anion surfactant using ultra-high speed LC-MS/MS and 1 mm inside diameter column
ASMS 2012 TP31-611

2
IntroductionHigh resolution separations with high speed MS/MS data acquisition have created new opportunities in academic and applied research. High resolution separations can be achieved by ultra-high pressure columns with a particle diameter > 2 um or as an alternative technology using particles with a diameter of 3 um and 1 mmID. Both
LAS surfactants (C10 to C14) were obtained from Wako Pure Chemical Ind., Ltd(Osaka,Japan). Several levels of calibrators were made from the stock solution.Commercial LAS products consist of more than 20 individual components. The ratio of the various homologues and isomers representing different alkyl chain lengths and aromatic ring positions along the linear alkyl chains is relatively constant across the various household applications. The analysis of LAS surfactants (C10 to C14) share a common fragment ion at m/z 183 independent of linear carbon chain length and a fragment ion at m/z 119.
technologies are designed for higher resolution but they approach the problem in a different way. In this paper we have applied a 1 mm inside diameter column phase to the analysis of linear alkylbenzene sulfonate anion surfactants using a high speed MS/MS detection system.
As high resolution analysis, various isomers of LAS surfactant can be separated and be detected severally. Chromatographic separations were carried out using Unison UK-C18 HT (1 mmI.D. , 50 mmL., 3 um) , which has high pressure resistance and large sample capacity1). The
column temperature was maintained at 40°C . Flow rate was 0.15 mL/min with a binary gradient system. Components were detected in electrospray negative MRM mode for quantitative analysis.
Nexera MP UHPLC system was connected to LCMS-8030 triple quadrupole mass spectrometer.
Methods and MaterialsAutosampler SIL-30ACMP
・Utrafast injection performance exceeding that of current models ・Ultralow carryover ・6 microtiter plates can be loaded, enabling a maximum of 2304 samples to be analyzed
LCMS-8030 High Speed Mass Spectrometer Polarity Switching 15 msec Scanning Speed Max. 15000 u/sec
High throughput analysis of anion surfactant using ultra-high speed LC-MS/MS and 1 mm inside diameter column
Fig. 1 UHPLC Nexera MP &LCMS-8030
Fig. 2 Structure of LAS (C11)
CH3
SO 3H
CH3
m/z 183
ResultsConventional HPLC Analysis

3
High throughput analysis of anion surfactant using ultra-high speed LC-MS/MS and 1 mm inside diameter column
UHPLC conditions (Nexera MP system) Column: Mobile phase A: Flow rate: Time program: Injection vol.: Column temperature:
Unison UK-C18 HT 1 mmI.D.x 50 mmL., 3 um10 mM Ammonium acetate, B: Acetonitrile0.15 mL/minB conc.40%(0 min) 60%(5 min) 95%(5.01-7 min) 40%(7.01-10 min)5 µL40°C
MS conditions (LCMS-8030) Ionization: ESI, Negative MRM mode MRM transition are shown in Table 1.
Fig. 3 Mass chromatograms of conventional conditions (LAS C10 - C14 each 20 ppb)
Table 1 MRM transition of LAS
Table 2 Recovery data spiked in tap water sample at 20 ppb (n=5)
C10 C11 C12 C13 C14
20 ppb Standard sample 263865 218485 240309 255308 205600
Spiked tap water sample 282372 227065 244975 265646 222209
Recovery (%) 107.0 103.9 101.9 104.0 108.1
C10 C11 C12 C13
C14
C10 C11 C12 C13 C14
Quantitative ion Q1/Q3 297/183 311/183 325/183 339/183 353/183
297/119 311/119 325/119 339/119 353/119 Qualitative ion Q1/Q3
Quantitative ion
Qualitative ion
0.0 0.5 1.0 1.5 2.0 2.5 3.0 3.5 4.0 4.5 5.0 5.5 min
0
2500
5000
7500
10000
12500
15000
17500
20000
5:353.20>119.10(- ) 5:353.20>183.10(- ) 4:339.20>119.10(- ) 4:339.20>183.10(- ) 3:325.20>119.10(- ) 3:325.20>183.10(- ) 2:311.20>119.10(- ) 2:311.20>183.10(- ) 1:297.15>119.10(- ) 1:297.15>183.10(- )
The above counts are peak area
Several Peaks for each LAS carbon chain were detected. The result shows that excellent separation was achieved with these conditions in spite of comparatively high speed analysis. Spiked tap water sample (20ppb LAS) showed good recovery
at almost 100% (Table 2). These results indicate that the LC-MS/MS method was not influenced by sample matrix in tap water.

4
Fig. 5 Mass chromatograms of high throughput condition (LAS C10~ C14 each 20 ppb)
Fig. 4 HPLC path of SIL-30AC
High throughput analysisAlthough several peaks were detected for each LAS as mentioned above, it does however make quantification more complex. In high throughput analysis, the condition of which each LAS is detected as one peak was re-examined
The Nexera UHPLC system has a unique wash process in which the needle and sample loop can be washed, separating it from the HPLC line after injection. Washing of the needle seal and shortened the HPLC line result from this function (Fig. 4). Using this function, chromatographic separations were carried out on LC-MS/MS condition as follows.
Each LAS was separated as one peak within 1 minute. Total analysis cycle was within 2 minutes. In this condition, the linearity of calibration curve and repeatability for each LAS was excellent and all LAS can be
detected from 0.1ppb (Fig. 6, Table 3). Spiked Tap water sample (200 ppb LAS) showed good recoveries with almost 100%. It indicates that this LC-MS/MS method was not influenced by sample matrix in tap water.
Modified UHPLC conditions: Flow rate: 0.3 mL/min(0-1 min) 0.5 mL/min(1.01-1.30 min) 0.3 mL/min(1.31-1.5 min) Time program: B conc.55%(0 min) 90%(0.7 min) 95%(0.71-0.75 min) 55%(0.76-1.5 min)
MS conditions (LCMS-8030): same as previously used.
C10 C11 C12 C13 C14
min 0.0 0.1 0.2 0.3 0.4 0.5 0.6 0.7 0
10000
20000
30000
40000
50000
60000
5:353.20>119.10(-)5:353.20>183.10(-)4:339.20>119.10(-)4:339.20>183.10(-)3:325.20>119.10(-)3:325.20>183.10(-)2:311.20>119.10(-)2:311.20>183.10(-)1:297.15>119.10(-)1:297.15>183.10(-)
0.7
Fig. 6 Representative calibration curve in high thoughput conditions (LAS C10, C12, C14)
C10
R 2=0.998
C12
R 2=0.996
C14
R 2=0.998
%RSD
C10 3.09
C11 4.11
C12 5.77
C13 7.50
C14 3.43
Table 3 Area repeatability of 0.5 ppb (n=5)
0 10 20 30 40 ppb 0
50000
100000
150000
200000
250000
300000
350000
400000
Area
0 10 20 30 40 ppb 0
100000
200000
300000
400000
Area
0 10 20 30 40 ppb 0
100000
200000
300000
400000
500000
600000 Area
High throughput analysis of anion surfactant using ultra-high speed LC-MS/MS and 1 mm inside diameter column

5
ConclusionsUsing 1 mm inside diameter column, 5 LAS were separated with high resolution within 1 minute and were detected with high sensitivity. The excellent linearity was obtained in the calibration curves of all LAS.
1) J. Watanabe et al., 56th ASMS Conference, LCMS I (WP)-295 (2008).
LCMS-8030 ultra fast precursor ion scanning is useful and reliable even for such a high thoughput analysis where extremely narrow peaks were obtained.
References
Simultaneous screening analysis of LAS using precursor ion scanning Simultaneous screening analysis of LAS using high speed precursor ion scanning was also conducted. M/z 183 was applied as a common fragment ion of LAS. It is commonly known that increasing the scanning speed in a conventional triple-quadrupole mass spectrometer results in mass errors. Increasing a scan speed, the detected m/z of LAS was examined using LCMS-8030.UHPLC conditions: same as previous high thoughput analysis conditionMS conditions (LCMS-8030) Ionization: ESI, Negative, precursor ion scan mode Prec of 183 (Scan range: m/z 180-500) Scan time: 1 sec (326 µ/sec), 0.33 sec (1000 µ/sec), 0.1 sec (3750 µ/sec).
Fig. 7 Measurement results of precursor ion scans; LAS standard solution left:TIC chromatogram, right:C12 (third peak) peaktop mass spectrum
LAS was analyzed at various scan speeds. The TICs and mass spectra are shown above for measurements at 326, 1000 and 3750 u/sec. At 326 u/sec, a proper peak shape was not obtained due to insufficient data points. The mass chromatogram at 3750 u/sec shows sharper peaks. The
results indicate that sufficient data points are obtained at a scan rate of over 3000 u/s.In addition, no precursor ion mass error was apparent at any scanning speed in the results.
326 u/sec
1000 u/sec
3750 u/sec
0.25 0.50 0.75 min 0
250000
500000
750000 1:TIC(- )
0.25 0.50 0.75 min 0
250000
500000
750000 1:TIC(- )
0.25 0.50 0.75 min 0
250000
500000
750000 1:TIC(- )
300 310 320 330 340 350 m/z 0.0
1.0
2.0
3.0
4.0
5.0 Inten. (x100,000)
325.20
300 310 320 330 340 350 m/z 0.0
1.0
2.0
3.0
4.0
5.0 Inten. (x100,000)
325.15
300 310 320 330 340 350 m/z 0.0
1.0
2.0
3.0
4.0
5.0 Inten. (x100,000)
325.15
High throughput analysis of anion surfactant using ultra-high speed LC-MS/MS and 1 mm inside diameter column

For Research Use Only. Not for use in diagnostic procedures.The content of this publication shall not be reproduced, altered or sold for any commercial purpose without the written approval of Shimadzu. The information contained herein is provided to you "as is" without warranty of any kind including without limitation warranties as to its accuracy or completeness. Shimadzu does not assume any responsibility or liability for any damage, whether direct or indirect, relating to the use of this publication. This publication is based upon the information available to Shimadzu on or before the date of publication, and subject to change without notice.
© Shimadzu Corporation, 2012
First Edition: May, 2012
www.shimadzu.com/an/

Keiko Matsumoto1, Jun Watanabe1, Junko Iida1
1Shimadzu Corporation.1, Nishinokyo-Kuwabaracho
Nakagyo-ku, Kyoto 604–8511, Japan
Simultaneous analysis of anionic, amphoteric and non-ionic surfactants using ultra-high speed LC-MS/MS
ASMS 2012 TP31-612

2
IntroductionSurfactant chemistry has made a considerable impact on a number of household products including detergents, shampoos and toothpaste. Products are generally classified by the type of each hydrophilic substructure into anionic, cationic, amphoteric and non-ionic surfactants. Either anionic or non-ionic surfactants are typically used as synthetic detergents, however, to better elucidate the
potential risk in environmental samples, mainly in agricultural soils and sediments, methods need to take into account a range of surfactant chemistries. Current surfactant monitoring methodologies tend to focus on a specific surfactant. Here, we have developed the simultaneous analysis method for typical anionic, amphoteric and non-ionic surfactant using LC-MS/MS.
Commercially available surfactants were used for this experiment. Standards of surfactants were diluted with water / acetonitrile =3/7 to an appropriate concentration and then analyzed by LC-MS/MS. As an LC-MS/MS system, UHPLC was coupled to triple quadrupole mass spectrometer (Nexera MP with LCMS-8040, Shimadzu Corporation, Kyoto, Japan). Separation was achieved using a YMC-Triart C8 column (100 mmL., 2.0 mmI.D., 1.9 um particles) and column oven temperature was maintained at
40°C. Samples were eluted at flow rate 300 uL/min with a binary gradient system; the mobile phase consisted of (A) 10 mM ammonium acetate buffer and (B) mixture of 10 mM ammonium acetate / acetonitrile / isopropanol (1/4/5). LC-MS/MS with electrospray ionization was operated in multiple-reaction-monitoring (MRM) mode with ultra-fast polarity switching.
Methods and Materials
Simultaneous analysis of anionic, amphoteric and non-ionic surfactants using ultra-high speed LC-MS/MS
Fig. 2 LCMS-8040 triple quadrupole mass spectrometer
Fig. 1 Structure of anionic, amphoteric and non-ionic surfactant
High Speed Mass Spectrometer Ultra Fast Polarity Switching 15 msecUltra Fast MRM Max. 555 transition /sec
CH3 (CH 2)nCH 2 N+
CH3
O-
O
CH3
Betain (n=10,12,14)
CnH(2n+1)
SO 3H
LAS (n=10 -14)
Heptaethyleneglycoldodecylether
(CH 2)11OH (OCH 2CH 2)7 CH3

3
ResultsMethod development for surfactants
UHPLC conditions (Nexera MP system)Column:Mobile phase A: B:Flow rate:Time program:Injection vol.:Column temperature:
MS conditions (LCMS-8040)Ionization: ESI, Positive/Negative MRM mode
YMC TriartC8 100 mm×2.0 mm, 1.9 um10 mM Ammonium acetate10 mM Ammonium acetate / Acetonitrile/ isopropanol (1/4/5)0.3 mL/minB conc.75%(0 min) -95%(1.5-3 min) - 75%(3.01-5 min)10 uL40°C
The following standard surfactants were selected and analyzed; anionic surfactant: linear alkylbenzene sulfonate (LAS) C10-C14 mixture, amphoteric surfactant: EMPIGEN BB Detergent (Betaine) C10, C12, C14 mixture (Sigma-Aldrich, St.Louis, MO), and non-ionic surfactant: heptaethyleneglycoldodecylether (HEDE). Full scan measurement by flow injection analysis (FIA) was conducted to determine the optimum ionization polarity of target compounds followed by MRM transition optimization by FIA. As a consequence, all LASs were detected as the de-protonated ions (M-H) in negative ion
mode and m/z 183 was selected as the product ion of MRM transitions for all LASs (C10-C14). All Betaine were detected as protonated ions (M+H) in positive ion and m/z 104 was selected as the product ions of MRM transitions for all Betaines (C10, C12 and C14). HEDE yielded the protonated ion (M+H) in positive ion as the precursor and m/z 133 was selected as product ion for MRM transition. As compounds selected in this experiment formed either positive or negative ion, high-speed polarity switching is an important element to consider in developing an optimized LC-MS/MS method.
Table 1 MRM transition of LAS
Compound
LAS C10
LAS C11
LAS C12
LAS C13
LAS C14
Betain C10
Betain C12
Betain C14
HEDE
Polarity
-
-
-
-
-
+
+
+
+
MRM transition
297.15 > 182.60
311.20 > 182.60
325.20 > 182.70
339.20 > 182.60
353.40 > 182.60
271.95 > 103.80
300.00 > 103.70
328.20 > 103.70
495.30 > 133.15
Simultaneous analysis of anionic, amphoteric and non-ionic surfactants using ultra-high speed LC-MS/MS
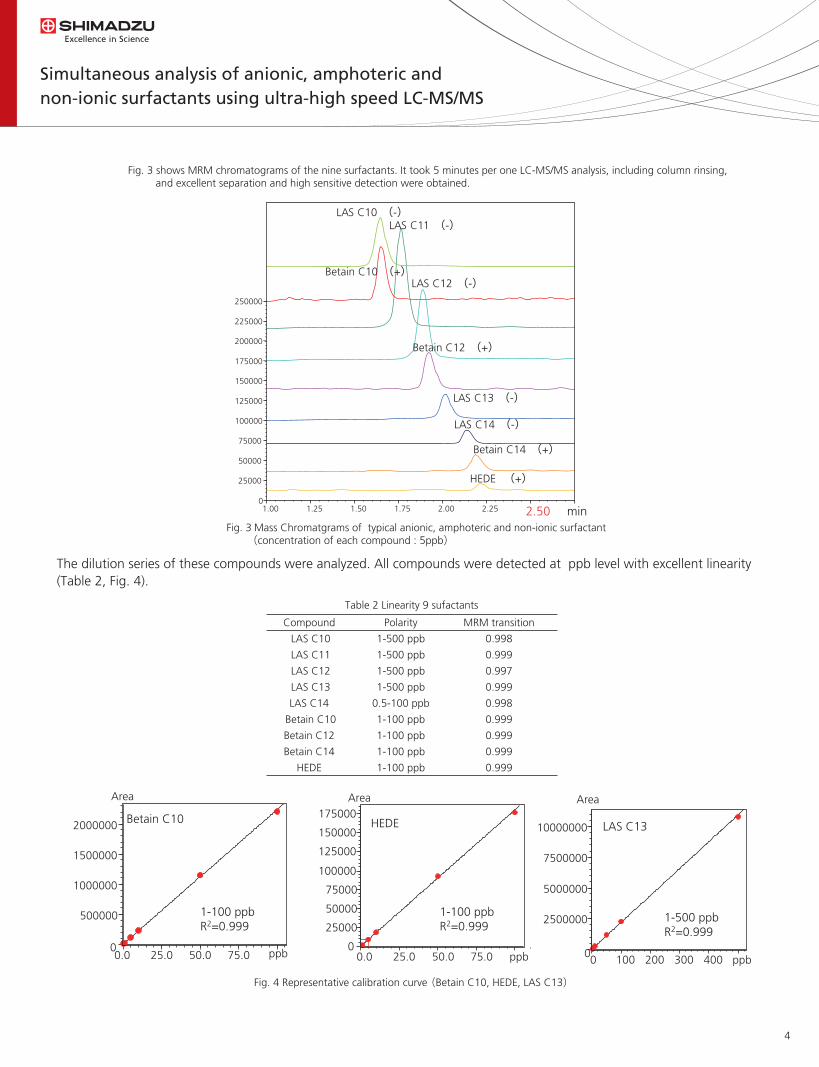
4
Fig. 3 shows MRM chromatograms of the nine surfactants. It took 5 minutes per one LC-MS/MS analysis, including column rinsing, and excellent separation and high sensitive detection were obtained.
Fig. 3 Mass Chromatgrams of typical anionic, amphoteric and non-ionic surfactant (concentration of each compound : 5ppb)
Fig. 4 Representative calibration curve (Betain C10, HEDE, LAS C13)
Simultaneous analysis of anionic, amphoteric and non-ionic surfactants using ultra-high speed LC-MS/MS
1.00 1.25 1.50 1.75 2.00 2.25 2.50 min 0
25000
50000
75000
100000
125000
150000
175000
200000
225000
250000
Betain C10 (+)
LAS C10 (-) LAS C11 (-)
LAS C12 (-)
Betain C12 (+)
LAS C13 (-)
HEDE (+)
LAS C14 (-)
Betain C14 (+)
The dilution series of these compounds were analyzed. All compounds were detected at ppb level with excellent linearity (Table 2, Fig. 4).
Table 2 Linearity 9 sufactants
Compound
LAS C10
LAS C11
LAS C12
LAS C13
LAS C14
Betain C10
Betain C12
Betain C14
HEDE
Polarity
1-500 ppb
1-500 ppb
1-500 ppb
1-500 ppb
0.5-100 ppb
1-100 ppb
1-100 ppb
1-100 ppb
1-100 ppb
MRM transition
0.998
0.999
0.997
0.999
0.998
0.999
0.999
0.999
0.999
LAS C13
1-500 ppb R2=0.999
Betain C10
1-100 ppb R2=0.999
1-100 ppb R2=0.999
HEDE
ppb
Area
0.0 25.0 50.0 75.0 ppb 0
25000
50000
75000
100000
125000
150000
175000 Area
0 100 200 300 400 ppb 0
2500000
5000000
7500000
10000000
Area
0.0 25.0 50.0 75.0 0
500000
1000000
1500000
2000000

5
Simultaneous analysis of anionic, amphoteric and non-ionic surfactants using ultra-high speed LC-MS/MS
Quantitative Analysis of real world sampleThe quantitative analysis of real world sample using the kitchen detergents and liquid soap was achieved using this method. Kitchen detergents and liquid soap was diluted 1000 to 1 with water / acetonitril = 3/7. Finally, it was filtered through a 0.2 um filter and analyzed by LC-MS/MS. MRM chromatograms of each surfactants in the kitchen detergents and liquid soap is shown Fig. 5,6.
The 1000 to 1 dilution of liquid soap contained approximately 5 to 6 ppb LAS C12 and C13. Therefore, it was determined that undiluted liquid soap contains 5 to 6 ppm LAS C12 and C13. On the other hand, undiluted kitchen detergent contains approximately 40 ppm LAS C10, C11, C12 and C13, and approximately 75 ppm HEDE.
Fig. 5 Measurement results of liquid soap (dilution 1000 times)
Fig. 6 Measurement results of Kitchen detergent (dilution 1000 times)
0.0 0.5 1.0 1.5 2.0 2.5 3.0 min
0
25000
50000
liquid soap (× 1000)
LAS C10 (-)
(-)
(-)
(-)
(-)
(-)
(-)
(-)
LAS C11
LAS C12
LAS C13
0.0 0.5 1.0 1.5 2.0 2.5 3.0 min 0
100000
200000
300000
400000
500000
HEDE(+)
LAS C13
LAS C12
LAS C11
LAS C10
Kitchen detargent (×1000)
matrix
ConclusionsTypical anionic, amphoteric and non-ionic surfactant were separated with high resolution within 2.5 minute. Even though selected compounds formed either positive or negative ion, all surfactant were detected with high sensitivity. High-speed polarity switching is an important element for simultaneous analysis of various surfactants.
This method was able to be applied to the quantification of surfactants in kitchen detergents and liquid soap.
Concentration (ppb)75.2 ppb
no detectionno detectionno detectionno detection
35.7 ppb31.0 ppb40.4 ppb44.3 ppb
LAS C10LAS C11LAS C12LAS C13LAS C14
HEDEBetain C10Betain C12BetainC14
Concentration (ppb)< 1ppb< 1ppb4.9ppb6.1ppb
no detectionno detectionno detectionno detectionno detection
LAS C10LAS C11LAS C12LAS C13LAS C14
HEDEBetain C10Betain C12BetainC14

For Research Use Only. Not for use in diagnostic procedures.The content of this publication shall not be reproduced, altered or sold for any commercial purpose without the written approval of Shimadzu. The information contained herein is provided to you "as is" without warranty of any kind including without limitation warranties as to its accuracy or completeness. Shimadzu does not assume any responsibility or liability for any damage, whether direct or indirect, relating to the use of this publication. This publication is based upon the information available to Shimadzu on or before the date of publication, and subject to change without notice.
© Shimadzu Corporation, 2012
First Edition: May, 2012
www.shimadzu.com/an/

Keiko Kudo1; Toshikazu Minohata2; Junko Iida2;
Hitoshi Tsuchihashi3; Kiochi Suzuki3; Kei Zaitsu4;
Noriaki Shima4; Munehiro Katagi4; Noriaki Ikeda1 1Kyushu University, Fukuoka, Japan; 2Shimadzu Corporation, Kyoto, Japan; 3Osaka Medical Collage, Takatsuki, Japan; 4Osaka Prefectural Police, Osaka, Japan
Screening analysis for drugs of abuse by LC-MS/MS enables fast polarity switching MRM triggered product ion scanning on the fly
ASMS 2012 MP24-591

2
IntroductionIn recent years the need for forensic, toxicological and clinical analyses have increased, and as a consequence of sample complexity, analysis has become increasingly challenging due to a growing trend in the use of illicit drugs and non-medicinal prescription drugs. Screening applications requires rapid and unambiguous results that can be achieved using a generic analysis method designed
for a large number of target compounds. To meet this need, a universal high speed MRM triggered product ion scanning method with fast polarity switching was applied to simultaneously screen, quantitate and confirm by reference to an MS/MS data base containing the majority of drugs of abuse available in Japan.
Materials and Methods
Screening analysis for drugs of abuse by LC-MS/MS enables fast polarity switching MRM triggered product ion scanning on the fly
[Abused Drugs] Amphetamine Benzoyl ecgonine Cocaine Codeine Dihydrocodeine Ecgonine methyl ester Ephedrine Ketamine MDA MDMA Methamphetamine Methylephedrine Methylphenidate Morphine Sildenafil THC THC-COOH
[Psychotropic Drugs] Amitriptyline Amoxapine Aripiprazole Chlorpromazine Clomipramine Dosulepin Fluvoxamine Haloperidol Imipramine Levomepromazine Maprotiline Mianserin Mirtazapine Nortriptyline Olanzapine Paroxetine Promethazine Quetiapine Risperidone Sertraline Sulpiride Trazodone Zotepine
[Hypnotic Drugs] 7-Aminoflunitrazepam 7-Aminonimetazepam 7-Aminonitrazepam 8-Hydroxyetizolam Allylisopropylacetylurea alpha-Hydroxybrotizolam alpha-Hydroxytriazolam Alprazolam Amobarbital (neg) Barbital (neg) Bromazepam Bromovalerylurea Brotizolam Diazepam desmethyldiazepam Estazolam Ethyl loflazepate Etizolam Flunitrazepam Flurazepam Hydroxyzine Lorazepam Lormetazepam Midazolam Nimetazepam Nitrazepam Oxazepam Pentobarbital (neg) Phenobarbital (neg) Quazepam Temazepam Thiamylal (neg) Triazolam Zolpidem Zopiclone
[Medical Drugs] Acetaminophen Acetylpheneturide Atropine Biperiden Bupivacaine Carbamazepin Chlorpheniramine Clonazepam Dextromethorphan Diclofenac Diltiazem Diphenhydramine Diprophyline Ethenzamide Glibenclamide Glimepiride Ibuprofen (neg) Lidocaine Loxoprofen (neg) Mepivacaine Mexiletine Pancuronium Pentazocine Salicylic_acid (neg) Trihexyphenidyl Vecuronium Warfarin
[Pesticides] Diquat Fenitrothion (MEP) Glufosinate Malathion Methomyl Paraquat
[Natural Toxines] Aconitine Colchicine Tetrodotoxin
Table 1 List of compounds for Forensic method.

3
Analysis of several drugs was performed using fast polarity switching and high speed data acquisition LC/MS/MS. This was achieved using Synchronized Survey Scan® which refers to the execution of MS/MS scanning triggered by survey
scan signals (in this case, MRM). Therefore, during the elution of a peak in MRM analysis, a full-product ion mass spectrum can also be obtained.
Samples were analyzed using a Nexera UHPLC system coupled to a LCMS-8030 triple quadrupole mass spectrometer (Shimadzu Corporation, Japan) with LC/MS/MS Method Package for Forensic Toxicology. Database contains product ion scan spectra for 286 forensic and toxicology-related compounds such as 87 Abused drugs, 105 Psychotropic drugs, 70 Hypnotic drugs and others. This library provides Synchronized Survey Scan parameters (product ion spectral data
acquisition parameters based on the MRM intensity as threshold) optimized for screening analysis. The simple quantitative method included the most frequently analyzed 111 components of Abused drugs, Psychotropic drugs and Hypnotic drugs for method validation (Table 1).Samples were separated using a Shim-pack FC-ODS using a gradient elution with ammonium formate and methanol.
MRM parameter Product Ion Scan parameter
Positive
Negative
Fig. 1 User Interface of MRM-Product Ion Scan setting at LabSolutions software.
Analytical Conditions
HPLC (Nexera UHPLC system) Column
Mobile Phase A
Mobile Phase B
Gradient Program
Flow Rate
Column Temperature
Injection Volume
: Shim-pack FC-ODS (2.0 mmI.D. x 150 mmL., 3 um)
: 10 mM ammonium formate
: Methanol
: 5%B (0 min) - 95%B (15-20 min) - 5%B (20.01 - 30 min)
: 0.3 mL / min
: 40ºC
: 5 uL
Mass (LCMS-8030 triple quadrupole mass spectrometry)
Ionization
Polarity
Probe Voltage
Nebulizing Gas Flow
Drying Gas Pressure
DL Temperature
BH Temperature
: ESI
: Positive & Negative
: +4.5 kV (ESI-Positive mode);
-3.5 kV (ESI-Negative mode)
: 1.5 L / min
: 10 L / min
: 250ºC
: 400ºC
Screening analysis for drugs of abuse by LC-MS/MS enables fast polarity switching MRM triggered product ion scanning on the fly

4
Fig. 2 MRM - Product Ion Scan screening data about 4 compounds.
ResultsMS/MS Library MatchingMRM chromatograms of four compounds (each 1000 ng/mL) spiked into urine and analyzed by Nexera coupled to LCMS-8030 following sample preparation (Fig. 2). These product ion scans were searched against the MS/MS library and the four previously identified peaks were assigned a high hit score. The assay generates both MRM and Product Ion Scan data (MS/MS) due to the speed of data acquisition
from the LC/MS/MS system. This results in quantitative data and library searching / product matching data to help with product ion confirmation. Fast polarity switching helps to provide information rich product ion spectra resulting in better detection and identificationfor each compound
Allylisopropylacetylurea
Diclofenac
Amobarbital (neg)
Thiamylal (neg)
Screening analysis for drugs of abuse by LC-MS/MS enables fast polarity switching MRM triggered product ion scanning on the fly
10.0 12.4
0.0
1.0
2.0
3.0
4.0
(x100,000)
185.00>55.05(+)
12.5 10.1
0.0
0.5
1.0
1.5
2.0
2.5
3.0
3.5
(x100,000)
296.00>214.00(+)
296.00>215.05(+)
10.0 12.5
0.0
1.0
2.0
3.0
4.0
5.0
6.0
(x1,000)
225.15>42.00(-)
12.5 10.3
0.00
0.25
0.50
0.75
1.00
(x10,000)
253.00>101.00(-)
253.00>58.10(-)

5
Fig. 3 Registration of 1st coefficient and intersection by calibration curve.
Table 2 The calculated results of 12 compounds in whole blood using LC-MS/MS (n=2 average).
ConclusionA high speed LC/MS/MS data acquisition system was applied to drug screening in forensic, toxicological and clinicalanalysis. To achieve a highly specific and sensitive detection method in screening and quantitation, an MRM triggered production scanning method using a polarity switching speed of 15msec and a scan speed of 15,000u/sec was applied to 111components including illicit drugs, psychotropics, hypnotics, pesticides and other substances. As the MRM acquisition time was very fast, this enabled product ion spectra to be generated in both positive andnegative ionization mode which could be matched against a user library of compounds as an automated aid toscreening and compound identification.
Simple Quantitative Method for Forensic analysesBased on the chromatogram obtained by injection of a fixed volume of individual reference standard solutions, the ratio of peak area of the reference standard was calculated and compared to that of the internal standard (Diazepam-d5). The resulting calibration curve was prepared by plotting the ratios of the amount of the reference standard to that of the internal standard. 1st coefficient and intersection were calculated from the calibration curve and were registered to the LCMS method(Fig. 3).
The method was validated using 12 of 111 compounds, between 0,05 ng/mL and 5 ng/mL, spiked into whole blood and treated with solid phase extraction (Table 2). The results from this method indicated a high quantitative performance and could prove useful as rapid confirmationand simple quantitative analysis.
Screening analysis for drugs of abuse by LC-MS/MS enables fast polarity switching MRM triggered product ion scanning on the fly
0.05 ng/uL
Compounds
Diazepam-d5 (IS)AlprazolamAripiprazoleAtropineBrotizolamColchicineEstazolamEthyl loflazepateEtizolamFlunitrazepamHaloperidolRisperidoneTriazolam
12.98711.85715.592
7.22511.987
9.79411.46413.06812.09211.22912.01111.77811.728
396,803 114,210
59,975 327,992
42,175 21,970
128,563 85,673 73,746 77,218
616,938 783,134
34,424
[0.500]0.0380.0250.0840.0440.0150.0480.0280.0320.0600.0480.0380.042
342,441 918,575 700,323
3,105,470 325,945 159,050
1,078,497 489,250 575,984 545,933
5,378,666 6,811,884
283,935
[0.500]0.525 0.205 0.935 0.502 0.270 0.639 0.272 0.421 0.649 0.610 0.510 0.550
77,460 2,497,911 7,120,340
17,445,635 1,043,787
696,217 5,580,490 1,012,405 2,519,896 1,816,819
28,654,837 30,675,213
746,810
[0.500]6.72 3.07
10.92 7.49 3.72 5.49 2.68 5.67 7.12 7.10 6.72 6.78
R.T Area Conc.Area Conc.Area Conc.
0.5 ng/uL 5 ng/uL
60th ASMS Conference on Mass Spectrometry May 20 - 24, 2012 Vancouver, BC, Canada

For Research Use Only. Not for use in diagnostic procedures.The content of this publication shall not be reproduced, altered or sold for any commercial purpose without the written approval of Shimadzu. The information contained herein is provided to you "as is" without warranty of any kind including without limitation warranties as to its accuracy or completeness. Shimadzu does not assume any responsibility or liability for any damage, whether direct or indirect, relating to the use of this publication. This publication is based upon the information available to Shimadzu on or before the date of publication, and subject to change without notice.
© Shimadzu Corporation, 2012
First Edition: May, 2012
www.shimadzu.com/an/

Shuichi Kawana1; Katsuhiro Nakagawa1; Riki Kitano1;
Haruhiko Miyagawa1; Richard Whitney2; Mark
Taylor2; Ling Gee Siang3
1Shimadzu Corp., Kyoto, JAPAN; 2Shimadzu Scientific Instruments, Columbia, MD; 3SHIMADZU (Asia Pacific) Pte. Ltd., Singapore,
Singapore
Comprehensive Two-dimensional Gas Chromatograph Quadruple Mass Spectrometer for Plant Metabolite Analysis
ASMS 2012 ThP27-592
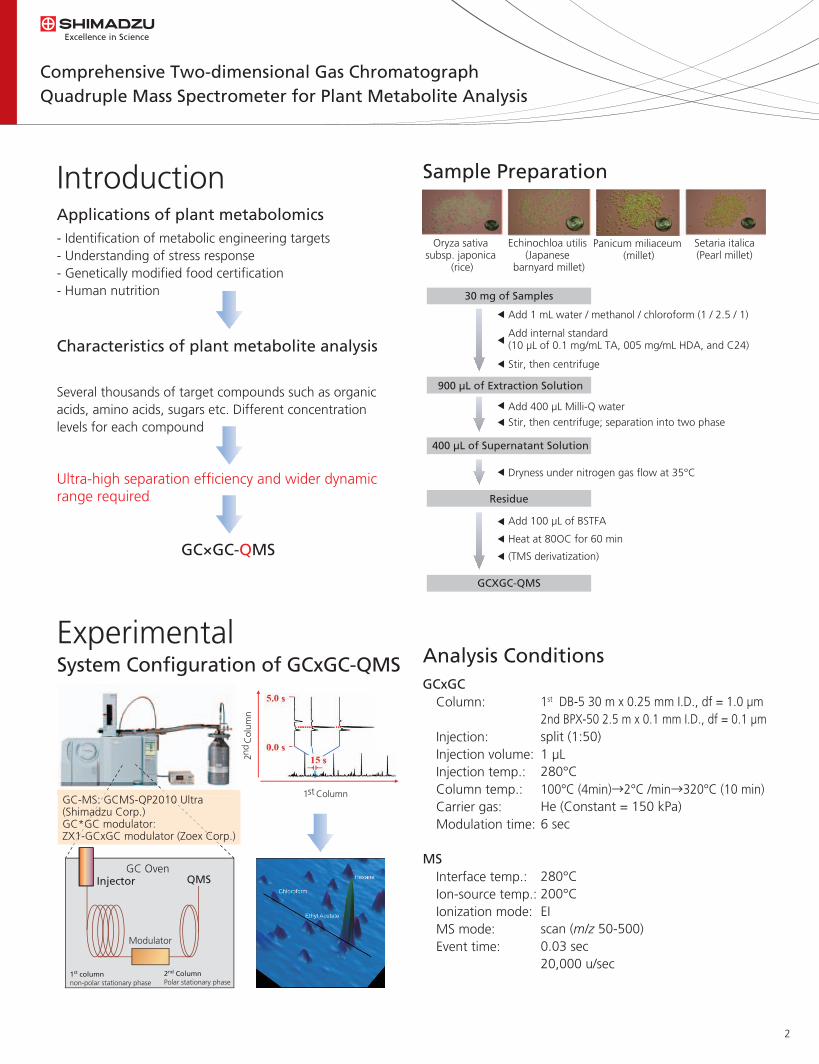
2
Introduction
Experimental
- Identification of metabolic engineering targets- Understanding of stress response- Genetically modified food certification - Human nutrition
Several thousands of target compounds such as organic acids, amino acids, sugars etc. Different concentration levels for each compound
GCxGC Column: Injection: Injection volume: Injection temp.: Column temp.: Carrier gas: Modulation time:
MS Interface temp.: Ion-source temp.: Ionization mode: MS mode: Event time:
1st DB-5 30 m x 0.25 mm I.D., df = 1.0 µm2nd BPX-50 2.5 m x 0.1 mm I.D., df = 0.1 µmsplit (1:50)1 µL 280°C100°C (4min)→2°C /min→320°C (10 min)He (Constant = 150 kPa)6 sec
280°C200°CEIscan (m/z 50-500)0.03 sec20,000 u/sec
Ultra-high separation efficiency and wider dynamic range required
Comprehensive Two-dimensional Gas Chromatograph Quadruple Mass Spectrometer for Plant Metabolite Analysis
Applications of plant metabolomics
Characteristics of plant metabolite analysis
GC×GC-QMS
System Configuration of GCxGC-QMS
Sample Preparation
Analysis Conditions
Injector
Modulator
QMS GC Oven
1st columnnon-polar stationary phase
2nd Column Polar stationary phase
1st Column
2nd
Col
umn
GC-MS: GCMS-QP2010 Ultra(Shimadzu Corp.)GC*GC modulator: ZX1-GCxGC modulator (Zoex Corp.)
Oryza sativa subsp. japonica
(rice)
30 mg of Samples
900 µL of Extraction Solution
400 µL of Supernatant Solution
Residue
GCXGC-QMS
Echinochloa utilis (Japanese
barnyard millet)
Panicum miliaceum (millet)
Setaria italica(Pearl millet)
Add internal standard (10 µL of 0.1 mg/mL TA, 005 mg/mL HDA, and C24)
Stir, then centrifuge
Add 400 µL Milli-Q water
Stir, then centrifuge; separation into two phase
Dryness under nitrogen gas flow at 35°C
Add 100 µL of BSTFA
Heat at 80OC for 60 min
(TMS derivatization)
Add 1 mL water / methanol / chloroform (1 / 2.5 / 1)

3
ResultsScan Interval and Chromatographic Peak Shape
Analysis Results of oryza sativa subsp. japonica
GCxGC image
50 Hz (20,000 u/sec) 25 Hz (10,000 u/sec) 10 Hz (4,000 u/sec)
oryza sativa subsp. japonica (rice)
Measured spectrum
Standard spectrum(Glycerol-3TMS)
Although this component was not be separated by 1st column, it was separated by GCxGC.
Similarity index:800
TIC
2147 peaks
~100 msec 2nd column
44.54 44.55 44.56 44.57 44.58 44.59 44.60 44.61 44.62 44.63
1000000
2000000
3000000
4000000
5000000
6000000
7000000 TIC
Methyl oleate
Methyl linolelaidate
Methyl linolenate
47.70 47.71 47.72 47.73 47.74 47.75 47.76 47.77
500000
1000000
1500000
2000000
2500000
3000000
3500000
4000000
4500000
5000000 TIC
47.70 47.71 47.72 47.73 47.74 47.75 47.76 47.77
500000
1000000
1500000
2000000
2500000
3000000
3500000
4000000 TIC
Comprehensive Two-dimensional Gas Chromatograph Quadruple Mass Spectrometer for Plant Metabolite Analysis

4
SummaryA fast scanning quadruple mass spectrometer (QMS) was shown to have a sufficient scan speed to fully characterize the ultra narrow peaks generated by the GC X GC system.Using this system, cereal samples (oryza sativa subsp. japonica (rice), echinochloa utilis (Japanese barnyard millet), panicum miliaceum (millet), and setaria italica (pearl millet)) were analyzed. The number of detected chromatographic peaks ranged from1950 to 2333.These results demonstrated the GCxGC-QMS can be effectively used to detect several thousand plant metabolites in a wide concentration range.
Oryza sativa subsp. japonica (rice) Echinochloa utilis (Japanese barnyard millet)
Setaria italica (pearl millet)Panicum miliaceum (millet)
A B
C D
> 800700 - 799600 - 699 500 - 599
< 499Total
>600 (%)
506091329158
1214792.6
73771704245
0233389.4
Number of Chromatographic PeaksSimilarity Index
193681377186
0195090.4
806491101128
3196193.3
A B C D
Comprehensive Two-dimensional Gas Chromatograph Quadruple Mass Spectrometer for Plant Metabolite Analysis

For Research Use Only. Not for use in diagnostic procedures.The content of this publication shall not be reproduced, altered or sold for any commercial purpose without the written approval of Shimadzu. The information contained herein is provided to you "as is" without warranty of any kind including without limitation warranties as to its accuracy or completeness. Shimadzu does not assume any responsibility or liability for any damage, whether direct or indirect, relating to the use of this publication. This publication is based upon the information available to Shimadzu on or before the date of publication, and subject to change without notice.
© Shimadzu Corporation, 2012
First Edition: May, 2012
www.shimadzu.com/an/

Hiroki Nakajima, Satoshi Yamaki, Tsutomu Nishine,
Masaru Furuta SHIMADZU CORPORATION, Kyoto, Japan
Analysis of degradation products in electrolyte for rechargeable lithium-ion battery throughhigh mass accuracy MSn and multivariate statistical technique
ASMS 2012 WP26-541

2
Introduction
Analysis of degradation products in electrolyte for rechargeable lithium-ion battery through high mass accuracy MSn and multivariate statistical technique
Experiment
Rechargeable lithium-ion batteries (LiB) are one of the major power sources for portable electronic devices and electric vehicles because of their high voltage and high energy density (Fig. 1-(a)). The electrolyte of a LiB is consisting of a lithium salt in an aprotic organic solvent. The typical operational potential of a LiB is between 0 and 5 V. Therefore, solvent can be reduced or oxidized at the
negative and positive electrodes during the battery charging process. As a result, various degradation products are generated in the electrolyte and cause some problems such as a decrease in the capacitance of battery (Fig. 1-(b)). Here, we present the analysis method of degradation products generated in electrolyte using high mass accuracy MSn and multivariate statistical technique.
The electrolyte was a mixture of ethylene carbonate (EC) and diethyl carbonate (DEC) (EC : DEC = 1 : 1 vol%) containing 1M lithium hexafluorophosphate (LiPF6). The electrolyte A taken from unused lithium-ion battery and the electrolyte B taken from lithium-ion battery repeated charge and discharge cycles (60°C, 30 times) were used as samples. Those samples were prepared 1/10 dilution with methanol for LCMS-IT-TOF (Shimadzu Corporation) measurement. Orthogonal Partial Least Squares
Discriminant Analysis (OPLS-DA) was performed using data acquired by LCMS-IT-TOF measurement of electrolyte A and electrolyte B (n=3) to find the compounds generated in electrolyte B. Then, those compounds were identified chemical formula using software “Formula Predictor” (Shimadzu Corporation). SIMCA-P+ (Umetrics) and Profiling Solution (Shimadzu Corporation) were used for OPLS-DA (Scheme).
e- e-
Li xC6 Li -xMO2
Li + Anode Cathode
Separator
Electrolyte
M=Mn. Co, Ni
0
0.5
1
1.5
2
2.5
3
0 5 10 15 20 25 30 35 Cycle Number
Cap
acity
/ m
Ah Charge Discharge
(a) (b)
Electrolyte
Fig. 1 Rechargeable lithium-ion battery component of lithium-ion battery (a), a decrease in the capacitance of battery (b).
1. Acquisition of the high mass accuracy MSn data (LCMS-IT-TOF)
3. Searching of degradation products (SIMCA-P+)
2. Peak alignment and generation of peak list (Profiling Solution)
Scheme Work flow of the analysis of degradation product in electrolyte for LiB
4. Prediction of chemical formula (Formula Predictor)
Structual estimation

3
Results and discussion
Analysis of degradation products in electrolyte for rechargeable lithium-ion battery through high mass accuracy MSn and multivariate statistical technique
MS data of electrolyte A and electrolyte B were acquired using LCMS-IT-TOF under the analytical conditions shown Table 1. On the score plot of OPLS-DA, the group of electrolyte A and electrolyte B were located at left side and right side, respectively (Figure 2-(a)). 15 unique ions of electrolyte B were observed at right side on S-plot (Figure 2-(b)). And, those ions were not detected on the extracted ion chromatogram (EIC) of electrolyte A (Fig. 3). These results suggested that those ions were degradation products generated in the electrolyte of lithium-ion battery repeated charge and discharge 30 cycles.
: Shim-pack FC-ODS (2.0 mmI.D.x150 mm, 3 mm) : water: 0.2 mL/min: 40°C : methanol : 5%B (0 min) → 55%B (30 min) → 5%B (30.01 min) : 1 µL : ESI(+) : 4.5 kV : 200°C : 200°C : 1.5 L/min : 0.1 MPa : m/z 80 - 1000
Column Flow rate Column temp. Mobile phaseA Mobile phaseB Time prog.Injection volume Ionization mode Probe voltage CDL temperature BH temperature Nebulizing gas Drying gasScan range
Table 1 LCMS analytical conditions
(M+H)+
(M+NH4)+
(M+Na) +
(M+K) +
255.0 260.0 265.0 270.0 275.0 280.0 285.0 290.0 295.0 300.0 305.0 310.0 315.0 m/z 0.0
0.5
1.0
1.5
2.0
2.5
3.0
3.5
Inten. (x10,000,000)
289.0529
284.0982
305.0251
267.0707
17.0275
21.9822
37.9544
C H 3 O
O
O O O
O O
O
O C H 3
-20000
-15000
-10000
-5000
0
5000
10000
15000
20000
-40000 -30000 -20000 -10000 0 10000 20000 30000 40000
to[1
]
t[1] R2X[1] = 0.674304
a1
a2 a3
b4
b5 b6
Electrolyte A Electrolyte B
-1.0
-0.8
-0.6
-0.4
-0.2
-0.0
0.2
0.4
0.6
0.8
1.0
-0.10 -0.08 -0.06 -0.04 -0.02 0.00 0.02 0.04 0.06 0.08 0.10 0.12 0.14 0.16 0.18 0.20 0.22 0.24 0.26 0.28
p(co
rr)[1
]
w[1] R2X[1] = 0.674304
1
2
3
4
5 15
6 7 8
9
10 11
12
13 14
Electrolyte B
0.0 2.5 5.0 7.5 10.0 12.5 15.0 17.5 20.0 22.5 25.0 27.5 30.0 min 0.0
1.0
2.0
3.0
4.0
5.0
6.0
7.0
(x10,000,000)
0.0 2.5 5.0 7.5 10.0 12.5 15.0 17.5 20.0 22.5 25.0 27.5 30.0 min 0.0
1.0
2.0
3.0
4.0
5.0
6.0
7.0
(x10,000,000)
Electrolyte A
Fig. 2 The result of OPLS-DA, score plot (a), S-plot (b)
(a)
(b)
(a)
(b)
Fig. 3 EICs of ions detected in Electrolyte B (b) These ions were not detected on EIC of electrolyte A (a).
Fig. 4 MS data and predicted structure of peak number 2 (m/z 284.0982) being one of 15 unique ions of electrolyte B

4
ConclusionIt was clear that the chemical species of degradation products generated in the electrolyte with increasing charge and discharge cycles were carbonate and phosphate from result of this study. The formulae of 15 degradation products detected in Electrolyte B were identified as below.
Analysis of degradation products in electrolyte for rechargeable lithium-ion battery through high mass accuracy MSn and multivariate statistical technique
The formula of peak number 2 (m/z 284.0982) being one of 15 unique ions of electrolyte B was predicted as C9H14O9 (polycarbonate) using high mass accuracy MS data and formula predictor. Indeed, the structure of C9H14O9 was predicted as H3C-(OCO2-C2H4)2-OCO-CH3 referring to some articles on degradation products in electrolyte. MSn
of the ion (m/z 284.0982) also was measured to determine the validity of the predicted chemical structure. Each product ions and neutral loss in MS2 and MS3 data showed that the predicted structure of C9H14O9 was correct.
By the same method, formula of peak number 13 (m/z 283.0336 ) was identified as C3H7O4P. Structure of it was determined as phosphate shown in Fig. 6.
C9H15O9+
NL: C 5H8O6
Precursor ion : m/z 284.0982 (C9H14O9 +NH4)+
100 200 300 400 500 600 700 800 900 m/z 0.0
1.0
2.0
3.0
4.0 Inten. (x100,000)
267.0701
100 200 300 400 500 600 700 800 900 m/z 0.0
1.0
2.0
3.0
4.0
5.0 Inten. (x10,000)
103.0374
MS
MS2
MS3
100 200 300 400 500 600 700 800 900 m/z 0.0
1.0
2.0
3.0
4.0 Inten. (x10,000,000)
289.0534
284.0983
226.9505 103.0067
C H 3 O
O
O O O
O O
O
O C H 3
C H 3 O
O
O O O
O O
O
O C H 3
C H 3 O
O
O O O
O O
O
O C H 3
NH4+
H+
C4H7O3+
C4H7O3+
H+
-NH3
Fig. 5 MSn data of peak number 2 (m/z 284.0982) detected in electrolyte B
Fig. 6 of Structure peak number 13
Peak No. m/z R.T.(min) Ion species M.W Predicted formula Mass accuracy (ppm)
123456789101112131415
C H 3 O P O
O O
C H 3
C H 3
229.0678284.0982295.1032177.0512400.1458295.056 262.0853185.0577251.1111 269.0162350.1003283.0336381.0938293.0777245.0641
26.64520.401 29.482 6.178 31.29415.83325.37410.05427.41619.87928.4264.385 30.857 28.487 15.713
(M+Na)+(M+NH4)+
(M+H)+
(M+Li)+
(M+NH4)+
(M+Na)+
(M+NH4)+
(M+H)+
(M+H)+
(M+H)+
(M+NH4)+
(2M+Li)+
(M+Na)+
(M+Na)+
(M+Na)+
206294170382272244184250268332138358270222266
C8H14O6
C9H18O9
C11H18O9
C4H11O5PC14H22O12
C8H17O8P C10H13O5P C5H13O5P C8H17O5F3
C7H7O2F6P C8H17O7F4PC3H7O4P C12H23O10P C9H19O7P C8H14O7
-2.62-0.35+1.69+2.92+2.50-1.36+1.53+4.32+2.39-2.60+1.14+4.32-1.57+1.36-0.41

For Research Use Only. Not for use in diagnostic procedures.The content of this publication shall not be reproduced, altered or sold for any commercial purpose without the written approval of Shimadzu. The information contained herein is provided to you "as is" without warranty of any kind including without limitation warranties as to its accuracy or completeness. Shimadzu does not assume any responsibility or liability for any damage, whether direct or indirect, relating to the use of this publication. This publication is based upon the information available to Shimadzu on or before the date of publication, and subject to change without notice.
© Shimadzu Corporation, 2012
First Edition: May, 2012
www.shimadzu.com/an/
Takako Hishiki 1, Tsuyoshi Nakanishi 2 and Makoto
Suematsu 1, 3
1 Department of Biochemistry, School of Medicine,
Keio University, Tokyo, Japan
2 MS Business Unit, Shimadzu Corporation, Kyoto,
Japan
3 Japan Science and Technology Agency, Exploratory
Research for Advanced Technology, Suematsu Gas
Biology Project, Tokyo, Japan
Sensitive detection and quantification of hydrogen sulfide as a gasotransmitter by combining monobromobimane-based derivatization to triple quadrupole LC/MS/MS
ASMS 2012 WP25-512

2
OverviewHydrogen sulfide (H2S) regulates various cellular functions as a gasotransmitter and reliable and accurate quantification of H2S concentration in biological samples is required. Here the quantitative analysis of endogenous H2S level in tissue samples was performed by coupling the monobromobimane-based assay to triple quadrupole
LC/MS/MS. Furthermore, this method has an advantage of the measurement at neutral pH to quantify biologically free-gaseous H2S not acid-labile H2S and this approach is expected to be a useful method to quantify free H2S level in tissue samples.
IntroductionHydrogen sulfide (H2S) is known to be a third gaseous mediator and also to have important roles on a vasodilation in both the peripheral and cerebral circulation. To elucidate various signal transduction pathways elicited by H2S, reliable and accurate measurement of H2S concentration in biological samples becomes increasingly significant. Until now, head space gas analysis using gas chromatography and measurement by polarographic sensor have been
reported to quantify H2S concentration in biological samples. However these approaches often yielded a higher value resulting from acid-labile H2S not from biologically free-gaseous H2S. Here we developed sensitive quantitative analysis of H2S in biological samples, mouse brain tissues by combining a monobromobimane-based derivatization at a neutral pH to SRM (selected reaction monitoring) using triple quadrupole LC/MS/MS.
Methods Thiol-specific derivatization agent monobromobimane was used to quantify the endogenous H2S in brain tissues. Frozen brains from 12-d-old mice were placed in two volumes of ice-cold 5 mM monobromobimane (mBBr) in 10 mM Tris-HCl (pH 7.5) and then homogenized. Methanol was added to precipitate proteins. The mixture was vortexed and centrifuged. A supernatant was desalted by a solid-phase extraction and filtrated through a 5-kDa cutoff filter. An aliquot of 10 µL was analyzed to quantify sulfide-dibimane (SDB), monobromobimane-based derivatives of H2S by LC/MS/MS instrument, Nexera UHPLC system and LCMS-8030 triple quadrupole mass spectrometer. SDB was eluted from an ODS column (150 mmL. X 2.1 mmI.D. 1.7 µm particle size) with a gradient of acetonitrile, detected in negative mode ESI / SRM mode.
Fig. 1 Analytical condition of SRM to quantify endogenous hydrogen sulfide
Sensitive detection and quantification of hydrogen sulfide as a gasotransmitter by combining monobromobimane-based derivatization to triple quadrupole LC/MS/MS
Column : commercially available ODS column (150 mmL. X 2.1 mmI.D. 1.7 mm particle size) Flow rate : 0.2 mL/minColumn temp. : 40°CMobile phase : A) water containing 0.1% formic acid : B) acetonitrile containing 0.1% formic acidTime prog. : 2%B (0 → 5min) → 50%B (23 min) → 100%B (25 → 27 min) → 2%B (28 → 30 min)Ionization mode : ESI negativeDL temp. : 250°CHB temp. : 400°CNebulizing gas flow : 3.0 L/minDrying gas flow : 15 L/minTransition : m/z 413.10 → m/z 191.15 (Q1 : 30 V, CE : 20 V, Q3 : 20 V)

3
Results
Fig. 2 Scheme of the derivatization of hydrogen sulfide with monobromobimane
Fig. 3 MS/MS spectra of SDB standard on various collision energy (CE)
Fig. 4 Calibration curves of SDB and NaHS standard
Fig. 5 MS chromatogram and MS spectrum on SRM of SDB derived from H2S in murine brain tissues
+ HS-
+
+ 2 (Br-)
Sensitive detection and quantification of hydrogen sulfide as a gasotransmitter by combining monobromobimane-based derivatization to triple quadrupole LC/MS/MS
Hydrogen sulfide is derivatized with monobromobimane reagent and forms sulfide-dibimane (SDB). Reacted SDB is stable at room temperature and is measured on SRM analysis. In this study, the transition of SDB was determined at m/z 413 → 191 at CE of 20 V in ESI/negative mode.
(A) A calibration curve of SDB standard. A calibration curve was plotted by dilution series of SDB standard and were linear at a range of 1-5000 nM (R2>0.99).
(B) A calibration curve of NaHS solution forming H2S A calibration curve was also plotted by using the derivatization with mBBr to H2S resulting from NaHS solution. Various concentrations of NaHS were reacted with excess monobromobimane (1 mM) for 10 min on ice.
N N
O
O Br
N N
O
O
N N
O
O S
0 1 2 3 4 5
0
200
400
600
800
1000A
SDB (µm)
Peak
are
a x
103
B
0 1 2 3 4 5
0
200
400
600
800
1000
NaHS (µm)
Peak
are
a x
103
1
2
3
0
10 20 0 5 15 25 100 200 300 400
5
10
0
15
m/z
A
MRM
Retention time (min)
19.2 min
B
SDB m/z 413.1
m/z 191.2 m/z 191.2
MS spectrum on SRM
Inte
nsity
(cps
) x 1
04
Inte
nsity
(cps
) x 1
03
MS chromatogram on SRM
m/z 413.1→191.2

4
Endogenous H2S concentration in neonatal mouse brain was determined by SRM analysis using a monobromobimane-based assay. To quantify H2S level in brain tissues, a calibration curves was plotted by a SDB standard and applied as a external calibration. Fig. 6 shows H2S concentration in WT mouse increased under 6% O2 fraction (hypoxia). On the contrary, the alteration of H2S concentration from heme oxygenase (HO)-2-null mouse brains could not be found between 21% and 6% fraction. Under normoxia, H2S levels were similar in WT and HO-2-null mice, presumably due to compensation from other sources of H2S in the transsulfuration pathway.
Error bar show a standard error (n=9 or 6).*P<0.05 compared with WT at 21% O2.
Sensitive detection and quantification of hydrogen sulfide as a gasotransmitter by combining monobromobimane-based derivatization to triple quadrupole LC/MS/MS
3
2
1
021
9 6 9 6
O2 fraction (%)
Normoxia : 21% O2 fractionHypoxia : 6% O2 fraction
Fig. 6 Endogenous H2S concentration in neonatal brain of both WT and HO-2-null under normoxia/hypoxia
WT*
HO-2-null
6 21 6
SDB
(pm
ol/m
g br
ain)
Hydrogen sulfide is known to be as the gasotransmitter to control multiple biological functions. Therefore reliable and accurate quantitative analysis of H2S level in tissues is required. In this study we performed the quantitative analysis of hydrogen sulfide in mouse brain tissue by coupling the monobromobimane-based assay to triple quadrupole LC/MS/MS.
First analytical condition of SDB was determined on SRM by a SDB standard and then the linearity of calibration curves was validated by using a SDB standard and NaHS reagent forming H2S. Correlation coefficient of these calibration
curve was confirmed to be >0.99 and
The endogenous H2S level in mouse brain tissues was quantified as the derivatized SDB by triple quadrupole LC/MS/MS. This result shows the of the endogenous H2S is at the level of pmol/mg tissue. And the increase of the H2S level in WT mouse was confirmed under the hypoxia. On the other hand, the change of H2S level could not be found in the HO-2-null mouse. These results suggests this quantitative analysis by using triple quadrupole LC/MS/MS coupled with monobromobimane-based assay is helpful to quantify the endogenous H2S level in tissue samples.
Conclusions
(1) Morikawa T, et al. (2012) Hypoxic regulation of the cerebral microcirculation is mediated by a carbon monoxide-sensitive hydrogen sulfide pathway. Proc. Natl. Acad. Sci. U.S.A. 109:1293-1298
References

For Research Use Only. Not for use in diagnostic procedures.The content of this publication shall not be reproduced, altered or sold for any commercial purpose without the written approval of Shimadzu. The information contained herein is provided to you "as is" without warranty of any kind including without limitation warranties as to its accuracy or completeness. Shimadzu does not assume any responsibility or liability for any damage, whether direct or indirect, relating to the use of this publication. This publication is based upon the information available to Shimadzu on or before the date of publication, and subject to change without notice.
© Shimadzu Corporation, 2012
First Edition: May, 2012
www.shimadzu.com/an/

Tsuyoshi Nakanishi 1, Takako Hishiki 2, Shigeki
Kajihara 3, Kiyoshi Ogawa 3 and Makoto Suematsu 2, 4
1 MS Business Unit, Shimadzu Corporation, Kyoto,
Japan
2 Department of Biochemistry, School of Medicine,
Keio University, Tokyo, Japan
3 Technology Research Laboratory, Shimadzu
Corporation, Kyoto, Japan
4 Japan Science and Technology Agency, Exploratory
Research for Advanced Technology, Suematsu Gas
Biology Project, Tokyo, Japan
Metabolite maps reconstructed using a quantitative data by capillary electrophoresis-mass spectrometry (CE-MS)
ASMS 2012 MP15-346
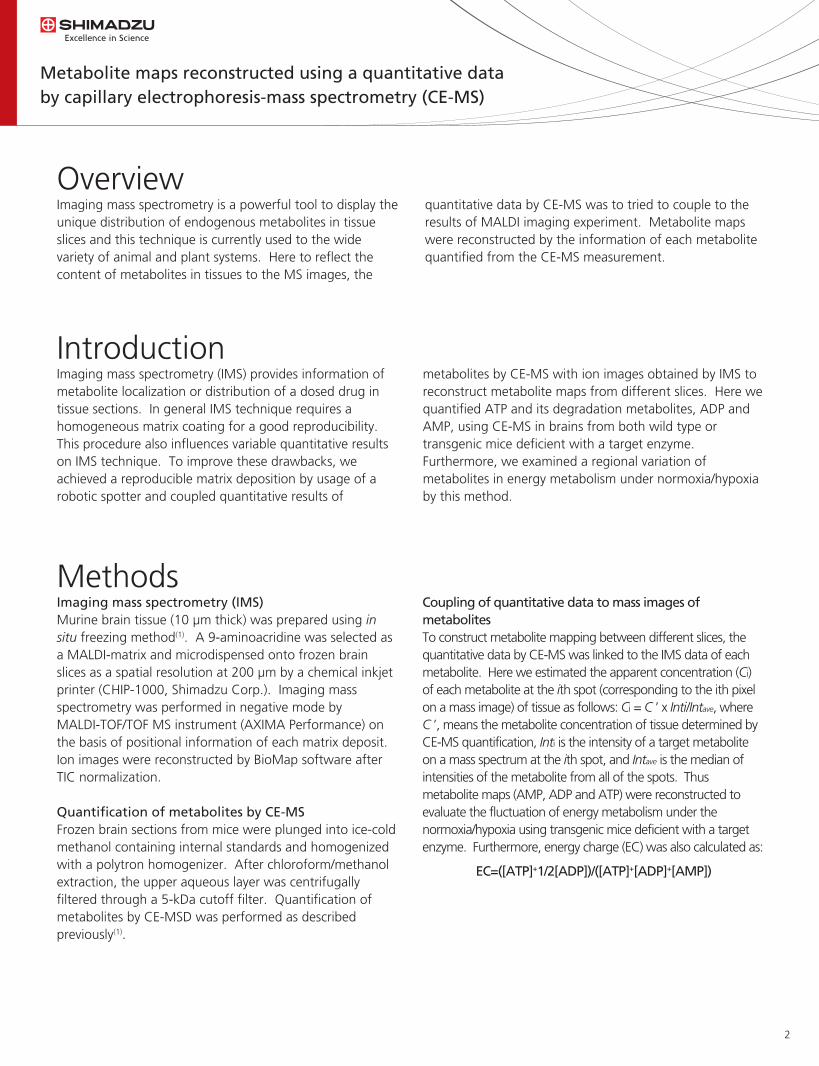
2
OverviewImaging mass spectrometry is a powerful tool to display the unique distribution of endogenous metabolites in tissue slices and this technique is currently used to the wide variety of animal and plant systems. Here to reflect the content of metabolites in tissues to the MS images, the
quantitative data by CE-MS was to tried to couple to the results of MALDI imaging experiment. Metabolite maps were reconstructed by the information of each metabolite quantified from the CE-MS measurement.
IntroductionImaging mass spectrometry (IMS) provides information of metabolite localization or distribution of a dosed drug in tissue sections. In general IMS technique requires a homogeneous matrix coating for a good reproducibility. This procedure also influences variable quantitative results on IMS technique. To improve these drawbacks, we achieved a reproducible matrix deposition by usage of a robotic spotter and coupled quantitative results of
metabolites by CE-MS with ion images obtained by IMS to reconstruct metabolite maps from different slices. Here we quantified ATP and its degradation metabolites, ADP and AMP, using CE-MS in brains from both wild type or transgenic mice deficient with a target enzyme. Furthermore, we examined a regional variation of metabolites in energy metabolism under normoxia/hypoxia by this method.
MethodsImaging mass spectrometry (IMS)Murine brain tissue (10 µm thick) was prepared using in situ freezing method(1). A 9-aminoacridine was selected as a MALDI-matrix and microdispensed onto frozen brain slices as a spatial resolution at 200 µm by a chemical inkjet printer (CHIP-1000, Shimadzu Corp.). Imaging mass spectrometry was performed in negative mode by MALDI-TOF/TOF MS instrument (AXIMA Performance) on the basis of positional information of each matrix deposit. Ion images were reconstructed by BioMap software after TIC normalization.
Quantification of metabolites by CE-MSFrozen brain sections from mice were plunged into ice-cold methanol containing internal standards and homogenized with a polytron homogenizer. After chloroform/methanol extraction, the upper aqueous layer was centrifugally filtered through a 5-kDa cutoff filter. Quantification of metabolites by CE-MSD was performed as described previously(1).
Coupling of quantitative data to mass images of metabolites To construct metabolite mapping between different slices, the quantitative data by CE-MS was linked to the IMS data of each metabolite. Here we estimated the apparent concentration (Ci) of each metabolite at the ith spot (corresponding to the ith pixel on a mass image) of tissue as follows: Ci = C ’ x Inti/Intave, where C ’, means the metabolite concentration of tissue determined by CE-MS quantification, Inti is the intensity of a target metabolite on a mass spectrum at the ith spot, and Intave is the median of intensities of the metabolite from all of the spots. Thus metabolite maps (AMP, ADP and ATP) were reconstructed to evaluate the fluctuation of energy metabolism under the normoxia/hypoxia using transgenic mice deficient with a target enzyme. Furthermore, energy charge (EC) was also calculated as:
EC=([ATP]+1/2[ADP])/([ATP]+[ADP]+[AMP])
Metabolite maps reconstructed using a quantitative data by capillary electrophoresis-mass spectrometry (CE-MS)
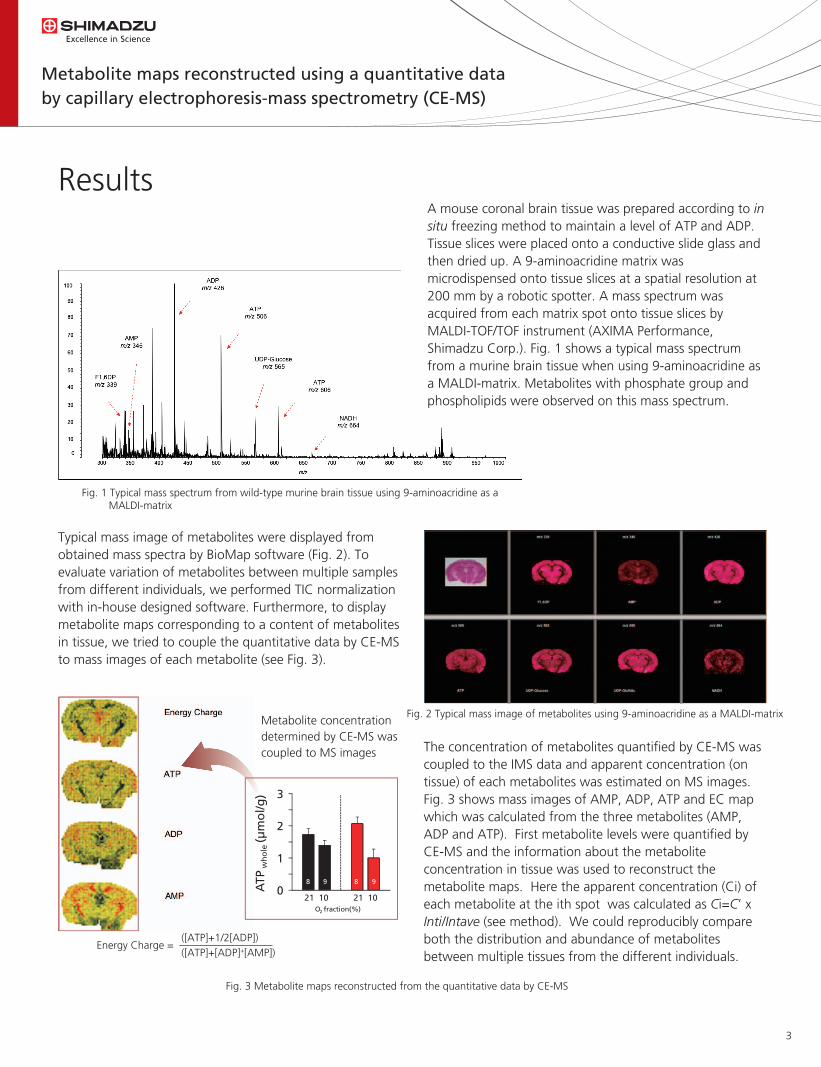
3
Results
Fig. 1 Typical mass spectrum from wild-type murine brain tissue using 9-aminoacridine as a MALDI-matrix
Fig. 2 Typical mass image of metabolites using 9-aminoacridine as a MALDI-matrix
Fig. 3 Metabolite maps reconstructed from the quantitative data by CE-MS
A mouse coronal brain tissue was prepared according to in situ freezing method to maintain a level of ATP and ADP. Tissue slices were placed onto a conductive slide glass and then dried up. A 9-aminoacridine matrix was microdispensed onto tissue slices at a spatial resolution at 200 mm by a robotic spotter. A mass spectrum was acquired from each matrix spot onto tissue slices by MALDI-TOF/TOF instrument (AXIMA Performance, Shimadzu Corp.). Fig. 1 shows a typical mass spectrum from a murine brain tissue when using 9-aminoacridine as a MALDI-matrix. Metabolites with phosphate group and phospholipids were observed on this mass spectrum.
Typical mass image of metabolites were displayed from obtained mass spectra by BioMap software (Fig. 2). To evaluate variation of metabolites between multiple samples from different individuals, we performed TIC normalization with in-house designed software. Furthermore, to display metabolite maps corresponding to a content of metabolites in tissue, we tried to couple the quantitative data by CE-MS to mass images of each metabolite (see Fig. 3).
The concentration of metabolites quantified by CE-MS was coupled to the IMS data and apparent concentration (on tissue) of each metabolites was estimated on MS images. Fig. 3 shows mass images of AMP, ADP, ATP and EC map which was calculated from the three metabolites (AMP, ADP and ATP). First metabolite levels were quantified by CE-MS and the information about the metabolite concentration in tissue was used to reconstruct the metabolite maps. Here the apparent concentration (Ci) of each metabolite at the ith spot was calculated as Ci=C’ x Inti/Intave (see method). We could reproducibly compare both the distribution and abundance of metabolites between multiple tissues from the different individuals.
Metabolite concentration determined by CE-MS was coupled to MS images
Energy Charge =([ATP]+1/2[ADP])([ATP]+[ADP]+[AMP])
0
1
2
3
8 9 8 9
ATP
wh
ole
(µm
ol/g
)
21 10O2 fraction (%)
21 10
Metabolite maps reconstructed using a quantitative data by capillary electrophoresis-mass spectrometry (CE-MS)

4
(A) Alterations in AMP (AMPwhole), ADP (ADPwhole), ATP (ATPwhole), and energy charge (ECwhole) in the whole brain. The concentrations of adenylates were determined by CE-MS. *P < 0.05 compared with WT normoxia; †P <0.05 compared with HO-2-null normoxia. HO-2, heme oxygenase 2(B) Representative IMS showing spatial distribution of apparent ATP concentration (ATPapp) and energy charge (ECreg). Note the basal increase in ATP in HO-2-null mice. (Bottom) H&E staining after IMS. cx, cortex; hp, hippocampus.(C) Quantitative analysis of regional ATP concentration and energy charge in WT and HO-2-null mice. *P < 0.05 compared with WT normoxia; †P < 0.05 compared with HO-2-null normoxia.
From results of quantitative analysis by CE-MS, remarkable decrease of ATP level in HO-2-null mice under the hypoxia was shown in Fig. 4 Furthermore, a value of EC under the hypoxia remained unchanged in WT mice but dropped to <0.5 in the HO-2-null mice.IMS data coupled by CE-MS quantitative results also displayed the characteristic decrease of EC value on the cortex region.
MS images of typical metabolites were displayed on mouse brain tissue (10 µm thick) using 9-aminoacridine as a MALDI-matrix. Then chemical inkjet printer was used for homogenous matrix deposition onto tissue slices and resulted to reproducible MS images between multiple samples.By using the IMS data coupled to the quantitative data of CE-MS measurement, metabolite maps were reconstructed using brain tissue slices from the different individuals. The metabolite maps which were reconstructed on the basis of
the quantitative results by CE-MS, reflect the endogenous concentration of each metabolite. In fact, AMP, ADP and ATP which related to energy metabolism were detected from tissue slices under the normoxia/hypoxia and these MS images displayed an unique alteration on the distribution and the content in WT and a transgenic mouse. These results suggests this developed approach is useful to semiquantitatively evaluate the distribution of metabolites on the IMS experiment.
Conclusions
(1) Hattori K, et al. (2010) Paradoxical ATP elevation in ischemic penumbra revealed by quantitative imaging mass spectrometry. Antioxid Redox Signal 13:1157-1167.
(2) Morikawa T, et al. (2012) Hypoxic regulation of the cerebral microcirculation is mediated by a carbon monoxide-sensitive hydrogen sulfide pathway. Proc. Natl. Acad. Sci. U.S.A. 109:1293-1298.
References
Fig. 4 Impaired ability of HO-2-null mice to maintain ATP levels on exposure to 10% O2 for 1 min
Metabolite maps reconstructed using a quantitative data by capillary electrophoresis-mass spectrometry (CE-MS)

For Research Use Only. Not for use in diagnostic procedures.The content of this publication shall not be reproduced, altered or sold for any commercial purpose without the written approval of Shimadzu. The information contained herein is provided to you "as is" without warranty of any kind including without limitation warranties as to its accuracy or completeness. Shimadzu does not assume any responsibility or liability for any damage, whether direct or indirect, relating to the use of this publication. This publication is based upon the information available to Shimadzu on or before the date of publication, and subject to change without notice.
© Shimadzu Corporation, 2012
First Edition: May, 2012
www.shimadzu.com/an/

Zanariah Hashim1; Yudai Dempo1; Tairo Ogura2;
Ichiro Hirano2; Junko Iida2; Takeshi Bamba1; Eiichiro
Fukusaki1 1Dept.Biotech., Grad. Sch. Eng., Osaka Univ., Suita,
JAPAN; 2Shimadzu corporation, Kyoto , JAPAN
Quantitative analysis of hydrophilic metabolite using ion-paring chromatography with a high-speed triple quadrupole mass spectrometer
ASMS 2012 ThP11-251

2
IntroductionMetabolomics, the comprehensive study of metabolites, allows for detailed phenotypic analysis through a combination of metabolite information. Among the many kinds of metabolic reactions, central pathways to energy metabolism are of the most biologically important pathways, and includes more than a hundred of hydrophilic compounds such as sugar phosphates, organic acids, and nucleotides. Ion-pare chromatography coupled to a triple
quadrupole mass spectrometer is one of the techniques to analyze these hydrophilic metabolites. In order to improve throughput of analysis, high-speed with a quantitative capability is required from the mass spectrometer. In this study, we report a developed analytical system for hydrophilic metabolite using ion-pare chromatography with a high-speed triple quadrupole mass spectrometer.
Materials and Methods
Quantitative analysis of hydrophilic metabolite using ion-paring chromatography with a high-speed triple quadrupole mass spectrometer
Nexera series UHPLCLCMS-8040 triple-quadrupole mass spectrometer10 mM tri-butyl ammonium and 15 mM acetic acid in water/methanol (97/3)methanol0.3 mL/min0%B(0-0.5 min) - 25%B(7.5 min) -90%B(11-11.5 min) - 0%B(11.6-15 min)L-Column ODSII (2 mm I.D. x 150 mmL., 3 µm)40°C3 µL
LCMS-8040 triple-quadrupole mass spectrometerESI negative mode250°C 400°C10 L/min2 L/min
Apparatus:
Mobile phase A:
Mobile phase B:Flow rate:Time program :
Analytical column:Oven temp.:Injection Vol.:
LC-MSApparatus:Ionization: DL Temp.:HB Temp:Drying Gas:Nebulizing Gas:
UHPLC
Fig. 1 LCMS-8040 Triple Quadrupole Mass Spectrometer
Fig. 2 Typical chromatograms of 96 standard compounds.
LCMS-8040Ultra Fast Mass Spectrometer
ResultsQuantitative analysis of standard samplesBy using ion-paring chromatography coupled to high speed triple-quadrupole mass spectrometry, hydrophilic metabolites including sugar phosphates, organic acids, coenzymes, and nucleotides were analyzed successfully within 15 minutes (Fig. 2). In comparison of several brands of ODS column, we chose L-Column ODS in order to favor separation of sugar phosphates. The qualitative capability of the chosen separation method in terms of limit of detection, dynamic range, carry over, and stability are summarised (Table 1).
0.0 2.5 5.0 7.5 10.0 min 0.0
1.0
2.0
3.0
4.0
5.0
6.0 (x100,000)

3
Fig. 3 Typical chromatograms of yeast extract. Figu. 4 Linearity between sample dilution to peak area.
Analysis of yeast extractYeast extracts were analyzed as an experimental model to confirm applicability of the developed method to biological samples. 75 components were detected successfully between concentration range 0.4 – 100,000 nM (compound dependant).
Linearity was also tested through serial dilution to confirm the range of linearity in which metabolites could be quantified (Fig. 4). These results show that this method can detect change of a metabolite quantitatively.
ConclusionsAccelerated quantitative analysis of hydrophilic metabolites was developed that was able to analyse 96 components in 15 minutes. The result of analysis of yeast extract showed
applicability of this method to future studies involving biological samples.
y = 4474.7x-21556R² = 0.9992
peak
are
ayeast extract (%)
G6P
0.0 2.5 5.0 7.5 10.0 min 0.0
0.5
1.0
1.5
2.0
2.5 (×1,000,000)
Quantitative analysis of hydrophilic metabolite using ion-paring chromatography with a high-speed triple quadrupole mass spectrometer
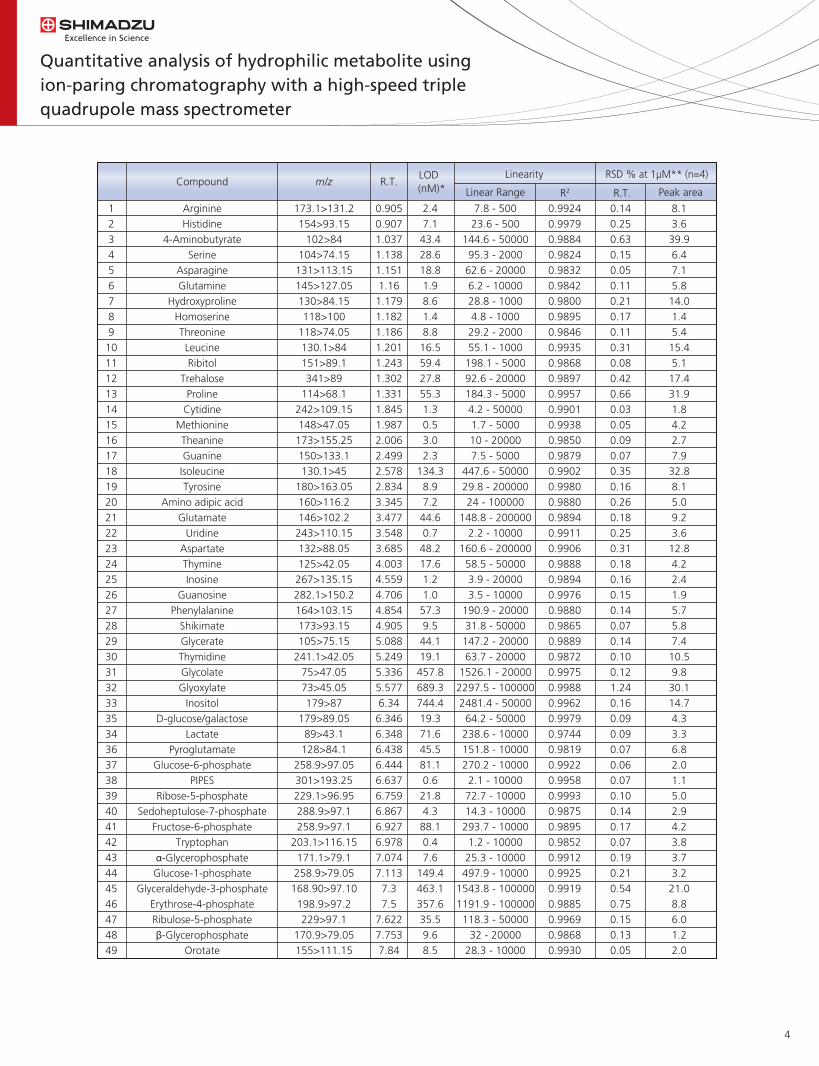
4
ArginineHistidine
4-AminobutyrateSerine
AsparagineGlutamine
HydroxyprolineHomoserineThreonineLeucineRibitol
TrehaloseProline
CytidineMethionineTheanineGuanineIsoleucineTyrosine
Amino adipic acidGlutamate
UridineAspartateThymineInosine
GuanosinePhenylalanine
ShikimateGlycerateThymidineGlycolateGlyoxylate
InositolD-glucose/galactose
LactatePyroglutamate
Glucose-6-phosphatePIPES
Ribose-5-phosphateSedoheptulose-7-phosphate
Fructose-6-phosphateTryptophan
α-GlycerophosphateGlucose-1-phosphate
Glyceraldehyde-3-phosphateErythrose-4-phosphateRibulose-5-phosphateβ-Glycerophosphate
Orotate
173.1>131.2154>93.15
102>84104>74.15131>113.15145>127.05130>84.15118>100
118>74.05130.1>84151>89.1341>89
114>68.1242>109.15148>47.05173>155.25150>133.1130.1>45
180>163.05160>116.2146>102.2243>110.15132>88.05125>42.05267>135.15282.1>150.2164>103.15173>93.15105>75.15
241.1>42.0575>47.0573>45.05179>87
179>89.0589>43.1128>84.1
258.9>97.05301>193.25229.1>96.95288.9>97.1258.9>97.1
203.1>116.15171.1>79.1258.9>79.05168.90>97.10
198.9>97.2229>97.1
170.9>79.05155>111.15
12345678910111213141516171819202122232425262728293031323335343637383940414243444546474849
7.8 - 50023.6 - 500
144.6 - 5000095.3 - 200062.6 - 200006.2 - 1000028.8 - 10004.8 - 100029.2 - 200055.1 - 1000198.1 - 500092.6 - 20000184.3 - 50004.2 - 500001.7 - 500010 - 200007.5 - 5000
447.6 - 5000029.8 - 20000024 - 100000
148.8 - 2000002.2 - 10000
160.6 - 20000058.5 - 500003.9 - 200003.5 - 10000
190.9 - 2000031.8 - 50000147.2 - 2000063.7 - 20000
1526.1 - 200002297.5 - 1000002481.4 - 50000
64.2 - 50000238.6 - 10000151.8 - 10000270.2 - 10000
2.1 - 1000072.7 - 1000014.3 - 10000293.7 - 10000
1.2 - 1000025.3 - 10000497.9 - 10000
1543.8 - 1000001191.9 - 100000
118.3 - 5000032 - 20000
28.3 - 10000
0.9924 0.9979 0.9884 0.9824 0.9832 0.9842 0.9800 0.9895 0.9846 0.9935 0.9868 0.9897 0.9957 0.9901 0.9938 0.9850 0.9879 0.9902 0.9980 0.9880 0.9894 0.9911 0.9906 0.9888 0.9894 0.9976 0.9880 0.9865 0.9889 0.9872 0.9975 0.9988 0.9962 0.9979 0.9744 0.9819 0.9922 0.9958 0.9993 0.9875 0.9895 0.9852 0.9912 0.9925 0.9919 0.9885 0.9969 0.9868 0.9930
LinearityLOD (nM)*
m/z
0.9050.9071.0371.1381.1511.161.1791.1821.1861.2011.2431.3021.3311.8451.9872.0062.4992.5782.8343.3453.4773.5483.6854.0034.5594.7064.8544.9055.0885.2495.3365.5776.346.3466.3486.4386.4446.6376.7596.8676.9276.9787.0747.113
7.37.5
7.6227.7537.84
2.4 7.1 43.4 28.6 18.8 1.9 8.6 1.4 8.8 16.5 59.4 27.8 55.3 1.3 0.5 3.0 2.3
134.3 8.9 7.2 44.6 0.7 48.2 17.6 1.2 1.0 57.3 9.5 44.1 19.1 457.8 689.3 744.4 19.3 71.6 45.5 81.1 0.6 21.8 4.3 88.1 0.4 7.6
149.4 463.1 357.6 35.5 9.6 8.5
R.T.CompoundLinear Range R2 R.T. Peak area
0.14 0.25 0.63 0.15 0.05 0.11 0.21 0.17 0.11 0.31 0.08 0.42 0.66 0.03 0.05 0.09 0.07 0.35 0.16 0.26 0.18 0.25 0.31 0.18 0.16 0.15 0.14 0.07 0.14 0.10 0.12 1.24 0.16 0.09 0.09 0.07 0.06 0.07 0.10 0.14 0.17 0.07 0.19 0.21 0.54 0.75 0.15 0.13 0.05
8.1 3.6 39.9 6.4 7.1 5.8 14.0 1.4 5.4 15.4 5.1 17.4 31.9 1.8 4.2 2.7 7.9 32.8 8.1 5.0 9.2 3.6 12.8 4.2 2.4 1.9 5.7 5.8 7.4 10.5 9.8 30.1 14.7 4.3 3.3 6.8 2.0 1.1 5.0 2.9 4.2 3.8 3.7 3.2 21.0 8.8 6.0 1.2 2.0
Quantitative analysis of hydrophilic metabolite using ion-paring chromatography with a high-speed triple quadrupole mass spectrometer
RSD % at 1µM** (n=4)

5
Fructose-1-phosphateCMPNAD
PyruvateDihydroxy acetone-3-phosphate
UMPGMP
OxalacetateTMPAMP
NicotinatePantothenate
SuccinateFumarate
cAMPMalate
UDP-glucose2-Oxoglutarate
CDP6-Phosphogluconate
ADP-glucoseGDPUDP
ADP-riboseNADPKDPG
3-PhosphoglycerateFructose-2,6-bisphosphateFructose-1,6-bisphosphate
NADHRibulose-1,5-bisphosphate
IsocitrateCitrateADP
PhosphoenolpyruvateFMN
2-IsopropylmalateFADCTPGTP
NADPHUTPATP
Coenzyme AMalonyl coenzyme AAcetyl coenzyme A
Succinyl coenzyme A
258.9>97.05322>79.1
662.1>540.187>43.05
168.9>97.05322.9>97.1362>79.1131>87
321>79.1346>79.05122>78.15
218>88117>73.2115>71.1328>134.1
132.9>115.2564.8>323.1145>101.2
401.8>79.05275>79
588>346.15442>79.1
402.9>79.05558>346.15741.8>620.1256.9>97.05184.9>97.05338.9>241.15
338.9>97.1664>78.95
308.9>97.05190.9>117190.9>87
425.9>79.1167>78.95455>97.1175>115.2783.9>97.1481.9>159.1521.9>159.05
744>159482.9>159.1505.9>159.1
766.5>79852.1>408.1
808>408866>408
5051525354555657585960616263646566676869707172737475767778798081828384858687888990919293949596
260.1 - 1000059.5 - 10000
5 - 10000427.7 - 2000018.7 - 2000037.9 - 20000102.3 - 50000
27944.7 - 50000030.9 - 50000
101.6 - 10000019.1 - 50003.4 - 5000
20.5 - 10000897.7 - 500000
2.3 - 5000019.8 - 10000
2 - 500082 - 1000094 - 5000
29.2 - 2000160.8 - 5000
3.5 - 50044.9 - 1000
6.1 - 50016.1 - 200040.4 - 1000026.2 - 2000089.4 - 500043.8 - 200012.7 - 200051.6 - 1000015.8 - 5000151.3 - 200077.1 - 200021.4 - 1000067.4 - 500017.6 - 500010.4 - 1000147 - 50000
254.1 - 5000015 - 2000
175.4 - 100000119.5 - 5000056.9 - 200002.1 - 100005.5 - 100001.1 - 10000
0.9968 0.9925 0.9844 0.9871 0.9873 0.9917 0.9909 0.9961 0.9966 0.9945 0.9914 0.9934 0.9881 0.9923 0.9900 0.9959 0.9919 0.9825 0.9875 0.9836 0.9870 0.9913 0.9820 0.9969 0.9722 0.9906 0.9802 0.9728 0.9865 0.9744 0.9785 0.9789 0.9915 0.9938 0.9764 0.9774 0.9976 0.9909 0.9840 0.9963 0.9960 0.9914 0.9851 0.9863 0.9923 0.9894 0.9832
LinearityLOD (nM)*
m/z
7.9257.9648.2438.2758.3918.6618.9959.319.7199.8119.98310.02210.15510.27810.46510.57810.71210.74510.75310.77110.80610.80610.80710.8110.81110.82810.82910.83410.83810.87610.88710.89110.89210.91310.92810.98510.99811.15511.17111.18511.20111.20611.22611.34311.36711.38211.391
78.0 17.8 1.5
128.3 5.6 11.4 30.7
8383.4 9.3 30.5 5.7 1.0 6.1
269.3 0.7 5.9 0.6 24.6 28.2 8.8 48.2 1.0 13.5 1.8 4.8 12.1 7.8 26.8 13.1 3.8 15.5 4.8 45.4 23.1 6.4 20.2 5.3 3.1 44.1 76.2 4.5 52.6 35.8 17.1 0.6 1.6 0.3
R.T.CompoundLinear Range R2 R.T. Peak area
RSD % at 1µM** (n=4)
0.10 0.09 0.06 0.05 0.09 0.05 0.08 0.02 0.04 0.03 0.05 0.04 0.05 0.05 0.03 0.04 0.03 0.04 0.04 0.07 0.06 0.02 0.03 0.03 0.03 0.04 0.03 0.03 0.04 0.03 0.02 0.03 0.09 0.02 0.03 0.01 0.02 0.01 0.10 0.15 0.02 0.03 0.24 0.02 0.01 0.02 0.02
3.0 3.4 2.1 9.9 1.1 5.0 9.9 4.6 3.2 10.5 4.0 8.0 4.7 15.3 3.7 4.8 5.5 4.1 7.5 20.4 8.0 4.7 5.7 7.2 3.9 8.1 6.4 10.2 0.5 7.6 7.7 12.9 11.7 7.2 6.4 1.9 2.9 3.3 14.3 11.0 5.2 6.7 12.1 11.3 7.0 7.2 9.5
Quantitative analysis of hydrophilic metabolite using ion-paring chromatography with a high-speed triple quadrupole mass spectrometer

For Research Use Only. Not for use in diagnostic procedures.The content of this publication shall not be reproduced, altered or sold for any commercial purpose without the written approval of Shimadzu. The information contained herein is provided to you "as is" without warranty of any kind including without limitation warranties as to its accuracy or completeness. Shimadzu does not assume any responsibility or liability for any damage, whether direct or indirect, relating to the use of this publication. This publication is based upon the information available to Shimadzu on or before the date of publication, and subject to change without notice.
© Shimadzu Corporation, 2012
First Edition: May, 2012
www.shimadzu.com/an/

Tetsuo Tanigawa, Tairo Ogura, Ichiro Hirano, Junko
Iida
Shimadzu corporation, Kyoto , JAPAN
Analysis of trace amount of 17-β-Estradiol and its metabolites in aqueous samples using online-SPE and accurate MSn analysis
ASMS 2012 MP21 - 527
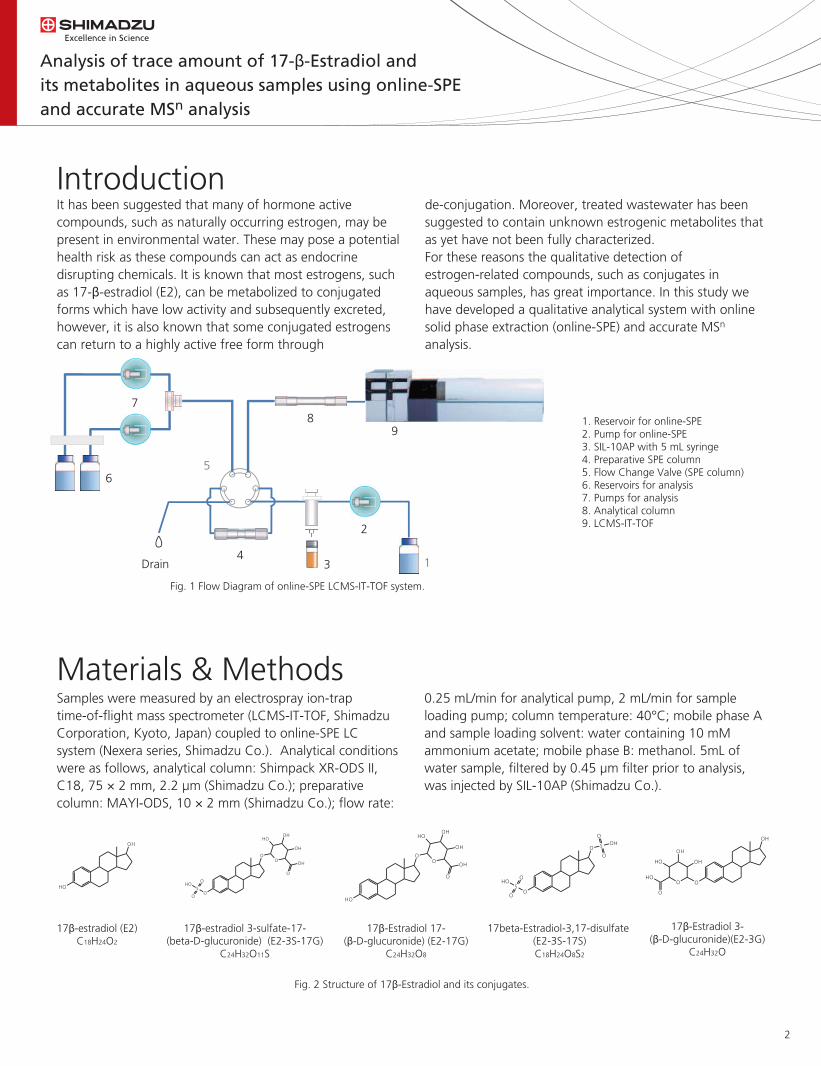
2
IntroductionIt has been suggested that many of hormone active compounds, such as naturally occurring estrogen, may be present in environmental water. These may pose a potential health risk as these compounds can act as endocrine disrupting chemicals. It is known that most estrogens, such as 17-β-estradiol (E2), can be metabolized to conjugated forms which have low activity and subsequently excreted, however, it is also known that some conjugated estrogens can return to a highly active free form through
de-conjugation. Moreover, treated wastewater has been suggested to contain unknown estrogenic metabolites that as yet have not been fully characterized.For these reasons the qualitative detection of estrogen-related compounds, such as conjugates in aqueous samples, has great importance. In this study we have developed a qualitative analytical system with online solid phase extraction (online-SPE) and accurate MSn analysis.
Analysis of trace amount of 17-β-Estradiol and its metabolites in aqueous samples using online-SPE and accurate MSn analysis
Fig. 1 Flow Diagram of online-SPE LCMS-IT-TOF system.
17β-estradiol (E2)C18H24O2
17β-estradiol 3-sulfate-17-(beta-D-glucuronide) (E2-3S-17G)
C24H32O11S
17β-Estradiol 17-(β-D-glucuronide) (E2-17G)
C24H32O8
17beta-Estradiol-3,17-disulfate(E2-3S-17S)C18H24O8S2
17β-Estradiol 3-(β-D-glucuronide)(E2-3G)
C24H32O
Fig. 2 Structure of 17β-Estradiol and its conjugates.
1. Reservoir for online-SPE2. Pump for online-SPE3. SIL-10AP with 5 mL syringe4. Preparative SPE column 5. Flow Change Valve (SPE column)6. Reservoirs for analysis7. Pumps for analysis8. Analytical column9. LCMS-IT-TOF
Materials & MethodsSamples were measured by an electrospray ion-trap time-of-flight mass spectrometer (LCMS-IT-TOF, Shimadzu Corporation, Kyoto, Japan) coupled to online-SPE LC system (Nexera series, Shimadzu Co.). Analytical conditions were as follows, analytical column: Shimpack XR-ODS II, C18, 75 × 2 mm, 2.2 µm (Shimadzu Co.); preparative column: MAYI-ODS, 10 × 2 mm (Shimadzu Co.); flow rate:
0.25 mL/min for analytical pump, 2 mL/min for sample loading pump; column temperature: 40°C; mobile phase A and sample loading solvent: water containing 10 mM ammonium acetate; mobile phase B: methanol. 5mL of water sample, filtered by 0.45 µm filter prior to analysis, was injected by SIL-10AP (Shimadzu Co.).
6
7
5
8
1
2
3
9
4 Drain
OH
OH
OO
O
OH
OH
OHOH
OH
OH
OO
O
OH
OH
OH
OH
O
O
S OH
O
O
SOH
O
O
OO
O
OH
OH
OHOH
OS
OH
O
O
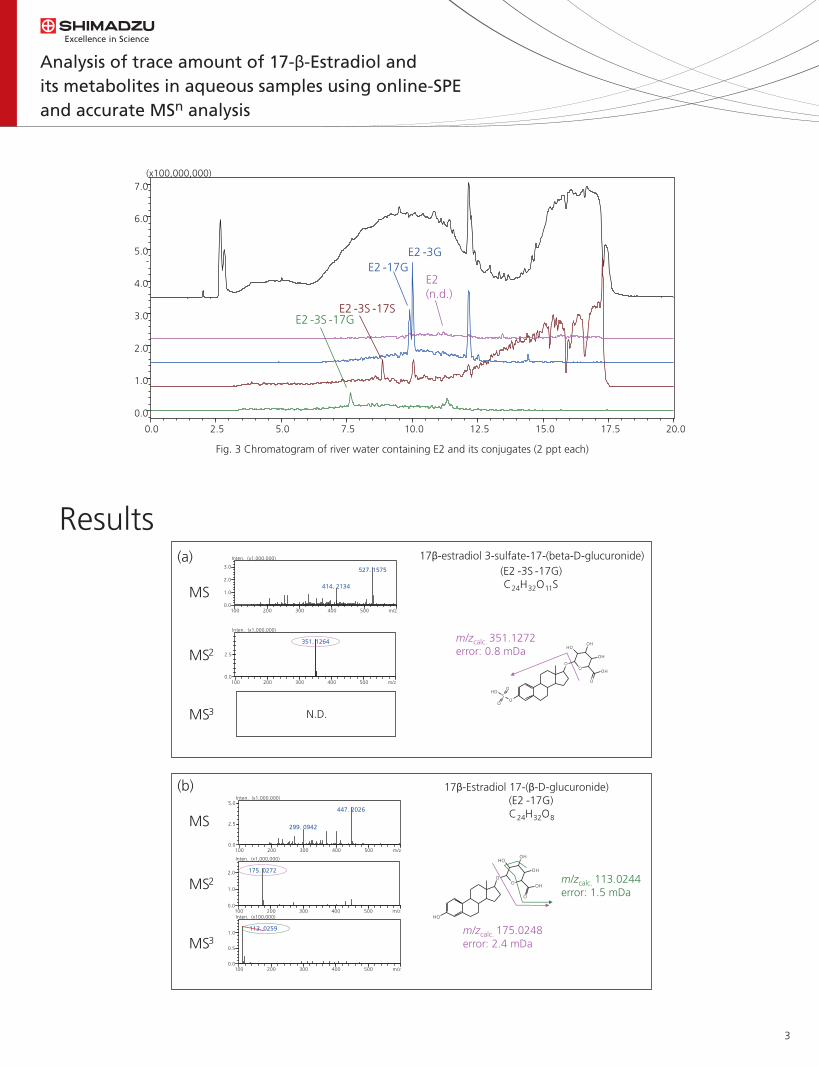
Fig. 3 Chromatogram of river water containing E2 and its conjugates (2 ppt each)
Results
0.0 2.5 5.0 7.5 10.0 12.5 15.0 17.5 20.0
0.0
1.0
2.0
3.0
4.0
5.0
6.0
7.0 (x100,000,000)
E2 -3S -17G E2 -3S -17S
E2 -17G E2 -3G
E2 (n.d.)
17β-Estradiol 17-(β-D-glucuronide) (E2 -17G) C24H32O8
100 200 300 400 500 m/z0.0
2.5
Inten. (x1,000,000)
351. 1264
N.D.
100 200 300 400 500 m/z0.0
1.0
2.0
Inten. (x1,000,000)
175. 0272
100 200 300 400 500 m/z0.0
2.5
5.0Inten. (x1,000,000)
447. 2026
299. 0942
100 200 300 400 500 m/z0.0
0.5
1.0
Inten. (x100,000)
113. 0259
m/zcalc. 351.1272 error: 0.8 mDa
OO
O
OH
OH
OHOH
OS
OH
O
O
OO
O
OH
OH
OHOH
OH
m/zcalc. 175.0248 error: 2.4 mDa
m/zcalc. 113.0244 error: 1.5 mDa
100 200 300 400 500 m/z0.0
1.0
2.0
3.0
Inten. (x1,000,000)
527. 1575
414. 2134
17β-estradiol 3-sulfate-17-(beta-D-glucuronide) (E2 -3S -17G)
C24H32O11S
(a)
MS2
MS3
MS
(b)
MS2
MS3
MS
Analysis of trace amount of 17-β-Estradiol and its metabolites in aqueous samples using online-SPE and accurate MSn analysis
3
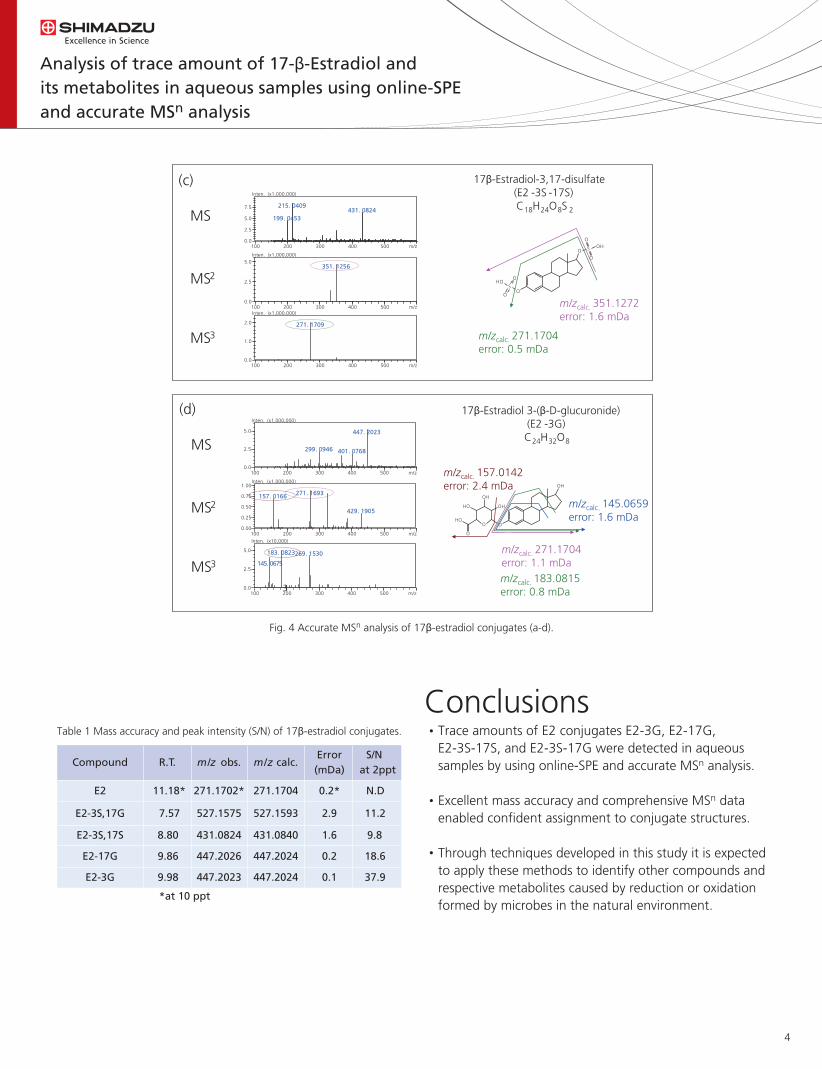
4
3
17β-Estradiol 3-(β-D-glucuronide) (E2 -3G) C24H32O8
100 200 300 400 500 m/z0.0
2.5
5.0
Inten. (x10,000)
183. 0823269. 1530
100 200 300 400 500 m/z0.0
2.5
5.0
7.5
Inten. (x1,000,000)
215. 0409431. 0824
199. 0453
100 200 300 400 500 m/z0.0
2.5
5.0Inten. (x1,000,000)
351. 1256
100 200 300 400 500 m/z0.0
1.0
2.0
Inten. (x1,000,000)
271. 1709
100 200 300 400 500 m/z0.0
2.5
5.0
Inten. (x1,000,000)
447. 2023
299. 0946 401. 0768
100 200 300 400 500 m/z0.00
0.25
0.50
0.75
1.00Inten. (x1,000,000)
271. 1693157. 0166
429. 1905
O
O
S OH
O
O
SOH
O
O
m/zcalc. 351.1272 error: 1.6 mDa
m/zcalc. 271.1704 error: 1.1 mDa
OH
OO
O
OH
OH
OH
OH
m/zcalc. 271.1704 error: 0.5 mDa
m/zcalc. 157.0142 error: 2.4 mDa
m/zcalc. 183.0815 error: 0.8 mDa
145. 0675
m/zcalc. 145.0659error: 1.6 mDa
(d)
MS2
MS3
MS
(c)
MS2
MS3
MS
17β-Estradiol-3,17-disulfate (E2 -3S -17S) C18H24O8S 2
ConclusionsTrace amounts of E2 conjugates E2-3G, E2-17G, E2-3S-17S, and E2-3S-17G were detected in aqueous samples by using online-SPE and accurate MSn analysis.
Excellent mass accuracy and comprehensive MSn data enabled confident assignment to conjugate structures.
Through techniques developed in this study it is expected to apply these methods to identify other compounds and respective metabolites caused by reduction or oxidation formed by microbes in the natural environment.
Fig. 4 Accurate MSn analysis of 17β-estradiol conjugates (a-d).
Table 1 Mass accuracy and peak intensity (S/N) of 17β-estradiol conjugates.
Compound R.T. m/z obs. m/z calc. Error(mDa)
S/N at 2ppt
E2 11.18* 271.1702* 271.1704 0.2* N.D
E2-3S,17G 7.57 527.1575 527.1593 2.9 11.2
E2-3S,17S 8.80 431.0824 431.0840 1.6 9.8
E2-17G 9.86 447.2026 447.2024 0.2 18.6
E2-3G 9.98 447.2023 447.2024 0.1 37.9
*at 10 ppt
Analysis of trace amount of 17-β-Estradiol and its metabolites in aqueous samples using online-SPE and accurate MSn analysis

For Research Use Only. Not for use in diagnostic procedures.The content of this publication shall not be reproduced, altered or sold for any commercial purpose without the written approval of Shimadzu. The information contained herein is provided to you "as is" without warranty of any kind including without limitation warranties as to its accuracy or completeness. Shimadzu does not assume any responsibility or liability for any damage, whether direct or indirect, relating to the use of this publication. This publication is based upon the information available to Shimadzu on or before the date of publication, and subject to change without notice.
© Shimadzu Corporation, 2012
First Edition: May, 2012
www.shimadzu.com/an/

Yoshiyuki Watabe1; Tairo Ogura1; Ichiro Hirano1;
Shoji F. Nakayama2
1Shimadzu corporation, Kyoto , JAPAN; 2National Institute for Environmental Studies,
Tsukuba, JAPAN
Analysis of phthalate esters in environmental water samples by online-SPE-LC coupled with high-speed triple quadruple mass spectrometer
ASMS 2012 MP21 - 528
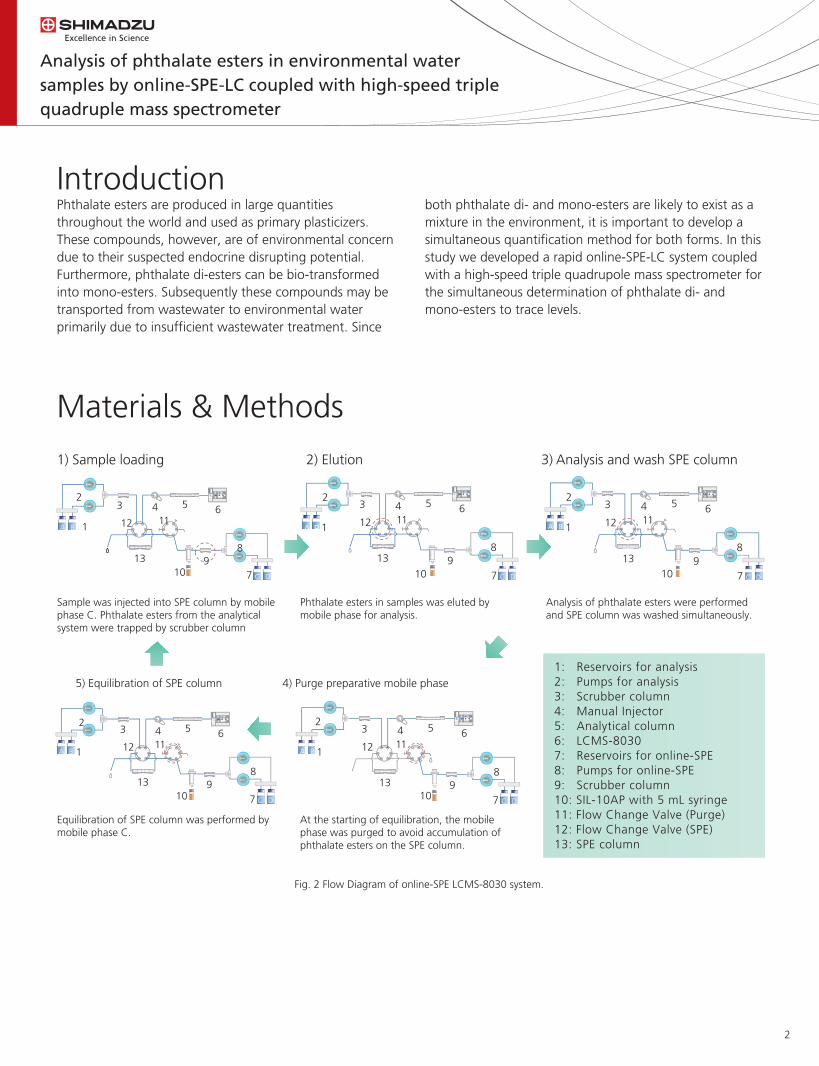
2
IntroductionPhthalate esters are produced in large quantities throughout the world and used as primary plasticizers. These compounds, however, are of environmental concern due to their suspected endocrine disrupting potential. Furthermore, phthalate di-esters can be bio-transformed into mono-esters. Subsequently these compounds may be transported from wastewater to environmental water primarily due to insufficient wastewater treatment. Since
both phthalate di- and mono-esters are likely to exist as a mixture in the environment, it is important to develop a simultaneous quantification method for both forms. In this study we developed a rapid online-SPE-LC system coupled with a high-speed triple quadrupole mass spectrometer for the simultaneous determination of phthalate di- and mono-esters to trace levels.
Analysis of phthalate esters in environmental water samples by online-SPE-LC coupled with high-speed triple quadruple mass spectrometer
Fig. 2 Flow Diagram of online-SPE LCMS-8030 system.
Materials & Methods
Sample was injected into SPE column by mobile phase C. Phthalate esters from the analytical system were trapped by scrubber column
Phthalate esters in samples was eluted by mobile phase for analysis.
Analysis of phthalate esters were performed and SPE column was washed simultaneously.
Equilibration of SPE column was performed by mobile phase C.
At the starting of equilibration, the mobile phase was purged to avoid accumulation of phthalate esters on the SPE column.
1: Reservoirs for analysis2: Pumps for analysis3: Scrubber column 4: Manual Injector5: Analytical column6: LCMS-80307: Reservoirs for online-SPE8: Pumps for online-SPE9: Scrubber column10: SIL-10AP with 5 mL syringe11: Flow Change Valve (Purge)12: Flow Change Valve (SPE)13: SPE column
3) Analysis and wash SPE column
12
5
7
8
10
3 4 6 11
9 13
1) Sample loading
C D
2) Elution
12
5
7
8
10
3 4 6 11
9 13
1
2
A B 1
2
12
5
10
3 4 6 11
9 13
4) Purge preparative mobile phase
1
2
12
5
10
3 4 6 11
9 13
A B
5) Equilibration of SPE column
1
2
12
5
10
3 4 6 11
9 13
A B
C D
A B 1
2
A B
7
8
C
7
8
C D
7
8
C D
D

3
MMPMEP
MEHHPMnBPMBzPMEHPMOPMNPDMPDEPDBP
DEHPDOPBzBP
2.853.655.325.575.737.878.128.144.956.428.9212.0412.308.71
100-1000020-1000010-1000010-100005-100005-100005-100005-100002-100005-1000050-1000020-1000020-100005-10000
0.99970.99950.99960.99910.99740.99940.99780.99870.99970.99910.99980.99560.99660.9994
R2Linear range (ng/L)RT (min)
69.5 ± 11.6103.6 ± 14.6
72.8 ± 0.1133.9 ± 16.1
89.2 ± 3.568.3 ± 12.7
53.3 ± 255.6 ± 12.697.4 ± 5.1
100.8 ± 17.8101.1 ± 15.5105.3 ± 19.6105.4 ± 4.7115.5 ± 9.8
Recovery (%) at 500 ng/L*Compound RSD (%) at LOQ
9.314.213.011.112.78.514.217.817.48.44.28.47.219.7
Method performance characteristics in river water.
Development of analytical system.
*Recovery(%) = peak area of each components loaded by online - SPE (500 ng/L x 1 mL)
peak area of each components loaded by manual injector (100 µg/L x 5 µL)
Analysis of phthalate esters in environmental water samples by online-SPE-LC coupled with high-speed triple quadruple mass spectrometer
Fig. 2 Typical chromatogram of standard sample and blank samples.
ResultsHigh speed simultaneous analysis of phthalate esters was achieved by using high speed polarity switching (10msec) technology. Background contaminations were minimized with a scrubber column inserted after a mixing chamber.
Background peaks were however still detected with the scrubber column in place suggested that auto-sampler and valves can also a source of contamination for DBP, DEHP, DOP.
0.0 1.0 2.0 3.0 4.0 5.0 6.0 7.0 8.0 9.0 10.0 11.0 12.0 13.0 14.0 min 0
50000
100000
150000
200000
250000
300000
0.0 1.0 2.0 3.0 4.0 5.0 6.0 7.0 8.0 9.0 10.0 11.0 12.0 13.0 14.0 min 0
50000
100000
150000
200000
250000
300000
Load
Elution from SPE column
Separation by gradient elution Equilibration Analysis
SPE Wash SPE column Purge flow line & Equilibration
0.0 2.5 5.0 7.5 10.0 12.5 min 0
50000
100000
150000
200000
250000
STD (500 ng/L each, with Scrubber) x50 magnify for monoesters
Blank water (with Scrubber) x50 magnify for monoesters
Blank water (without Scrubber) x50 magnify for monoesters
MMP MEP
DMP
MnBP
MBzP
DEP
MEHP MBzP
MNP BzBP
DBP
DEHP
DOP
DMP (<2ng/L)
DEP (<5ng/L)
BzBP (n.d.)
DBP (137ng/L)
DEHP (659ng/L)
DOP (739ng/L)
Phthalate mono-esters were not detected
Phthalate mono-esters were not detected
DMP (85ng/L)
DEP (40ng/L)
BzBP (20ng/L)
DBP (761ng/L)
DEHP (3002ng/L)
DOP (3782ng/L)

4
ConclusionsA novel simultaneous analysis method of phthalate di- and mono-esters combined with online-SPE was developed.The cycle time including online-SPE and column separation was 15 minutes.Background contamination from online-SPE and LCMS system were successfully minimized.Further method validation, including assessment of column life of SPE and recovery at several concentrations is underway.
Monomethylphthalate
Monomethylphthalate
monoethylphthalate
monoethylphthalate
monoethylhydroxyhexylphthalate
monoethylhydroxyhexylphthalate
monobutylphthalate
monobutylphthalate
monobenzylphthalate
monobenzylphthalate
monoethylhexylphthalate
monoethylhexylphthalate
Compound name
MMP-N
MMP-IS
MEP-N
MEP-IS
MEHHP-N
MEHHP-IS
MnBP-N
MnBP-IS
MBzP-N
MBzP-IS
MEHP-N
MEHP-IS
Abbreviation
200
200
50
50
30
30
30
30
30
30
30
30
Dwell
Time
77.3
79.3
77.3
79.3
121.2
124.2
77.3
79.3
77.3
79.3
134.3
137.3
Q3
m/z
11
11
19
19
18
18
20
20
23
23
14
14
Q1
m/z
Q1
m/z
179
183
193
197
293
297
221
225
255
259
277
281
+/-
-
-
-
-
-
-
-
-
-
-
-
-
Compound name Abbreviation Dwell
Time
Q3
m/z
Q1
m/z
Q1
m/z+/-
monooctylphthalate
monooctylphthalate
monononylphthalate
monononylphthalate
dimethylphthalate
diethylphthalate
dibutylphthalate
dioctylphthalate
diethylhexylphthalate
benzylbutylphthalate
MOP-N
MOP-IS
MNP-N
MNP-IS
DMP-N
DEP-N
DBP-N
DOP-N
DEHP-N
BzBP-N
30
30
30
30
3
3
3
50
50
3
77.3
79.3
141.3
141.3
163.1
149.05
149.05
149.05
149.05
91.1
26
26
19
19
-11
-20
-17
-23
-23
-25
277
281
291
295
195
223.1
279.2
391.3
391.3
313.2
-
-
-
-
+
+
+
+
+
+
Analysis of phthalate esters in environmental water samples by online-SPE-LC coupled with high-speed triple quadruple mass spectrometer
Mobile phase A:Mobile phase B:Scrubber column:
Analytical column:
Time program :
Flow rate:Oven temp.:
Ionization:
DL Temp.: Drying Gas:Pause time:Monitoring ion, Collision energy, Dwelltime:
0.1% formic acid in waterAcetonitrileShim-pack XR-ODSII (2 mm I.D. x 50 mmL., 2.2 µm)Shim-pack XR-ODSII (2 mm I.D. x 75 mmL., 2.2 µm)30%B(0-2.5 min)→98%B(10-12.5 min)→30%B(12.1-15 min)0.25 mL/min40°C
ESI pos./neg. polarity switching (pos. for di-esters, neg. for mono-esters)250°C BH Temp: 400°C10 L/min Nebulize Gas: 2 L/min3 msec Polarity switching: 10msec See below
LC conditions
Mobile phase A:Mobile phase B:Scrubber column:
Preparative column:
Flow rate:Injection vol.:
0.1% formic acid in waterAcetonitrileShim-pack XR-ODS (4.6 mm I.D. x 50 mmL., 2.2 µm)
ENV-MASK (Purchased from Chemco Inc.) (2.0 mm I.D. x 10 mmL., 8 µm)2 mL/min1000 µL
online-SPE condition
MS conditions
MRM parameters for target analytes

For Research Use Only. Not for use in diagnostic procedures.The content of this publication shall not be reproduced, altered or sold for any commercial purpose without the written approval of Shimadzu. The information contained herein is provided to you "as is" without warranty of any kind including without limitation warranties as to its accuracy or completeness. Shimadzu does not assume any responsibility or liability for any damage, whether direct or indirect, relating to the use of this publication. This publication is based upon the information available to Shimadzu on or before the date of publication, and subject to change without notice.
© Shimadzu Corporation, 2012
First Edition: May, 2012
www.shimadzu.com/an/

Daisuke Okumura; Manabu Ueda; Tomohito Nakano
Shimadzu Corporation, Nishinokyo-kuwabaracho,
Nakagyo-ku, Kyoto 604-8511, Japan
Development of an ion transmission enhanced tandem ion guide system for triple quadruple mass spectrometer
ASMS 2012 ThP26-584

2
IntroductionThe application of atmospheric pressure ionization sources in mass spectrometry necessitates the presence of a differential pumping system in order to maintain high vacuum in the analyzer. Commercial triple quadrupole mass spectrometers typically have from 3 to 4 differential pumping stages and an RF ion guide is generally utilized as a ion focusing device in the higher pressure region of the ion path. The ions generated under atmospheric pressure
need to be efficiently focused to minimize the loss of ions prior to introduction into quadrupole analyzer by use of an RF lens system. Using a QqQ with 4 differential pumping stages, we have investigated the application of a fringing field in the RF ion guides installed in the second and third differential pumping stages with a resultant improvement in sensitivity by a factor of five.
MethodsThree distinct designs of the tandem quadrupole RF ion
guide in differential pumping stages have been
investigated. In order to examine the characteristics and
performance of these configurations, each RF ion guide
was installed in a triple quadrupole mass spectrometer
(LCMS-8040, Shimadzu Corporation, Kyoto, Japan). Each
tandem RF ion guide system had inscribed radii of a) 1.5
mm, b) 2.0 mm and c) 2.8 mm. Each system has one DC
lens between RF ion guides, and its diameter was 4 mm.
Fig. 2 The optimum operating RF voltage of quadrupole ion
guides was acquired experimentally. The voltages
were 27 V, 50 V and 100V for R= 1.5, 2.0 and 2.8
respectively.
Fig. 1 LCMS-8040 triple quadrupole mass spectrometer.
Fig. 3 Pseudo-potential of each tandem RF ion guide systems.
Development of an ion transmission enhanced tandem ion guide system for triple quadruple mass spectrometer
2R
a) R=1.5 mm b) R=2.0 mm c) R=2.8 mm
0 50 100 150
RF Voltage
Inte
nsity
0 50 100 150
RF Voltage
Inte
nsity
0 50 100 150
RF Voltage
Inte
nsity
-1 -0.5 0 0.5 1
r (mm)
V*
(eV
) R 1.5
R 2.0
R 2.8

3
Fig. 4 Simulated fringing focusing field estimates of smaller R ion guides was found to be more effective than those of larger R. Therefore we have achieved higher sensitivity using smaller R ion guides.
ResultsWe acquired Q1 scan spectra of pesticides at three different scan speeds with flow injection analysis (5000, 10000 and 15000 u/sec). The benefit of the quadrupole ion guide, with it’ s narrower mass range transmission relative
to hexapole and octopole ion guides, was an increase in the absolute intensity of ion species in the Q1 scan at all three scan speeds by a factor of 2-5 times.
Development of an ion transmission enhanced tandem ion guide system for triple quadruple mass spectrometer
LCMS-8040
LCMS-8030
Fig. 5 Q1 scan spectra of pesticides at three different scan speed.
15000 u/sec 10000 u/sec 5000 u/sec
200 300 400 500 600 m/z
0.5
1.0
1.5
2.0 Inten. (x10,000,000)
x 2
x3x 3
x4
x 5
200 300 400 500 600 m/z
0.5
1.0
1.5
2.0 Inten. (x10,000,000)
x 2
x 3 x 3
x 3
x5
200 300 400 500 600 m/z
0.5
1.0
1.5
2.0 Inten. (x10,000,000)
x2
x 3 x 3
x 3
x 5
15000 u/sec 10000 u/sec 5000 u/sec
200 300 400 500 600 m/z
0.5
1.0
1.5
2.0 Inten. (x10,000,000)
200 300 400 500 600 m/z
0.5
1.0
1.5
2.0 Inten. (x10,000,000)
200 300 400 500 600 m/z
0.5
1.0
1.5
2.0 Inten. (x10,000,000)

4
In case of typical triple quadrupole mass spectrometer
In some instruments a mass displacement effect can occur with linked scans, such as precursor or neutral loss scans, when performed at higher scan speeds.
Precursor ion scans were performed at two scan speeds, 2727 u/sec and 6000 u/sec. These scans showed no mass displacement at either speed for either the LCMS-8030 or LCMS-8040. LCMS-8040 sensitivity was about two times higher than for the LCMS-8030.
300.5
298.0 299.0 300.0 301.0 302.0 303.0 m/z
301.0
300.0
6000u/sec
0
0.5
1.0
1.5
3.0 4.0 5.0 min
2.0
2727u/sec
Precursor: ion of m/z 149
250.0 240.0 m/z 0.0
2.5
5.0
Inten. (x10 5)
251.25
m/z 149
Dipropyl phthalate
250.0 240.0 0.0
2.5
5.0
7.5
Inten. (x 10 5)
251.25
m/z
0
0.5
1.0
Inten. (x107) Inten. (x107)
3.0 4.0 5.0 min
8040
8030
Fig. 6 Precursor ion scan of standard mixture sample of 8 phthalate esters.
ConclusionThe development of a tandem ion guide system with an enhanced fringing field between two ion guides has
enabled increases in sensitivity for the LCMS-8040 up to a maximum of 5-fold.
Development of an ion transmission enhanced tandem ion guide system for triple quadruple mass spectrometer

For Research Use Only. Not for use in diagnostic procedures.The content of this publication shall not be reproduced, altered or sold for any commercial purpose without the written approval of Shimadzu. The information contained herein is provided to you "as is" without warranty of any kind including without limitation warranties as to its accuracy or completeness. Shimadzu does not assume any responsibility or liability for any damage, whether direct or indirect, relating to the use of this publication. This publication is based upon the information available to Shimadzu on or before the date of publication, and subject to change without notice.
© Shimadzu Corporation, 2012
First Edition: May, 2012
www.shimadzu.com/an/

Masayoshi Tamura1; Keiko Matsumoto2; Jun
Watanabe2; Junko Iida2; Yasushi Nagatomi1; Naoki
Mochizuki1 1Asahi Group Holdings, Ibaraki, JAPAN; 2SHIMADZU CORPORATION, Kyoto, JAPAN
High Throughput Quantitative Analysis of Multi-mycotoxin in Beer-based Drinks using UHPLC-MS/MS
ASMS 2012 WP27-580

2
IntroductionMycotoxins often exist as contaminants in grains. To ensure consumer food safety, manufactures of food and beverages have to strictly manage risks from such contaminants. To maintain the high-quality of food standards it is therefore essential to rapidly determine the concentrations of hazardous mycotoxins in foods or beverages. UHPLC-MS/MS offers the best combination of selectivity, sensitivity, and speed for detection of these compounds in
complex matrices. In this study, a high throughput method for the quantification of 14 mycotoxins in beers was developed. Highest sensitivity of analysis is crucial to food safety, additionally, autosampler and system carry over need to be monitored to ensure these factors do not become a problem. In these experiments elimination of carry over was investigated through novel rinse condition cycles of the UHPLC autosampler.
14 mycotoxins (patulin(PAT), nivalenol(NIV), deoxynivalenol(DON), aflatoxin(AF) B1, B2, G1, G2, T-2 toxin(T-2), HT-2 toxin(HT-2), zearalenone(ZON), fumonisin(FM) B1, B2, B3 and ochratoxin A(OTA)) were determined by LC-MS/MS using a UFLC HPLC system coupled to a LCMS-8030 triple quadrupole mass spectrometer. The MRM method of 14 mycotoxins was optimized on
each compound-dependent parameter and MRM transition (Q1/Q3). As a result, all compounds were detected with high sensitivity by ESI. AFB1, B2, G1, G2, T-2, HT-2, FMB1, B2, B3 and OTA were detected in positive mode. While PAT, NIV, DON, ZON were detected in negative mode. Ultra Fast Polarity Switching of 15 msec enabled simultaneous determination of the compounds in both modes.
Methods and Materials
High Throughput Quantitative Analysis of Multi-mycotoxin in Beer-based Drinks using UHPLC-MS/MS
Fig. 2 LCMS-8030 triple quadrupole mass spectrometer
Fig. 1 Structure of mycotoxins
High Speed Mass Spectrometer Polarity Switching 15 msecScanning Speed Max. 15000 u/sec

3
ResultsMethod development for 14 mycotoxins
Analytical Conditions for LC-MS/MSHPLC: UFLC systemColumn:Mobile phase A: B:Flow rate:Gradient program:Column temperature:
MS: LCMS-8030 triple quadrupole mass spectrometer Ionization: ESI, Positive/Negative MRM mode Ion spray voltage: -3.5 kV
TriartC18 100 mm×2.0 mm, 1.9 um10 mM Ammonium acetate - Water, 2% Acetic acid - Methanol0.4 mL/minB conc.2%(0 min) - 55%(3 min) - 85%(7.0-8.0 min) - 2%(8.01-11 min)Column temperature: 40 C
For UHPLC separation, various LC mobile phase conditions were examined. Tailing of fumonisins peaks were observed when only ammonium acetate was added in mobile phase. It was found that pH of a mobile phase effected peak shape of fumonisins. In order to reduce tailing of fumonisins, acetic acid was added in mobile phase B and
the gradient program was controlled to maintain high concentration of acetic acid when fumonisins were eluted. By controlling the concentration of acetic acid and ammonium acetate with gradient program, 14 mycotoxins were separated and detected excellently in 11 minutes (Fig. 3).
Each mycotoxin standard was analyzed at six concentration levels. Good linearity was observed in the calibration curves, and excellent sensitivity was achieved.
MRM Transition
AF G1(+)
AF G2 (+)
AF B1 (+)
AF B2 (+)
HT-2 (+)
T-2 (+)
OTA (+)
ZON(-)
NIV(-)
DON(-)
PAT(-)
FM B1 (+)
FM B2 (+)
FM B3 (+)
329.05 > 243.05
331.00 > 245.00
313.00 > 241.05
315.00 > 259.00
442.00 > 263.05([M+NH4]+)
483.95 > 305.00 ([M+NH4]+)
404.10 > 238.90
317.15 > 273.00
371.10 > 281.25([M+CH3COO]-)
355.10 > 295.15
([M+CH3COO]-)
153.10 > 109.20
722.45 > 334.30
706.45 > 336.25
706.45 > 336.25
2.0 3.0 4.0 5.0 6.0 7.0 min
0
10000
20000
30000
40000
50000 HT-2 (+)
PAT (-)
NIV (-)
DON (-)
AF G2 (+) AF G1 (+)
AF B2 (+)
AF B1 (+)
FMB1 (+)
FMB3 (+)
FMB2 (+)
T-2 (+)
OTA (+)
ZON ( -)
Ultra Fast Polarity Switching Mycotoxin MRM transition
Fig. 3 14 mycotoxins analysis by LC-MS/MS (PAT, NIV, DON, HT-2, T-2, OTA, ZON, FM B1/B2/B3 50ppb, AF B1/B2/G1/G2 10 ppb)
High Throughput Quantitative Analysis of Multi-mycotoxin in Beer-based Drinks using UHPLC-MS/MS

4
Table 1 Linearity 14 mycotoxins
Fig. 4 Possible coordination interaction with metal ion
Mycotoxin
AF G1
AF G2
AF B1
AF B2
HT-2
T-2
OTA
Range
0.4-20 ppb
0.4-20 ppb
0.4-20 ppb
0.4-20 ppb
2-100 ppb
2-100 ppb
2-100 ppb
Coefficient(r2)
0.999
0.999
0.999
0.999
0.998
0.999
0.999
Mycotoxin
ZON
NIV
DON
PAT
FM B1
FM B2
FM B3
Range
2-100ppb
2-100ppb
2-100ppb
10-100ppb
2-100ppb
2-100ppb
2-100ppb
Coefficient(r2)
0.999
0.999
0.997
0.999
0.995
0.994
0.997
High Throughput Quantitative Analysis of Multi-mycotoxin in Beer-based Drinks using UHPLC-MS/MS
Rinse condition for eliminating carry over Carry over of fumonisins was initially observed using the general rinse condition, because fumonisins formed complexs with trace metal ions in the sample’ s flow path.
Probably, several carboxyl groups of fumonisins coordinated with metal ion (Fig. 4).
For eliminating carry over, rinse solvent and rinse method were examined. The performance of Nexera autosampler SIL-30AC, which can wash both inner and outer needle surfaces with 4 different solvents, was used. It was thought that carboxyl groups of fumonisins may preferentially pair with hydrogen ions in the presence of low pH, therefore formic acid was added to rinse solvent. When investigating rinse methods, it was discovered the inner and outer rinse of needle reduced carry over more than the outer rinse of needle. Finally the modified rinse
solvent consisted of:1% formic acid aq./methanol / acetonitrile / isopropanol (1/1/1/1). To test the modified rinse cycle method, one injection of the 100ppb fumonisins standard solution was followed by one blank injection to check for carryover. Figure 5 shows chromatograms of the standards of FMB2 and B3, and the following blank injection. Low carry over was observed in the blank injection. It resulted from washing fumonisins adsorbed inside needle with the needle's inner and outer rinse method and the effective rinse solvent.

5
Quantitative Analysis of 14 mycotoxins in beer-based drinksMycotoxins were extracted from samples and were purified with a solid phase extraction (SPE) cartridge.20 commercial beers were analyzed by using this method. The calibration curves were assessed using beer samples spiked with mycotoxins. PAT, AFB1, B2, G1, G2, NIV, T-2
and ZON were not detected in any of the beer samples. Some of the tested samples were found to be contaminated with DON, HT-2, OTA, FMB1, B2, and B3 at concentrations of less than their respective LOQs (each 5 ppb).
Table 2 Mycotoxins detected in analyzed samples
ConclusionsHigh throughput LC-MS/MS method for 14 mycotoxins was developed, and could be applied to the quantification of these compounds in beers.Carry over of fumonisins was eliminated by using both the needle's inner and outer rinse method with effective rinse solvent. Results from these experiments indicate that the health risk to consumers posed by intake mycotoxins in commercial beers is relatively low.
AcknowledgemetsReagents were provided from Wako Pure Chemical Ind.,(Osaka,Japan) with substantial cooperation.
5.5 6.0 6.5 7.0 min
0
500
1000
1500
2000
2500
FMB3
FMB2
100ppb
Blank
Fig. 5 Carry over evaluation of fumonisins Fig. 6 HPLC path of SIL-30AC
DON HT- 2 F MB1 F MB2 F MB3 OTA DON HT-2 FMB1 FMB2 FMB3 OTAMexico < 5 < 5 Holland < 5 < 5(1sample) (1/1) (1/1) (2samples) (1/2) (1/2)
USA < 5 Ireland(1sample) (1/1) (2sample)
China < 5 England < 5 < 5 < 5(1sample) (1/1) (1sample) (1/1) (1/1) (1/1)Philippine < 5 Germany(1sample) (1/1) (1sample)
Australia Czech(1sample) (1sample)
Japan < 5 < 5 Belguin 6.7 < 5(5sample) (3/5) (2/5) (2samples) (1/2) (1/2)
< 5 < 5 < 5(1/2) (1/2) (1/2)
< 5 (less than 5ppb)
Concentration of mycotoxin/ppb(detected rate)Producing
country
Concentration of mycotoxin/ppb(detected rate) Producing
country
High Throughput Quantitative Analysis of Multi-mycotoxin in Beer-based Drinks using UHPLC-MS/MS

For Research Use Only. Not for use in diagnostic procedures.The content of this publication shall not be reproduced, altered or sold for any commercial purpose without the written approval of Shimadzu. The information contained herein is provided to you "as is" without warranty of any kind including without limitation warranties as to its accuracy or completeness. Shimadzu does not assume any responsibility or liability for any damage, whether direct or indirect, relating to the use of this publication. This publication is based upon the information available to Shimadzu on or before the date of publication, and subject to change without notice.
© Shimadzu Corporation, 2012
First Edition: May, 2012
www.shimadzu.com/an/

Manabu Ueda1; Tsubasa Ibushi1; Teruhisa Shiota2;
Hirotaka Honda2; Jun Watanabe1; Kazuo
Mukaibatake1; Junko Iida1 1Shimadzu Corporation, Kyoto, JAPAN 2AMR, Inc., Tokyo, JAPAN
High throughput molecular weight confirmation of Pharmaceutical Compounds using DART MS analysis with ultra-fast polarity switching
ASMS 2012 ThP25-554

2
IntroductionDART, a direct atmospheric pressure ionization source, is known to have little or no negative effect from the solvent used to dissolve the sample. Even with problematic solvents for LC/MS operation such as non-volatile solvents or solvents containing salt, the target compounds can be instantly identified using DART-MS without any sample preparation. High-throughput molecular-weight (MW) confirmation of synthesized compounds is difficult to
achieve using time of flight mass spectrometers, which have been a common choice to interface DART, due to its limitation in switching between positive and negative ion modes. By combining an automated DART ion source with a quadrupole mass spectrometer with ultra-fast polarity switching capability, 11 different pharmaceutical compounds with various polarities were successfully determined in approximately 10 sec/sample.
Materials and MethodsDART-MS analyses of 10ppm pharmaceutical compounds dissolved in 100% DMSO were carried out. The DART-SVP ion source (IonSense Inc., MA, USA) was coupled to the single quadrupole LCMS-2020 (Shimadzu Corporation, Kyoto, Japan), and DART-ID CUBE (IonSense), the new type of DART, was also coupled to the said mass spectrometer. Introduction of samples for DART-SVP was automated by
using the X-Z scanner, which is capable of automating up to 96 samples/run. Ultra-fast polarity switching was utilized on the mass spectrometer to collect full scan data. LCMS-2020 can achieve the polarity switching time of 15msec and the scanning speed of up to 15000u/sec, therefore the loop time can be set at less than 1 second despite the relatively large scanning range of 100-1000u.
High throughput molecular weight confirmation of Pharmaceutical Compounds using DART MS analysis with ultra-fast polarity switching
Fig. 1 DART-SVP ion source & LCMS-2020 (a) DART-SVP & LCMS-2020 Overview; (b) DART-SVP interface enlarged view; (c) DART-SVP interface using the X-Z scanner
(a) (b)
(c)

3
Fig. 2 DART-ID CUBE ion source & LCMS-2020 (a) The OpenSpot Sample Card; Spot solution with pipettor, or place droplet of liquid containing analyte on center spot, then card is ready to analyze (b) DART-ID CUBE & LCMS-2020 Overview; arrow shows the guide slot which the sample card is inserted into.
High throughput molecular weight confirmation of Pharmaceutical Compounds using DART MS analysis with ultra-fast polarity switching
DART-ID CUBEFirst, the new DART-ID CUBE ion source was tested and successfully interfaced to LCMS-2020. As ID CUBE required external high voltage (HV) from LC/MS instruments, HV supply of LCMS-2020 easily connected to ID CUBE. Mass spectrum was identified for both the positive standard sample of 100 ppm quinine and the negative standard sample of 100 ppm methylparaben. 5 uL of samples were
spotted on a specialized sampling card and inserted into the ID CUBE source. Vaporization of sample is more rapid with ID CUBE than it is with DART-SVP since the sample is directly heated with electric current running through the metal mesh on which the sample is applied, while the DART-SVP heats the sample with heated gas.
Results
(a)
(b)

4
Fig. 3 Standard sample MS spectra using DART-ID CUBE
Fig. 4a Pharmaceutical compounds DART-MS analysis results
Quinine Methylparaben
High throughput molecular weight confirmation of Pharmaceutical Compounds using DART MS analysis with ultra-fast polarity switching
50 100 150 200 250 300 350 400 450 m/z0.0
0.5
1.0
1.5
2.0
2.5
3.0Inten. (x1,000,000)
151.1
303.1167.1 241.189.2 136.1
496.0479.4417.9375.8291.3
53.1
50 100 150 200 250 300 350 400 450 m/z0.0
1.0
2.0
3.0
Inten. (x1,000,000)
324.9
325.9
135.8 374.9294.9211.9175.8499.9
96.860.9
453.3
Positive MS Negative MS M+H M-H
DART-SVPNext, the DART gas (helium) heater temperature was raised to 350C and commercially available pharmaceutical compounds such as Atenolol, Warfarin, Yohimbine, Cilostazol, Nifedipine, Diazepam, Nitrendipine, and
Diphenhydramine were applied on a metal mesh of the X-Z tool, which has the same size and configuration as the 96 well microtiter plate, to automatically introduce them into the DART ionization gas.
100 200 300 400 m/z0.0
1.0
2.0
3.0
Inten.(x1,000,000)
267
345
93 139 175 352225 476283 423249 313 39061
100 200 300 400 m/z0.0
1.0
2.0
3.0
4.0
Inten.(x100,000)
89
169
145259 294 34537497 207 437125 405
49346564
100 200 300 400 m/z0.0
0.5
1.0
1.5
2.0Inten.(x1,000,000)
157
41697 338175139 309202 48538027868 235100 200 300 400 m/z
0.0
2.5
5.0
7.5Inten.(x100,000)
307
1697997 283157 255 35064 220121 432399 456
480
100 200 300 400 m/z0.0
0.5
1.0
1.5
2.0Inten.(x1,000,000)
433
355
15793 175 449415235 333
493202 387292
56
100 200 300 400 m/z0.0
1.0
2.0
3.0
4.0Inten.(x100,000)89 353
389
169400 443
14597 335242125 207 30352
483
100 200 300 400 m/z0.0
1.0
2.0
3.0
4.0Inten.(x1,000,000)
370
338207 288102 41979 386 447471125149176499
100 200 300 400 m/z0.0
2.5
5.0
7.5
Inten.(x100,000)
368415 458
384 428281 489255 303 337
5123320916975 119145
100 200 300 400 m/z0.00
0.25
0.50
0.75
1.00
Inten.(x100,000)
157
13993
407175 338235107 315283 393 440 48268100 200 300 400 m/z
0.00
0.25
0.50
0.75
1.00
Inten.(x1,000,000)
345 425
381491
89 408222169 441 477313145 35925964
100 200 300 400 m/z0.0
1.0
2.0
3.0
Inten.(x100,000)
285
157
36313993 175 224 338 416373 47468 278
Positive MS
Negative MS
Atenolol
Warfarin
Yohimbine
Cilostazol
Nifedipine
Diazepam
DMSO 2M+H
M+H
M-H
100 200 300 400 m/z0.0
2.5
5.0
7.5Inten.(x100,000)
89
17997
259145 393339205 29552
427 465493

5
Fig. 4b Pharmaceutical compounds DART-MS analysis results
High throughput molecular weight confirmation of Pharmaceutical Compounds using DART MS analysis with ultra-fast polarity switching
11 different pharmaceutical compounds were analyzed by DART & LCMS-2020.With DART, the choice of solvent for the preparation of sample rarely poses a problem. Here the samples were dissolved in concentrated DMSO.
The capability of LCMS-2020 to do ultra high-speed polarity switching was fully utilized.Target ions were detected in positive and/or negative mode for all samples.
Relatively large DMSO peak was observed in positive mode scan, but the target compounds were successfully identified as well. Positive ion spectrum was observed for Atenolol, Diazepam, Diphenhydramine, Verapamil, Triazolam and Alplazolam. Negative ion spectrum was observed for Warfarin, Nifedipine and Nitrendipine. Both positive and
negative ion spectra were observed for Yohimbine and Cilostazol. DART-MS with the ultra-fast polarity switching and ultra-fast scanning demonstrated its ability to perform high throughput analysis of pharmaceutical compounds dissolved in DMSO as solvent at analysis speed @ approximately 10 sec/sample.
Nitrendipine
100 200 300 400 m/z0.0
1.0
2.0
Inten. (x100,000)
157
139 33893 175 235 41637797 278202 45768
100 200 300 400 m/z0.0
0.5
1.0
1.5
Inten. (x1,000,000)
359
439
8939516997 259 473145 391327283209
51
100 200 300 400 m/z0.0
2.5
5.0Inten. (x100,000)
256
167
334
16593 139 258 354 416320224 390493
190 47328672
100 200 300 400 m/z0.00
0.25
0.50
0.75
1.00Inten. (x100,000)
169
2499714595 259 339283211127 189 31564 433385409359
496479
100 200 300 400 m/z0.0
0.5
1.0
Inten. (x1,000,000)
455
93 441139 291 368 471175 235202 41149553
100 200 300 400 m/z0.0
0.5
1.0
1.5
2.0
Inten. (x100,000)
16989
145249 33997 315
489125 357 391281205 43953
Diphenhydramine
Verapamil
100 200 300 400 m/z0.0
0.5
1.0
Inten. (x1,000,000)
343 421
40393 139 358235 455175 309499
20251
100 200 300 400 m/z0.0
0.5
1.0
Inten. (x100,000)
169
357
97145
281242 32379 373125 267223 395 43752
473
100 200 300 400 m/z0.0
1.0
2.0
3.0
4.0
Inten. (x100,000)
309
387
93 139 352175 421235 278 443 48269
100 200 300 400 m/z0.0
1.0
2.0
3.0
Inten. (x100,000)
89 169
289
388323
404242 339145 45936920597 42153
Triazolam
Alplazolam
Positive MS Negative MS
Conclusions

For Research Use Only. Not for use in diagnostic procedures.The content of this publication shall not be reproduced, altered or sold for any commercial purpose without the written approval of Shimadzu. The information contained herein is provided to you "as is" without warranty of any kind including without limitation warranties as to its accuracy or completeness. Shimadzu does not assume any responsibility or liability for any damage, whether direct or indirect, relating to the use of this publication. This publication is based upon the information available to Shimadzu on or before the date of publication, and subject to change without notice.
© Shimadzu Corporation, 2012
First Edition: May, 2012
www.shimadzu.com/an/

Teruhisa Shiota1; Manabu Ueda2; Tsubasa Ibushi2;
Jun Watanabe2; Kazuo Mukaibatake2; Junko Iida2;
Yasuhiko Bando1 1AMR, Inc., Tokyo, JAPAN 2Shimadzu Corporation, Kyoto, JAPAN
Componential analysis of pepper of various origins using DART-MS using ultra-fast polarity switching
ASMS 2012 Thp25-548

2
IntroductionDART (Direct Analysis in Real Time), a direct atmospheric pressure ionization source, is capable of analyzing food samples with little or no sample preparation. Time of flight mass spectrometers, which have been a common choice to interface DART, were not suitable in carrying out simultaneous detection of compounds with different polarities from the same sample due to its limitation in
switching between positive and negative ion modes in terms of time required to do so. Analysis of different parts of pepper (exodermis, endodermis and seeds) along with olive oil and soy sauce of different types and origins were carried out using the DART combined with a mass spectrometer with ultra-fast polarity switching capability to conduct chemometric analysis.
Materials and MethodsCommercially available peppers from different origins were introduced to the DART gas using tweezers. Glass capillary was used to dip and transfer olive oil to the ionization area, and soy sauce was spotted on a metal mesh to scan with the DART beam. The DART-SVP ion source (IonSense Inc., MA, USA) was interfaced onto the single quadrupole mass spectrometer LCMS-2020 (Shimadzu Corporation, Kyoto,
Japan). Ultra-fast polarity switching was utilized on the mass spectrometer to collect full scan data. LCMS-2020 can achieve the polarity switching time of 15 msec and the scanning speed of up to 15000 u/sec, therefore the loop time can be set at less than 1 second despite the relatively large scanning range of 100-1000u.
Componential analysis of pepper of various origins using DART-MS using ultra-fast polarity switching
Fig. 1 DART-SVP ion source LCMS-2020
PeppersCapsaicin (C18H27NO3, MW 305), which is responsible for the spicy flavor of pepper, is usually most abundant in placenta. Commercially available peppers from Korea,
China and several areas in Japan were cut and separated to each part of the exodermis, endodermis and the seed and each sample was analyzed by DART-SVP LCMS-2020.
Results

3
Fig. 2 Commercially available peppers from different origins and sample preparation for DART-MS
Fig. 3 Positive/Negative mass spectrum of pepper seed @350°C
Fig. 4 DART gas heater temperature comparison; 200°C, 350°C, 500°C Mass spectra in positive ion mode of product M, N pepper seeds
The signal indicating capsaicin was detected in both polarities; at m/z 306 in positive ion mode, m/z 304 in negative mode. The signal in positive ion mode was more intense than in negative ion mode. After careful
optimization of analytical conditions using different DART gas heater temperatures at 200°C, 350°C and 500°C, it was determined that 350C was the suitable temperature setting to analyze capsaicin.
250 500 750 m/z0.0
0.5
1.0
1.5
2.0
2.5
3.0Inten. (x1,000,000)
305.9
613.1
136.8 270.0 355.9 577.2421.0151.8 241.993.7 933.7250 500 750 m/z
0.00
0.25
0.50
0.75
1.00
Inten. (x1,000,000)
304.2
367.4
279.3395.4241.3 586.4170.2 451.3 979.5
920.6
[M+H]+ [M-H]-
Positive Scan Negative Scan
200 250 300 350 400 450 m/z0.0
0.5
1.0
1.5
2.0Inten. (x1,000,000)
305.90269.95
321.90271.00 441.15353.90181.80
200 250 300 350 400 450 m/z0.0
0.5
1.0
1.5
2.0Inten. (x1,000,000)
305.90
269.95321.90
355.90 469.10181.80
200 250 300 350 400 450 m/z0.0
0.5
1.0
1.5
2.0Inten. (x1,000,000)
305.90376.95321.85269.95 437.90
200 250 300 350 400 450 m/z0.0
1.0
2.0
Inten. (x1,000,000)
305.90269.95 321.85 386.00241.90 473.10
200 250 300 350 400 450 m/z0.0
1.0
2.0
Inten. (x1,000,000)
305.90
269.95 321.85 355.90 420.95291.85253.95181.80
471.00
200 250 300 350 400 450 m/z0.0
1.0
2.0
Inten. (x1,000,000)
305.90 376.95308.85269.95
181.75 489.90460.05
Product N Product M
200C 200C
350C 350C
500C 500C
Componential analysis of pepper of various origins using DART-MS using ultra-fast polarity switching
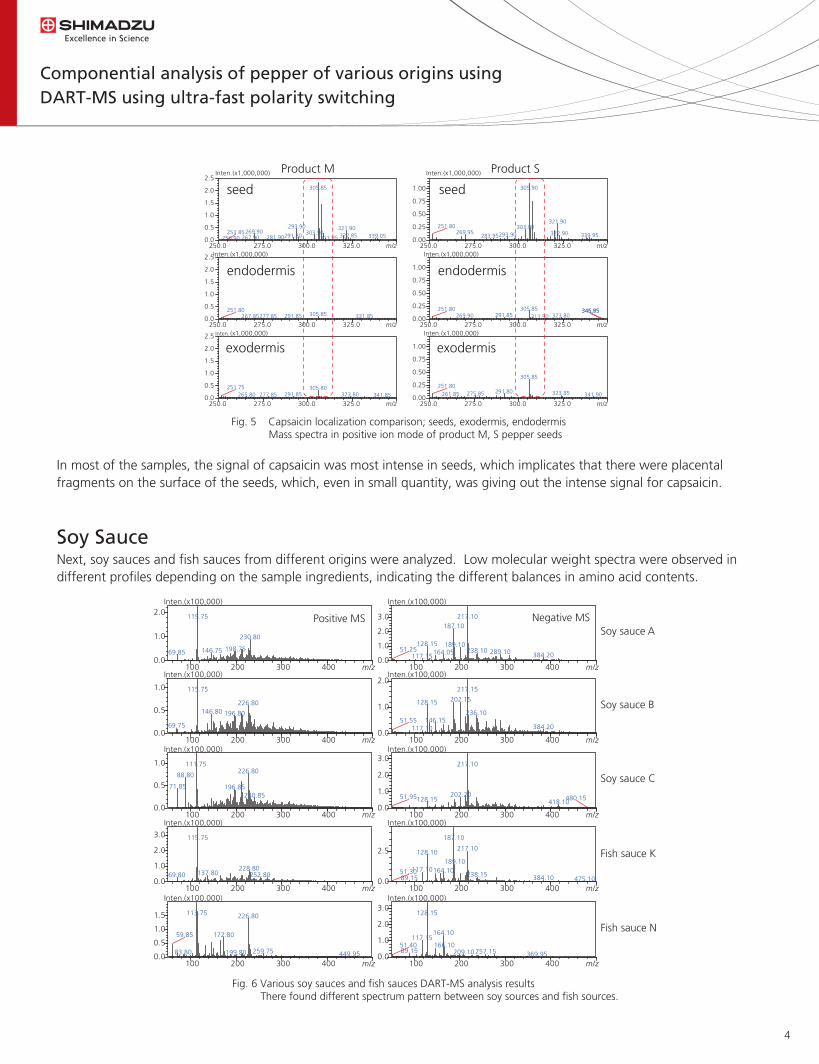
4
Fig. 5 Capsaicin localization comparison; seeds, exodermis, endodermis Mass spectra in positive ion mode of product M, S pepper seeds
Fig. 6 Various soy sauces and fish sauces DART-MS analysis results There found different spectrum pattern between soy sources and fish sources.
In most of the samples, the signal of capsaicin was most intense in seeds, which implicates that there were placental fragments on the surface of the seeds, which, even in small quantity, was giving out the intense signal for capsaicin.
250.0 275.0 300.0 325.0 m/z0.0
0.5
1.0
1.5
2.0
2.5Inten.(x1,000,000)
305.85
293.90 321.90269.90 303.90 322.85291.80 339.05281.90267.90 311.95
253.85256.90
250.0 275.0 300.0 325.0 m/z0.0
0.5
1.0
1.5
2.0
2.5Inten.(x1,000,000)
305.85251.80
291.85 331.85277.85267.85
250.0 275.0 300.0 325.0 m/z0.0
0.5
1.0
1.5
2.0
2.5 Inten. (x1,000,000)
305.80251.75291.85 323.80265.80 277.85 341.85
Product M
seed
endodermis
exodermis
250.0 275.0 300.0 325.0 m/z0.00
0.25
0.50
0.75
1.00
Inten.(x1,000,000)
305.90
321.90303.90251.80
269.95 322.90293.90 339.95283.95
250.0 275.0 300.0 325.0 m/z0.00
0.25
0.50
0.75
1.00
Inten.(x1,000,000)
305.85251.80291.85 323.80269.90
345.85311.90
346.95
250.0 275.0 300.0 325.0 m/z0.00
0.25
0.50
0.75
1.00
Inten.(x1,000,000)
305.85
291.80251.80
323.85275.85261.85 341.90
Product S
seed
endodermis
exodermis
Soy SauceNext, soy sauces and fish sauces from different origins were analyzed. Low molecular weight spectra were observed in different profiles depending on the sample ingredients, indicating the different balances in amino acid contents.
100 200 300 400 m/z0.0
1.0
2.0
3.0
Inten.(x100,000)
115.75
228.80137.80 252.8069.80
100 200 300 400 m/z0.0
2.5
Inten.(x100,000)
187.10
217.10128.10189.10
117.10164.10238.15 384.1089.15
51.30475.10
100 200 300 400 m/z0.0
1.0
2.0Inten.(x100,000)
115.75
230.80
198.75146.7569.85
100 200 300 400 m/z0.0
1.0
2.0
3.0
Inten.(x100,000)
217.10187.10
128.15 189.10238.10 289.10164.05 384.20
51.25117.15
100 200 300 400 m/z0.0
0.5
1.0
Inten.(x100,000)
115.75
226.80146.80 196.80
69.75
100 200 300 400 m/z0.0
1.0
2.0Inten.(x100,000)
217.15
202.15128.15
236.10146.15
384.2051.55
117.10
100 200 300 400 m/z0.0
0.5
1.0
Inten.(x100,000)
111.75226.80
88.80
71.85 196.85240.85
100 200 300 400 m/z0.0
1.0
2.0
3.0Inten.(x100,000)
217.10
202.20128.15 418.10
51.95 480.15
100 200 300 400 m/z0.0
0.5
1.0
1.5
Inten.(x100,000)
113.75 226.80
172.8059.85
259.7583.80 199.80 449.95
100 200 300 400 m/z0.0
1.0
2.0
3.0Inten.(x100,000)
128.15
164.10117.15
166.1089.15 257.1551.40
209.10 369.95
Soy sauce A
Soy sauce B
Soy sauce C
Fish sauce K
Fish sauce N
Positive MS Negative MS
Componential analysis of pepper of various origins using DART-MS using ultra-fast polarity switching
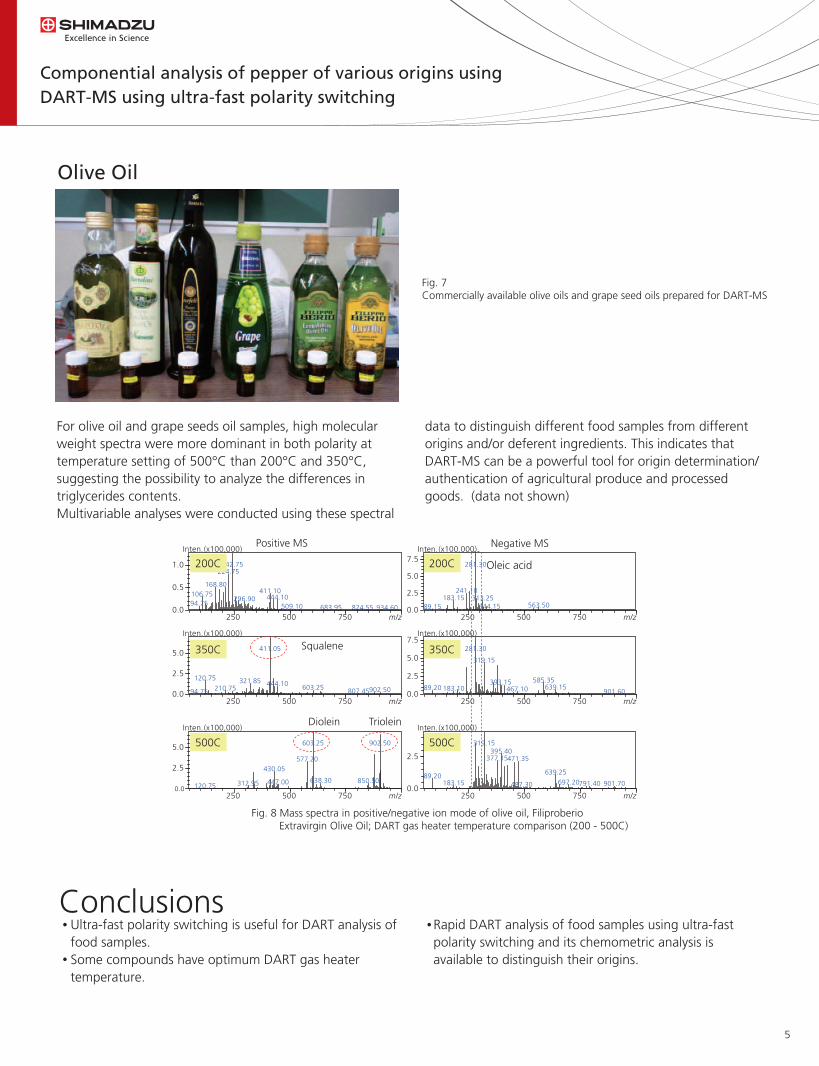
5
Fig. 7Commercially available olive oils and grape seed oils prepared for DART-MS
Fig. 8 Mass spectra in positive/negative ion mode of olive oil, Filiproberio Extravirgin Olive Oil; DART gas heater temperature comparison (200 - 500C)
Ultra-fast polarity switching is useful for DART analysis of food samples.Some compounds have optimum DART gas heater temperature.
Rapid DART analysis of food samples using ultra-fast polarity switching and its chemometric analysis is available to distinguish their origins.
For olive oil and grape seeds oil samples, high molecular weight spectra were more dominant in both polarity at temperature setting of 500°C than 200°C and 350°C, suggesting the possibility to analyze the differences in triglycerides contents.Multivariable analyses were conducted using these spectral
data to distinguish different food samples from different origins and/or deferent ingredients. This indicates that DART-MS can be a powerful tool for origin determination/ authentication of agricultural produce and processed goods. (data not shown)
Conclusions
Olive Oil
250 500 750 m/z0.0
0.5
1.0
Inten.(x100,000)
242.75224.75
168.80411.10106.75 444.10296.90
94.75 509.10 683.95 824.55 934.60250 500 750 m/z
0.0
2.5
5.0
7.5Inten.(x100,000)
281.30
241.10183.15 313.25
563.50344.1589.15
250 500 750 m/z0.0
2.5
5.0
Inten.(x100,000)
411.05
120.75 321.85 444.10 603.25210.75 902.50807.4594.75
250 500 750 m/z0.0
2.5
5.0
7.5Inten.(x100,000)
281.30
319.15
585.35393.15639.1589.20 183.10 467.10 901.60
250 500 750 m/z0.0
2.5
5.0
Inten.(x100,000)
603.25 902.50
577.20430.05
638.30 850.50447.00312.95120.75
250 500 750 m/z0.0
2.5
Inten.(x100,000)
319.15395.40
377.15471.35
639.2589.20697.20183.15 791.40 901.70487.30
Positive MS Negative MS
200C
350C
500C
200C
350C
500C
Squalene
Triolein Diolein
Oleic acid
Componential analysis of pepper of various origins using DART-MS using ultra-fast polarity switching

For Research Use Only. Not for use in diagnostic procedures.The content of this publication shall not be reproduced, altered or sold for any commercial purpose without the written approval of Shimadzu. The information contained herein is provided to you "as is" without warranty of any kind including without limitation warranties as to its accuracy or completeness. Shimadzu does not assume any responsibility or liability for any damage, whether direct or indirect, relating to the use of this publication. This publication is based upon the information available to Shimadzu on or before the date of publication, and subject to change without notice.
© Shimadzu Corporation, 2012
First Edition: May, 2012
www.shimadzu.com/an/

Yuki Ando1; Keiko Matsumoto2; Jun Watanabe2;
Junko Iida2; Shun Hirota1 1Nara Institute of Science and Technology, Nara,
JAPAN 2Shimadzu Corporation, Kyoto, JAPAN
Identification of the modified amino acid residue in the modified heme protein using LC/MS/MS
ASMS 2012 TP09-180

2
IntroductionAn amino acid in a heme protein can be modified by a reaction with hydrogen peroxide, and the protein may lose its physiological activity. Moreover, it has been reported that the tryptophan which was inserted near the heme in myoglobin can be oxidized by an organic acid peroxide. In this study, we found that a methionine residue is modified in a mutant of another heme protein. However, among
the peptide fragments obtained by the peptidase digestion of the modified protein, the two peptides which contain methionine was constructed with the same set of amino acids and exhibited the same molecular weight. We identified the modified amino acid in this mutant protein by using LC/MS/MS.
Materials and MethodsThe mutant of the heme protein used in this study was a mixture of non-modified and modified proteins, where about 50% of the native protein was oxidized. After digesting the mutant of the heme protein with trypsin, the obtained peptide fragments were analysed on the mass spectrometer. Preliminary analysis was first by ESI-TOF mass spectrometer. Secondary analysis was then performed by LC/MS/MS using the following analytical conditions; Nexera
UHPLC system was connected to a LCMS-8030 triple quadrupole mass spectrometer (Fig. 1). Chromatographic separations were carried out using an ODS column, Shim-pack XR-ODS II (150 mm x 2.0 mm, 2.2 um). The sample was eluted at 0.2 mL/min with a binary gradient system and applied to MS/MS with an ESI source, and then analyzed with positive polarity.
Identification of the modified amino acid residue in the modified heme protein using LC/MS/MS
Analytical Conditions
HPLC: Nexera UHPLC system (Shimadzu Corporation, Kyoto, Japan)
Mass spectrometer: LCMS-8030 (Shimadzu Corporation, Kyoto, Japan)
Column:
Mobile phase A:
Flow rate:
Time program:
Injection volume:
Column temperature:
Shim-pack XR-ODS II 150 mm x 2.0 mm, 2.2 um
0.1% Formic Acid B: Acetonitrile
0.2 mL/min
B conc.2%(0 min)-50%(40.0 min)-90%
(41.0-45.0 min) -2%(45.01-55 min)
10 uL
40°C
Ionization:
DL temperature:
Nebulizer gas:
temperature:
Drying gas:
ESI, Positive
250°C
2.0 L /min
400°C
15 L/min
Fig. 1 LCMS-8030 triple quadrupole mass spectrometer
High Speed Mass Spectrometer Polarity Switching ・15 msec
Scanning Speed ・Max. 15000 u/sec

3
ResultsESI-MS ananysisThe tryptic digested sample of the heme protein was analyzed by ESI-TOF MS, JMS-T100LC AccuTOF (JEOL Ltd., Tokyo, Japan). Many peaks were detected in the solution of the peptide fragments obtained by the tryptic digestion (Fig. 2). Peptide F2 (sequence: IFIMK) and peptide F8 (sequence: MIFIK) exhibit a same molecular weight at m/z 651 (M+H), but differ in sequence. Another peak was detected at m/z 667, which was 16u-larger than the original peak. The peptide equivalent to m/z 667 (M+H) was not obtained from the solution of the peptide fragments obtained by tryptic digestion of the original heme protein, suggesting that this additional peak was due to the oxidized species of peptide F2 or F8. However, since MS/MS was not available in the ESI-TOF MS analysis, it was not able to identify the modified peptide.
LC/MS analysisWe analyzed the sample was by LC/MS/MS. Full scan MS measurement was performed, and all the peptide fragments obtained by tryptic digestion and longer than five amino acids were detected (Fig. 3).
Two peaks at m/z 326 (M+2H) correspond to the mass of the peptides F2 or F8, and the peak at m/z 334 (M+2H) to the modified peptide.
Fig. 2 ESI-MS spectra of the tryptic digested sample
Fig. 3 LC/MS results of the peptide sample
(F2 or F8 + 16)
(F2 or F8)
(F2 or F8)
(F1)
(F7) (F4) (F9)
(F3)
(F6)
(F5)
500 1000 1500 m/z0.0
1.0
2.0
3.0Inten.(x100,000)
547.30
434.20315.25
500 1000 1500 m/z0.0
1.0
2.0
3.0Inten.(x1,000,000)
339.85[F7 + 2H] 2+ (677)
500 1000 1500 m/z0.0
2.5
5.0
Inten.(x100,000)714.95
477.05
[F5 + 2H] 2+ (1429)
500 1000 1500 m/z0.0
0.5
1.0
1.5Inten.(x1,000,000)
390.45
584.90
[F4 + 2H] 2+ (1168)
500 1000 1500 m/z0.0
0.5
1.0
1.5Inten.(x1,000,000)
453.95
474.50906.60
[F9 + 2H] 2+ (907)
[F1 + H] + (547)
500 1000 1500 m/z0.0
2.5
5.0
7.5Inten.(x100,000)
550.75564.45
825.40
[F3 + 2H] 2+ (1649)
500 1000 1500 m/z0.0
2.5
5.0
7.5Inten.(x100,000)1004.65
670.25
555.60
[F6 + 2H] 2+ (2008)
500 1000 1500 m/z0.0
0.5
1.0
1.5
2.0
2.5Inten.(x1,000,000)334.35
667.45
500 1000 1500 m/z0.0
1.0
2.0
3.0
4.0
Inten.(x1,000,000)346.90
651.45
500 1000 1500 m/z0.0
0.5
1.0
1.5
2.0
2.5Inten.(x1,000,000)
346.90
651.45
RT 11.6min
RT 13.7min RT 14.5min [F2 or F8 +16+ 2H] 2+ (667)
[F2 or F8 + 2H] 2+ (651)
[F2 or F8 + 2H] 2+ (651)
8 )
or F8
Identification of the modified amino acid residue in the modified heme protein using LC/MS/MS
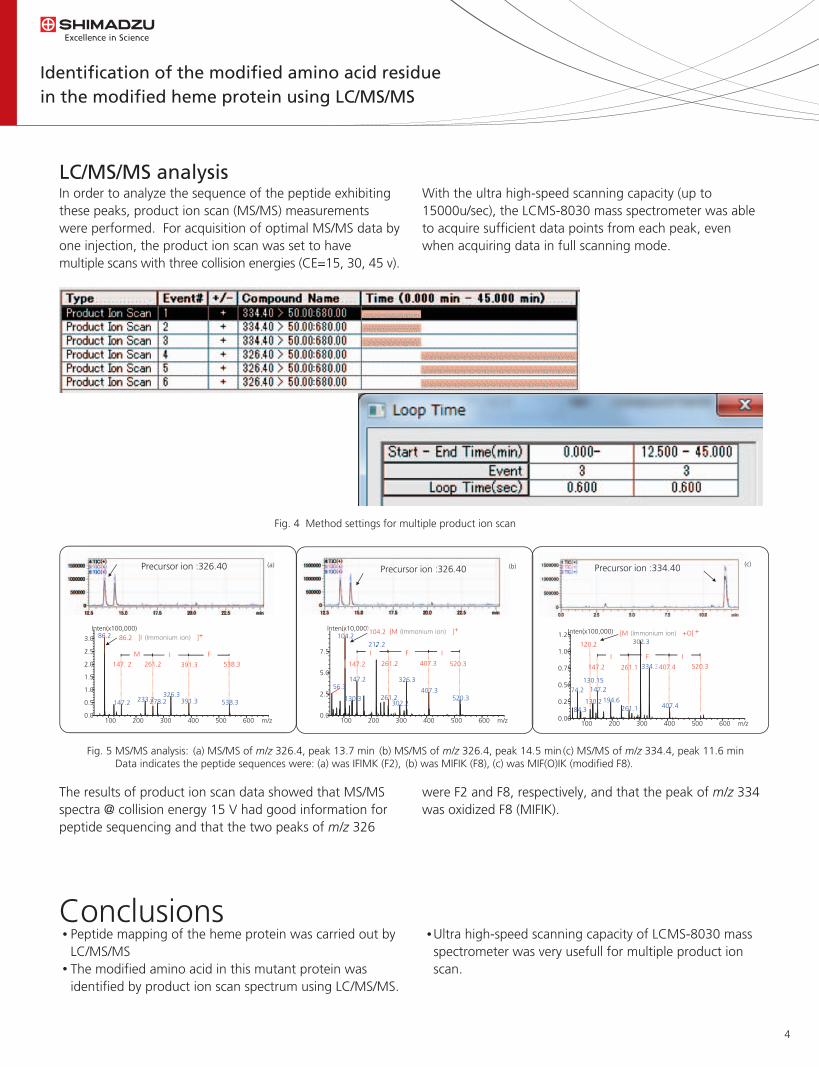
4
Fig. 4 Method settings for multiple product ion scan
Fig. 5 MS/MS analysis: (a) MS/MS of m/z 326.4, peak 13.7 min (b) MS/MS of m/z 326.4, peak 14.5 min (c) MS/MS of m/z 334.4, peak 11.6 min Data indicates the peptide sequences were: (a) was IFIMK (F2), (b) was MIFIK (F8), (c) was MIF(O)IK (modified F8).
LC/MS/MS analysisIn order to analyze the sequence of the peptide exhibiting these peaks, product ion scan (MS/MS) measurements were performed. For acquisition of optimal MS/MS data by one injection, the product ion scan was set to have multiple scans with three collision energies (CE=15, 30, 45 v).
With the ultra high-speed scanning capacity (up to 15000u/sec), the LCMS-8030 mass spectrometer was able to acquire sufficient data points from each peak, even when acquiring data in full scanning mode.
The results of product ion scan data showed that MS/MS spectra @ collision energy 15 V had good information for peptide sequencing and that the two peaks of m/z 326
were F2 and F8, respectively, and that the peak of m/z 334 was oxidized F8 (MIFIK).
Peptide mapping of the heme protein was carried out by LC/MS/MSThe modified amino acid in this mutant protein was identified by product ion scan spectrum using LC/MS/MS.
Ultra high-speed scanning capacity of LCMS-8030 mass spectrometer was very usefull for multiple product ion scan.
Conclusions
Precursor ion :326.40 Precursor ion :326.40 Precursor ion :334.40 (a) (b) (c)
100 200 300 400 500 600 m/z 0.0
0.5
1.0
1.5
2.0
2.5
3.0
Inten. (x100,000) 86.2
326.3 233.2 391.3 278.2 538.3 147.2
M
538.3 147. 2 261.2 391.3
I F
[I (Immonium ion) ]+ 86.2
100 200 300 400 500 600 m/z 0.0
2.5
5.0
7.5
Inten. (x10,000) 104.2
217.2
147.2 326.3
407.3 56.3
261.2 520.3 130.3 302.2
520.3 147.2 261.2 407.3
[M (Immonium ion) ]+ )104.2
I F I
100 200 300 400 500 600 m/z 0.00
0.25
0.50
0.75
1.00
1.25 Inten. (x100,000)
302.3
334.3
147.2 74.2
194.6 130.2 407.4 261.1 84.3
520.3 .3407.4 261.1 147.2
130.15
120.2
I F I
[M (Immonium ion) +O] +
Identification of the modified amino acid residue in the modified heme protein using LC/MS/MS

For Research Use Only. Not for use in diagnostic procedures.The content of this publication shall not be reproduced, altered or sold for any commercial purpose without the written approval of Shimadzu. The information contained herein is provided to you "as is" without warranty of any kind including without limitation warranties as to its accuracy or completeness. Shimadzu does not assume any responsibility or liability for any damage, whether direct or indirect, relating to the use of this publication. This publication is based upon the information available to Shimadzu on or before the date of publication, and subject to change without notice.
© Shimadzu Corporation, 2012
First Edition: May, 2012
www.shimadzu.com/an/

Noriko Shoji1; Toshikazu Minohata2; Naohiro
Kuriyama1; Chie Yokoyama1; Keiko Matsumoto2; Jun
Watanabe2; Junko Iida2 1YMC Co., LTD., Komatsu, JAPAN 2Shimadzu Corporation, Kyoto, JAPAN
Identification of triazolam, etizolam and their metabolites in biological samples by liquid chromatography tandem mass spectrometry
ASMS 2012 WP28-611

2
IntroductionBenzodiazepines are one of the mostly widely prescribed groups of drugs because of their sedative, hypnotic, anxiolytic, antiepileptic and muscle relaxant properties. This class of compounds and their associated metabolites are also frequently present in clinical and forensic samples. For this reason, the analysis of benzodiazepines in biological fluids is of great importance to clinicians and forensic toxicologists. A key analytical challenge in the analysis of benzodiazepines is to identify etizolam, triazolam, and their
metabolites (alpha-hydroxyetizolam, 8-ethylhydroxyetizolam, alpha-hydroxytriazolam and 4-Hydroxytriazolam) as a mixture, because of their very similar chemical structure, molecular weight and fragmentation during mass spectrometry. In this study we report a new high resolution separating method for the simultaneous analysis of etizolam, triazolam and their metabolites.
Identification of triazolam, etizolam and their metabolites in biological samples by liquid chromatography tandem mass spectrometry
Fig. 1 Structure of etizolam, triazolam and their metabolites
Fig. 2 LCMS-8030 triple quadrupole mass spectrometer
N
NN
NCH3
Cl
S
CH3 N
NN
NCH3
Cl
S
OH
N
NN
NCH3
Cl
Cl N
NN
NCH3
Cl
Cl
OH
N
NN
N
Cl
Cl
OH
EtizolamM.W. 342.07059
8-Ethylhydroxye tizolamM.W. 358.06550
Tria zolamM.W. 342.04389
4-Hydroxytria zolamM.W. 358.03881
alpha-Hydroxytria zolamM.W. 358.03881
N
NN
NCH3
Cl
S
CH3
OH
alpha-Hydroxye tizolamM.W. 358.06550

3
Materials and MethodsThree samples were prepared: A) mixture of all standards (alpha-hydroxytriazolam, 4-hydroxytriazolam, triazolam and etizolam), B) metabolised matrix of triazolam and etizolam and C) blank metabolized matrix using human liver S9.
Triazolam, etizolam, and NADPH regeneration system solution A (NADP+, Glucose-6-phosphate, MgCl2 in H2O), NADPH regeneration system solution B (Glucose-6-phosphate dehydrogenase in sodium citrate buffer), human liver S9 were mixed in 100 mM phosphate buffer (pH 7.4). The mixture was incubated at 37 deg C
overnight (approx. 17 hrs). The control sample was prepared without triazolam and etizolam added. [Final concentration in incubation mixture; 100 mM triazolam and etizolam, 1.6 mM NADP, 3.3 mM Glucose-6-phosphate, 0.4 U/mL Glucose-6-phosphate dehydrogenase, 3.3 mM MgCl2, 2 mg/mL S9 protein
Solid phase extraction (SPE) of incubation mixture:
In vitro metabolism of triazolam and etizolam in human liver S9:
The incubation mixture was extracted on YMC Dispo SPE C18 column (100 mg/mL) as follows and injected onto LC/MS/MS. 1. Condition with 2 mL MeOH 2. Equilibrate with 2 mL 0.1% CH3COOH 3. Load 250 mL sample 4. Elute with 1 mL MeOH 5. Dry extract and resolve in 500 mL H2O
Samples were analyzed with UHPLC and a triple quadruple mass spectrometer using following conditions
Analytical Conditions
HPLC: Nexera UHPLC system (Shimadzu Corporation, Japan)
Column: YMC-Triart C18 column, 1.9 µm, 12 nm (150 × 2 mm) Mobile phase: (A) 10 mM formic acid (B) 10 mM formic acid / acetonitrile (1/1) Flow rate: 0.3 mL/min Time program: B conc. 40%(0 min)-65%(40 min)-40%(40.01-60 min) Injection volume: 1 uL Column temperature: 40°C
Mass spectrometer: LCMS-8030 (Shimadzu Corporation, Japan)
Ionization: Electrospray ionization, Positive Scan type: multiple-reaction-monitoring mode (MRM) MRM triggered automatic MS/MS data acquisition
Identification of triazolam, etizolam and their metabolites in biological samples by liquid chromatography tandem mass spectrometry

4
Identification of triazolam, etizolam and their metabolites in biological samples by liquid chromatography tandem mass spectrometry
ResultsThe simultaneous analysis of drugs of abuse in clinical and forensic laboratories requires highly specific methods. The developed method in this study contained not only optimized MRM transition parameters and chromatographic conditions, but also product ion scanning which is automatically triggered once an MRM exceeds a specified threshold. The method was applied to the analysis of benzodiazepines; including etizolam, triazolam, and their known metabolites. In this experiment three samples were prepared (as described above). Sample (A) was a matrix-free mixture of etizolam, triazolam, and their known metabolites, sample (B) was a
metabolized matrix of triazolam and etizolam and, sample (C) was a blank metabolism matrix of human liver S9. Firstly, sample (A) was analyzed with the method of 12 MRM transitions, which were quantitative and qualitative transitions for etizolam, triazolam, and their known metabolites and it resulted in excellent separation for all four compounds. Next, sample (C) (blank matrix) was analyzed and no peaks were observed; therefore highlighting the excellent selectivity of the method. Sample (B) (metabolized drug) was then analyzed and three new peaks were found (in addition to the four peaks in sample (A)).
0.0 5.0 10.0 15.0 20.0 25.0 30.0 35.0 40.0 45.0 min
0.00
0.25
0.50
0.75
1.00 (x100,000)
6:TIC(+) 5:TIC(+) 4:TIC(+) 3:TIC(+) 2:TIC(+) 1:TIC(+)
(C)
0.0 5.0 10.0 15.0 20.0 25.0 30.0 35.0 40.0 45.0 min
0.0
2.5
5.0
7.5
(x10,000)
6:TIC(+) 5:TIC(+) 4:TIC(+) 3:TIC(+) 2:TIC(+) 1:TIC(+)
(A)
Etizolam
Triazolam
4-Hydroxytriazolam
alpha-Hydroxytriazolam
0.0 5.0 10.0 15.0 20.0 25.0 30.0 35.0 40.0 45.0 min
0.0
0.5
1.0
1.5
(x100,000)
6:TIC(+) 5:TIC(+) 4:TIC(+)(5.00) 3:TIC(+)(5.00) 2:TIC(+)(5.00) 1:TIC(+)(5.00)
(B) Peak 1 8-Ethylhydroxyetizolam
Peak 3 alpha-Hydroxyetizolam
Peak 5
CEQualitativeCEQunatitativecompounds
-39359.05>111.20-22359.05>341.104-Hydroxytriazolam
-18359.05>341.15-27359.05>176.20alpha-Hydroxytriazolam
-27359.05>287.20-28359.05>286.20alpha-Hydroxyetizolam (M-VI)
-20359.05>315.25-24359.05>305.058-Hydroxyetizolam (M -III)
-27343.05>315.00-24343.05>308.20Triazolam
-37343.05>138.15-28343.05>314.10Etizolam
Peak 2
Peak 4
Peak 6
Peak 7
Fig. 3 12 MRM transitions for 6 drugs and metabolites (above) and MRM chromatograms for sample (A), (B), (C).

5
Identification of triazolam, etizolam and their metabolites in biological samples by liquid chromatography tandem mass spectrometry
Two of the three unknown peaks were identified as 8-Ethylhydroxyetizolam and alpha-Hydroxyetizolam as they are known metabolites. However the third unknown peak, which was detected the same MRM transition as that of metabolites of these two compounds, was not identified.Next, sample (B) was re-acquired with MRM triggered
automatic MS/MS and product ion scans. These product ion scan spectra were searched against a hypnotics MS/MS library and the six previously identified peaks were assigned a high hit score. In the same manner as described here, this method is highly applicable to the screening of drugs of abuse in biological samples.
Loop time < 1 sec.
50 100 150 200 250 300 350 m/z0.0
0.5
1.0
1.5
2.0
Inten.(x10,000)
341.0
314.0272.9
111.1249.8183.1 358.4
Peak 4: 4 -Hydroxytriazolam
50 100 150 200 250 300 350 m/z0.0
2.5
5.0
7.5
Inten.(x10,000)
176.1
359.0313.0
277.0149.1 341.0266.0243.0204.1
Peak 2: alpha -Hydroxytriazolam
50 100 150 200 250 300 350 m/z0.0
2.5
5.0
Inten.(x10,000)
282.1 341.1315.1 359.1
247.1179.1154.1 204.057.2
331.1258.1232.096.0 291.1
Peak 1: 8 -Ethylhydroxyetizolam
50 100 150 200 250 300 350 m/z0.0
1.0
2.0
3.0
4.0
Inten.(x10,000)
286.1
287.1341.1305.1269.173.2 236.0137.3 330.1176.3209.4
Peak 3: alpha -Hydroxyetizolam
50 100 150 200 250 300 m/z0.0
1.0
2.0
3.0Inten.(x100,000)314.1
138.1 259.1
224.1 295.1245.1171.1123.157.2148.1 343.1
Peak 7: Etizolam
50 100 150 200 250 300 m/z0.0
2.5
5.0
Inten.(x100,000)
308.1
343.1
239.1165.1138.1 275.1
Peak 6: Triazolam
50 100 150 200 250 300 350 m/z0.0
0.5
1.0
Inten.(x10,000)
341.1
238.0273.0300.0314.0258.1
223.062.4 135.5110.5 331.3
Peak 5: ?
Fig. 4 MRM triggered MS/MS method and MS/MS spectra of Peak 1 to Peak 7
ConclusionsMetabolite analysis using LC/MS/MS with small particle size column achieved high resolution separation for the simultaneous analysis of etizolam, triazolam and their metabolites.
The metabolites were detected and confirmed with MRM triggered automatic MS/MS data acquisition.

For Research Use Only. Not for use in diagnostic procedures.The content of this publication shall not be reproduced, altered or sold for any commercial purpose without the written approval of Shimadzu. The information contained herein is provided to you "as is" without warranty of any kind including without limitation warranties as to its accuracy or completeness. Shimadzu does not assume any responsibility or liability for any damage, whether direct or indirect, relating to the use of this publication. This publication is based upon the information available to Shimadzu on or before the date of publication, and subject to change without notice.
© Shimadzu Corporation, 2012
First Edition: May, 2012
www.shimadzu.com/an/

Satoshi Yamaki, Manami Kobayashi, Tsutomu
Nishine
Shimadzu Corporation, Kyoto, JAPAN
Development of an LC-Based Metabolomic Approach for Polar Compounds in Brewage Samples using Fast Polarity Switching TOFMS Acquisition
ASMS 2012 WP13-300

2
IntroductionThe metabolomics technique can rapidly bring information about the similarities and differences within a chromatographic dataset. A metabolomic based approach has been established for metabolite profiling and biomarker discovery, however, it is equally applicable to other research fields including industrial chemical product characterization, food analysis and natural product research. Brewing and fermentation product of beer etc contains several polar metabolites such as amino acids, nucleic acids and organic acids, which provide important contribution on the product‘s quality, flavor and being useful index of a fermentation performance. Profiling studies for several beers using 1H NMR were performed for the requirement of quality control
and index compounds were determined 1, 2. The identification of carbohydrates is easily indicated by NMR but its method may need to be improved in respect of sensitivity. Liquid chromatography-mass spectrometry is one of a widely used tool in the field of metabolomics and metabolite profiling by high sensitivity and selectivity. To obtain the complete profile from a sample, it is necessary to run the LC/MS both positive and negative modes 3.In this study, we developed an LC-based approach to determine metabolite profiles including polar metabolites and to identify specific endogenous components, aiming at high throughput and comprehensive methods using TOFMS acquisition.
1) “Nexera” ※1 Ultra High Performance Liquid chromatograph2) “LCMS-IT-TOF” ※1 Hybrid Mass Spectrometer Fast scanning, fast polarity switching and formula prediction with high accuracy MSn analysis.
3) “Profiling Solution ver. 1.1” ※1 ,Create an aligned data array.
“SIMCA-P+ ver. 12” ※2 ,Data mining tool using multivariate statistical analysis.
“Formula Predictor ver. 1.2” ※1 ,Predicting the molecular formula of target compounds.
※1 Shimadzu, ※2 Umetrics
Analytical equipment
Strategy of differential analysis using MS-based methods
Approach of this study
Development of an LC-Based Metabolomic Approach for Polar Compounds in Brewage Samples using Fast Polarity Switching TOFMS Acquisition
Fig. 2 Work flow of the analysis of metabolites in fermentation products.
Fig. 1 Nexera UHPLC and LCMS-IT-TOF.
Analytical Instrument A large number of gata One array of data Software of Statistical Analysis

3
ResultsIdentification of the isolated compounds From beer sample, about 60 peaks were detected by peak integration function in positive ion total ion current chromatogram (TICC) and about 30 peaks were detected in negative ion TICC within a 20 min HPLC separation (Fig. 3). When mass accuracy was checked with the known compound such as malic acid and adenosine, it turned out that MS measurement was performed in the accuracy of less than 3 ppm (using external calibration) acquired with fast polarity switching. These detected peaks were verified using formula prediction software that takes into account MSn information, mass accuracy and isotope modeling. Furthermore, tyrosine, phenylalanine, proline, pyroglutamic acid, fumaric acid and hypoxanthine were tentatively assigned by reference to published literature, and identified using authentic standards.
Table 2 Analytical conditions of LC/MS
Fig. 3 MS chromatogram of a lager beer No. 20 in Table 1. The important components include amino acids, organic acids and nucleic acids were detected.
Development of an LC-Based Metabolomic Approach for Polar Compounds in Brewage Samples using Fast Polarity Switching TOFMS Acquisition
Table 1 Some Characteristics of the Beers analyzed
*1: Tax category of Japanese liquor. Beer: Malt content, 67% or higher.Low-malt beer: Less than 67% malt (analyzed product contains less than 25% malt).
The third beer: Use malt alternatives, or mix of low -malt beer and another type of spirits.(High-malt beer: The manufacturer sells the beer of 100% of malt use as high premium beer of added value.)
sample no. classification *1 type % alcohol origin1 the third beer (no malt) 5.0 Japan2 the third beer 5.0 Japan3 the third beer 5.0 Japan4 the third beer 5.0 Japan5 the third beer 5.0 Japan6 the third beer 5.0 Japan7 low-malt beer lager 5.5 Japan8 low-malt beer lager 5.5 Japan9 low-malt beer lager 5.5 Japan10 beer lager 5.0 Japan11 beer lager 5.0 Japan12 beer ale 6.5 Japan13 beer lager 5.0 Japan14 beer lager 6.0 Japan15 beer lager 5.0 Japan16 beer lager 4.5 Mexico17 beer ale 7.0 Belgium18 beer ale 9.0 Belgium19 beer (high-malt beer) lager 5.5 Japan20 beer (high-malt beer) lager 5.0 Japan21 beer (high-malt beer) lager 5.5 Japan22 beer (high-malt beer) lager 5.5 Japan23 beer (high-malt beer) lager 5.0 Japan24 beer (high-malt beer) lager 5.0 Korea25 beer (high-malt beer) ale 5.0 Japan
Column:
Flow rate:
Column temp.:
Mobile phase:
Time prog.:
Injection vol.:
Mixer vol.:
Ionization mode:
Probe voltage:
CDL temperature:
BH temperature:
Nebulizing gas flow:
Drying gas flow:
CDL,Q-array voltage:
Scan range:
Phenomenex Synergi Hydro-RP 80A
(150 mm L. x 2.0 mmI.D., 4.0 um)
0.2 mL/min
40°C
A) Water containing 0.1% formic acid
B) 80% Acetonitrile containing 0.1% formic acid
0%B (0-8 min) → 100%B (18-22 min) →
0%B (22.01 min) → STOP 37 min
2 uL
0.5 mL
ESI positive and negative
+4.5 kV/-3.5 kV
200°C
200°C
1.5 L/min
0.1 MPa
Default value
m/z 85-1000
Positive TICC
Negative TICC
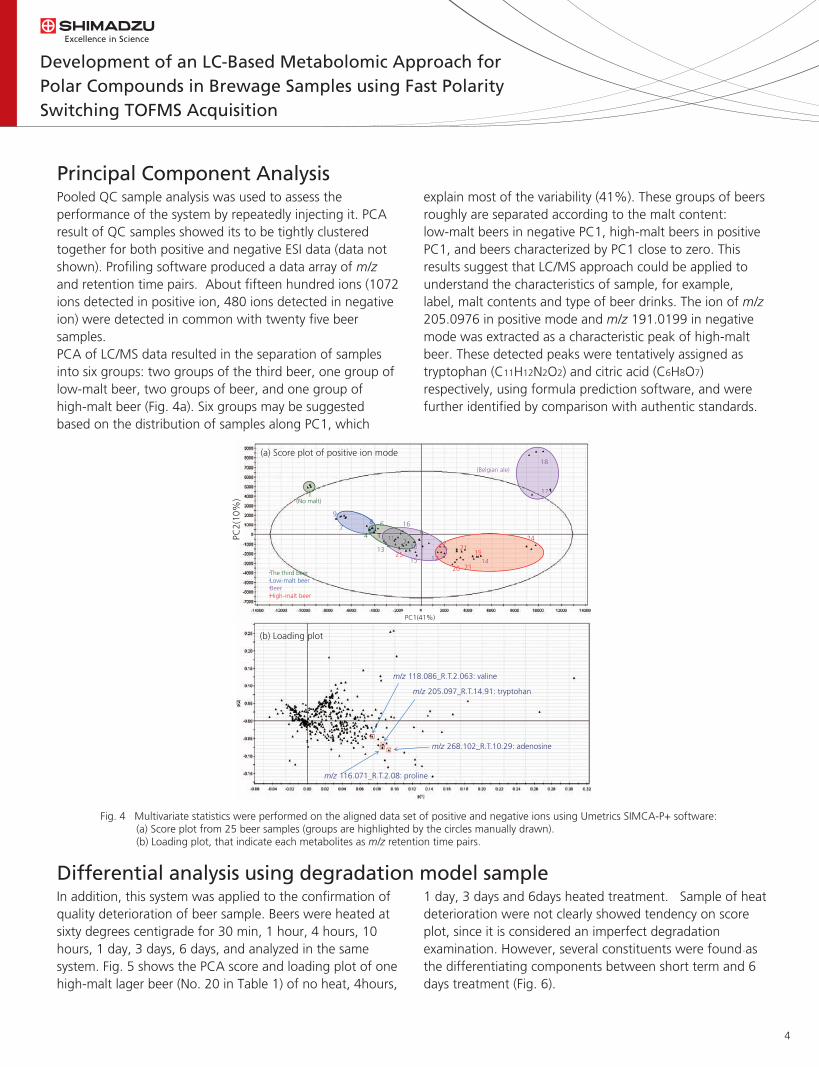
4
Fig. 4 Multivariate statistics were performed on the aligned data set of positive and negative ions using Umetrics SIMCA-P+ software: (a) Score plot from 25 beer samples (groups are highlighted by the circles manually drawn). (b) Loading plot, that indicate each metabolites as m/z retention time pairs.
Principal Component AnalysisPooled QC sample analysis was used to assess the performance of the system by repeatedly injecting it. PCA result of QC samples showed its to be tightly clustered together for both positive and negative ESI data (data not shown). Profiling software produced a data array of m/z and retention time pairs. About fifteen hundred ions (1072 ions detected in positive ion, 480 ions detected in negative ion) were detected in common with twenty five beer samples.PCA of LC/MS data resulted in the separation of samples into six groups: two groups of the third beer, one group of low-malt beer, two groups of beer, and one group of high-malt beer (Fig. 4a). Six groups may be suggested based on the distribution of samples along PC1, which
explain most of the variability (41%). These groups of beers roughly are separated according to the malt content: low-malt beers in negative PC1, high-malt beers in positive PC1, and beers characterized by PC1 close to zero. This results suggest that LC/MS approach could be applied to understand the characteristics of sample, for example, label, malt contents and type of beer drinks. The ion of m/z 205.0976 in positive mode and m/z 191.0199 in negative mode was extracted as a characteristic peak of high-malt beer. These detected peaks were tentatively assigned as tryptophan (C11H12N2O2) and citric acid (C6H8O7) respectively, using formula prediction software, and were further identified by comparison with authentic standards.
Differential analysis using degradation model sampleIn addition, this system was applied to the confirmation of quality deterioration of beer sample. Beers were heated at sixty degrees centigrade for 30 min, 1 hour, 4 hours, 10 hours, 1 day, 3 days, 6 days, and analyzed in the same system. Fig. 5 shows the PCA score and loading plot of one high-malt lager beer (No. 20 in Table 1) of no heat, 4hours,
1 day, 3 days and 6days heated treatment. Sample of heat deterioration were not clearly showed tendency on score plot, since it is considered an imperfect degradation examination. However, several constituents were found as the differentiating components between short term and 6 days treatment (Fig. 6).
(a) Score plot of positive ion mode
1 17
18
24
9
7 8
4
6
3
16
13
11
25 15
10 2
5
12
22
20 23
21 19
14
8
2515
10
5
12
224
2
20 23
2119
142
22
6
3 1110
2
17
18
・The third beer ・Low-malt beer ・Beer ・High-malt beer
(No malt)
(Belgian ale)
(b) Loading plot
PC1(41%)
PC2(
10%
)
1
m/z 268.102_R.T.10.29: adenosine
m/z 205.097_R.T.14.91: tryptohan
m/z 116.071_R.T.2.08: proline
m/z 118.086_R.T.2.063: valine
Development of an LC-Based Metabolomic Approach for Polar Compounds in Brewage Samples using Fast Polarity Switching TOFMS Acquisition

5
This result suggests that LC/MS approach could be applied to evaluate the content of degradation of several fields such as industrial products. These detected components were tentatively assigned using Formula Predictor software
(Fig. 7) and MSn spectra. One of the decreasing intensity of ions by heat treatment was tentatively assigned as deoxyadenosine (C10H13N5O3).
Fig. 5 PCA score plot and loading plot of a lager beer obtained from degradation model data on positive ion mode.
Fig. 6 XVat plot of m/z 252.109 eluted at 12.198 minutes. Y axis shows the intensity of detected ion and X axis shows the sample name.
Fig. 7 The formula prediction software results on the m/z 252.1091 ion are displayed. The highest score calculated corresponds to the molecular formula C10H13N5O3.
3 days
6 days 1 day
No heat
4 hours
PC1(33%)
PC2(
28%
)
Peaks which decrease intensity by heating
(a) Score plot (b) Loading plot
No heat 4 hours 1 day 3 days 6 days
N
N
N
N
NH2
O
OH
OH
DeoxyadenosineMolecular Formula = C10H13N5O3Formula Weight = 251.24192Monoisotopic Mass = 251.101839 Da[M+H]+ = 252.109116 Da[M-H]- = 250.094563 Da
m/z 136.06
Development of an LC-Based Metabolomic Approach for Polar Compounds in Brewage Samples using Fast Polarity Switching TOFMS Acquisition

6
ConclusionsMass spectrometry-based metabolite profiling was used to identify changes in chemical component levels in fermentation product model using fast polarity switching TOFMS analysis.Bioactive marker compounds that belong to the polar metabolites were measured and identified using a combination of high accuracy MSn data and verified by reference to authentic standards and to internal and external databases.
Mass spectrometry in combination with multivariate analysis is useful for the rapid determination of subtle differences and exploring the potential markers for quality control not only within the beer products but also in other beverages and biofluids.
1) I. Duarte et. al., J Agric. Food Chem., 2002, 50, 2475-24812) C. Almeida et. al., J Agric. Food Chem., 2006, 54, 700-706 3) S. Yamaki et. Al., 59th ASMS Conference in Denver, WP 354 (2011)
References
Development of an LC-Based Metabolomic Approach for Polar Compounds in Brewage Samples using Fast Polarity Switching TOFMS Acquisition

For Research Use Only. Not for use in diagnostic procedures.The content of this publication shall not be reproduced, altered or sold for any commercial purpose without the written approval of Shimadzu. The information contained herein is provided to you "as is" without warranty of any kind including without limitation warranties as to its accuracy or completeness. Shimadzu does not assume any responsibility or liability for any damage, whether direct or indirect, relating to the use of this publication. This publication is based upon the information available to Shimadzu on or before the date of publication, and subject to change without notice.
© Shimadzu Corporation, 2012
First Edition: May, 2012
www.shimadzu.com/an/
Yuzo Yamazaki, Keisuke Shima SHIMADZU CORPORATION, Kyoto, Japan
Differentiation of isobaric residues in SPITC-derivatized tryptic peptides using MS/MS technique in a Curved Field Reflectron.
ASMS 2012 TP09-189

2
OverviewSpecific fragment ions obtained by CFR can discriminate isobaric residues in SPITC-derivatized peptides without impairing interpretable sequence information.Differentiations of Ile/Leu and αα- /βAsp are performed successfully.Switching PSD to HE-CID rapidly is valuable for de novo sequencing.
IntroductionFixing a strong negative charge at N-terminus of tryptic peptide is a quite effective chemical derivertization for de novo sequencing by using post-source decay (PSD) on MALDI-TOFMS. However, whereas the chemical derivertization causes interpretable y-ions mainly, one
cannot differentiate isobaric amino acid residues, for instance, Ile/Leu and α- /βAsp. We report our study of differentiation of these residues by using PSD and a high energy CID.
MethodsMALDI-TOFMS Instrument: AXIMA-Performance (Shimadzu Biotech/Kratos) Measurement: PSD and high-energy CID-MS/MS in positive ion mode. Collision gas: helium Collision energy: 20 keV (laboratory frame of reference).
Curved Field Reflectron(1),(2)
Mix-mode of PSD and CID. All fragment ions generated in both PSD and CID are detected simultaneously. No precursor suppression system. No stitch, seamless PSD. Only 30 sec. to switch PSD to CID. High energy collision at 20 keV. No deceleration, no re-acceleration. Easy operation.
Samples Tryptic digests of BSA and β-casein Synthesized peptides including α-and βAsp, originated from human α-crystallin
Derivatization of 4-sulphophenyl isothiocyanate(SPITC) on a ZipTip(3). Guanidination: 3 hours at 37°C Sulfonation: 2 hours at 50°C
Differentiation of isobaric residues in SPITC-derivatized tryptic peptides using MS/MS technique in a Curved Field Reflectron.
Gas on / CIDGas off / PSD
N2 Laser337 nm, 3ns
Gas on / CID
N2 Laser337 nm, 3ns
Gas on / CIDGas off / PSD
N2 Laser337 nm, 3ns
- O3S-AA1-AA2-AA3------------ AAn- Arg - COOH - +
PSD y-ions
y1
y2
y3
yn-2
yn-1
SO
O
O
N C S NH2 peptide COOH
SO
O
O
HN C
SHN peptide COOH
Fig.1 Description of CFR Fig.2 SPITC derivatization for de novo sequencing

3
ResultsDifferentiation of Ile/Leu
Differentiation of isobaric residues in SPITC-derivatized tryptic peptides using MS/MS technique in a Curved Field Reflectron.
Fig.1 Description of CFR Fig.1 Description of CFR Fig.1 Description of CFR
0
10
20
30
40
50
60
70
80
90
100
%Int.
900 950 1000 1050 1100 1150 1200m/z
1[c].G3
927.6
1121.6
1142.5
904.5 997.7 1113.5 1163.7
0
20
40
60
80
100
%Int.
100 200 300 400 500 600 700 800 900 1000 1100m/z
1[c].G3
2[c].G3
X10
1142.6
1142.6
927.4
927.3
764.2
764.2
969.5
969.5
245.9
1139.3
136.0
358.8175.0
245.9
651.3488.2405.8
358.8651.3488.2
276.9
910.3705.3412.8
988.0918.0
988.185.9
174.9
543.0774.5
747.0
341.8 482.3 634.7
378.6
146.9 200.9
277.0
0
20
40
60
80
100
%Int.
240 260 280 300 320 340 360 380 400 420m/z
1[c].G3
2[c].G3
245.9
358.8
245.9
405.8
358.8
378.6276.9
405.8
313.9 412.8248.9 292.9
341.8
378.6277.0
45
58
Ile HE -CID
PSD
300.8
Xle
Xle
HE -CID
PSD
+215
SPITC - NH- Y- L - Y- E- I - A- R- COOH
Xle
Xle
y3 y2 y6 y5
y3
y2
0
10
20
30
40
50
60
70
80
90
100
%Int.
1450 1500 1550 1600 1650 1700m/z
1[c].G7
1567.7
1480.8
1724.9
1479.8
1640.0
1676.9
1537.8 1694.91573.7
0
20
40
60
80
100
%Int.
200 400 600 800 1000 1200 1400 1600m/z
1[c].H3
2[c].H3
X10
1481.5
1696.2
1679.2
1696.3
1368.3 1633.31523.6
1679.21368.3
1549.6
1523.61649.0
571.3
1415.8
571.3
686.61018.9
686.5
1182.1814.3
1018.8814.3 1277.3387.2
387.3
274.2 500.3
500.3
1350.7
274.2
868.8 1140.3
992.0
175.2 992.1740.4640.6441.4342.2
669.0
526.3
175.1
257.4136.1
0
20
40
60
80
100
%Int.
240 260 280 300 320 340 360 380 400 420 440 460 480 500 520 540m/z
1[c].H3
2[c].H3387.3
274.2500.3
500.3274.2
441.4342.2
512.3526.3329.1 407.5243.3 299.9 370.3 427.9257.4 314.2 355.9333.0
510.4 539.9410.8 461.8428.1370.2322.7257.3 300.2
SPITC - NH- LGEYGFQNALI VR- COOH
+215
Xle
HE -CID
PSD Xle
Xle Xle
45
Ile HE -CID
PSD 300.8
y3 y2 y4
Leu
59
y2
y3 y4
y12
y13
Xle
Xle
0
10
20
30
40
50
60
70
80
90
100
%Int.
2200 2250 2300 2350 2400m/z
1[c].E20
X5
2186.2
2243.3
2191.3 2229.32211.2 2353.22247.3
2401.3
2171.2 2285.2
SPITC - NH- DMPIQAFLL YQEPVL GPVR- COOH
0
20
40
60
80
100
%Int.
400 600 800 1000 1200 1400 1600 1800 2000 2200 2400m/z
1[c].E20
2[c].E20
X5
2187.9
2402.7
2072.7
2230.0
2188.0
2388.32135.2
2072.9
736.9
2402.9
1157.91731.0
2230.0
1531.71384.5
736.6
1941.2
2262.5
1157.8
994.9
2388.1
1271.2
866.1
1602.7 1730.9540.9 995.0 1940.3427.8 866.1
541.0427.9
1325.6790.9 920.5410.7
719.6
0
20
40
60
80
100
%Int.
1100 1150 1200 1250 1300 1350 1400 1450m/z
1[c].E20
2[c].E201157.9
1271.3
1384.5
1157.8
1271.21384.6
1325.6
1434.9
1211.9
+215
Xle HE -CID
PSD
Xle Xle Xle?
Xle Xle Xle Xle?
HE -CID
PSD
y12 Leu
59
Leu
59
y4
y5
y16
y17
y10
y11 y12
y11 y10
MS MS MS
Fig. 3 Analysis of tryptic peptide of BSA #1
Fig. 4 Analysis of tryptic peptide of BSA #2
Fig. 5 Analysis of tryptic peptide of β-casein
113 gap
No
Xle 113
CID gas on
y-59(w)
Leu 113 Yes
y-45(w)
Ile 113
HE -CID PSD
Fig. 6 A possible flow, where de novo sequencing incorporates the differentiation.

4
ConclusionsIle and Leu in SPITC-derivatized peptides were differentiated successfully by high energy CID-MS/MS in a CFR.y-59 and y-45 between two y-ions, a mass difference of which is 113, were specific side chain fragmentations that indicate Leu and Ile respectively.Since PSD of the derivatized-peptide is still useful to read out an amino acid sequence easily, taking spectrum in both PSD and HE-CID could be more preferable to obtain a
(1)Cordero MM, et al; Rapid Commun Mass Spectrom., 1995, 9, pp1356-61.(2)Cornish TJ, et al; Rapid Commun Mass Spectrom., 1993, 7, pp1037-40.(3)Chen, P., et al; Rapid Commun. Mass Spectrom., 2004, 18, pp191-198.(4)Yamazaki, Y.,et al; Anal. Chem., 2010, 82 (15), pp 6384–6394.
complete amino acid sequence. The SPITC derivatization induced more cleavable N-terminal side of the Asp residue than the one in a underivertized counterpart. Notably, the specific y-ion ratios of Asp isomers were still retained after the derivertization, which is thought to be useful to perform further quantitative analysis.
Differentiation of isobaric residues in SPITC-derivatized tryptic peptides using MS/MS technique in a Curved Field Reflectron.
0
10
20
30
40
50
60
70
80
90
100
%Int.
1150 1200 1250 1300 1350 1400 1450m/z
1[c].G1
1175.5
1177.7
1390.51180.7
1231.71188.81157.6
T6α
+215
0
10
20
30
40
50
60
70
80
90
100
%Int.
1150 1200 1250 1300 1350 1400 1450m/z
1[c].G2
1175.6
1390.61180.8
1157.6 1231.7
T6β
+215
SPITC - NH- TVL D(α/β) SGISEV R- COOH
y7
y8
0
20
40
60
80
100
%Int.
200 400 600 800 1000 1200 1400m/z
1[c].G1
2[c].G2
X5
1390.9
1390.8
1175.7
1175.6
1074.5
1074.4
747.3 862.3
1217.7
1217.7
489.9 747.4
489.8
1373.0
660.2
660.3 862.5
975.4
274.0 975.4402.9
274.0 402.9
175.1 1131.7
844.7 1131.5175.1 603.3
0
10
20
30
40
50
60
70
80
90
100
%Int.
650 700 750 800 850 900 950 1000m/z
747.3 862.3
660.2
862.5
975.4
844.7
SPITC -derivatized
PSD PSD
T6α
T6β
T6α T6β y7 y8
0
10
20
30
40
50
60
70
80
90
100
%Int.
650 700 750 800 850 900 950 1000m/z
746.9
861.8
844.3815.9
0
20
40
60
80
100
%Int.
200 400 600 800 1000 1200m/z
1[c].G1
2[c].G2
X10 X10
1174.8
1175.1
746.9 1181.4
746.9
861.8
273.7
861.9
844.3
174.8 572.7 659.6 1074.1974.9
273.7
472.9372.2 729.1
772.4
659.9174.8 975.0
256.7
572.7472.9 1074.1
544.6 602.7
372.3
315.3 668.1
256.6 315.4
underivatized
PSD
T6α
T6β
T6α
T6β
y7
y8
T6 peptide;
(A)
(C)
(B)
Fig. 7 Effect of the derivatization on a differentiation of Asp isomers. MS spectra after the derivatization (A), PSD spectra (B), and an amino acid sequence of T6 peptide and a proposed fragmentation of Asp isomers (C).
Differentiation of α-and βAsp(4)
References

For Research Use Only. Not for use in diagnostic procedures.The content of this publication shall not be reproduced, altered or sold for any commercial purpose without the written approval of Shimadzu. The information contained herein is provided to you "as is" without warranty of any kind including without limitation warranties as to its accuracy or completeness. Shimadzu does not assume any responsibility or liability for any damage, whether direct or indirect, relating to the use of this publication. This publication is based upon the information available to Shimadzu on or before the date of publication, and subject to change without notice.
© Shimadzu Corporation, 2012
First Edition: May, 2012
www.shimadzu.com/an/

Shimadzu FranceLe Luzard II – Bat. ABd Salvador Allende
Noisiel 77448 Marne la Vallée Cedex 2
Tél : 01 60 95 10 10Fax : 01 60 06 51 66
Email : [email protected] : www.shimadzu.fr