london stock exchange group plc stock exchange group page 4 ... our business model and proven track...
TRANSCRIPT
London Stock Exchange Group plc
Interim results – six months ended 30 June 2017
3 August 2017
Page 1
London Stock Exchange Group Page 2
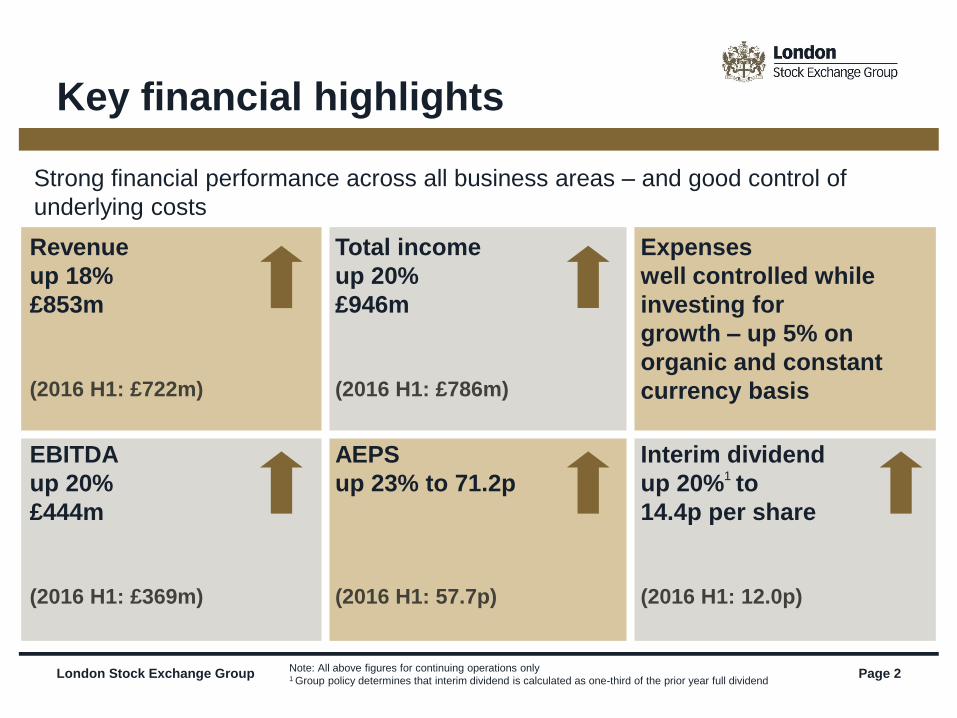
Key financial highlights
Strong financial performance across all business areas – and good control of
underlying costs
Revenue
up 18%
£853m
(2016 H1: £722m)
Total income
up 20%
£946m
(2016 H1: £786m)
Expenses
well controlled while
investing for
growth – up 5% on
organic and constant
currency basis
EBITDA
up 20%
£444m
(2016 H1: £369m)
AEPS
up 23% to 71.2p
(2016 H1: 57.7p)
Interim dividend
up 20%1 to
14.4p per share
(2016 H1: 12.0p)
Note: All above figures for continuing operations only 1 Group policy determines that interim dividend is calculated as one-third of the prior year full dividend
London Stock Exchange Group Page 3
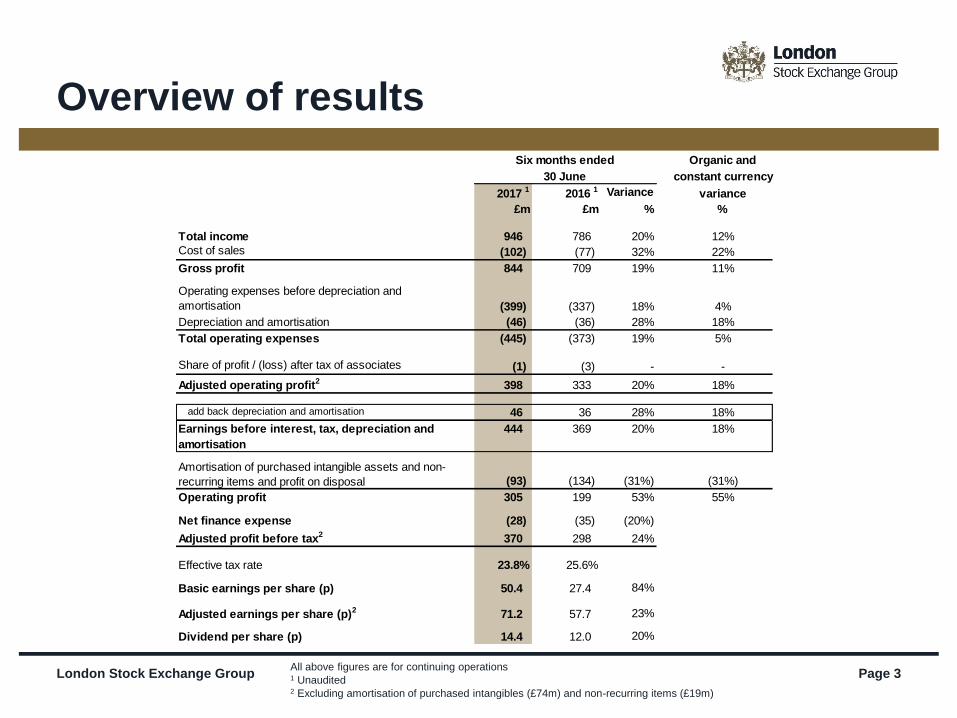
Overview of results
All above figures are for continuing operations
1 Unaudited 2 Excluding amortisation of purchased intangibles (£74m) and non-recurring items (£19m)
Organic and
constant currency
2017 1 2016 1 Variance variance
£m £m % %
Total income 946 786 20% 12%
Cost of sales (102) (77) 32% 22%
Gross profit 844 709 19% 11%
Operating expenses before depreciation and
amortisation (399) (337) 18% 4%
Depreciation and amortisation (46) (36) 28% 18%
Total operating expenses (445) (373) 19% 5%
Share of profit / (loss) after tax of associates (1) (3) - -
Adjusted operating profit2 398 333 20% 18%
add back depreciation and amortisation 46 36 28% 18%
Earnings before interest, tax, depreciation and
amortisation
444 369 20% 18%
Amortisation of purchased intangible assets and non-
recurring items and profit on disposal (93) (134) (31%) (31%)
Operating profit 305 199 53% 55%
Net finance expense (28) (35) (20%)
Adjusted profit before tax2 370 298 24%
Effective tax rate 23.8% 25.6%
Basic earnings per share (p) 50.4 27.4 84%
Adjusted earnings per share (p)2 71.2 57.7 23%
Dividend per share (p) 14.4 12.0 20%
30 June
Six months ended
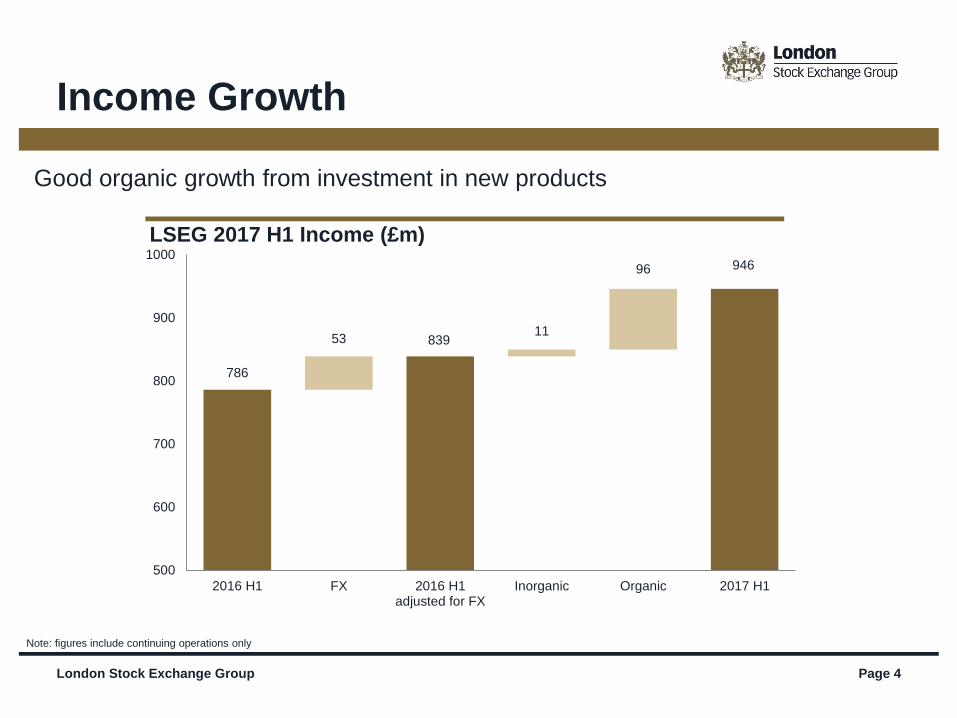
786
839
946
53 11
96
500
600
700
800
900
1000
2016 H1 FX 2016 H1adjusted for FX
Inorganic Organic 2017 H1
London Stock Exchange Group Page 4
Income Growth
Good organic growth from investment in new products
LSEG 2017 H1 Income (£m)
Note: figures include continuing operations only
London Stock Exchange Group Page 5
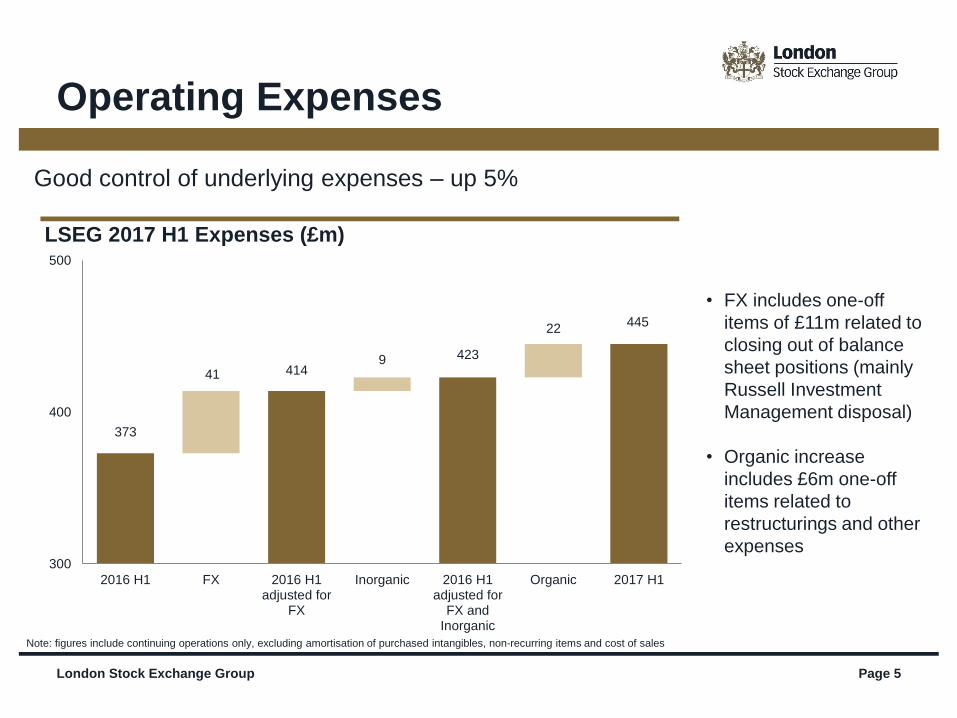
Good control of underlying expenses – up 5%
Note: figures include continuing operations only, excluding amortisation of purchased intangibles, non-recurring items and cost of sales
LSEG 2017 H1 Expenses (£m)
Operating Expenses
• FX includes one-off
items of £11m related to
closing out of balance
sheet positions (mainly
Russell Investment
Management disposal)
• Organic increase
includes £6m one-off
items related to
restructurings and other
expenses
373
414
423
445
41 9
22
300
400
500
2016 H1 FX 2016 H1adjusted for
FX
Inorganic 2016 H1adjusted for
FX andInorganic
Organic 2017 H1
London Stock Exchange Group Page 6
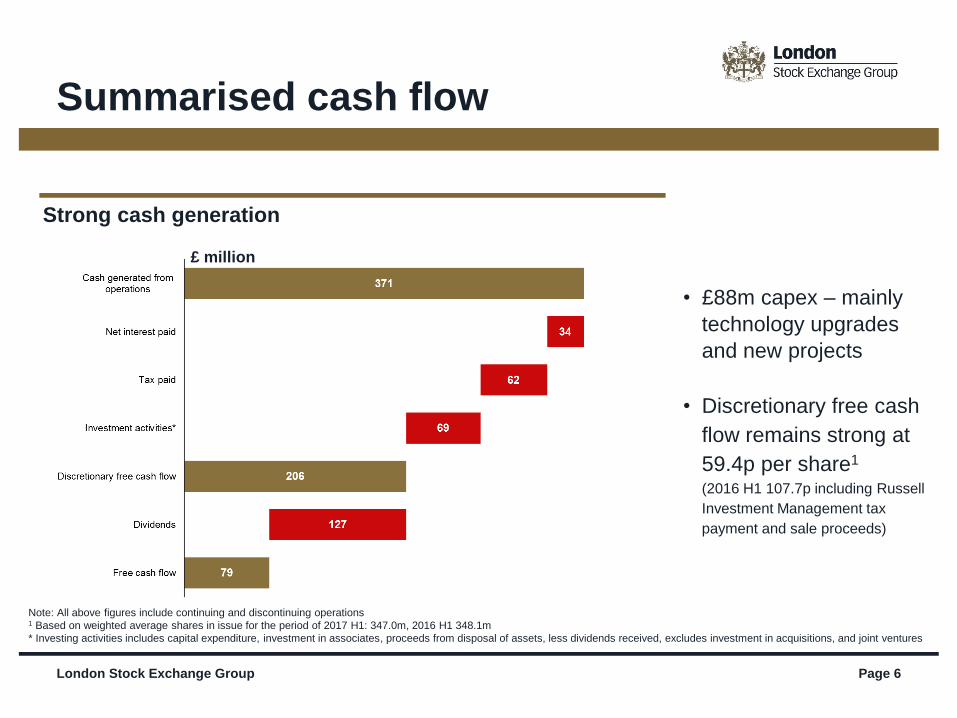
Note: All above figures include continuing and discontinuing operations
1 Based on weighted average shares in issue for the period of 2017 H1: 347.0m, 2016 H1 348.1m
* Investing activities includes capital expenditure, investment in associates, proceeds from disposal of assets, less dividends received, excludes investment in acquisitions, and joint ventures
• £88m capex – mainly
technology upgrades
and new projects
• Discretionary free cash
flow remains strong at
59.4p per share1
(2016 H1 107.7p including Russell
Investment Management tax
payment and sale proceeds)
£ million
Summarised cash flow
Strong cash generation
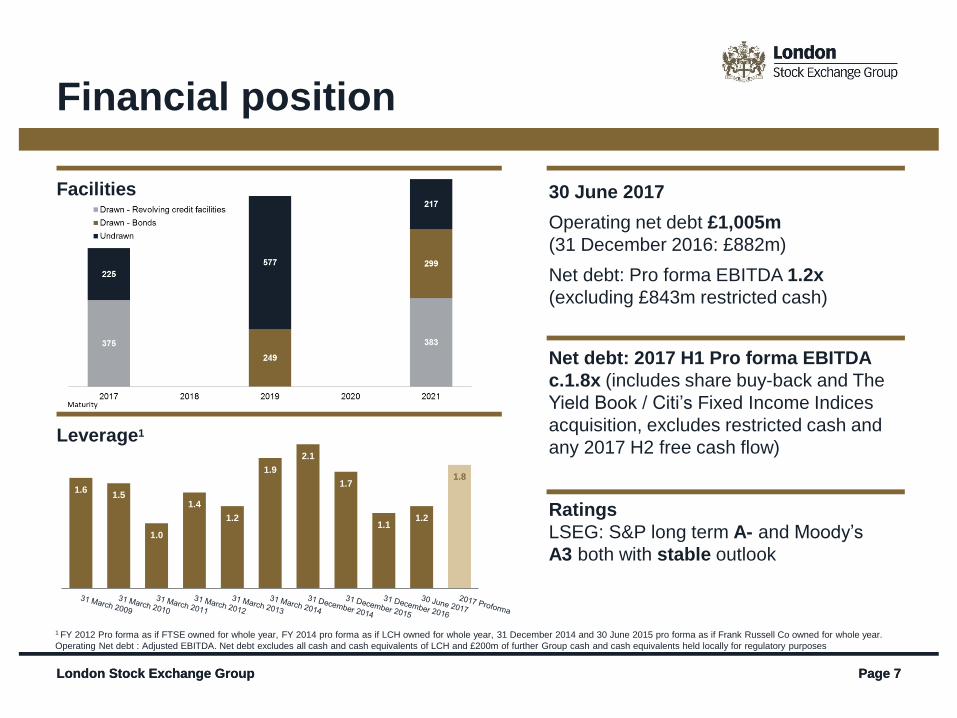
1.8
1.2 1.1
1.7
2.1
1.9
1.2
1.4
1.0
1.5 1.6
London Stock Exchange Group Page 7 London Stock Exchange Group Page 7
1 FY 2012 Pro forma as if FTSE owned for whole year, FY 2014 pro forma as if LCH owned for whole year, 31 December 2014 and 30 June 2015 pro forma as if Frank Russell Co owned for whole year.
Operating Net debt : Adjusted EBITDA. Net debt excludes all cash and cash equivalents of LCH and £200m of further Group cash and cash equivalents held locally for regulatory purposes
Leverage1
30 June 2017
Operating net debt £1,005m
(31 December 2016: £882m)
Net debt: Pro forma EBITDA 1.2x
(excluding £843m restricted cash)
Net debt: 2017 H1 Pro forma EBITDA
c.1.8x (includes share buy-back and The
Yield Book / Citi’s Fixed Income Indices
acquisition, excludes restricted cash and
any 2017 H2 free cash flow)
Ratings
LSEG: S&P long term A- and Moody’s
A3 both with stable outlook
Facilities
Financial position
- MiFID II implementation from January 2018
- MiFID II mandates Open Access across financial markets infrastructure
- Will promote greater competition, transparency and innovation through unbundling of
services and fees
- Transparency and consumer choice will create deeper pools of liquidity, reduce costs
and lead to better risk management
- LSEG well positioned with both Open Access and customer partnership at the core of
our business model and proven track record (LCH, CurveGlobal, Turquoise, MTS)
- Our Open Access business model is MiFID II ready
London Stock Exchange Group Page 8
MiFID II opportunities
Our clients have absolute choice across our value chain - fundamentally different
approach to peers
London Stock Exchange Group Page 9
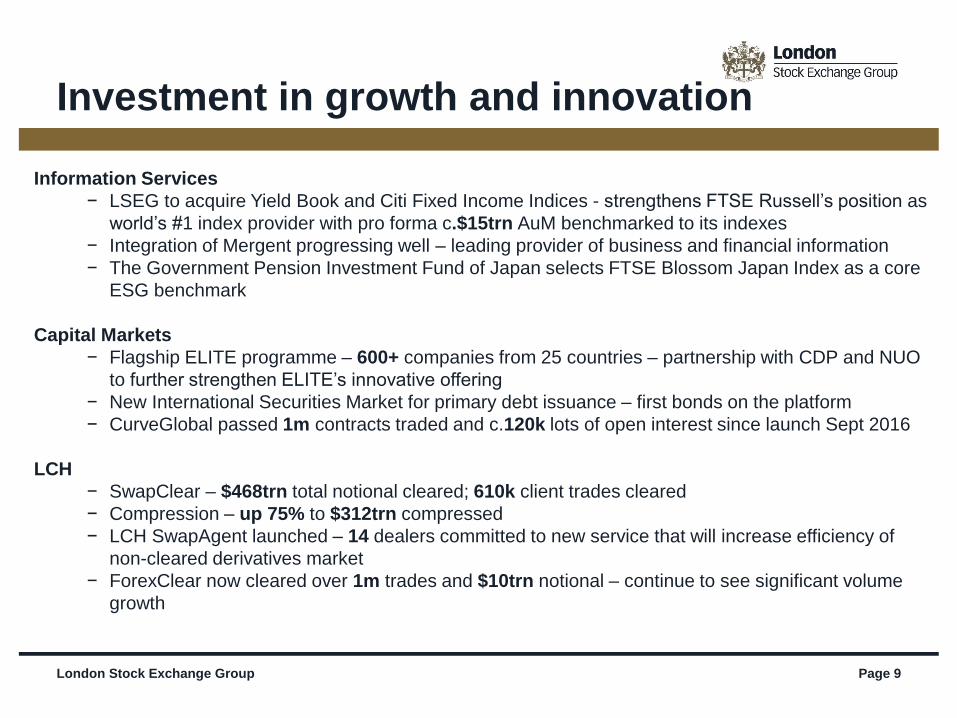
Information Services
− LSEG to acquire Yield Book and Citi Fixed Income Indices - strengthens FTSE Russell’s position as
world’s #1 index provider with pro forma c.$15trn AuM benchmarked to its indexes
− Integration of Mergent progressing well – leading provider of business and financial information
− The Government Pension Investment Fund of Japan selects FTSE Blossom Japan Index as a core
ESG benchmark
Capital Markets
− Flagship ELITE programme – 600+ companies from 25 countries – partnership with CDP and NUO
to further strengthen ELITE’s innovative offering
− New International Securities Market for primary debt issuance – first bonds on the platform
− CurveGlobal passed 1m contracts traded and c.120k lots of open interest since launch Sept 2016
LCH
− SwapClear – $468trn total notional cleared; 610k client trades cleared
− Compression – up 75% to $312trn compressed
− LCH SwapAgent launched – 14 dealers committed to new service that will increase efficiency of
non-cleared derivatives market
− ForexClear now cleared over 1m trades and $10trn notional – continue to see significant volume
growth
Investment in growth and innovation
London Stock Exchange Group Page 10
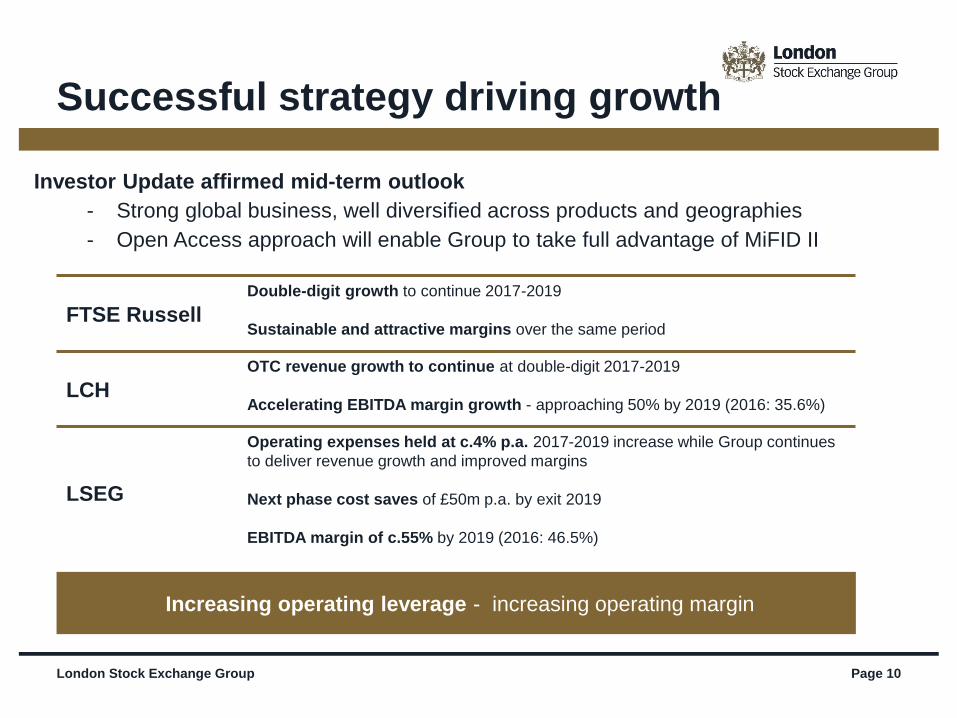
Investor Update affirmed mid-term outlook
- Strong global business, well diversified across products and geographies
- Open Access approach will enable Group to take full advantage of MiFID II
Successful strategy driving growth
FTSE Russell
Double-digit growth to continue 2017-2019
Sustainable and attractive margins over the same period
LCH
OTC revenue growth to continue at double-digit 2017-2019
Accelerating EBITDA margin growth - approaching 50% by 2019 (2016: 35.6%)
LSEG
Operating expenses held at c.4% p.a. 2017-2019 increase while Group continues
to deliver revenue growth and improved margins
Next phase cost saves of £50m p.a. by exit 2019
EBITDA margin of c.55% by 2019 (2016: 46.5%)
Increasing operating leverage - increasing operating margin

Appendices
Page 11
London Stock Exchange Group Page 12
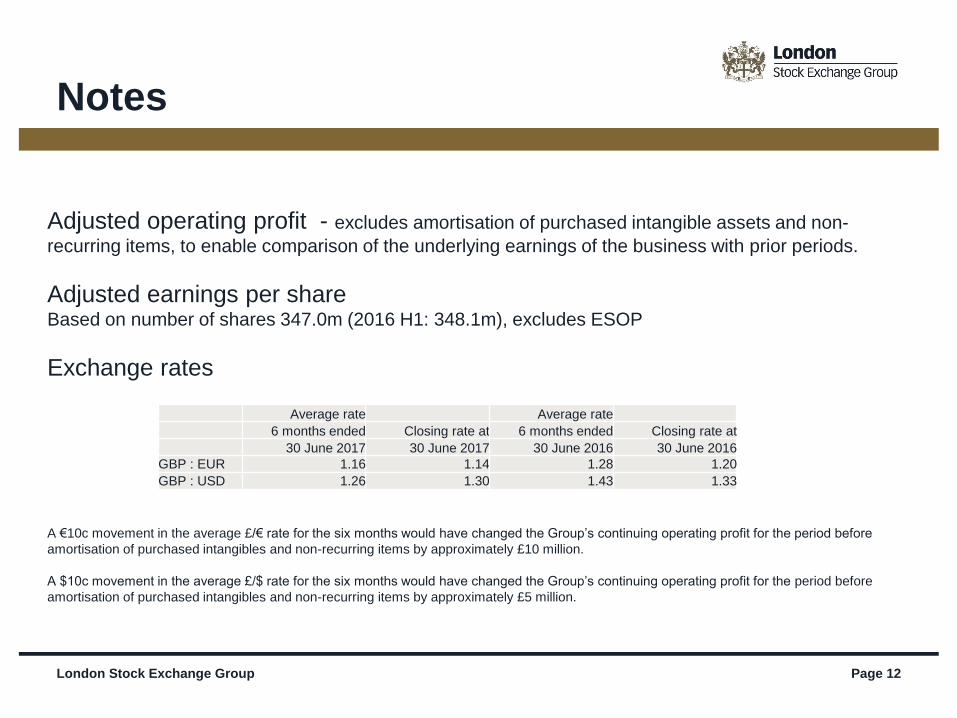
Notes
Adjusted operating profit - excludes amortisation of purchased intangible assets and non-
recurring items, to enable comparison of the underlying earnings of the business with prior periods.
Adjusted earnings per share Based on number of shares 347.0m (2016 H1: 348.1m), excludes ESOP
Exchange rates
A €10c movement in the average £/€ rate for the six months would have changed the Group’s continuing operating profit for the period before
amortisation of purchased intangibles and non-recurring items by approximately £10 million.
A $10c movement in the average £/$ rate for the six months would have changed the Group’s continuing operating profit for the period before
amortisation of purchased intangibles and non-recurring items by approximately £5 million.
Average rate Average rate
6 months ended Closing rate at 6 months ended Closing rate at
30 June 2017 30 June 2017 30 June 2016 30 June 2016
GBP : EUR 1.16 1.14 1.28 1.20
GBP : USD 1.26 1.30 1.43 1.33
36% Post Trade
38% Information
services
London Stock Exchange Group Page 13
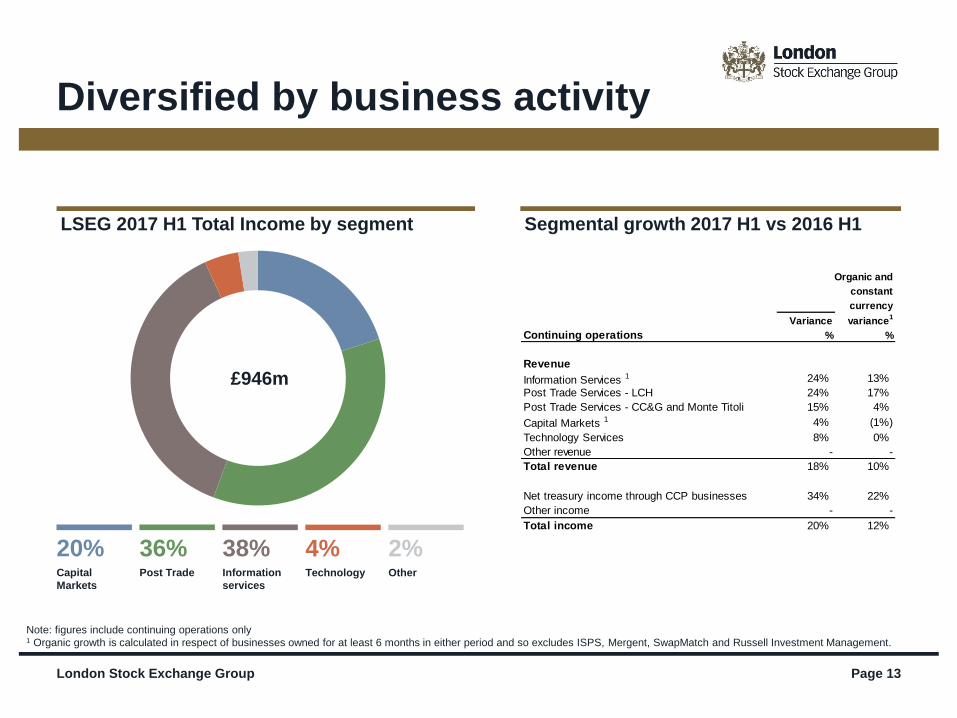
Diversified by business activity
Note: figures include continuing operations only 1 Organic growth is calculated in respect of businesses owned for at least 6 months in either period and so excludes ISPS, Mergent, SwapMatch and Russell Investment Management.
£946m
20% Capital
Markets
4% Technology
2% Other
LSEG 2017 H1 Total Income by segment Segmental growth 2017 H1 vs 2016 H1
Organic and
constant
currency
Variance variance1
Continuing operations % %
Revenue
Information Services 1 24% 13%
Post Trade Services - LCH 24% 17%
Post Trade Services - CC&G and Monte Titoli 15% 4%
Capital Markets 1 4% (1%)
Technology Services 8% 0%
Other revenue - -
Total revenue 18% 10%
Net treasury income through CCP businesses 34% 22%
Other income - -
Total income 20% 12%
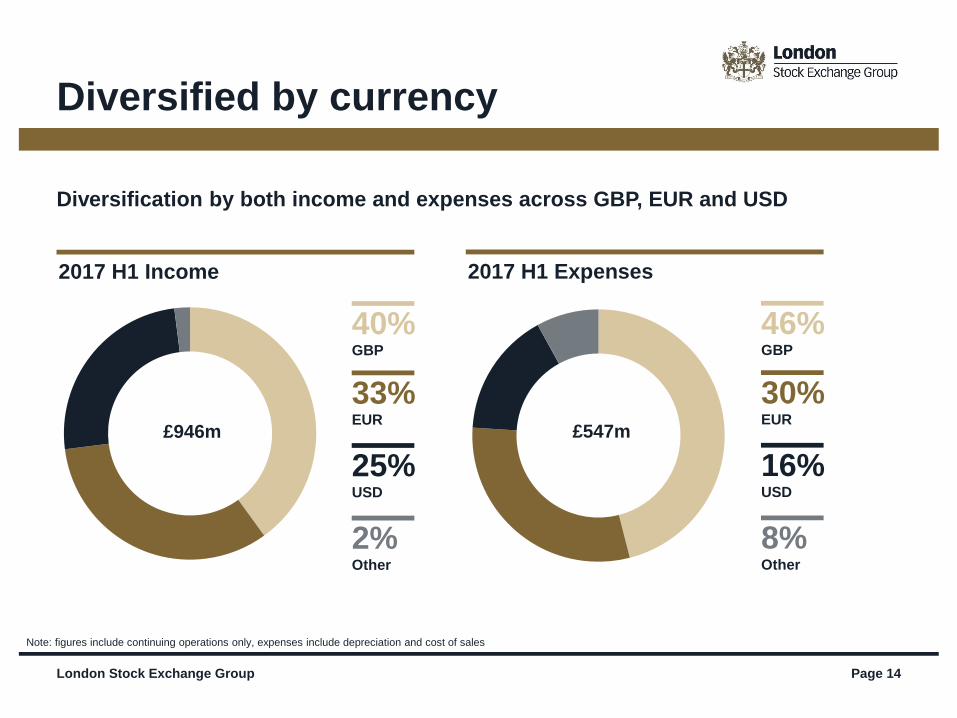
London Stock Exchange Group Page 14
Diversified by currency
Note: figures include continuing operations only, expenses include depreciation and cost of sales
2017 H1 Income
25% USD
40% GBP
33% EUR
2% Other
£946m
2017 H1 Expenses
16% USD
46% GBP
30% EUR
8% Other
£547m
Diversification by both income and expenses across GBP, EUR and USD
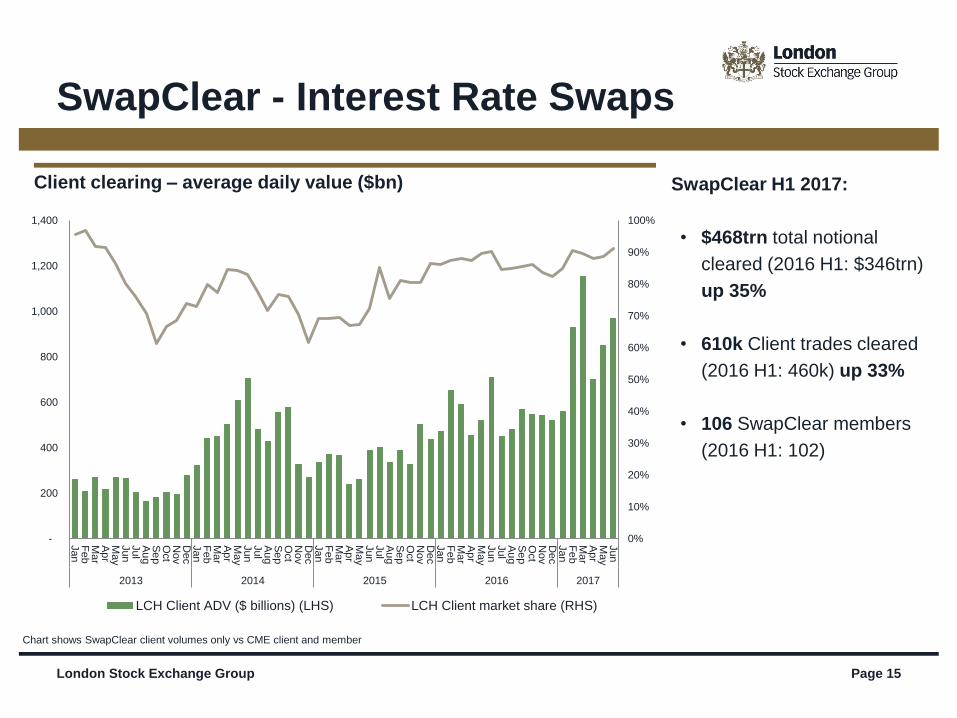
London Stock Exchange Group Page 15
SwapClear - Interest Rate Swaps
Chart shows SwapClear client volumes only vs CME client and member
SwapClear H1 2017:
• $468trn total notional
cleared (2016 H1: $346trn)
up 35%
• 610k Client trades cleared
(2016 H1: 460k) up 33%
• 106 SwapClear members
(2016 H1: 102)
0%
10%
20%
30%
40%
50%
60%
70%
80%
90%
100%
-
200
400
600
800
1,000
1,200
1,400
Jan
Fe
bM
ar
Ap
rM
ay
Jun
Jul
Au
gS
ep
Oct
Nov
Dec
Jan
Fe
bM
ar
Ap
rM
ay
Jun
Jul
Au
gS
ep
Oct
Nov
Dec
Jan
Fe
bM
ar
Ap
rM
ay
Jun
Jul
Au
gS
ep
Oct
Nov
Dec
Jan
Fe
bM
ar
Ap
rM
ay
Jun
Jul
Au
gS
ep
Oct
Nov
Dec
Jan
Fe
bM
ar
Ap
rM
ay
Jun
2013 2014 2015 2016 2017
LCH Client ADV ($ billions) (LHS) LCH Client market share (RHS)
Client clearing – average daily value ($bn)
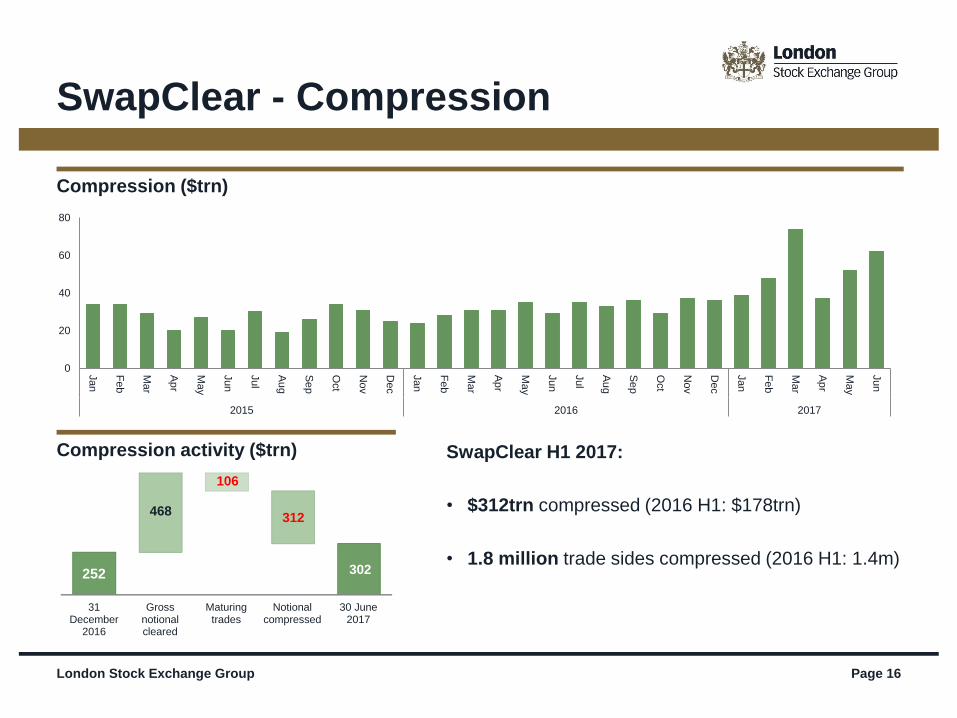
London Stock Exchange Group Page 16
SwapClear - Compression
SwapClear H1 2017:
• $312trn compressed (2016 H1: $178trn)
• 1.8 million trade sides compressed (2016 H1: 1.4m)
0
20
40
60
80
Jan
Fe
b
Ma
r
Ap
r
Ma
y
Jun
Jul
Au
g
Se
p
Oct
Nov
Dec
Jan
Fe
b
Ma
r
Ap
r
Ma
y
Jun
Jul
Au
g
Se
p
Oct
Nov
Dec
Jan
Fe
b
Ma
r
Ap
r
Ma
y
Jun
2015 2016 2017
Compression ($trn)
Compression activity ($trn)
31December
2016
Grossnotionalcleared
Maturingtrades
Notionalcompressed
30 June2017
302
106
312 468
252
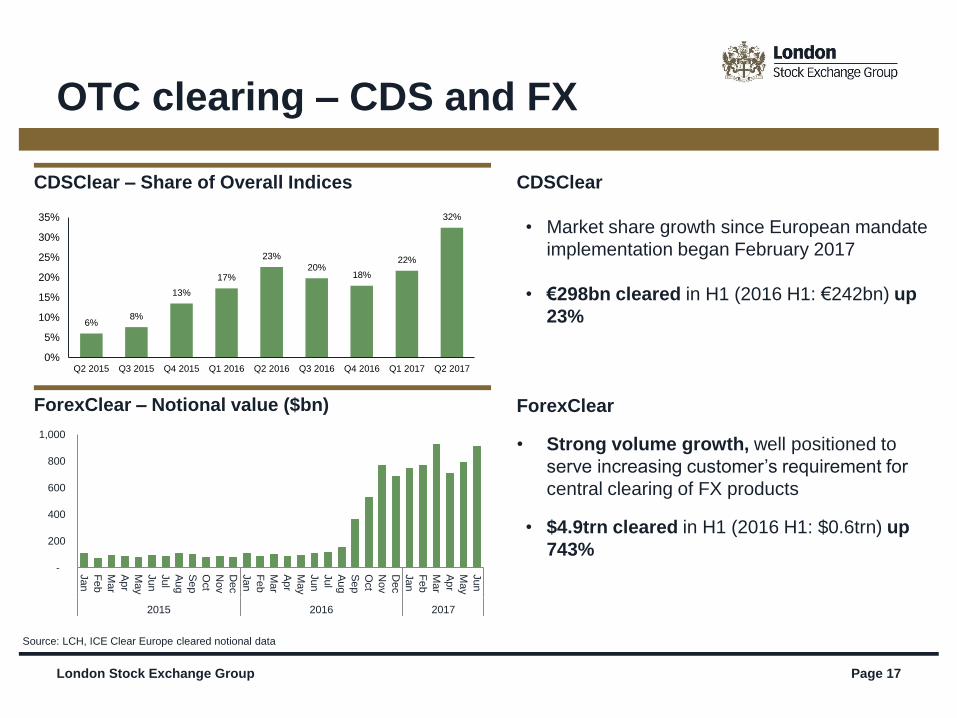
London Stock Exchange Group Page 17
OTC clearing – CDS and FX
CDSClear
• Market share growth since European mandate
implementation began February 2017
• €298bn cleared in H1 (2016 H1: €242bn) up
23%
ForexClear
• Strong volume growth, well positioned to
serve increasing customer’s requirement for
central clearing of FX products
• $4.9trn cleared in H1 (2016 H1: $0.6trn) up
743%
CDSClear – Share of Overall Indices
Source: LCH, ICE Clear Europe cleared notional data
ForexClear – Notional value ($bn)
-
200
400
600
800
1,000
Jan
Fe
b
Ma
r
Ap
r
Ma
y
Jun
Jul
Au
g
Se
p
Oct
Nov
Dec
Jan
Fe
b
Ma
r
Ap
r
Ma
y
Jun
Jul
Au
g
Se
p
Oct
Nov
Dec
Jan
Fe
b
Ma
r
Ap
r
Ma
y
Jun
2015 2016 2017
6% 8%
13%
17%
23%
20% 18%
22%
32%
0%
5%
10%
15%
20%
25%
30%
35%
Q2 2015 Q3 2015 Q4 2015 Q1 2016 Q2 2016 Q3 2016 Q4 2016 Q1 2017 Q2 2017
0
0.5
1
1.5
2
2.5
3
3.5
4
4.5
5
5.5
Se
p-1
4
Nov-1
4
Jan
-15
Ma
r-15
Ma
y-1
5
Jul-1
5
Se
p-1
5
Nov-1
5
Jan
-16
Ma
r-16
Ma
y-1
6
Jul-1
6
Se
p-1
6
Nov-1
6
Jan
-17
Ma
r-17
Ma
y-1
7
Jul-1
7
London Stock Exchange Group Page 18 London Stock Exchange Group Page 18
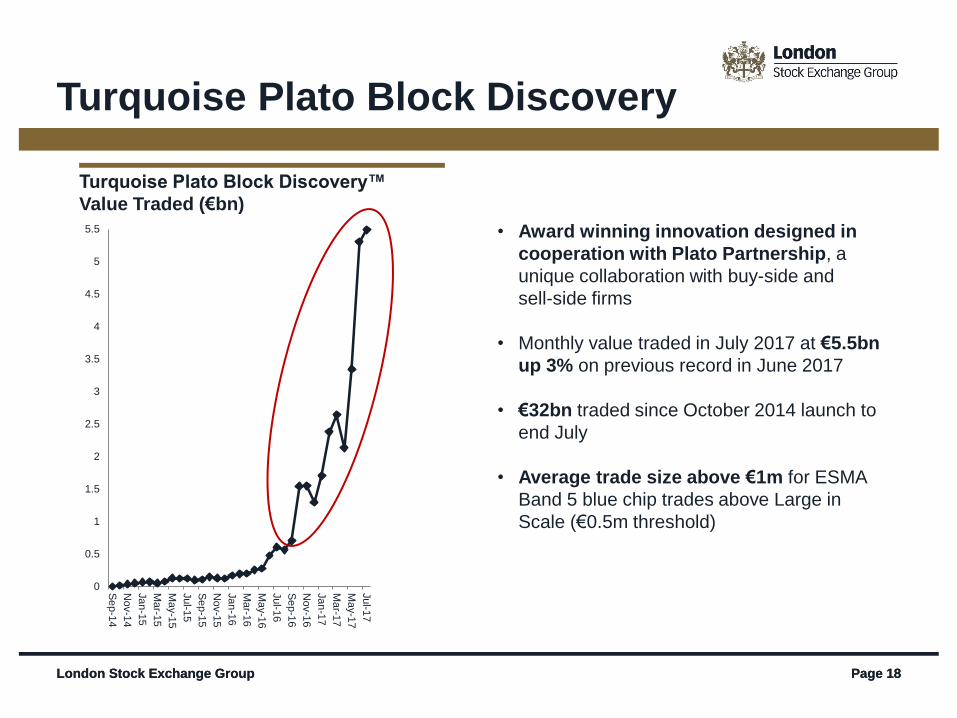
Turquoise Plato Block Discovery™
Value Traded (€bn)
• Award winning innovation designed in
cooperation with Plato Partnership, a
unique collaboration with buy-side and
sell-side firms
• Monthly value traded in July 2017 at €5.5bn
up 3% on previous record in June 2017
• €32bn traded since October 2014 launch to
end July
• Average trade size above €1m for ESMA
Band 5 blue chip trades above Large in
Scale (€0.5m threshold)
Turquoise Plato Block Discovery
London Stock Exchange Group Page 19
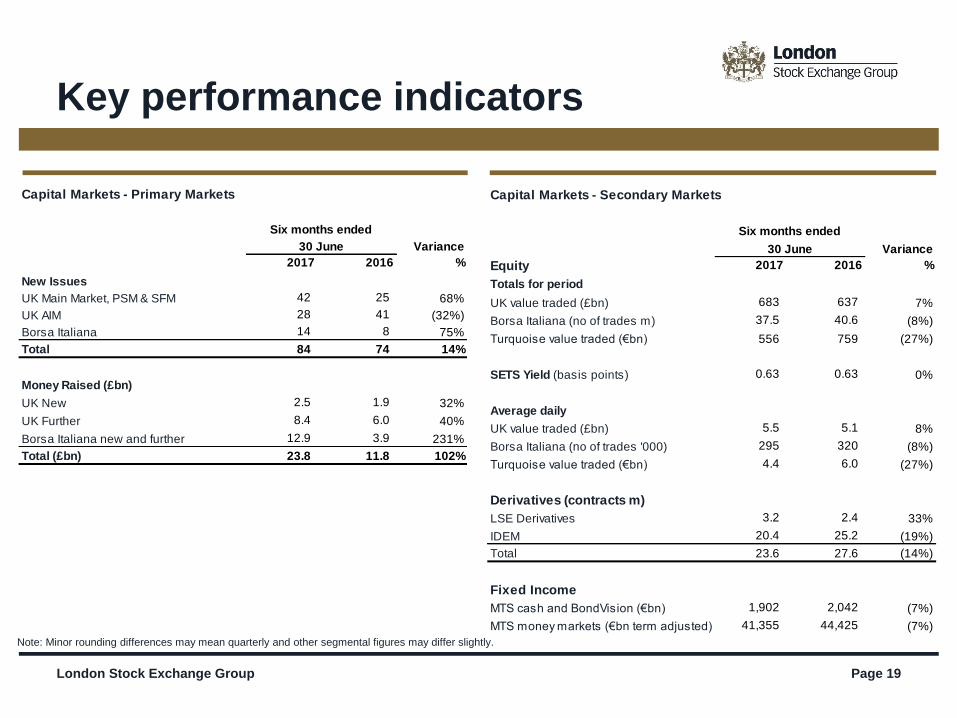
Key performance indicators
Note: Minor rounding differences may mean quarterly and other segmental figures may differ slightly.
Capital Markets - Primary Markets
Variance
2017 2016 %
New Issues
UK Main Market, PSM & SFM 42 25 68%
UK AIM 28 41 (32%)
Borsa Italiana 14 8 75%
Total 84 74 14%
Money Raised (£bn)
UK New 2.5 1.9 32%
UK Further 8.4 6.0 40%
Borsa Italiana new and further 12.9 3.9 231%
Total (£bn) 23.8 11.8 102%
Six months ended
30 June
Capital Markets - Secondary Markets
Variance
Equity 2017 2016 %
Totals for period
UK value traded (£bn) 683 637 7%
Borsa Italiana (no of trades m) 37.5 40.6 (8%)
Turquoise value traded (€bn) 556 759 (27%)
SETS Yield (basis points) 0.63 0.63 0%
Average daily
UK value traded (£bn) 5.5 5.1 8%
Borsa Italiana (no of trades '000) 295 320 (8%)
Turquoise value traded (€bn) 4.4 6.0 (27%)
Derivatives (contracts m)
LSE Derivatives 3.2 2.4 33%
IDEM 20.4 25.2 (19%)
Total 23.6 27.6 (14%)
Fixed Income
MTS cash and BondVision (€bn) 1,902 2,042 (7%)
MTS money markets (€bn term adjusted) 41,355 44,425 (7%)
Six months ended
30 June
Post Trade Services - LCH
Variance
2017 2016 %
OTC derivatives
SwapClear
IRS notional cleared ($tn) 468 346 35%
SwapClear members 106 102 4%
Client trades ('000) 610 460 33%
CDSClear
Notional cleared (€bn) 298 242 23%
CDSClear members 13 11 18%
ForexClear
Notional value cleared ($bn) 4,857 576 743%
ForexClear members 27 23 17%
Non-OTC
Fixed income - Nominal value (€tn) 42.9 34.9 23%
Listed derivatives (contracts m) 76.4 70.0 9%
Cash equities trades (m) 419 345 21%
Average cash collateral (€bn) 86.5 61.3 41%
30 June
Six months ended
London Stock Exchange Group Page 20
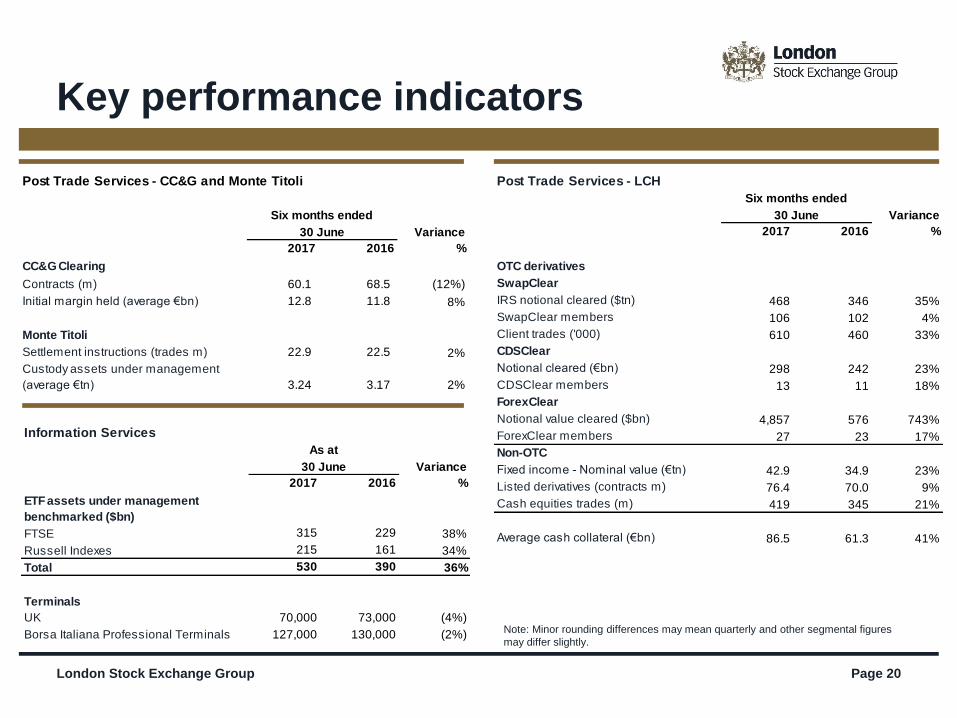
Key performance indicators
Note: Minor rounding differences may mean quarterly and other segmental figures
may differ slightly.
Information Services
Variance
2017 2016 %
ETF assets under management
benchmarked ($bn)
FTSE 315 229 38%
Russell Indexes 215 161 34%
Total 530 390 36%
Terminals
UK 70,000 73,000 (4%)
Borsa Italiana Professional Terminals 127,000 130,000 (2%)
30 June
As at
Post Trade Services - CC&G and Monte Titoli
Variance
2017 2016 %
CC&G Clearing
Contracts (m) 60.1 68.5 (12%)
Initial margin held (average €bn) 12.8 11.8 8%
Monte Titoli
Settlement instructions (trades m) 22.9 22.5 2%
Custody assets under management
(average €tn) 3.24 3.17 2%
30 June
Six months ended
London Stock Exchange Group Page 21
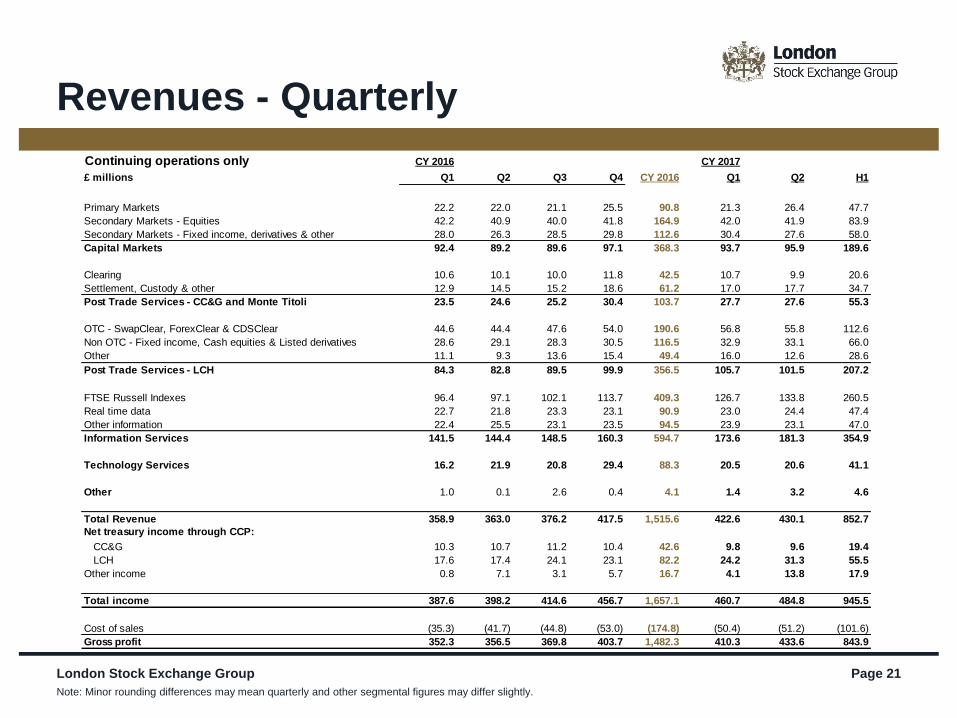
Revenues - Quarterly
Note: Minor rounding differences may mean quarterly and other segmental figures may differ slightly.
Continuing operations only CY 2016 CY 2017
£ millions Q1 Q2 Q3 Q4 CY 2016 Q1 Q2 H1
Primary Markets 22.2 22.0 21.1 25.5 90.8 21.3 26.4 47.7
Secondary Markets - Equities 42.2 40.9 40.0 41.8 164.9 42.0 41.9 83.9
Secondary Markets - Fixed income, derivatives & other 28.0 26.3 28.5 29.8 112.6 30.4 27.6 58.0
Capital Markets 92.4 89.2 89.6 97.1 368.3 93.7 95.9 189.6
Clearing 10.6 10.1 10.0 11.8 42.5 10.7 9.9 20.6
Settlement, Custody & other 12.9 14.5 15.2 18.6 61.2 17.0 17.7 34.7
Post Trade Services - CC&G and Monte Titoli 23.5 24.6 25.2 30.4 103.7 27.7 27.6 55.3
OTC - SwapClear, ForexClear & CDSClear 44.6 44.4 47.6 54.0 190.6 56.8 55.8 112.6
Non OTC - Fixed income, Cash equities & Listed derivatives 28.6 29.1 28.3 30.5 116.5 32.9 33.1 66.0
Other 11.1 9.3 13.6 15.4 49.4 16.0 12.6 28.6
Post Trade Services - LCH 84.3 82.8 89.5 99.9 356.5 105.7 101.5 207.2
FTSE Russell Indexes 96.4 97.1 102.1 113.7 409.3 126.7 133.8 260.5
Real time data 22.7 21.8 23.3 23.1 90.9 23.0 24.4 47.4
Other information 22.4 25.5 23.1 23.5 94.5 23.9 23.1 47.0
Information Services 141.5 144.4 148.5 160.3 594.7 173.6 181.3 354.9
Technology Services 16.2 21.9 20.8 29.4 88.3 20.5 20.6 41.1
Other 1.0 0.1 2.6 0.4 4.1 1.4 3.2 4.6
Total Revenue 358.9 363.0 376.2 417.5 1,515.6 422.6 430.1 852.7
Net treasury income through CCP:
CC&G 10.3 10.7 11.2 10.4 42.6 9.8 9.6 19.4
LCH 17.6 17.4 24.1 23.1 82.2 24.2 31.3 55.5
Other income 0.8 7.1 3.1 5.7 16.7 4.1 13.8 17.9
Total income 387.6 398.2 414.6 456.7 1,657.1 460.7 484.8 945.5
Cost of sales (35.3) (41.7) (44.8) (53.0) (174.8) (50.4) (51.2) (101.6)
Gross profit 352.3 356.5 369.8 403.7 1,482.3 410.3 433.6 843.9

London Stock Exchange Group
Paul Froud Tom Woodley
Head of Investor Relations Investor Relations Manager
Tel: +44 (0)20 7797 1186 Tel: +44 (0)20 7797 1293
email: [email protected]
email: [email protected]
London Stock Exchange Group plc
10 Paternoster Square
London
EC4M 7LS
For information on the Group: www.lseg.com
Page 22
Contacts