long term gnss and sar data comparison for the deformation ... · 30.5.2012 2 radicioni f, stoppini...
TRANSCRIPT
30.5.2012
1
Long‐term GNSS and SAR data comparison for the deformation monitoring of the Assisi landslide
Raffaella Brigante*, Fabio Radicioni*, Aurelio Stoppini*, Gianfranco Fornaro**, Fabio Bovenga***, Davide Oscar Nitti****
* DICA, Faculty of Engineering, University of Perugia, Italy
** CNR‐IREA (Consiglio Nazionale delle Ricerche / National Research Council), Naples, Italy
*** CNR‐ISSIA (Consiglio Nazionale delle Ricerche / National Research Council), Bari, Italy
**** Department of Physics “M. Merlin”, Polytechnic University of Bari, Italy
Radicioni F, Stoppini A, Brigante R, Fornaro G, Bovenga F, Nitti D O:Long‐term GNSS and SAR data comparison for the deformation monitoring of the Assisi landslide
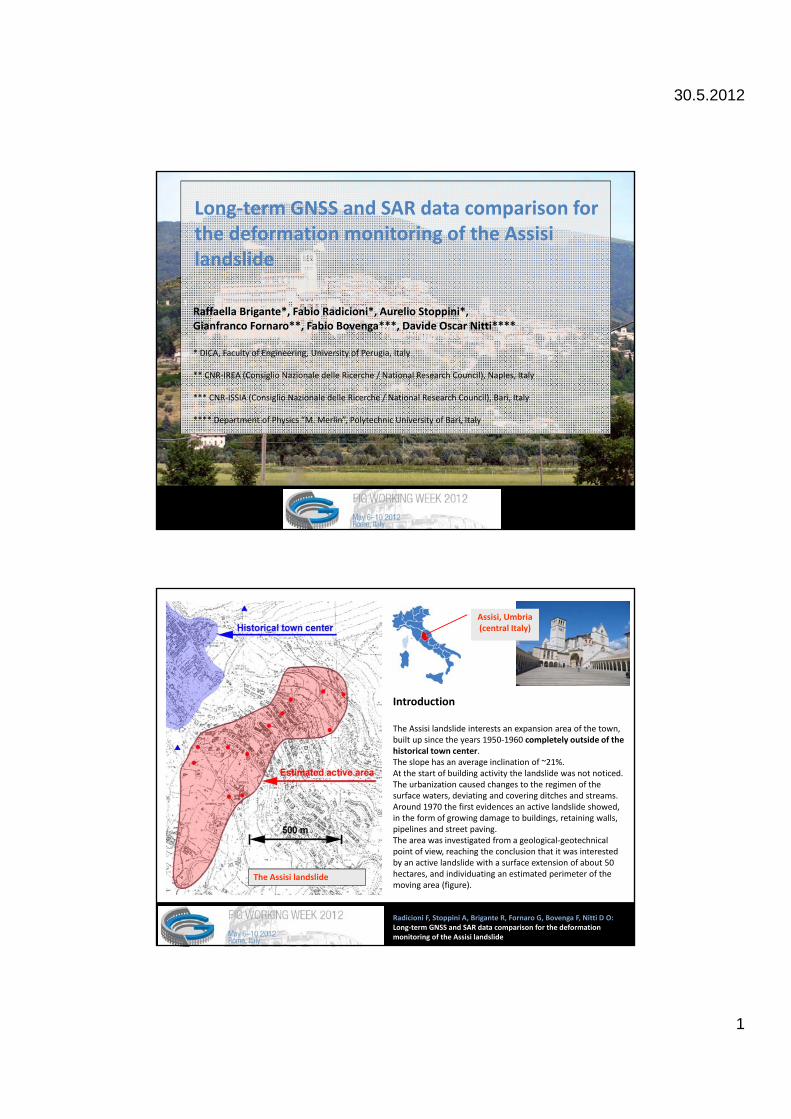
Introduction
The Assisi landslide interests an expansion area of the town, built up since the years 1950‐1960 completely outside of the historical town center. The slope has an average inclination of ~21%. At the start of building activity the landslide was not noticed. The urbanization caused changes to the regimen of the surface waters, deviating and covering ditches and streams. Around 1970 the first evidences an active landslide showed, in the form of growing damage to buildings, retaining walls, pipelines and street paving.The area was investigated from a geological‐geotechnical point of view, reaching the conclusion that it was interested by an active landslide with a surface extension of about 50 hectares, and individuating an estimated perimeter of the moving area (figure).
Assisi, Umbria(central Italy)
The Assisi landslide

30.5.2012
2
Radicioni F, Stoppini A, Brigante R, Fornaro G, Bovenga F, Nitti D O:Long‐term GNSS and SAR data comparison for the deformation monitoring of the Assisi landslide
The landslideis of a gravitational type (translational creep). The sliding surface has an average depth of some tens of meters, with a maximum of about 60 m. The moving formation consists of a debris mass flowing over a stable bedrock.The area has been monitored since 1970‐1980 with geotechnical techniques and a conventional geodetic network (angles and distances). The geodetic monitoring was interrupted at the mid 80s for its excessive cost and practical difficulties. Since 1995, the Perugia University (with the contribution of CNR in the early years) has established a GNSS control network over the area, integrated from 1999 on by a leveling network. GNSS and leveling campaigns have been performed since then with an about annual cadence up to the actuality.
Since about 1980, stabilization works have been undertaken on the landslide area in the attempt to slow down the motion or possibly stop it. In the initial phase most works have interested the surface water regimen, and not directly the deep sliding surface. A more effective intervention campaign, consisting on the draining of deep water, has started in 2006, but the works have undergone interruptions and delays for technical and administrative reasons, and are still in progress.
Arrows = GNSS markers
Radicioni F, Stoppini A, Brigante R, Fornaro G, Bovenga F, Nitti D O:Long‐term GNSS and SAR data comparison for the deformation monitoring of the Assisi landslide
The GNSS networkThe Assisi GNSS network in its initial configuration (1995) included 6 reference or “fiducial” points located in geologically stable sites (S01 to S06), and 14 “control” points in the landslide area (M01 to M14). In 2006 the network was densified adding 16 control points (M20 to M35). The present configuration includes 28 control points and 5 fiducial points.The measurement are performed with GPS/GLONASS double frequency geodetic receivers in staticmode, with 2 hours sessions at a sampling rate of 5 seconds.
S01
GNSS network layout
1° level: fiducial network (datum)
2° level: control network (displacements)
fiducial
control

30.5.2012
3
Radicioni F, Stoppini A, Brigante R, Fornaro G, Bovenga F, Nitti D O:Long‐term GNSS and SAR data comparison for the deformation monitoring of the Assisi landslide
GNSS network resultsComparing the 3d coordinates derived from subsequent measurement campaigns, the displacement vectors for the control points are computed and statistically tested as effective displacements.Figure shows the 1995‐2008 displacements for the first 14 control points (complete observation set). The planimetric vectors show a field of movements in agreement with the landslide characteristics: a creep, where the upper layers of the soil slowly slide on a stable formation at a depth of some tens of meters. The maximum displacements are located in the central part of the landslide body, and their direction follows approximately the maximum slope line.
The coordinate time series (below) show an almost lineartrend, with maximum velocities of about 1 cm/year.
GNSS displacement vectors
Radicioni F, Stoppini A, Brigante R, Fornaro G, Bovenga F, Nitti D O:Long‐term GNSS and SAR data comparison for the deformation monitoring of the Assisi landslide
SAR data analysed
The ASAR sensor onboard of the ENVISAT ESA satellite is active since 2002 acquiring SAR images in C‐band (λ = 5.6 cm) with different acquisition modes, polarizations and incident angles. This satellite followed the ERS‐1/2 ESA mission ensuring the continuity of C‐band data acquired with a revisit time of 35 days and a resolution cell size of about 20m by 5m along range and azimuth directions respectively.
The C‐band ASAR dataset utilized for the present experimentation consists of 39 STRIPMAP SLCs acquired between October 2003 and May 2010 along descendingpasses, with mean incident angle of around 23° (Track 531, Frame 2741; Image Swath: IS2; Polarization VV; green frame in figure).
The 7‐years overlapping with GNSS measurements allows a validation of the displacements derived by InSAR processing.
30.5.2012
4
Radicioni F, Stoppini A, Brigante R, Fornaro G, Bovenga F, Nitti D O:Long‐term GNSS and SAR data comparison for the deformation monitoring of the Assisi landslide
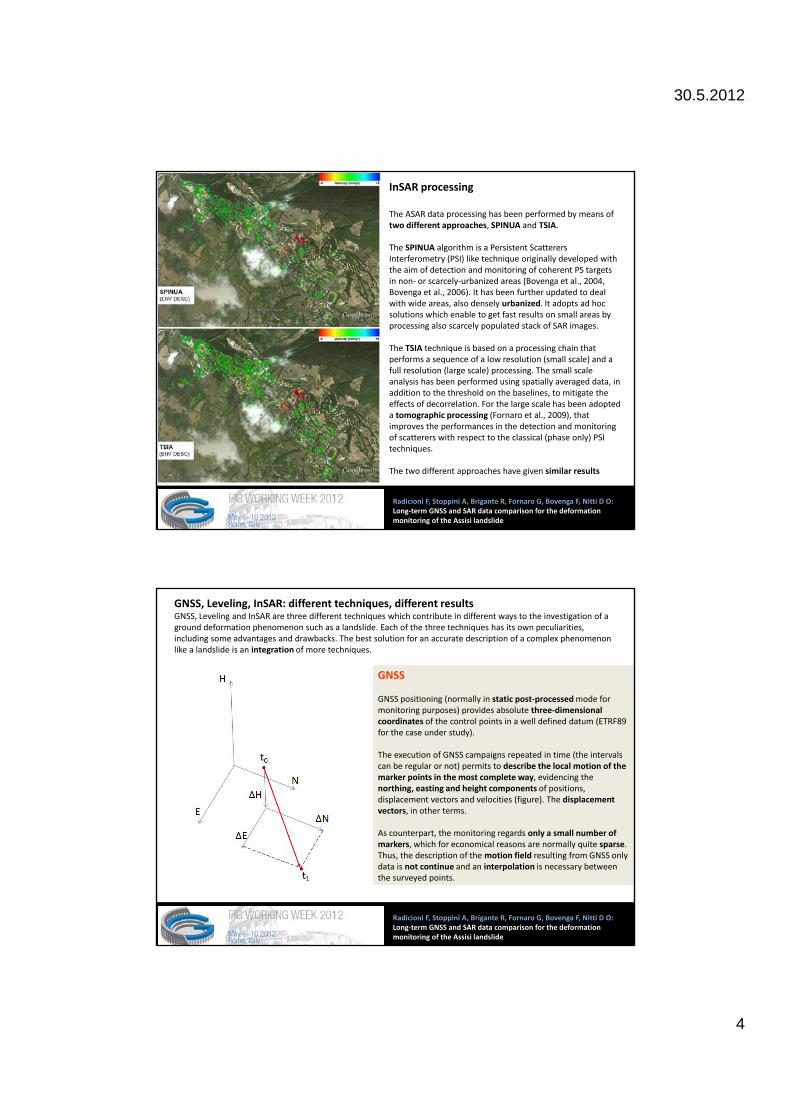
InSAR processing
The ASAR data processing has been performed by means of two different approaches, SPINUA and TSIA.
The SPINUA algorithm is a Persistent Scatterers Interferometry (PSI) like technique originally developed with the aim of detection and monitoring of coherent PS targets in non‐ or scarcely‐urbanized areas (Bovenga et al., 2004, Bovenga et al., 2006). It has been further updated to deal with wide areas, also densely urbanized. It adopts ad hoc solutions which enable to get fast results on small areas by processing also scarcely populated stack of SAR images.
The TSIA technique is based on a processing chain that performs a sequence of a low resolution (small scale) and a full resolution (large scale) processing. The small scale analysis has been performed using spatially averaged data, in addition to the threshold on the baselines, to mitigate the effects of decorrelation. For the large scale has been adopted a tomographic processing (Fornaro et al., 2009), that improves the performances in the detection and monitoring of scatterers with respect to the classical (phase only) PSI techniques.
The two different approaches have given similar results
Radicioni F, Stoppini A, Brigante R, Fornaro G, Bovenga F, Nitti D O:Long‐term GNSS and SAR data comparison for the deformation monitoring of the Assisi landslide
GNSS, Leveling, InSAR: different techniques, different resultsGNSS, Leveling and InSAR are three different techniques which contribute in different ways to the investigation of a ground deformation phenomenon such as a landslide. Each of the three techniques has its own peculiarities, including some advantages and drawbacks. The best solution for an accurate description of a complex phenomenon like a landslide is an integration of more techniques.
GNSS
GNSS positioning (normally in static post‐processedmode for monitoring purposes) provides absolute three‐dimensional coordinates of the control points in a well defined datum (ETRF89 for the case under study).
The execution of GNSS campaigns repeated in time (the intervals can be regular or not) permits to describe the local motion of the marker points in the most complete way, evidencing the northing, easting and height components of positions, displacement vectors and velocities (figure). The displacement vectors, in other terms.
As counterpart, the monitoring regards only a small number of markers, which for economical reasons are normally quite sparse. Thus, the description of the motion field resulting from GNSS only data is not continue and an interpolation is necessary between the surveyed points.
30.5.2012
5
Radicioni F, Stoppini A, Brigante R, Fornaro G, Bovenga F, Nitti D O:Long‐term GNSS and SAR data comparison for the deformation monitoring of the Assisi landslide
GNSS, Leveling, InSAR: different techniques, different resultsGNSS, Leveling and InSAR are three different techniques which contribute in different ways to the investigation of a ground deformation phenomenon such as a landslide. Each of the three techniques has its own peculiarities, including some advantages and drawbacks. The best solution for an accurate description of a complex phenomenon like a landslide is an integration of more techniques.
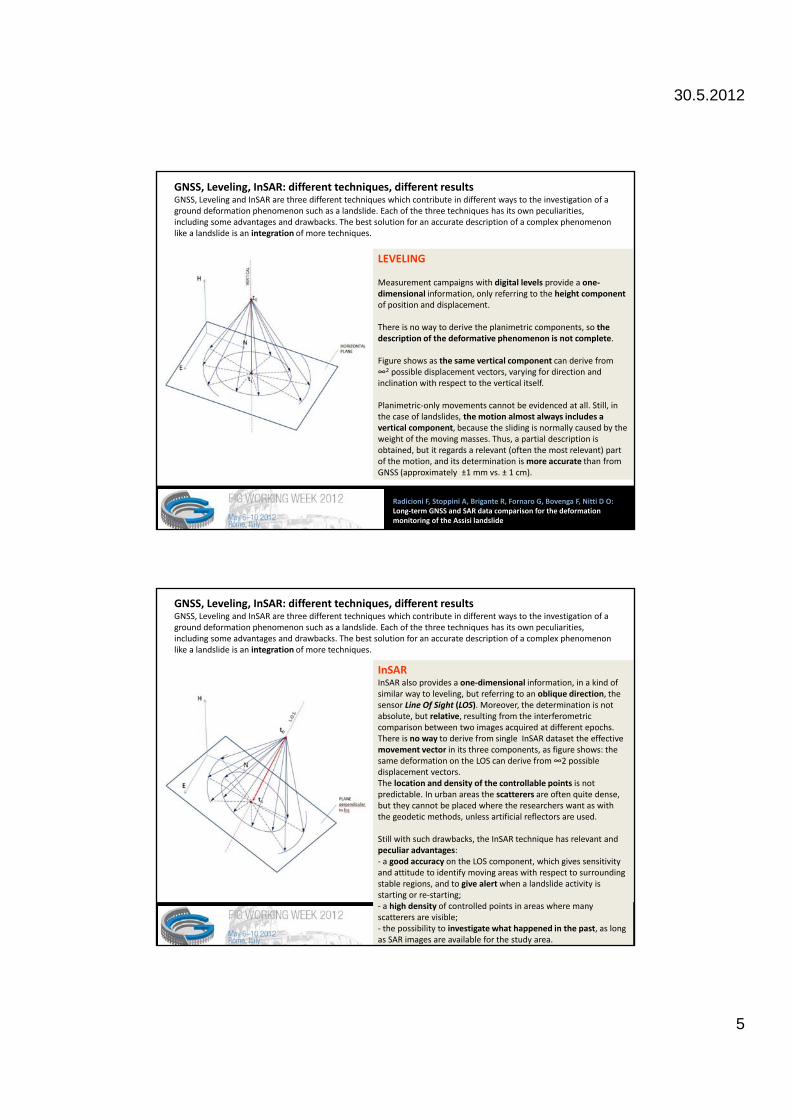
LEVELING
Measurement campaigns with digital levels provide a one‐dimensional information, only referring to the height componentof position and displacement.
There is no way to derive the planimetric components, so the description of the deformative phenomenon is not complete.
Figure shows as the same vertical component can derive from ∞2 possible displacement vectors, varying for direction and inclination with respect to the vertical itself.
Planimetric‐only movements cannot be evidenced at all. Still, in the case of landslides, the motion almost always includes a vertical component, because the sliding is normally caused by the weight of the moving masses. Thus, a partial description is obtained, but it regards a relevant (often the most relevant) part of the motion, and its determination is more accurate than from GNSS (approximately ±1 mm vs. ± 1 cm).
Radicioni F, Stoppini A, Brigante R, Fornaro G, Bovenga F, Nitti D O:Long‐term GNSS and SAR data comparison for the deformation monitoring of the Assisi landslide
GNSS, Leveling, InSAR: different techniques, different resultsGNSS, Leveling and InSAR are three different techniques which contribute in different ways to the investigation of a ground deformation phenomenon such as a landslide. Each of the three techniques has its own peculiarities, including some advantages and drawbacks. The best solution for an accurate description of a complex phenomenon like a landslide is an integration of more techniques.
InSARInSAR also provides a one‐dimensional information, in a kind of similar way to leveling, but referring to an oblique direction, the sensor Line Of Sight (LOS). Moreover, the determination is not absolute, but relative, resulting from the interferometric comparison between two images acquired at different epochs. There is no way to derive from single InSAR dataset the effective movement vector in its three components, as figure shows: the same deformation on the LOS can derive from ∞2 possible displacement vectors. The location and density of the controllable points is not predictable. In urban areas the scatterers are often quite dense, but they cannot be placed where the researchers want as with the geodetic methods, unless artificial reflectors are used.
Still with such drawbacks, the InSAR technique has relevant and peculiar advantages: ‐ a good accuracy on the LOS component, which gives sensitivity and attitude to identify moving areas with respect to surrounding stable regions, and to give alertwhen a landslide activity is starting or re‐starting; ‐ a high density of controlled points in areas where many scatterers are visible; ‐ the possibility to investigate what happened in the past, as long as SAR images are available for the study area.

30.5.2012
6
Radicioni F, Stoppini A, Brigante R, Fornaro G, Bovenga F, Nitti D O:Long‐term GNSS and SAR data comparison for the deformation monitoring of the Assisi landslide
GNSS – InSAR Comparison
GNSS and InSAR are different techniques giving different results not only for the different approach and data type, but also from a geometrical point of view: GNSS supplies the displacement vectors in three dimensions (geocentric XYZ or eulerian ENH) while InSAR only gives the variations of the component along the LOS.
The LOS direction is known, expressed by its direction cosines with respect to the geocentric XYZ reference system. The cosines are slightly varying from a SAR target to another, but in a relatively small area like that under study the average values can be reasonably assumed as constant.
Starting from the GNSS‐derived XYZ coordinates time series, the components of the displacement vectors for the control points along the LOS have been derived from the following expressions:
0
0
0
ZZZ
YYY
XXX
i
i
i
−=Δ−=Δ−=Δ
ZYXLOS LOSZLOSYLOSX coscoscos ⋅Δ+⋅Δ+⋅Δ=Δ
Radicioni F, Stoppini A, Brigante R, Fornaro G, Bovenga F, Nitti D O:Long‐term GNSS and SAR data comparison for the deformation monitoring of the Assisi landslide
GNSS – InSAR Comparison
The LOS components derived from GNSS data have been compared with those of the SAR scatterers closest to the GNSS marker (never coinciding).
An alignment of the time scales has been necessary (i.e. adopting 2003 as common zero epoch for GNSS and InSAR).
GNSS LOS time series
SAR scattererstime series
SPINUA model

30.5.2012
7
Radicioni F, Stoppini A, Brigante R, Fornaro G, Bovenga F, Nitti D O:Long‐term GNSS and SAR data comparison for the deformation monitoring of the Assisi landslide
GNSS – InSAR Comparison
The LOS components derived from GNSS data have been compared with those of the SAR scatterers closest to the GNSS marker (never coinciding).
An alignment of the time scales has been necessary (i.e. adopting 2003 as common zero epoch for GNSS and InSAR).
GNSS LOS time series
SAR scattererstime series
TSIA model
Radicioni F, Stoppini A, Brigante R, Fornaro G, Bovenga F, Nitti D O:Long‐term GNSS and SAR data comparison for the deformation monitoring of the Assisi landslide
GNSS – InSAR Comparison
For a better understanding of the single points behavior, linear regressions have been estimated for both GNSS and InSAR points
GNSS LOS time series
SAR scattererstime series
SPINUA model

30.5.2012
8
Radicioni F, Stoppini A, Brigante R, Fornaro G, Bovenga F, Nitti D O:Long‐term GNSS and SAR data comparison for the deformation monitoring of the Assisi landslide
GNSS – InSAR Comparison
For a better understanding of the single points behavior, linear regressions have been estimated for both GNSS and InSAR points
GNSS LOS time series
SAR scattererstime series
TSIA model
Radicioni F, Stoppini A, Brigante R, Fornaro G, Bovenga F, Nitti D O:Long‐term GNSS and SAR data comparison for the deformation monitoring of the Assisi landslide
GNSS – InSAR Comparison
For some points local effects can be noticed
The landslide is divided in more contiguous portions with different granulometry and compactness. Moreover, for a landslide in an urban environment the surface motion can be locally influenced by the presence of buildings, retaining walls and deep foundations.
In the figure, the marker M07 belongs to the main “stream” of the landslide, while the western portion (including M06) is almost steady

30.5.2012
9
Radicioni F, Stoppini A, Brigante R, Fornaro G, Bovenga F, Nitti D O:Long‐term GNSS and SAR data comparison for the deformation monitoring of the Assisi landslide
GNSS – InSAR ComparisonSummary of results (SPINUA)
GNSS marker
VLOS (mm/y)
Dm (m)
Velocity differences (mm/y)
mean max min RMS
S01 -0.16 688.4 0.04 0.50 -0.93 0.54S02 0.00 30.08 -0.32 0.09 -1.02 0.59S03 -0.09 102.6 0.38 0.89 0.09 0.63S05 1.50 546.0 -2.17 -2.73 -1.72 2.20S06 0.33 106.0 -0.01 0.70 -0.72 0.58M01 0.36 93.0 -0.52 -0.29 -0.75 0.57M03 -0.63 26.6 0.10 0.69 -0.40 0.42M04 -0.53 21.0 0.45 0.83 -0.12 0.53M06 -0.90 79.8 0.69 1.70 -0.27 0.87M07 -3.60 72.4 -0.32 0.84 -1.63 0.83M08 -7.00 46.4 2.67 4.28 0.73 2.83M09 -5.80 53.6 -0.01 1.62 -1.14 0.85M10 -4.00 72.7 -1.62 -1.26 -2.09 1.66M11 -1.92 118.4 1.30 1.30 1.30 1.30M12 -5.80 111.2 4.08 5.19 3.47 4.15M13 -1.05 75.5 -0.67 0.44 -1.28 1.04M14 -8.00 33.1 1.90 3.17 -0.18 2.11
RMS mean 1.28
Radicioni F, Stoppini A, Brigante R, Fornaro G, Bovenga F, Nitti D O:Long‐term GNSS and SAR data comparison for the deformation monitoring of the Assisi landslide
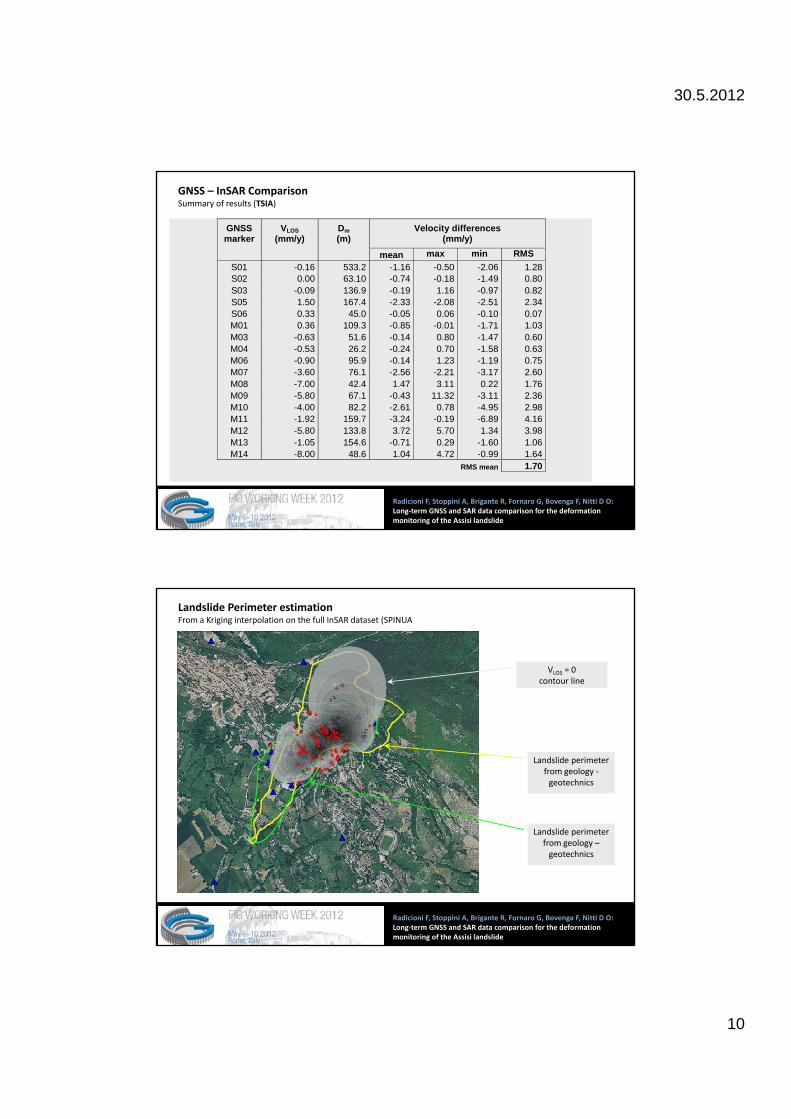
GNSS – InSAR ComparisonSummary of results (TSIA)
GNSS marker
VLOS (mm/y)
Dm (m)
Velocity differences (mm/y)
mean max min RMS
S01 -0.16 533.2 -1.16 -0.50 -2.06 1.28S02 0.00 63.10 -0.74 -0.18 -1.49 0.80S03 -0.09 136.9 -0.19 1.16 -0.97 0.82S05 1.50 167.4 -2.33 -2.08 -2.51 2.34S06 0.33 45.0 -0.05 0.06 -0.10 0.07M01 0.36 109.3 -0.85 -0.01 -1.71 1.03M03 -0.63 51.6 -0.14 0.80 -1.47 0.60M04 -0.53 26.2 -0.24 0.70 -1.58 0.63M06 -0.90 95.9 -0.14 1.23 -1.19 0.75M07 -3.60 76.1 -2.56 -2.21 -3.17 2.60M08 -7.00 42.4 1.47 3.11 0.22 1.76M09 -5.80 67.1 -0.43 11.32 -3.11 2.36M10 -4.00 82.2 -2.61 0.78 -4.95 2.98M11 -1.92 159.7 -3.24 -0.19 -6.89 4.16M12 -5.80 133.8 3.72 5.70 1.34 3.98M13 -1.05 154.6 -0.71 0.29 -1.60 1.06M14 -8.00 48.6 1.04 4.72 -0.99 1.64
RMS mean 1.70
30.5.2012
10
Radicioni F, Stoppini A, Brigante R, Fornaro G, Bovenga F, Nitti D O:Long‐term GNSS and SAR data comparison for the deformation monitoring of the Assisi landslide
GNSS – InSAR ComparisonSummary of results (TSIA)
GNSS marker
VLOS (mm/y)
Dm (m)
Velocity differences (mm/y)
mean max min RMS
S01 -0.16 533.2 -1.16 -0.50 -2.06 1.28S02 0.00 63.10 -0.74 -0.18 -1.49 0.80S03 -0.09 136.9 -0.19 1.16 -0.97 0.82S05 1.50 167.4 -2.33 -2.08 -2.51 2.34S06 0.33 45.0 -0.05 0.06 -0.10 0.07M01 0.36 109.3 -0.85 -0.01 -1.71 1.03M03 -0.63 51.6 -0.14 0.80 -1.47 0.60M04 -0.53 26.2 -0.24 0.70 -1.58 0.63M06 -0.90 95.9 -0.14 1.23 -1.19 0.75M07 -3.60 76.1 -2.56 -2.21 -3.17 2.60M08 -7.00 42.4 1.47 3.11 0.22 1.76M09 -5.80 67.1 -0.43 11.32 -3.11 2.36M10 -4.00 82.2 -2.61 0.78 -4.95 2.98M11 -1.92 159.7 -3.24 -0.19 -6.89 4.16M12 -5.80 133.8 3.72 5.70 1.34 3.98M13 -1.05 154.6 -0.71 0.29 -1.60 1.06M14 -8.00 48.6 1.04 4.72 -0.99 1.64
RMS mean 1.70
Radicioni F, Stoppini A, Brigante R, Fornaro G, Bovenga F, Nitti D O:Long‐term GNSS and SAR data comparison for the deformation monitoring of the Assisi landslide
Landslide Perimeter estimationFrom a Kriging interpolation on the full InSAR dataset (SPINUA
VLOS = 0contour line
Landslide perimeterfrom geology ‐geotechnics
Landslide perimeterfrom geology –geotechnics

30.5.2012
11
Radicioni F, Stoppini A, Brigante R, Fornaro G, Bovenga F, Nitti D O:Long‐term GNSS and SAR data comparison for the deformation monitoring of the Assisi landslide
Final Remarks (1)
The comparison has generally shown a good agreement between the two different techniques, referring to the LOS component of the ground deformations, velocities and time series, confirming a substantially linear behavior (sliding velocity almost constant in time) already observed from the GNSS data.
Some local differences can be explained with effects connected to the non homogeneity of the landslide body or to the presence of structural elements (retaining walls, deep foundations).
The RMS difference between GNSS and InSAR LOS velocities are less than 1 mm/y for most points, with exceptions due to local effects discussed above.
The two analysis methods adopted for the InSAR data (SPINUA and TSIA) also show a very good agreement with each other: even if individuating different scatterers, the LOS deformations and velocities for local areas deriving from the two approaches are substantially the same.
The highest deformation velocities along the LOS have been found in the central area of the landslide, with values of about 5 mm/year. Lesser values are found on the sides and at the top and bottom of the sliding body. An approximated perimeter of the active area has been estimated from a spatial interpolation of the velocities field, finding a quite good agreement with landslide perimeters defined on a geological basis.
Radicioni F, Stoppini A, Brigante R, Fornaro G, Bovenga F, Nitti D O:Long‐term GNSS and SAR data comparison for the deformation monitoring of the Assisi landslide
Final Remarks (2)This research refers to a particular case, but the reproducible methods and the results lead to some conclusions which can be attributed a general validity:
‐ the InSAR technique offers a very useful instrument of analysis of landslide deformations, with some peculiar advantages (no need of artificial markers, high sensitivity, possibility of going back in time, clear discrimination of active and inactive areas);
‐ InSAR only give information on a one‐dimensional deformation component, the LOS (Line of Sight) of the radar pulse, while GNSS gives a complete 3D definition of the displacement vectors and velocities;
‐ for a complete 3D description of a landslide surface motion, defining all planimetric and height components, an integration of InSAR with GNSS (and also leveling) is possible and appears as a very good solution;
‐ if the InSAR datasets are subjected to a preliminary analysis to correct the spatial and temporal differences with respect to GNSS, a good agreement is found.
Further developments of the present research will likely regard an extension of the experimentation on more areas, the analysis of datasets coming from different SAR sensors (COSMO‐SkyMed in particular) and a comparison with leveling data, which for their high sensitivity also give a very important contribution to the knowledge of a landslide behaviour.

30.5.2012
12
… but the most important thing is:the historical center of Assisi is not “sinking”
Thank you for your attention!