lorenzo pupillio presentation
DESCRIPTION
Lorenzo Pupillio PresentationTRANSCRIPT

The State of Telecom 2012 September 24, 2012 – Columbia University – New York
Lorenzo Maria Pupillo Gianfranco Ciccarella Telecom Italia Group
Financial implications in the OTTs-Telcos relation A win-win perspective

State of Telecom 2012
2
* It includes the cost for the LTE spectrum
Fonti: TI’s elaboration based on Forecasts of Investment Banks (Morgan Stanley, Hsbc, Citi, Credit Suisse, JP Morgan, Bernstein, Nomura, Barclays, Deutsche Bank) – Mar/Apr 2012.
Sustainability issue
State of Telecom 2012
Disconnect between source of revenue and sources of cost in the Internet today
3
Huge Investment for LTE and NGAN
AT Kearney (2011): If networks were upgraded to address the forecast capacity needs in 2014 (+35% p.a. fixed net; +100% p.a. mobile net) with no new price signals or increase in revenues, network operators would see their returns on capital decline by 3% to around 9% and potentially as low as 7%. (Below their cost of capital)
Arthur D. Little - BNP Paribas (2012): In Europe core Telco revenues will continue to decline by 1.8% p.a.until 2015 (including a CAGR – 2.4% in mobile and – 3.4% in fixed line; potentially offset by 5.8% in pay-tv.

State of Telecom 2012
IP Interconnection: peering & transit (1/3)
4
Concentration of Host/ Content in some Carriers who become Tier1 and sell IP Transit
1995: NSFNet closes down and gives ISP Tier1 a clear run Global Internet Traffic: 0,18 PB/month
Telco C
Telco E
Telco B
Telco A
Telco D
peering
transit
transit peering
Host/ Content
Host/ Content Tier1
Tier1 Host/Content
Host/Content
transit
€
€
€
Typical delivery is based on Best Effort

State of Telecom 2012
IP Interconnection: peering & transit (2/3)
5
Telco/ Carrier
Telco/ Carrier
Telco B
Telco A
Telco D
peering
transit
transit peering
Host/ Content
Host/ Content
Host/Content
Host/Content
transit
Free riding !
2004: Google is listed in the S.E. Global Internet Traffic: 1477 PB/month
Growing importance of contents and Carriers/ Aggregators
Arrival of OTT/CP with steady concentration in big players (Google, Yahoo,...)
OTT
OTT
Best Effort - Big volume growth Performance improvement for selected traffic
Concentration of Host/ Content in some Carriers who become Tier1 and sell IP Transit
1995: NSFNet closes down and gives ISP Tier1 a clear run Global Internet Traffic: 0,18 PB/month

State of Telecom 2012
IP Interconnection: peering & transit (3/3)
6
Growth of CDN Providers for content global quality delivery (buffering, caching, web acceleration), and "Carriers" who deliver IP Transit (Level3, Global Crossing, Sparkle)
2010: Akamai’s revenues exceed 1B$ Global Internet Traffic: 20197 PB/m
Telco/ Carrier
Telco/ Carrier
Telco B
Telco A
Telco D
peering
transit
transit peering
Host/ Content
Host/ Content
Host/Content
Host/Content
transit
OTT
OTT CDN Node
CDN Node
CDN Node
Best Effort - Continuous volume growth CDN to improve delivery performance
Concentration of Host/ Content in some Carriers who become Tier1 and sell IP Transit
Growing importance of contents and Carriers/ Aggregators Arrival of OTT/CP with steady concentration in big players (Google, Yahoo,...)
1995: NSFNet closes down and gives ISP Tier1 a clear run Global Internet Traffic: 0,18 PB/month
2004: Google is listed in the S.E. Global Internet Traffic: 1477 PB/month
State of Telecom 2012
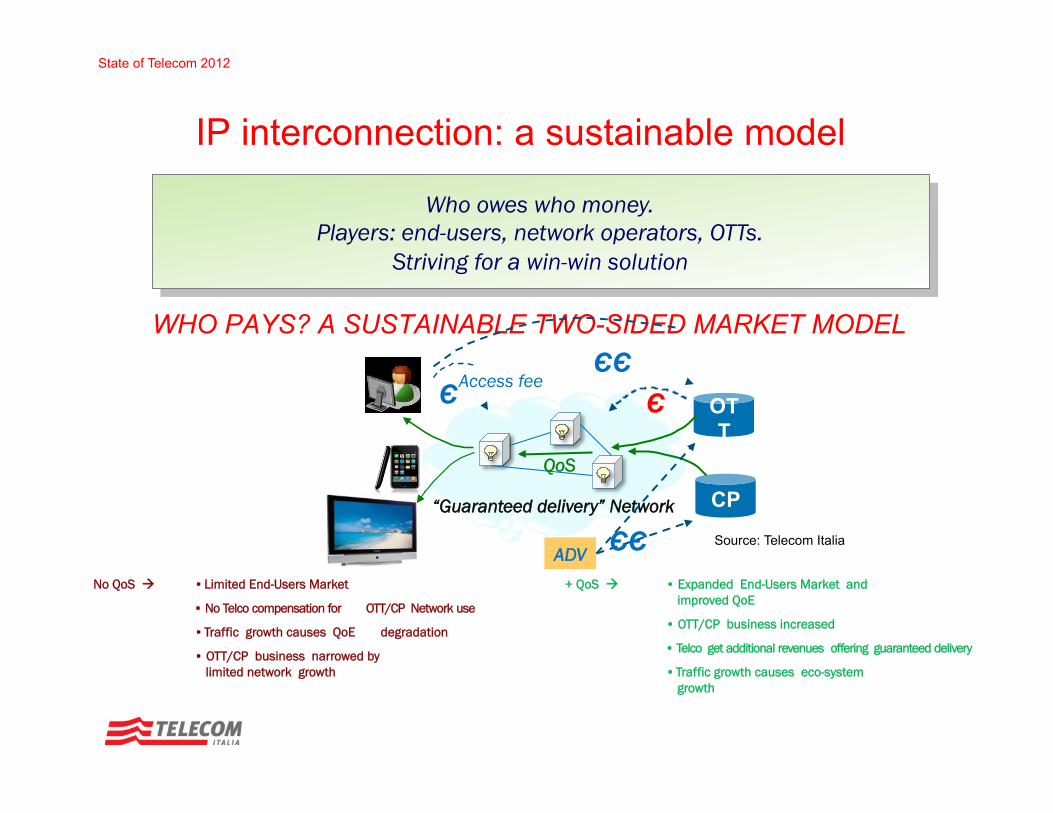
IP interconnection: a sustainable model
WHO PAYS? A SUSTAINABLE TWO-SIDED MARKET MODEL
“Guaranteed delivery” Network
OTT
CP
ЄЄ Є
ADV ЄЄ
Access fee
QoS
Є
Source: Telecom Italia
Who owes who money. Players: end-users, network operators, OTTs.
Striving for a win-win solution
+ QoS à ▪ Expanded End-Users Market and improved QoE
▪ OTT/CP business increased
▪ Telco get additional revenues offering guaranteed delivery
▪ Traffic growth causes eco-system growth
No QoS à ▪ Limited End-Users Market
▪ No Telco compensation for OTT/CP Network use
▪ Traffic growth causes QoE degradation
▪ OTT/CP business narrowed by limited network growth

State of Telecom 2012
The value of QoS…
(*) conversion rate: ratio of visitors who convert casual content views or website visits into desired actions (e.g. product sale, info or SW download, surfing on a specific page…)
* seconds of delay
milliseconds of delay
Reduction in revenue per client
Less search on their web
8 (#) DSA: Dynamic Site Accelerator
Akamai 2010 Investor Summit
Improvement of performances with
Akamai’s DSA#

State of Telecom 2012
Sizing the QoS market
9
Source: TI’s Elaboration based on Forecasts from Cisco VNI 2011-2016 (worldwide)
Revenues are mainly from Advertising and Video on Demand
One can estimate that more than half of the overall traffic
can benefit from a Quality of Service Delivery (this percentage could grow)
Source: Ti’s Elaboration based on Forecasts from Cisco VNI 2011-2016 (worldwide)
In a differentiated delivery scenario, we think that Telcos could address 10-15% of the OTT turnover
- 10,000 20,000 30,000 40,000 50,000 60,000 70,000 80,000 90,000
PB/M
onth
Voice over IP (VoIP)
Online gaming
Web, email, and data
Internet video
File sharing
CAGR 29%
10%
60%
10% 10%
5% 4% 1%
2012
Short form
Long form
Internet video to TV

State of Telecom 2012
Today’s demand for QoS
Licensed Caching & Fully
Licensed CDN
Only interconnection
10 Source: Akamai 2012
State of Telecom 2012
New Internet ecosystem
A win-win perspective by means of new commercial agreements END-TO-END QUALITY OF SERVICE ► Improved Internet environment both for OTTs and End-Users ► Better End-Users Market and improved perfomances ► OTT/CP business increased ► Telcos get additional revenues offering guaranteed delivery