low flow conditions in the lesser slave river, 1999-2000
TRANSCRIPT
LOW FLOW CONDITIONS IN THE LESSER SLAVE RIVER, 1999-2000
Prepared by:
Leigh Noton, M.Sc., P.Biol.
and
Michael Seneka, P.Eng.
Water Sciences Branch Water Management Division
Natural Resources Service
August, 2000
W0004

Pub. No: T/712 ISBN: 0-7785-3026-4 (Printed Edition) ISBN: 0-7785-3027-2 (On-Line Edition) Web Site: http://www3.gov.ab.ca/env/info/infocentre/publist.cfm Any comments, questions, or suggestions regarding the content of this document may be directed to: Environmental Monitoring and Evaluation Branch Alberta Environment 10th Floor, Oxbridge Place 9820 – 106th Street Edmonton, Alberta T5K 2J6 Phone: (780) 427-6277 Fax: (780) 422-6712 Additional copies of this document may be obtained by contacting: Information Centre Alberta Environment Main Floor, Great West Life Building 9920 – 108th Street Edmonton, Alberta T5K 2M4 Phone: (780) 944-0313 Fax: (780) 427-4407 Email: [email protected]
ii
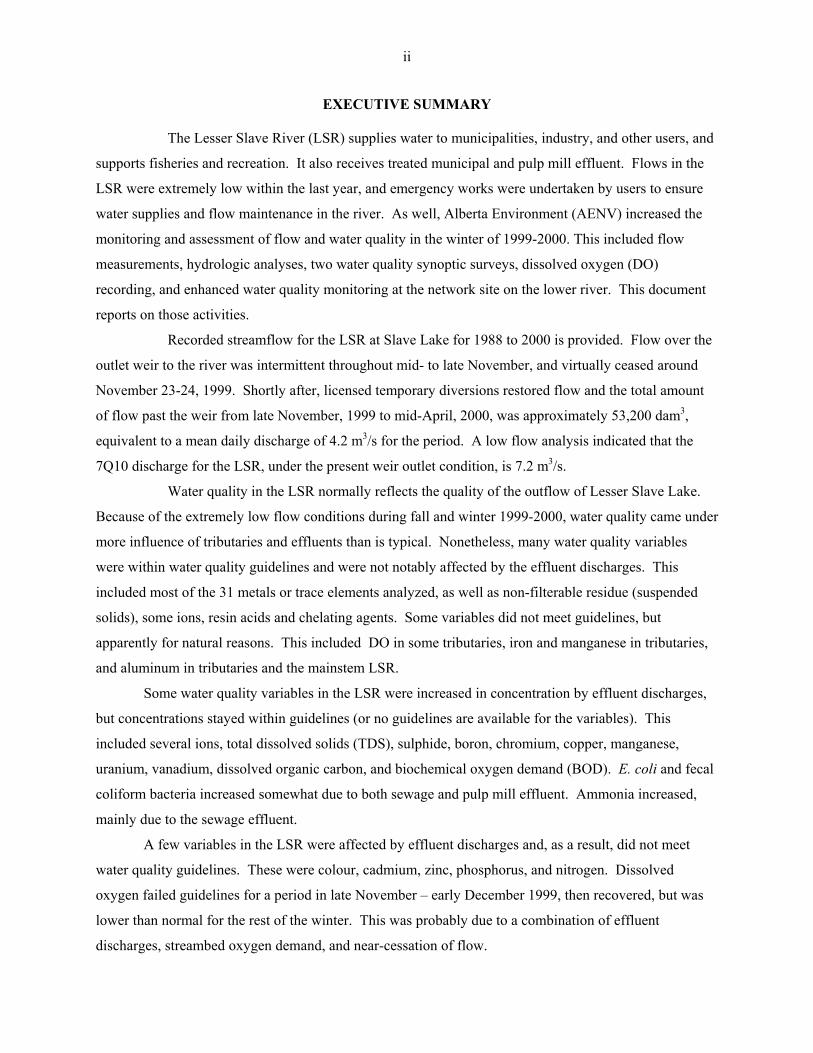
EXECUTIVE SUMMARY The Lesser Slave River (LSR) supplies water to municipalities, industry, and other users, and
supports fisheries and recreation. It also receives treated municipal and pulp mill effluent. Flows in the
LSR were extremely low within the last year, and emergency works were undertaken by users to ensure
water supplies and flow maintenance in the river. As well, Alberta Environment (AENV) increased the
monitoring and assessment of flow and water quality in the winter of 1999-2000. This included flow
measurements, hydrologic analyses, two water quality synoptic surveys, dissolved oxygen (DO)
recording, and enhanced water quality monitoring at the network site on the lower river. This document
reports on those activities.
Recorded streamflow for the LSR at Slave Lake for 1988 to 2000 is provided. Flow over the
outlet weir to the river was intermittent throughout mid- to late November, and virtually ceased around
November 23-24, 1999. Shortly after, licensed temporary diversions restored flow and the total amount
of flow past the weir from late November, 1999 to mid-April, 2000, was approximately 53,200 dam3,
equivalent to a mean daily discharge of 4.2 m3/s for the period. A low flow analysis indicated that the
7Q10 discharge for the LSR, under the present weir outlet condition, is 7.2 m3/s.
Water quality in the LSR normally reflects the quality of the outflow of Lesser Slave Lake.
Because of the extremely low flow conditions during fall and winter 1999-2000, water quality came under
more influence of tributaries and effluents than is typical. Nonetheless, many water quality variables
were within water quality guidelines and were not notably affected by the effluent discharges. This
included most of the 31 metals or trace elements analyzed, as well as non-filterable residue (suspended
solids), some ions, resin acids and chelating agents. Some variables did not meet guidelines, but
apparently for natural reasons. This included DO in some tributaries, iron and manganese in tributaries,
and aluminum in tributaries and the mainstem LSR.
Some water quality variables in the LSR were increased in concentration by effluent discharges,
but concentrations stayed within guidelines (or no guidelines are available for the variables). This
included several ions, total dissolved solids (TDS), sulphide, boron, chromium, copper, manganese,
uranium, vanadium, dissolved organic carbon, and biochemical oxygen demand (BOD). E. coli and fecal
coliform bacteria increased somewhat due to both sewage and pulp mill effluent. Ammonia increased,
mainly due to the sewage effluent.
A few variables in the LSR were affected by effluent discharges and, as a result, did not meet
water quality guidelines. These were colour, cadmium, zinc, phosphorus, and nitrogen. Dissolved
oxygen failed guidelines for a period in late November – early December 1999, then recovered, but was
lower than normal for the rest of the winter. This was probably due to a combination of effluent
discharges, streambed oxygen demand, and near-cessation of flow.
iii
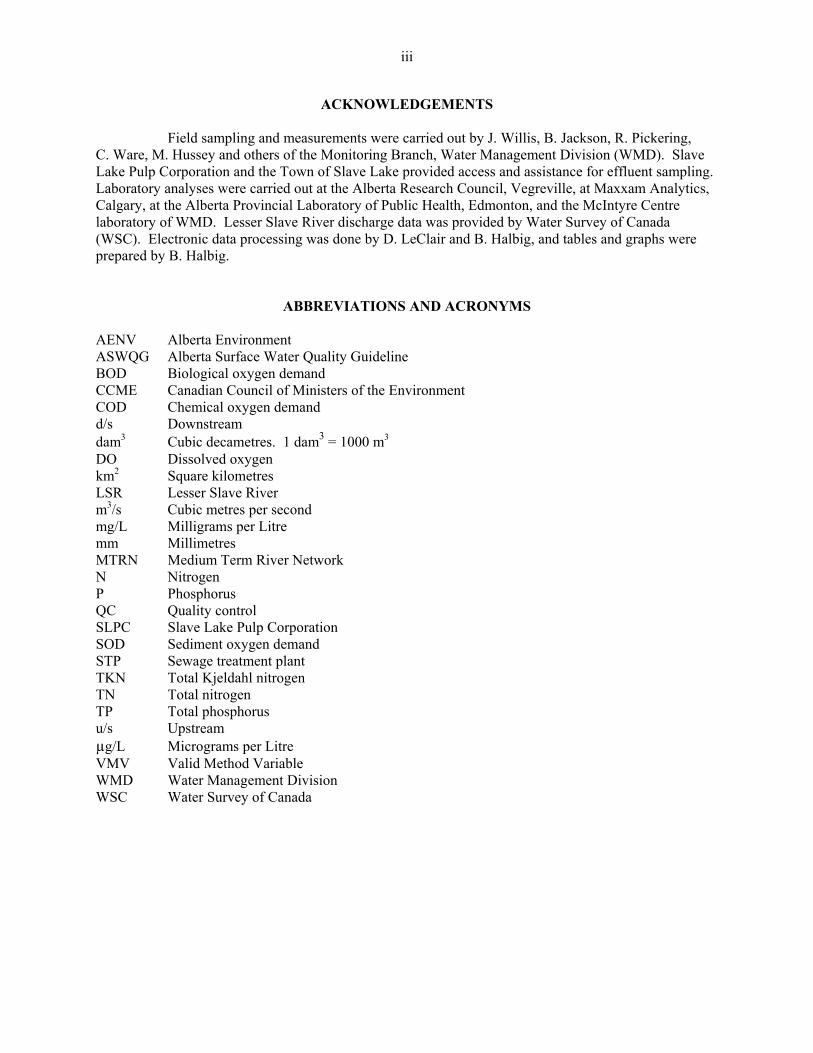
ACKNOWLEDGEMENTS Field sampling and measurements were carried out by J. Willis, B. Jackson, R. Pickering, C. Ware, M. Hussey and others of the Monitoring Branch, Water Management Division (WMD). Slave Lake Pulp Corporation and the Town of Slave Lake provided access and assistance for effluent sampling. Laboratory analyses were carried out at the Alberta Research Council, Vegreville, at Maxxam Analytics, Calgary, at the Alberta Provincial Laboratory of Public Health, Edmonton, and the McIntyre Centre laboratory of WMD. Lesser Slave River discharge data was provided by Water Survey of Canada (WSC). Electronic data processing was done by D. LeClair and B. Halbig, and tables and graphs were prepared by B. Halbig.
ABBREVIATIONS AND ACRONYMS AENV Alberta Environment ASWQG Alberta Surface Water Quality Guideline BOD Biological oxygen demand CCME Canadian Council of Ministers of the Environment COD Chemical oxygen demand d/s Downstream dam3 Cubic decametres. 1 dam3 = 1000 m3 DO Dissolved oxygen km2 Square kilometres LSR Lesser Slave River m3/s Cubic metres per second mg/L Milligrams per Litre mm Millimetres MTRN Medium Term River Network N Nitrogen P Phosphorus QC Quality control SLPC Slave Lake Pulp Corporation SOD Sediment oxygen demand STP Sewage treatment plant TKN Total Kjeldahl nitrogen TN Total nitrogen TP Total phosphorus u/s Upstream µg/L Micrograms per Litre VMV Valid Method Variable WMD Water Management Division WSC Water Survey of Canada

iv
TABLE OF CONTENTS EXECUTIVE SUMMARY ........................................................................................................................ii ACKNOWLEDGEMENTS ......................................................................................................................iii ABBREVIATIONS AND ACRONYMS ..................................................................................................iii LIST OF TABLES ...................................................................................................................................... v LIST OF FIGURES .................................................................................................................................... v 1.0 INTRODUCTION ......................................................................................................................... 1 2.0 METHODS - GENERAL .............................................................................................................. 2 3.0 RESULTS AND DISCUSSION .................................................................................................... 3
3.1 HYDROMETRIC ............................................................................................................... 3 3.2 WATER QUALITY ........................................................................................................... 4
3.2.1 General................................................................................................................... 4 3.2.2 Effects Not Exceeding Guidelines ......................................................................... 5 3.3.3 Variables Exceeding Guidelines ............................................................................ 6
4.0 REFERENCES............................................................................................................................. 10 5.0 TABLES AND FIGURES ........................................................................................................... 11
v
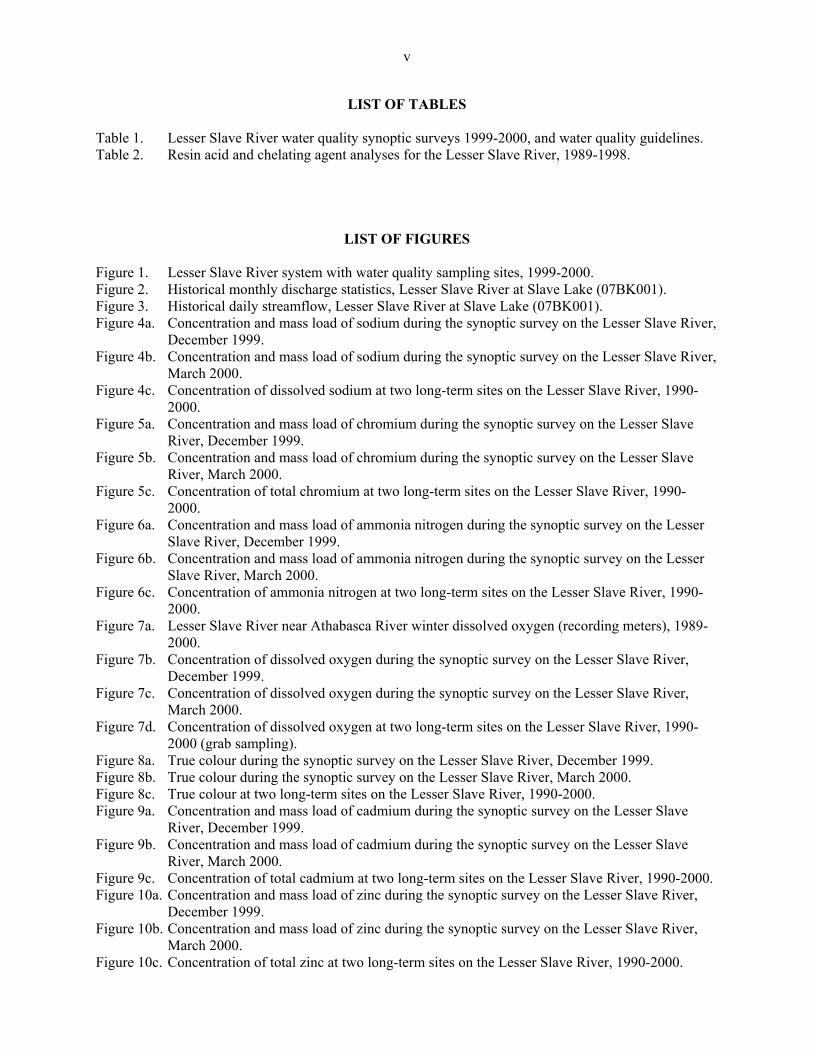
LIST OF TABLES Table 1. Lesser Slave River water quality synoptic surveys 1999-2000, and water quality guidelines. Table 2. Resin acid and chelating agent analyses for the Lesser Slave River, 1989-1998.
LIST OF FIGURES Figure 1. Lesser Slave River system with water quality sampling sites, 1999-2000. Figure 2. Historical monthly discharge statistics, Lesser Slave River at Slave Lake (07BK001). Figure 3. Historical daily streamflow, Lesser Slave River at Slave Lake (07BK001). Figure 4a. Concentration and mass load of sodium during the synoptic survey on the Lesser Slave River,
December 1999. Figure 4b. Concentration and mass load of sodium during the synoptic survey on the Lesser Slave River,
March 2000. Figure 4c. Concentration of dissolved sodium at two long-term sites on the Lesser Slave River, 1990-
2000. Figure 5a. Concentration and mass load of chromium during the synoptic survey on the Lesser Slave
River, December 1999. Figure 5b. Concentration and mass load of chromium during the synoptic survey on the Lesser Slave
River, March 2000. Figure 5c. Concentration of total chromium at two long-term sites on the Lesser Slave River, 1990-
2000. Figure 6a. Concentration and mass load of ammonia nitrogen during the synoptic survey on the Lesser
Slave River, December 1999. Figure 6b. Concentration and mass load of ammonia nitrogen during the synoptic survey on the Lesser
Slave River, March 2000. Figure 6c. Concentration of ammonia nitrogen at two long-term sites on the Lesser Slave River, 1990-
2000. Figure 7a. Lesser Slave River near Athabasca River winter dissolved oxygen (recording meters), 1989-
2000. Figure 7b. Concentration of dissolved oxygen during the synoptic survey on the Lesser Slave River,
December 1999. Figure 7c. Concentration of dissolved oxygen during the synoptic survey on the Lesser Slave River,
March 2000. Figure 7d. Concentration of dissolved oxygen at two long-term sites on the Lesser Slave River, 1990-
2000 (grab sampling). Figure 8a. True colour during the synoptic survey on the Lesser Slave River, December 1999. Figure 8b. True colour during the synoptic survey on the Lesser Slave River, March 2000. Figure 8c. True colour at two long-term sites on the Lesser Slave River, 1990-2000. Figure 9a. Concentration and mass load of cadmium during the synoptic survey on the Lesser Slave
River, December 1999. Figure 9b. Concentration and mass load of cadmium during the synoptic survey on the Lesser Slave
River, March 2000. Figure 9c. Concentration of total cadmium at two long-term sites on the Lesser Slave River, 1990-2000. Figure 10a. Concentration and mass load of zinc during the synoptic survey on the Lesser Slave River,
December 1999. Figure 10b. Concentration and mass load of zinc during the synoptic survey on the Lesser Slave River,
March 2000. Figure 10c. Concentration of total zinc at two long-term sites on the Lesser Slave River, 1990-2000.

vi
Figure 11a. Concentration and mass load of total phosphorus during the synoptic survey on the Lesser Slave River, December 1999.
Figure 11b. Concentration and mass load of total phosphorus during the synoptic survey on the Lesser Slave River, March 2000.
Figure 11c. Concentration of total phosphorus at two long-term sites on the Lesser Slave River, 1990-2000.
Figure 12a. Concentration and mass load of total nitrogen during the synoptic survey on the Lesser Slave River, December 1999.
Figure 12b. Concentration and mass load of total nitrogen during the synoptic survey on the Lesser Slave River, March 2000.
Figure 12c. Concentration of total nitrogen at two long-term sites on the Lesser Slave River, 1990-2000.

1
1.0 INTRODUCTION
The Lesser Slave River supplies water to municipalities, industry, and other users, and
supports fisheries and recreation. It receives treated municipal effluent from the town of Slave Lake, via
Sawridge Creek, and treated pulp mill effluent from Slave Lake Pulp Corporation (SLPC) downstream of
Mitsue Bridge (Figure 1). Flows in the Lesser Slave River have been extremely low within the last year,
and emergency works have been undertaken by users to ensure water supplies and flow maintenance in
the river. Monitoring of flow and water quality in the river was enhanced in November 1999 because of
this situation.
Streamflow has been gauged on the Lesser Slave River at or near the outflow of Lesser Slave
Lake at various times and locations as early as 1915. Streamflow in the river is currently measured at the
Water Survey of Canada (WSC) gauging station 07BK001, situated at the outlet weir, just downstream of
the Highway 88 bridge. Lesser Slave Lake levels (WSC station 07BJ006) are measured at the Town of
Slave Lake water intake, located at the outlet of the Lake. Lake levels have similarly been recorded as
early as 1915, at various sites throughout the period of record. Prior to 1984, outflow from the lake into
the Lesser Slave River was unaffected by human activity. A fixed-crest weir and downstream channel
improvements were completed in 1984, resulting in departure from the natural outflow from Lesser Slave
Lake.
Streamflow has been measured at the present weir location since 1988. Figure 2 shows the
mean monthly flow ranges for the period of record. Note that due to the large surface area of Lesser
Slave Lake and the large drainage area (13,575 km2) that supplies the lake, the flow in the river does not
fluctuate widely on a seasonal basis, compared to what is typically observed in other rivers and streams.
This is due to the buffering effect of the lake, which not only dampens runoff events that occur during the
year, but also provides longer-term attenuation from one year to the next.
Previous Alberta Environment (AENV) water quality monitoring on the LSR has included
two ‘Medium Term River Network’ (MTRN) sites: at the outflow of Lesser Slave Lake; and near the
confluence with the Athabasca River. In addition, ‘synoptic’ surveys were conducted during the winters
of 1990-96, and dissolved oxygen (DO) has been recorded near the Athabasca River confluence during
the winters of 1989-97. During the winter of 1999-2000, the lower MTRN site was maintained, two
synoptic surveys were carried out, and DO recording was re-instated. As well, measurements of
streambed oxygen demand (SOD) were made, open water leads were mapped, and a review of water
quality models for DO was contracted. The latter projects were carried out to support potential DO
modelling at a later date.
This report compiles the AENV and WSC data from the recent discharge monitoring,
synoptic surveys, DO recording, and MTRN sites. Water quality data for the recent low flow conditions

2
are summarized, interpreted, and compared to water quality guidelines. For water quality variables of
concern, data from previous monitoring are also presented, in order to better describe the longer term
conditions in the LSR. In addition, a low flow frequency analysis calculating a 7Q101 discharge was
undertaken to assess the recent low lake levels/low flow conditions within a historical context, and to
support an evaluation of water quality-based effluent limits by AENV-Environmental Services.
2.0 METHODS - GENERAL
The work covered in this report includes hydrometric monitoring, water quality synoptic
surveys, DO monitoring, and MTRN site monitoring. This section provides an overview of the methods
used in the work. Detailed descriptions of the methods are also available from AENV.
The hydrometric monitoring consists mainly of the regular streamflow and lake level
monitoring that is routinely conducted and published by WSC. Due to the presence of siphons and the
removal of one fishway at the weir during the winter of 1999-2000, the existing rating curve at the weir
was not valid. Periodic site measurements were conducted to ensure that a new rating curve was
established and that the flow record was correct. An important note to remember when interpreting the
streamflow measurements is that the streamflow data, as published, consist of the total flow over the weir.
The available data is insufficient to separate the flow amongst the various components, i.e., flow that
occurred through the siphons and fishway, and the flow that may have occurred naturally had emergency
measures not been adopted. However, it is reasonable to assume that the majority of flow occurring from
November 25 until the spring of 2000 was facilitated by the temporary diversions, recognizing that a
minimal amount of natural flow might still have occurred.
Water quality synoptic surveys were carried out in December 1999 and March 2000. Twelve
sites were sampled, including the LSR, effluents, and tributaries (Figure 1). During these surveys,
sampling started at the upstream-most site, and progressed downstream at approximately the river’s time
of travel. This approach allows sampling of a ‘parcel’ of water, more or less, as it moves downstream and
receives effluent and tributary inflows. An extensive list of variables was sampled, with particular
emphasis on those relevant to sewage and pulp mill effluents. The actual times, locations, and variables
are listed with the compiled data in Table 1.
The two MTRN sites have been operated on the LSR for most of the 1990’s. Sampling has
been conducted approximately six times per year, for a set of variables similar to those sampled during
the synoptic surveys. The recording oxygen meters have been installed under the ice near the Athabasca
1 The 7Q10 discharge is defined as the low flow, averaged over a 7-day period, that would be expected to occur once every ten years.

3
River confluence during most winters in the 1990’s. As well as DO, the meters record temperature, pH,
and conductance.
Laboratory analyses were carried out at: the Alberta Research Council, Vegreville; Maxxam
Analytics, Calgary; the Alberta Provincial Laboratory of Public Health, Edmonton; and at the McIntyre
Centre lab of WMD. For the synoptic surveys, the VMV codes for the analytical methods used are
included with the column headers in Table 1. Full descriptions of these are available from AENV or the
Environment Canada website.
Standard quality control (QC) measures were taken throughout the work and included proper
field sampling gear and procedures, laboratory QC measures, and the submission of blind replicate and
field blank samples. Details are available from AENV and the results of replicate and blank samples are
included in Table 1. All data were subject to regular AENV validation procedures. Data were
downloaded from the Water Data System, and compiled into tables and figures. Mass flux, or ‘load’, was
calculated from concentration and discharge data. For graphing and load calculations, values less than the
detection limit were taken to be ½ the detection limit. To evaluate water quality conditions, concentration
data were compared to the Surface Water Quality Guidelines for use in Alberta (ASWQG) (AENV 1999).
3.0 RESULTS AND DISCUSSION
3.1 HYDROMETRIC
The Hydrology/Forecasting Section of Water Sciences Branch completed an initial
assessment of the impact of diversions in April of 2000. Figure 3 shows the recorded streamflow for the
Lesser Slave River at Slave Lake for 1988 to 2000 (2000 data are considered preliminary, and may be
subject to revision). The outlet weir had intermittently cut off flow to the river throughout mid- to late
November of 1999, depending upon wind set-up conditions on the lake. This eventually culminated in
near-complete cessation of flow around November 23-24, 1999. At about this time, the temporary license
to divert water was issued and the emergency measures were implemented to restore flow to the
downstream system.
The total amount of flow past the weir occurring from November 25, 1999 to April 18, 2000,
was approximately 53,200 dam3. This volume is equivalent to a mean daily discharge of 4.2 m3/s for the
period, or about 46 mm of depth on the lake. Levels remained relatively stable throughout the winter,
indicating that the combination of snow and ice on the lake, and winter inflow from upstream tributaries,
was sufficient to maintain lake levels while the diversion remained in place. Spring runoff in the
watershed for 2000 was essentially complete by the beginning of April. As in much of the Province,
runoff was virtually negligible, and the lake levels did not increase appreciably. The lake has since
4
responded to precipitation that has occurred in May and June, restoring the lake levels to some degree but
remaining well below average for early summer.
A low flow analysis conducted by the Hydrology/Forecasting Section and reported
separately (Seneka, 2000) indicated that the 7Q10 discharge for the Lesser Slave River, under the present
weir outlet condition, is 7.2 m3/s. This represented a large departure from the previously calculated value
of 11.6 m3/s, however, the change was not solely attributable to the recent low flow event. Instead, a
combination of several factors, including the impact of the weir on the outlet rating curve and a longer
period of record, resulted in the lower value.
Discharge data for the times and sites sampled during the synoptic surveys are compiled in
Table 1. Discharge appeared to decline down the mainstem of the LSR during both surveys, by about 20-
25%, despite some inflow from tributaries. Water withdrawals by licenced users were probably not
enough to account for all of these losses. The apparent decline in discharge is likely due to some
combination of water loss due to ice formation (particularly in December 1999), non-steady state flow in
the river, consumptive withdrawals, and measurement inaccuracy during winter ice conditions.
3.2 WATER QUALITY
Water quality in the Lesser Slave River is normally determined in large part by the quality of
the outflow of Lesser Slave Lake. Because of the extremely low flow conditions this past fall and winter,
water quality came under more influence of tributaries and effluents than is usually the case. The
following is a synopsis of conditions within the recent fall-winter period, particularly with respect to any
effects of effluents and tributaries. Water quality of the LSR is also compared to water quality guidelines
(AENV 1999). The data for the two synoptic surveys, along with water quality guidelines, are compiled
in Table 1. As well, graphs are provided for selected variables. These show concentrations and loads (=
mass flux) for the sampling points down the river system during the synoptic surveys, and also show
concentrations at the two MTRN sites during the 1990’s.
3.2.1 General
Many water quality variables were within water quality guidelines and were not notably
affected by effluent discharges during fall-winter, 1999-2000. This included most of the 31 metals or
trace elements analyzed, as well as non-filterable residue (suspended solids), some ions, resin acids and
chelating agents (Table 1).
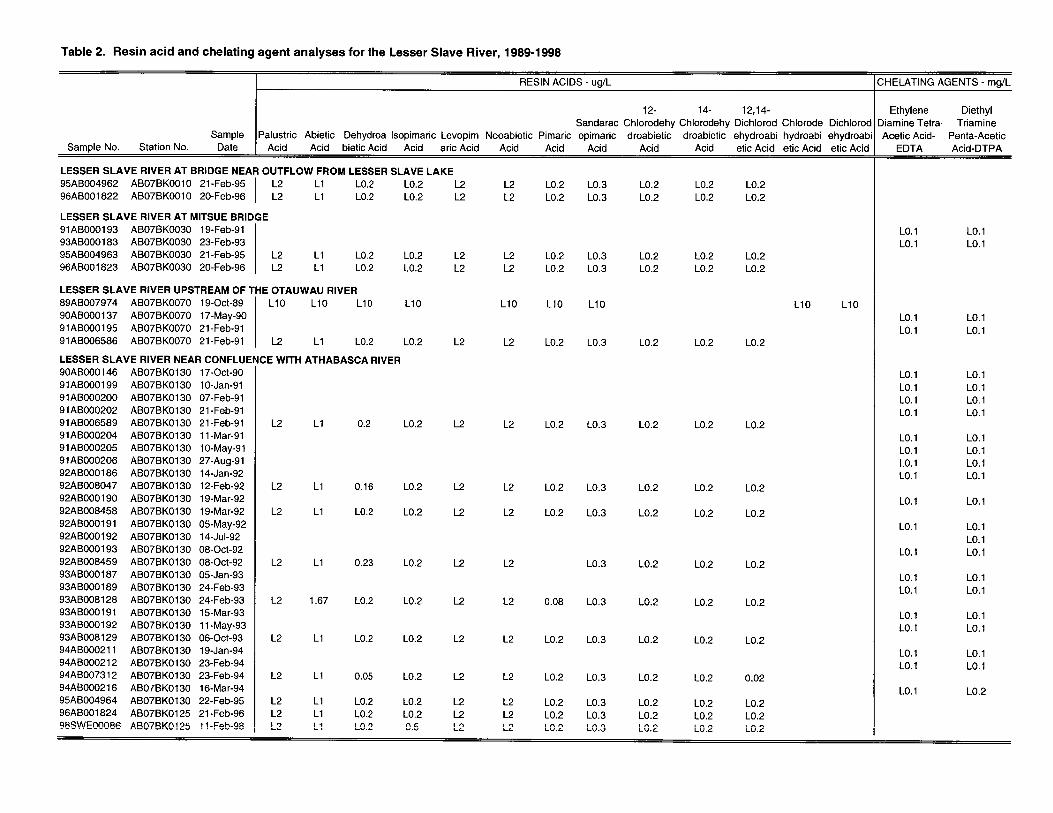
The resin acids (palustric through 12,14-dichloro-dehydro-abietic acid in the tables of
Table 1) are common by-products of pulp mills and can account for much of the toxicity of untreated mill
effluents. However, they are efficiently degraded by effluent treatment, and have generally been at low
5
levels in the river downstream of the pulp mill effluent in the 1990’s (Table 2). Those levels,
approximately 1 µg/L or less, are well within the water quality guideline of 100 µg/L for total resin acids.
Chelating agents are also listed in Table 2. They are used in the industrial process in the pulp
mill and are detectable in the mill effluent (Table 1). They have not been detected in the LSR since
monitoring began in the early 1990’s.
Some variables did not meet water quality guidelines, but apparently for natural reasons.
This included:
• Dissolved oxygen in the Otauwau and Saulteaux rivers, tributaries to the LSR.
• Iron and manganese in tributaries; aluminum in tributaries and the mainstem Lesser Slave
River; lead in occasional samples from the mainstem.
• Mercury (total) in the Lesser Slave River also exceeded the very stringent draft Alberta
guideline, but not the CCME (Canadian Council of Ministers of the Environment) guideline
for protection of aquatic life. The actual concentrations were quite low and mercury was also
detectable in the field blank. Further investigation would be necessary to confirm mercury
concentrations in the river.
3.2.2 Effects Not Exceeding Guidelines
Some water quality variables in the LSR were increased in concentration by effluent
discharges, but concentrations stayed within guidelines (or no guidelines are available for the variables).
Details follow.
• Sodium, bicarbonate, sulphate, reactive silica, and total dissolved solids all increased mainly
due to the pulp mill effluent. Figure 4a and b illustrate the effects of an input on river
concentrations, utilizing sodium, which was high in the pulp mill effluent and is a
conservative ion. ‘Conservative’ means that it stays dissolved in the water column and is
subject to very little change due to physical, chemical, or biological processes. Figure 4c
shows sodium concentrations throughout the 1990’s and illustrates the effect of dilution on
the sodium inputs from the pulp mill effluent. During many winters, when flows are lower
than in summer, sodium concentrations rise. During the winters of 1997 and 1998, flows
were much above average and sodium concentrations remained similar to upstream levels.
During the winters of 1999 and 2000, flows were much below average, and sodium rose to
much higher levels at the downstream site. Note that during the winter of 1990, prior to the
start-up of the SLPC, there was little difference in concentration of sodium between the two
sites.

6
• Sulphide was just detectable in the river downstream of the mill effluent during both surveys,
but stayed within the guideline of 0.002 mg/L. The pulp mill effluent accounted for this
(Table 1).
• Boron, copper, manganese, uranium, and vanadium increased in the river downstream of the
pulp mill effluent, but remained within guidelines. Manganese was also very high in the
Saulteaux River in March, and contributed to an increase in the LSR then (Table 1). The
reason for the high manganese is not certain, although it could be a natural condition.
• River concentrations of chromium were increased by the pulp mill effluent during both
surveys, but can not be fully evaluated because information on the form of chromium is not
available, and the guidelines are specific to chromium VI. The graphs of loads (Figures 5a
and b) show that the increases in river concentrations can be accounted for by the load from
the pulp mill effluent. During the 1990’s, chromium was occasionally higher than during the
winter of 1999-2000 (Figure 5c), including a period in 1992-93 when it was notably higher at
the downstream site than near the lake outflow.
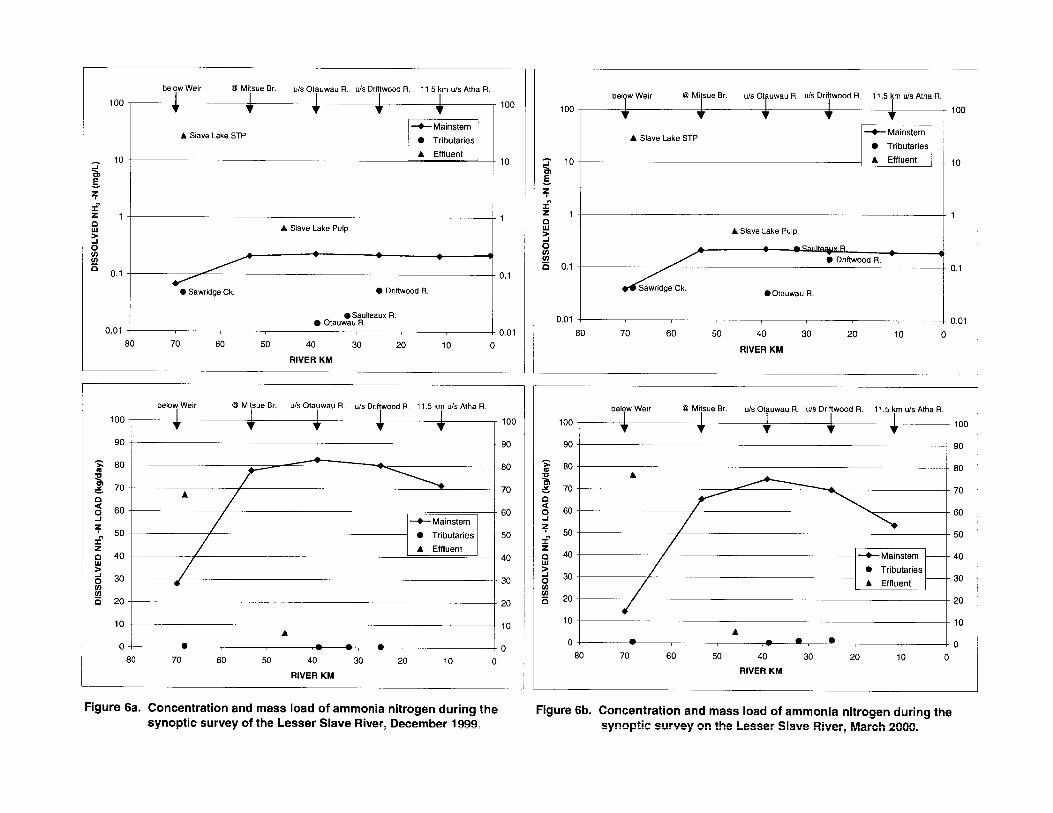
• Ammonia nitrogen in the LSR was increased due to discharge of the sewage effluent
(Figure 6). Concentrations stayed within the guideline which, for the pH conditions
prevailing during winter, was >1 mg/L. During the 1990’s, ammonia-N in winter has
generally been higher at the site near the Athabasca River than at the site near the lake
outflow (Figure 6c).
• Dissolved organic carbon, biochemical oxygen demand (BOD), and chemical oxygen
demand (COD) increased in the lower LSR, mainly due to the pulp mill effluent, although
sewage appeared to contribute some BOD (Table 1). Note that although no guidelines exist
for BOD per se, this variable of course, strongly influences dissolved oxygen (see below).
• Escherichia coli and fecal coliform bacteria: The sewage effluent and perhaps also Sawridge
Creek appeared to contribute these bacteria during the December synoptic survey, whereas
the pulp mill effluent appeared to contribute them in March (Table 1). Guidelines for
irrigation and recreational water quality were not exceeded.
3.3.3 Variables Exceeding Guidelines
A few variables in the Lesser Slave River were affected by effluent discharges and as a result
exceeded water quality guidelines, during both the December 1999 and March 2000 synoptic surveys
(Table 1). These included:
7
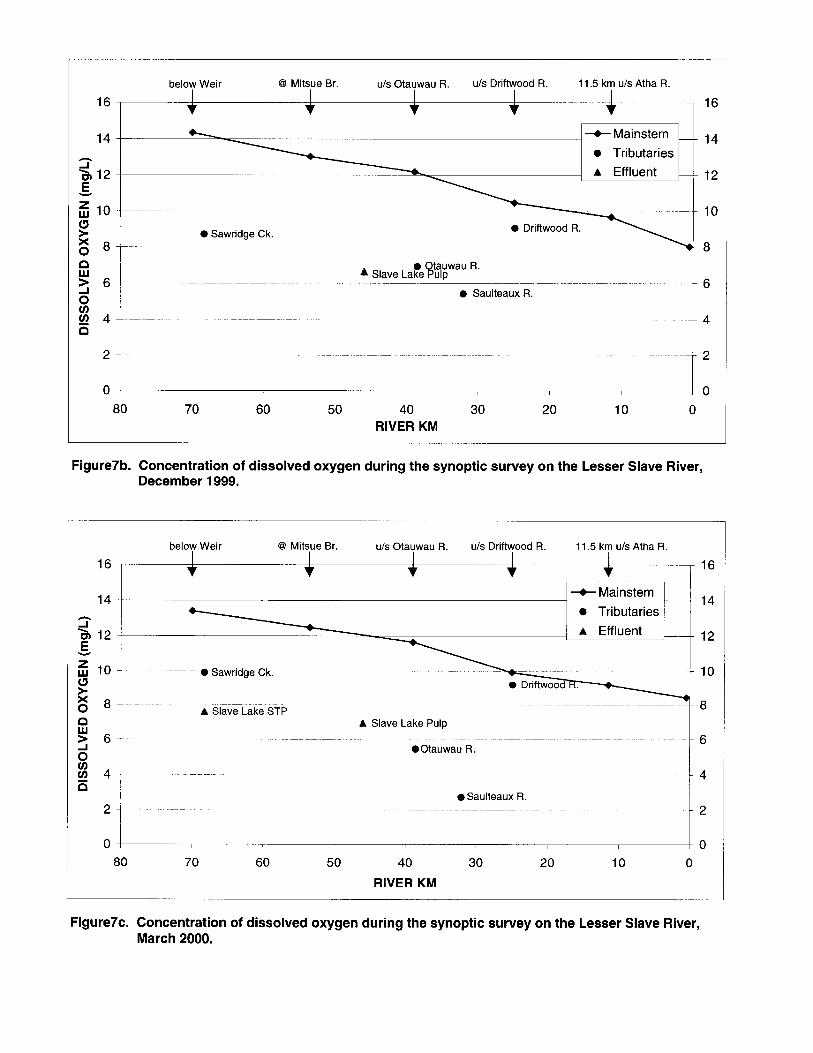
• Dissolved oxygen: Oxygen is necessary for the maintenance of aquatic life, and the
applicable Alberta guidelines are 6.5 mg/L (chronic) and 5 mg/L (acute). DO monitoring was
done with recording meters at the MTRN site for most of the 1999-2000 winter, and the
concentrations are plotted in Figure 7a. The Alberta guidelines for DO were not met in early
December 1999, prior to the first synoptic survey. The cause of the marked sag in DO then
may be a combination of negligible flow in the river, BOD inputs in sewage and tributaries,
upset BOD inputs from the pulp mill, and oxygen demand from the streambed (SOD). More
detailed assessment, potentially including modelling, would be required to better determine
the significance of each factor. After the low-DO event, flow in the river was augmented and
mill effluent BOD loads declined. DO recovered and stayed above 8 mg/L for the rest of the
winter. Note that during previous winters when DO has been recorded, it has always been
above 10 mg/L (Figure 7a). This probably reflects the greater flow and effluent dilution
during more typical winters.
During the actual synoptic surveys, all DO concentrations in the LSR met the guidelines
(Figures 7b and 7c). Note that DO declined down the river system by about 5-6 mg/L, from
the weir near Slave Lake, to the confluence with the Athabasca River. During these surveys,
DO at the mouth of the river was 0.8 to 1.7 mg/L lower than at the site 11.5 km upstream,
where the recording DO meter was installed.
The longer-term data (Figure 7d) show that DO is always somewhat lower in winter at the
downstream end of the LSR than near the lake outflow. However, the winter of 1999-2000
was more accentuated in this regard. Note that DO is actually lower in the summer months of
most years, because of the lower solubility of oxygen in warmer water.
The effect on aquatic life of the DO sag in November-December 1999 is not presently
known. SLPC carried out an effects monitoring survey in early January 2000, which may
provide information relevant to this question.
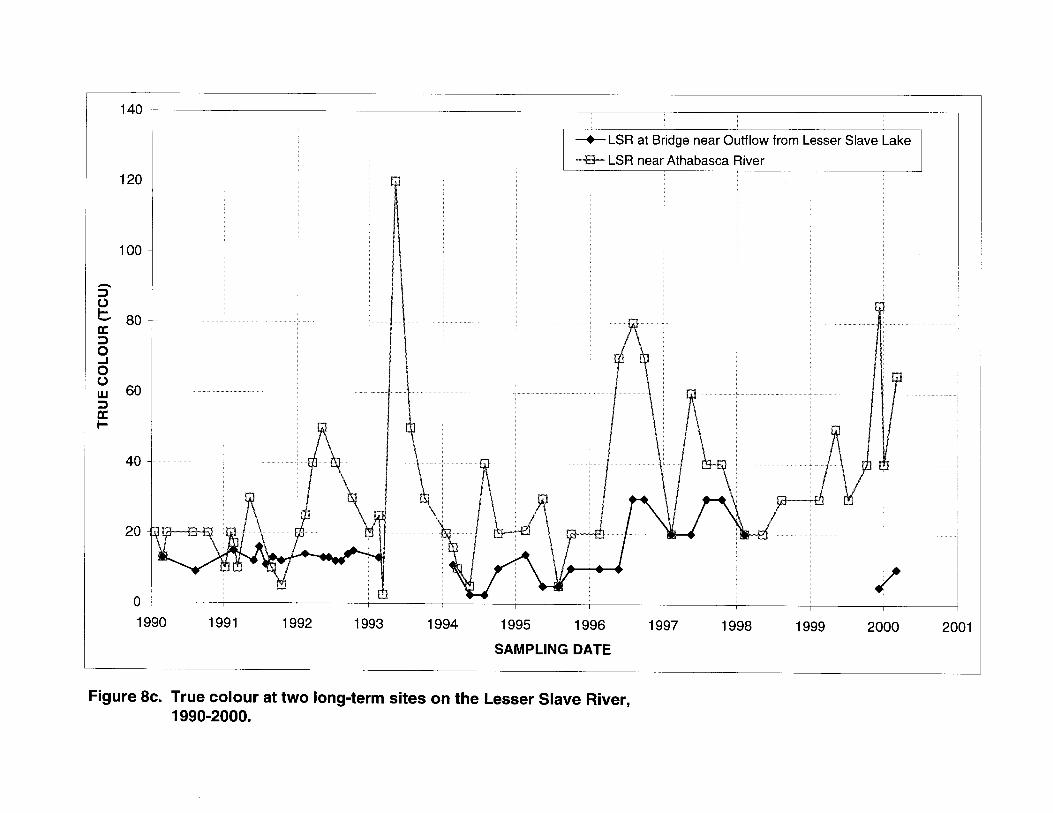
• Colour: Colour is usually measured on a filtered sample and is then termed ‘true’ colour.
Colour of the LSR during the two synoptic surveys was increased by the highly coloured pulp
mill effluent (Figures 8a and b). The guideline for colour, which is a maximum increase of
30 units, was exceeded as a result. Excessive colour can impair the aesthetic qualities of
water and can limit light penetration into water, thereby inhibiting photosynthesis during the

8
growing season. In the 1990’s, colour has usually been highest in the LSR in summer
(Figure 8c), perhaps because of higher flows entraining more organic material, and the inflow
of stained tributaries. Colour has usually been higher in the lower river than near the lake
outflow.
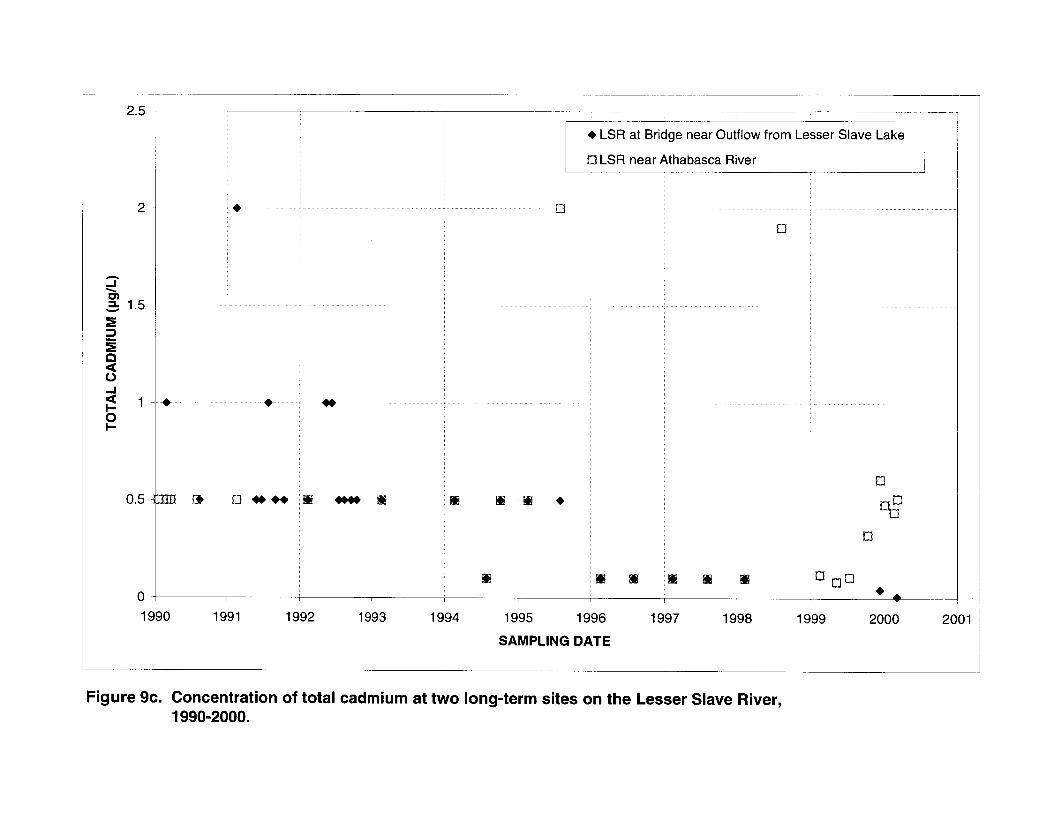
• Cadmium: During the synoptic surveys, cadmium increased in the lower LSR, mainly due to
the input of the pulp mill effluent (Figure 9a and b). Although the LSR d/s of the weir was
slightly above the guideline in December 1999, the mill effluent increased concentrations
noticeably. The guideline for the prevailing water hardness (100 mg/L) is 0.033 µg/L
(CCME 1999 in AENV 1999). It is difficult to evaluate cadmium during the 1990’s because
many past results were less than the analytical detection limits. Improved detection limits in
recent years have allowed better evaluation of cadmium concentrations (Figure 9c).
• Zinc: Pulp mill effluent concentrations of zinc were about 1000 µg/L during the synoptic
surveys, and this input caused river concentrations to rise (Figure 10a and b) and exceed the
30 µg/L guideline for the protection of aquatic life. Zinc has tended to be higher at the
downstream site during the 1990’s (Figure 10c), although it has not been observed to exceed
the water quality guideline before.
• Phosphorus (P): Phosphorus is an important plant nutrient and excessive amounts of it may
lead to increased growth of aquatic plants. Total P increased down the river during the two
synoptic surveys, mainly due to pulp mill effluent, although sewage also contributed (Figures
11a and b). Concentrations exceeded the Alberta guideline, which is 0.05 mg/L. About 2/3
to 3/4 of the P was in the dissolved form throughout the river (Table 1). Phosphorus has
tended to be higher at the downstream site than near the lake outflow during the 1990’s
(Figure 11c). Effluents may be contributing to this difference, although tributary inflows may
also be significant.
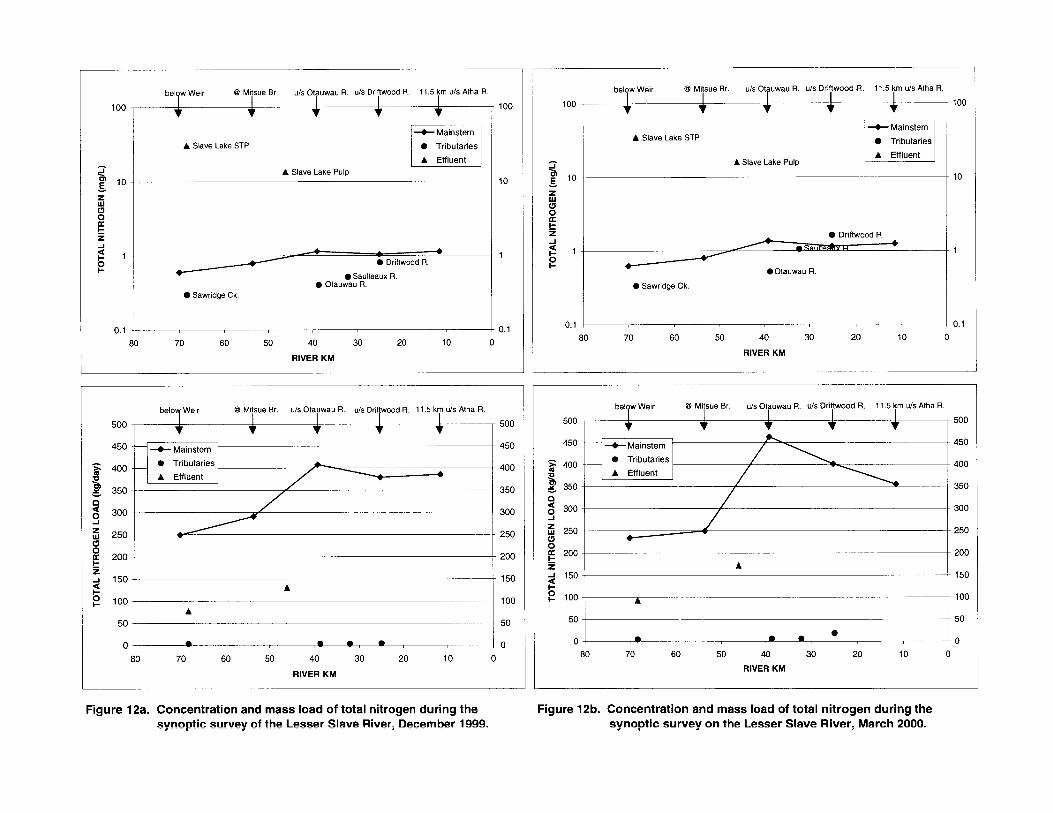
• Nitrogen: As for phosphorus, nitrogen is an important plant nutrient. Total nitrogen (TN) is
calculated as the sum of nitrite+nitrate nitrogen and total Kjeldahl nitrogen (TKN). The latter
includes both ammonia and organic nitrogen. During the winter synoptic surveys, TN
increased in the LSR (Figures 12a and b) due to both sewage effluent (mostly as ammonia)
and pulp mill effluent (mostly as organic nitrogen). Although some tributaries were also high
in TN, their loads were much lower than the effluent loads (Figure 12a and b). The Alberta
9
guideline is 1 mg/L and was exceeded downstream of the pulp mill effluent. Nitrification
appeared to be occurring downstream in the river during the winter (Table 1). During the
1990’s, TN was generally higher at the downstream site than upstream (Figure 12c), although
gaps in the data record make this a tentative conclusion.
Overall, greater effects on water quality have occurred during winter 1999-2000, in large part
due to the very low flows providing less dilution of effluents.

10
4.0 REFERENCES
Alberta Environment. 1999. Surface water quality guidelines for use in Alberta. Pub. No. T/483.
Environmental and Natural Resources Services, Edmonton. 20 p. Canadian Council of Ministers of the Environment (CCME). 1999. Canadian environmental quality
guidelines (CEQG). Environment Canada, Hull, Ottawa. Seneka, M. 2000. Lesser Slave River at Slave Lake low flow frequency analysis. Water Sciences
Branch, Hydrology/Forecasting Section Report 7BJ, 2000-119. Alberta Environment.
11
5.0 TABLES AND FIGURES

Table 1 - Page 1 of 12
Table 1 Lesser Slave River water quality synoptic surveys 1999-2000, and water quality guidelines.
LatitudeLongitude Station Description
Sample Date
River distance
from mouth
Discharge Water Temp
100925km m3/s Deg C
99SWE05744 AB07BK0020 551819 1144510 LSR below Weir, near Outflow from Lesser Slave Lake-LB 13-Dec-99 70 4.85 -0.299SWE05745 AB07BK0020 LSR below Weir, near Outflow from Lesser Slave Lake-LB 13-Dec-9999SWE05742 AB07BK0025 551705 1144529 Sawridge Ck. at Hwy 88 Bridge u/s of Slave Lake STP Effl. 13-Dec-99 68.3 0.118 -0.399SWE05740 AB07BK0360 551711 1144500 Slave Lake STP Final Effl. 13-Dec-99 68.3 0.02999SWE05741 AB07BK0360 Slave Lake STP Final Effl. 13-Dec-9999SWE05756 AB07BK0030 551736 1143520 LSR at Mitsue Bridge 14-Dec-99 53.5 4.29 -0.399SWE05757 AB07BK0030 LSR at Mitsue Bridge 14-Dec-9999SWE05760 AB07BK0030 LSR at Mitsue Bridge 15-Dec-99 -0.399SWE05753 AB07BK0330 551510 1143225 Slave Lake Pulp Mill Final Effl. 14-Dec-99 46 0.112 26.499SWE05754 AB07BK0330 Slave Lake Pulp Mill Final Effl. 14-Dec-9999SWE05747 AB07BK0070 551650 1142507 LSR u/s of Otauwau R. 14-Dec-99 39 4.16 -0.399SWE05748 AB07BK0070 LSR u/s of Otauwau R. 14-Dec-9999SWE05750 AB07BK0075 Otauwau R. above Confl. LSR 14-Dec-99 38.6 0.084 -0.399SWE05751 AB07BK0075 Otauwau R. above Confl. LSR 14-Dec-9999SWE05765 AB07BK0085 551553 1141949 Saulteaux R. above Confl. LSR 15-Dec-99 32.1 0.067 -0.399SWE05766 AB07BK0085 Saulteaux R. above Confl. LSR 15-Dec-9999SWE05768 AB07BK0100 551516 1141446 LSR 0.5 km u/s Confl. Driftwood R. 15-Dec-99 25 4.22 -0.399SWE05769 AB07BK0100 LSR 0.5 km u/s Confl. Driftwood R. 15-Dec-9999SWE05762 AB07BK0105 551516 1141422 Driftwood R. above confl. LSR 15-Dec-99 24.9 0.054 -0.399SWE05763 AB07BK0105 Driftwood R. above confl. LSR 15-Dec-9999SWE05776 AB07BK0125 551224 1140721 LSR 11.5 km u/s Athabasca R. Confl. 16-Dec-99 11.5 3.94 0.099SWE05777 AB07BK0125 LSR 11.5 km u/s Athabasca R. Confl.(BOD REPL.) 16-Dec-9999SWE05778 AB07BK0125 LSR 11.5 km u/s Athabasca R. Confl.(TRUE SPLIT #2) 16-Dec-9999SWE05779 AB07BK0125 LSR 11.5 km u/s Athabasca R. Confl.(TRUE SPLIT #3) 16-Dec-9999SWE05783 AB07BK0130 550957 1140343 LSR near Confluence with Athabasca R 20-Dec-99 0.5 0.199SWE05784 AB07BK0130 LSR near Confluence with Athabasca R 20-Dec-9999SWE05780 AB10CA0001 Field Blank 16-Dec-99
AWQG
LatitudeLongitude Station Description
Sample Date
River distance
from mouth
Discharge Water Temp
100925km m3/s Deg C
00SWE00401 AB07BK0020 551819 1144510 LSR below Weir, near Outflow from Lesser Slave Lake-LB 06-Mar-00 70 4.350 0.500SWE00402 AB07BK0020 LSR below Weir, near Outflow from Lesser Slave Lake-LB 06-Mar-0000SWE00403 AB07BK0025 551705 1144529 Sawridge Ck. at Hwy 88 Bridge u/s of Slave Lake STP Effl. 06-Mar-00 68.3 0.136 0.100SWE00398 AB07BK0360 551711 1144500 Slave Lake STP Final Effl. 06-Mar-00 68.3 0.031 2.000SWE00399 AB07BK0360 Slave Lake STP Final Effl. 06-Mar-0000SWE00406 AB07BK0030 551736 1143520 LSR at Mitsue Bridge 07-Mar-00 53.5 3.610 0.000SWE00407 AB07BK0030 LSR at Mitsue Bridge 07-Mar-0000SWE00414 AB07BK0330 551510 1143225 Slave Lake Pulp Mill Final Effl. 07-Mar-00 46 0.125 25.200SWE00414 AB07BK0330 Slave Lake Pulp Mill Final Effl. 07-Mar-0000SWE00412 AB07BK0070 551650 1142507 LSR u/s of Otauwau R. 07-Mar-00 39 3.930 0.300SWE00413 AB07BK0070 LSR u/s of Otauwau R. 07-Mar-0000SWE00409 AB07BK0075 Otauwau R. above Confl. LSR 07-Mar-00 38.6 0.126 0.000SWE00410 AB07BK0075 Otauwau R. above Confl. LSR 07-Mar-0000SWE00438 AB07BK0085 551553 1141949 Saulteaux R. above Confl. LSR 08-Mar-00 32.1 0.064 0.200SWE00439 AB07BK0085 Saulteaux R. above Confl. LSR 08-Mar-0000SWE00441 AB07BK0100 551516 1141446 LSR 0.5 km u/s Confl. Driftwood R. 08-Mar-00 25 4.040 0.200SWE00442 AB07BK0100 LSR 0.5 km u/s Confl. Driftwood R. 08-Mar-0000SWE00444 AB07BK0105 551516 1141422 Driftwood R. above confl. LSR 08-Mar-00 24.9 0.132 0.200SWE00445 AB07BK0105 Driftwood R. above confl. LSR 08-Mar-0000SWE00451 AB07BK0125 551224 1140721 LSR 11.5 km u/s Athabasca R. Confl. 09-Mar-00 11.5 3.290 0.200SWE00452 AB07BK0125 LSR 11.5 km u/s Athabasca R. Confl. 09-Mar-0000SWE00448 AB07BK0130 550957 1140343 LSR near Confluence with Athabasca R 09-Mar-00 0.5 0.200SWE00449 AB07BK0130 LSR near Confluence with Athabasca R 09-Mar-0000SWE00454 AB10CA0001 Field Blank 09-Mar-0000SWE00455 AB10CA0001 Field Blank 09-Mar-00Project ABS076 AWQG: Alberta Surface Water Quality Guidelines (1999)
CEQG: Canadian Environmental Quality Guidelines (CCME) (1999) -AGR (Agriculture), Irr (Irrigation), Live (Livestock) -REC (Recreation)USEPA: United States Environmental Protection Agency (1999) - in AENV 1999.Discharges: Effluents and the weir are mean daily. Others are instantaneous.
DECEMBER 1999
Sample No. Station No.
Water Quality Guideline and Value - most stringent(for the Protection of Aquatic Life (PAL), unless noted):
MARCH 2000
Sample No. Station No.
not increased more than 3 °C above ambient
temperature

Table 1 - Page 2 of 12
Station DescriptionSample
Date pH Field pH Lab
Specific Cond. Field
Specific Cond. Lab
Dissolved Oxygen
Field meter
Dissolved Oxygen Winkler
True Colour Turbidity
Non Filterable Residue
100923 10301 100924 2041 100922 8101 2024 2074 10401pH units pH units uS/cm uS/cm mg/L mg/L Rel Units NTU mg/L
LSR below Weir, near Outflow from Lesser Slave Lake-LB 13-Dec-99 7.4 8.1 211 220 14.4 13.74 5 1.6 2LSR below Weir, near Outflow from Lesser Slave Lake-LB 13-Dec-99Sawridge Ck. at Hwy 88 Bridge u/s of Slave Lake STP Effl. 13-Dec-99 7.2 7.1 151 159 8.7 8.25 70 19.1 4Slave Lake STP Final Effl. 13-Dec-99 7.6 787 45 10.6 10Slave Lake STP Final Effl. 13-Dec-99LSR at Mitsue Bridge 14-Dec-99 7.7 7.8 216 227 13.0 12.64 3LSR at Mitsue Bridge 14-Dec-99LSR at Mitsue Bridge 15-Dec-99 7.3 215 13.0 12.44Slave Lake Pulp Mill Final Effl. 14-Dec-99 8.2 8.4 5630 5550 6.6 2200 20 45Slave Lake Pulp Mill Final Effl. 14-Dec-99LSR u/s of Otauwau R. 14-Dec-99 7.8 8.0 372 380 12.2 90 3.5 4LSR u/s of Otauwau R. 14-Dec-99Otauwau R. above Confl. LSR 14-Dec-99 7.6 7.3 299 307 6.9 82 9.2 2Otauwau R. above Confl. LSR 14-Dec-99Saulteaux R. above Confl. LSR 15-Dec-99 6.7 7.4 368 404 5.4 4.97 55 7.8 L1Saulteaux R. above Confl. LSR 15-Dec-99LSR 0.5 km u/s Confl. Driftwood R. 15-Dec-99 7.6 350 10.4 3LSR 0.5 km u/s Confl. Driftwood R. 15-Dec-99Driftwood R. above confl. LSR 15-Dec-99 7.4 7.7 462 488 9.1 8.62 49 8.8 4Driftwood R. above confl. LSR 15-Dec-99LSR 11.5 km u/s Athabasca R. Confl. 16-Dec-99 7.4 7.8 383 401 9.7 85 2.1 2LSR 11.5 km u/s Athabasca R. Confl.(BOD REPL.) 16-Dec-99LSR 11.5 km u/s Athabasca R. Confl.(TRUE SPLIT #2) 16-Dec-99 7.8 401 85 2.2 2LSR 11.5 km u/s Athabasca R. Confl.(TRUE SPLIT #3) 16-Dec-99 7.8 401 85 2.2 3LSR near Confluence with Athabasca R 20-Dec-99 7.2 414 8.0LSR near Confluence with Athabasca R 20-Dec-99Field Blank 16-Dec-99 5.7 1.1 L1 L0.01 L1
AWQG CEQG AWQG
Sample Date pH Field pH Lab
Specific Cond. Field
Dissolved Oxygen
Field meter
Dissolved Oxygen Winkler
True Colour Turbidity
Non Filterable Residue
100923 10301 100924 100922 8101 2024 2074 10401pH units pH units uS/cm mg/L mg/L Rel Units NTU mg/L
LSR below Weir, near Outflow from Lesser Slave Lake-LB 06-Mar-00 7.9 7.9 225 13.4 13.3 10 0.6 L1LSR below Weir, near Outflow from Lesser Slave Lake-LB 06-Mar-00Sawridge Ck. at Hwy 88 Bridge u/s of Slave Lake STP Effl. 06-Mar-00 7.6 7.2 126 9.9 9.72 54 16.7 3Slave Lake STP Final Effl. 06-Mar-00 7.5 7.6 891 7.6 52 7 11Slave Lake STP Final Effl. 06-Mar-00LSR at Mitsue Bridge 07-Mar-00 7.7 224 12.5 12.5 4LSR at Mitsue Bridge 07-Mar-00Slave Lake Pulp Mill Final Effl. 07-Mar-00 8.3 8.1 3100 6.9 1840 21 94Slave Lake Pulp Mill Final Effl. 07-Mar-00LSR u/s of Otauwau R. 07-Mar-00 7.9 7.9 335 11.7 11.14 69 2.7 3LSR u/s of Otauwau R. 07-Mar-00Otauwau R. above Confl. LSR 07-Mar-00 7.3 7.3 269 5.5 5.19 43 12 L1Otauwau R. above Confl. LSR 07-Mar-00Saulteaux R. above Confl. LSR 08-Mar-00 6.7 7.3 582 2.7 1.88 24 2.6 1Saulteaux R. above Confl. LSR 08-Mar-00LSR 0.5 km u/s Confl. Driftwood R. 08-Mar-00 7.4 338 9.9 9.27 1LSR 0.5 km u/s Confl. Driftwood R. 08-Mar-00Driftwood R. above confl. LSR 08-Mar-00 7.2 7.6 306 9.2 36 5.3 2Driftwood R. above confl. LSR 08-Mar-00LSR 11.5 km u/s Athabasca R. Confl. 09-Mar-00 7.5 7.6 335 9.2 8.35 65 2.1 1LSR 11.5 km u/s Athabasca R. Confl. 09-Mar-00LSR near Confluence with Athabasca R 09-Mar-00 7.5 334 8.4 7.49LSR near Confluence with Athabasca R 09-Mar-00Field Blank 09-Mar-00 5.5 L1 0.06 L1Field Blank 09-Mar-00
AWQG AWQGnot
increased more than 10 mg/L
6.5-8.5 flow, background
level dependent
not increased more than 30 TCU
5.0 (1-day min.)6.5 (7-day mean)
Water Quality Guideline and Value - most stringent(for the Protection of Aquatic Life (PAL), unless noted):

Table 1 - Page 3 of 12
Station DescriptionSample
DateTotal
ResidueTDS-calc. TDS
PP Alkalinity
Total Alkalinity
Total Hardness
Sodium, diss.
Potassium, diss. Calcium, tot.
Calcium, ext.
10471 205 207 10151 10101 10602 102085 102086 101894 101838mg/L mg/L mg/L mg/L mg/L mg/L mg/L mg/L mg/L mg/L
LSR below Weir, near Outflow from Lesser Slave Lake-LB 13-Dec-99 162 123 160 L1 104 95 9.5 3 28.4 27.6LSR below Weir, near Outflow from Lesser Slave Lake-LB 13-Dec-99Sawridge Ck. at Hwy 88 Bridge u/s of Slave Lake STP Effl. 13-Dec-99 126 86.7 122 L1 79 58 11 1.6 16.8 17.1Slave Lake STP Final Effl. 13-Dec-99 474 434 464 L1 272 130 75.8 11.9 37.2 37.3Slave Lake STP Final Effl. 13-Dec-99LSR at Mitsue Bridge 14-Dec-99 156 136 153 L1 107 92 16.2 3.4 28.6 27.3LSR at Mitsue Bridge 14-Dec-99LSR at Mitsue Bridge 15-Dec-99Slave Lake Pulp Mill Final Effl. 14-Dec-99 5330 3850 5280 30 2660 172 1370 58.9 49 46.6Slave Lake Pulp Mill Final Effl. 14-Dec-99LSR u/s of Otauwau R. 14-Dec-99 286 225 282 L1 172 96 49.4 4.7 29.3 28.2LSR u/s of Otauwau R. 14-Dec-99Otauwau R. above Confl. LSR 14-Dec-99 222 170 220 L1 156 139 12.8 1.8 40.3 39.9Otauwau R. above Confl. LSR 14-Dec-99Saulteaux R. above Confl. LSR 15-Dec-99 266 220 265 L1 218 175 15.8 2.6 53.1 51.2Saulteaux R. above Confl. LSR 15-Dec-99LSR 0.5 km u/s Confl. Driftwood R. 15-Dec-99 284 282LSR 0.5 km u/s Confl. Driftwood R. 15-Dec-99Driftwood R. above confl. LSR 15-Dec-99 334 268 330 L1 246 208 20.1 3 61.7 58.8Driftwood R. above confl. LSR 15-Dec-99LSR 11.5 km u/s Athabasca R. Confl. 16-Dec-99 284 228 282 L1 178 98 46.8 4.7 31.1 29.3LSR 11.5 km u/s Athabasca R. Confl.(BOD REPL.) 16-Dec-99LSR 11.5 km u/s Athabasca R. Confl.(TRUE SPLIT #2) 16-Dec-99 284 228 282 L1 177 98 47.2 4.7 30.8 29.2LSR 11.5 km u/s Athabasca R. Confl.(TRUE SPLIT #3) 16-Dec-99 284 227 282 L1 178 98 47.9 4.7 30.6 29.3LSR near Confluence with Athabasca R 20-Dec-99LSR near Confluence with Athabasca R 20-Dec-99Field Blank 16-Dec-99 2 5.2 2 L1 2 L1 1.4 L0.1 L0.01 L0.01
USEPA
1000 mg/L
Sample Date
Total Residue
TDS-calc. TDS
PP Alkalinity
Total Alkalinity
Total Hardness
Sodium, diss.
Potassium, diss. Calcium, tot.
Calcium, ext.
10471 100536 207 10151 10101 10602 102085 102086 101894 101838mg/L mg/L mg/L mg/L mg/L mg/L mg/L mg/L mg/L mg/L
LSR below Weir, near Outflow from Lesser Slave Lake-LB 06-Mar-00 158 130 158 L1 107 101 11 3.2 29.2 29.4LSR below Weir, near Outflow from Lesser Slave Lake-LB 06-Mar-00Sawridge Ck. at Hwy 88 Bridge u/s of Slave Lake STP Effl. 06-Mar-00 122 88 119 L1 62 43 17.6 1.7 13.1 12.5Slave Lake STP Final Effl. 06-Mar-00 568 499 557 L1 286 143 100 13 39 40.9Slave Lake STP Final Effl. 06-Mar-00LSR at Mitsue Bridge 07-Mar-00 29.7LSR at Mitsue Bridge 07-Mar-00Slave Lake Pulp Mill Final Effl. 07-Mar-00 2880 2150 2780 L1 1560 198 749 45.4 54.3 54.6Slave Lake Pulp Mill Final Effl. 07-Mar-00LSR u/s of Otauwau R. 07-Mar-00 254 207 251 L1 158 102 42 4.9 29.4 29.9LSR u/s of Otauwau R. 07-Mar-00Otauwau R. above Confl. LSR 07-Mar-00 198 156 197 L1 143 117 14.1 1.7 34.9 34Otauwau R. above Confl. LSR 07-Mar-00Saulteaux R. above Confl. LSR 08-Mar-00 406 323 405 L1 335 270 18.9 3.2 78 78Saulteaux R. above Confl. LSR 08-Mar-00LSR 0.5 km u/s Confl. Driftwood R. 08-Mar-00LSR 0.5 km u/s Confl. Driftwood R. 08-Mar-00Driftwood R. above confl. LSR 08-Mar-00 252 174 250 L1 154 142 11.6 3.2 40.3 40Driftwood R. above confl. LSR 08-Mar-00LSR 11.5 km u/s Athabasca R. Confl. 09-Mar-00 250 199 249 L1 159 106 35.2 4.6 30.8 31.1LSR 11.5 km u/s Athabasca R. Confl. 09-Mar-00LSR near Confluence with Athabasca R 09-Mar-00LSR near Confluence with Athabasca R 09-Mar-00Field Blank 09-Mar-00 L1 6.2 L1 L1 2 L1 1.9 L0.1 L0.01 L0.01Field Blank 09-Mar-00
Water Quality Guideline and Value - most stringent(for the Protection of Aquatic Life (PAL), unless noted):
20 mg/L minimum
CEQG-AGR(Irr)
500-3500 mg/L
CEQG-AGR(Live)

Table 1 - Page 4 of 12
Station DescriptionSample
DateMagnesium, ext.
Bicarbonate
Carbonate
Chloride, diss.
Sulphate, diss.
Fluoride, diss.
Reactive Silica
Sulphide, diss.
Nitrogen NO2+NO3,
diss
101847 6201 6301 102087 16306 9107 102616 101484 7105mg/L mg/L mg/L mg/L mg/L mg/L mg/L mg/L mg/L
LSR below Weir, near Outflow from Lesser Slave Lake-LB 13-Dec-99 6.34 127 2.1 11 0.11 0.4 L0.001 0.015LSR below Weir, near Outflow from Lesser Slave Lake-LB 13-Dec-99Sawridge Ck. at Hwy 88 Bridge u/s of Slave Lake STP Effl. 13-Dec-99 3.78 96 2.4 3 0.09 16.2 L0.001 0.025Slave Lake STP Final Effl. 13-Dec-99 9.08 332 65.2 35 0.87 14.7 0.005 0.497Slave Lake STP Final Effl. 13-Dec-99LSR at Mitsue Bridge 14-Dec-99 5.84 131 5.2 14 0.12 L0.1 0.035LSR at Mitsue Bridge 14-Dec-99LSR at Mitsue Bridge 15-Dec-99 L0.001Slave Lake Pulp Mill Final Effl. 14-Dec-99 13.5 3170 36 56.1 710 0.5 72 0.042 0.098Slave Lake Pulp Mill Final Effl. 14-Dec-99LSR u/s of Otauwau R. 14-Dec-99 6.12 209 3.1 30 0.13 3.1 0.001 0.045LSR u/s of Otauwau R. 14-Dec-99Otauwau R. above Confl. LSR 14-Dec-99 9.5 191 2.8 10 0.12 17 L0.001 0.02Otauwau R. above Confl. LSR 14-Dec-99Saulteaux R. above Confl. LSR 15-Dec-99 11.3 265 2.6 5 0.13 10 L0.001 L0.005Saulteaux R. above Confl. LSR 15-Dec-99LSR 0.5 km u/s Confl. Driftwood R. 15-Dec-99 0.001LSR 0.5 km u/s Confl. Driftwood R. 15-Dec-99Driftwood R. above confl. LSR 15-Dec-99 14.8 300 1.4 22 0.16 7.2 L0.001 L0.005Driftwood R. above confl. LSR 15-Dec-99LSR 11.5 km u/s Athabasca R. Confl. 16-Dec-99 6.08 217 2.8 31 0.12 3.7 0.001 0.113LSR 11.5 km u/s Athabasca R. Confl.(BOD REPL.) 16-Dec-99LSR 11.5 km u/s Athabasca R. Confl.(TRUE SPLIT #2) 16-Dec-99 6.09 216 3.7 30 0.12 3.8 0.001 0.115LSR 11.5 km u/s Athabasca R. Confl.(TRUE SPLIT #3) 16-Dec-99 6.13 217 2.8 29 0.13 3.7 0.001 0.116LSR near Confluence with Athabasca R 20-Dec-99LSR near Confluence with Athabasca R 20-Dec-99Field Blank 16-Dec-99 L0.003 3 0.4 L3 L0.01 L0.1 L0.001 L0.005
USEPA
0.002 mg/L100-700 mg/L 1000 mg/L 1-2 mg/L
Sample Date
Magnesium, ext.
Bicarbonate
Carbonate
Chloride, diss.
Sulphate, diss.
Fluoride, diss.
Reactive Silica
Sulphide, diss.
Nitrogen NO2+NO3,
diss
101847 6201 6301 102087 16306 9107 102616 101484 7105mg/L mg/L mg/L mg/L mg/L mg/L mg/L mg/L mg/L
LSR below Weir, near Outflow from Lesser Slave Lake-LB 06-Mar-00 6.7 130 2.2 13 0.11 0.6 L0.001 0.042LSR below Weir, near Outflow from Lesser Slave Lake-LB 06-Mar-00Sawridge Ck. at Hwy 88 Bridge u/s of Slave Lake STP Effl. 06-Mar-00 2.72 76 13.7 L3 0.07 15.8 L0.001 0.083Slave Lake STP Final Effl. 06-Mar-00 9.98 349 87.1 39 0.9 11.9 0.005 0.044Slave Lake STP Final Effl. 06-Mar-00LSR at Mitsue Bridge 07-Mar-00 L0.001LSR at Mitsue Bridge 07-Mar-00Slave Lake Pulp Mill Final Effl. 07-Mar-00 15 1910 32.3 318 0.5 59.4 0.042 0.086Slave Lake Pulp Mill Final Effl. 07-Mar-00LSR u/s of Otauwau R. 07-Mar-00 6.73 192 3.7 24 0.13 3.3 0.001 0.083LSR u/s of Otauwau R. 07-Mar-00Otauwau R. above Confl. LSR 07-Mar-00 7.87 174 6 6 0.1 17.2 L0.001 0.177Otauwau R. above Confl. LSR 07-Mar-00Saulteaux R. above Confl. LSR 08-Mar-00 18.2 408 1.7 L3 0.15 20.5 L0.001 0.028Saulteaux R. above Confl. LSR 08-Mar-00LSR 0.5 km u/s Confl. Driftwood R. 08-Mar-00 0.001LSR 0.5 km u/s Confl. Driftwood R. 08-Mar-00Driftwood R. above confl. LSR 08-Mar-00 10.2 188 1.7 12 0.13 13.6 L0.001 0.43Driftwood R. above confl. LSR 08-Mar-00LSR 11.5 km u/s Athabasca R. Confl. 09-Mar-00 7 194 3.3 21 0.12 4.2 0.001 0.209LSR 11.5 km u/s Athabasca R. Confl. 09-Mar-00LSR near Confluence with Athabasca R 09-Mar-00LSR near Confluence with Athabasca R 09-Mar-00Field Blank 09-Mar-00 0.005 2 0.9 L3 L0.01 0.3 L0.001 L0.005Field Blank 09-Mar-00
Water Quality Guideline and Value - most stringent(for the Protection of Aquatic Life (PAL), unless noted):
CEQG-AGR
CEQG-AGR(Irr)
CEQG-AGR(Live)
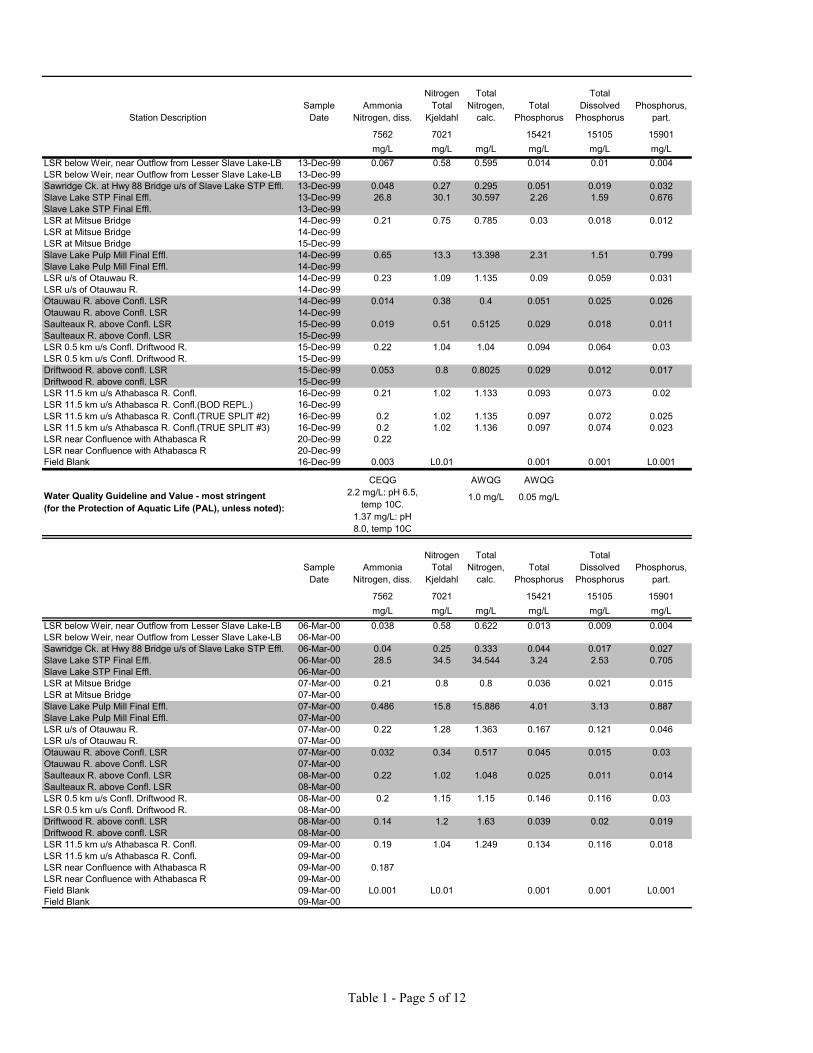
Table 1 - Page 5 of 12
Station DescriptionSample
DateAmmonia
Nitrogen, diss.
Nitrogen Total
Kjeldahl
TotalNitrogen,
calc.Total
Phosphorus
TotalDissolved
PhosphorusPhosphorus,
part.
7562 7021 15421 15105 15901mg/L mg/L mg/L mg/L mg/L mg/L
LSR below Weir, near Outflow from Lesser Slave Lake-LB 13-Dec-99 0.067 0.58 0.595 0.014 0.01 0.004LSR below Weir, near Outflow from Lesser Slave Lake-LB 13-Dec-99Sawridge Ck. at Hwy 88 Bridge u/s of Slave Lake STP Effl. 13-Dec-99 0.048 0.27 0.295 0.051 0.019 0.032Slave Lake STP Final Effl. 13-Dec-99 26.8 30.1 30.597 2.26 1.59 0.676Slave Lake STP Final Effl. 13-Dec-99LSR at Mitsue Bridge 14-Dec-99 0.21 0.75 0.785 0.03 0.018 0.012LSR at Mitsue Bridge 14-Dec-99LSR at Mitsue Bridge 15-Dec-99Slave Lake Pulp Mill Final Effl. 14-Dec-99 0.65 13.3 13.398 2.31 1.51 0.799Slave Lake Pulp Mill Final Effl. 14-Dec-99LSR u/s of Otauwau R. 14-Dec-99 0.23 1.09 1.135 0.09 0.059 0.031LSR u/s of Otauwau R. 14-Dec-99Otauwau R. above Confl. LSR 14-Dec-99 0.014 0.38 0.4 0.051 0.025 0.026Otauwau R. above Confl. LSR 14-Dec-99Saulteaux R. above Confl. LSR 15-Dec-99 0.019 0.51 0.5125 0.029 0.018 0.011Saulteaux R. above Confl. LSR 15-Dec-99LSR 0.5 km u/s Confl. Driftwood R. 15-Dec-99 0.22 1.04 1.04 0.094 0.064 0.03LSR 0.5 km u/s Confl. Driftwood R. 15-Dec-99Driftwood R. above confl. LSR 15-Dec-99 0.053 0.8 0.8025 0.029 0.012 0.017Driftwood R. above confl. LSR 15-Dec-99LSR 11.5 km u/s Athabasca R. Confl. 16-Dec-99 0.21 1.02 1.133 0.093 0.073 0.02LSR 11.5 km u/s Athabasca R. Confl.(BOD REPL.) 16-Dec-99LSR 11.5 km u/s Athabasca R. Confl.(TRUE SPLIT #2) 16-Dec-99 0.2 1.02 1.135 0.097 0.072 0.025LSR 11.5 km u/s Athabasca R. Confl.(TRUE SPLIT #3) 16-Dec-99 0.2 1.02 1.136 0.097 0.074 0.023LSR near Confluence with Athabasca R 20-Dec-99 0.22LSR near Confluence with Athabasca R 20-Dec-99Field Blank 16-Dec-99 0.003 L0.01 0.001 0.001 L0.001
CEQG AWQG AWQG
1.0 mg/L 0.05 mg/L
Sample Date
Ammonia Nitrogen, diss.
Nitrogen Total
Kjeldahl
Total Nitrogen,
calc.Total
Phosphorus
Total Dissolved
PhosphorusPhosphorus,
part.
7562 7021 15421 15105 15901mg/L mg/L mg/L mg/L mg/L mg/L
LSR below Weir, near Outflow from Lesser Slave Lake-LB 06-Mar-00 0.038 0.58 0.622 0.013 0.009 0.004LSR below Weir, near Outflow from Lesser Slave Lake-LB 06-Mar-00Sawridge Ck. at Hwy 88 Bridge u/s of Slave Lake STP Effl. 06-Mar-00 0.04 0.25 0.333 0.044 0.017 0.027Slave Lake STP Final Effl. 06-Mar-00 28.5 34.5 34.544 3.24 2.53 0.705Slave Lake STP Final Effl. 06-Mar-00LSR at Mitsue Bridge 07-Mar-00 0.21 0.8 0.8 0.036 0.021 0.015LSR at Mitsue Bridge 07-Mar-00Slave Lake Pulp Mill Final Effl. 07-Mar-00 0.486 15.8 15.886 4.01 3.13 0.887Slave Lake Pulp Mill Final Effl. 07-Mar-00LSR u/s of Otauwau R. 07-Mar-00 0.22 1.28 1.363 0.167 0.121 0.046LSR u/s of Otauwau R. 07-Mar-00Otauwau R. above Confl. LSR 07-Mar-00 0.032 0.34 0.517 0.045 0.015 0.03Otauwau R. above Confl. LSR 07-Mar-00Saulteaux R. above Confl. LSR 08-Mar-00 0.22 1.02 1.048 0.025 0.011 0.014Saulteaux R. above Confl. LSR 08-Mar-00LSR 0.5 km u/s Confl. Driftwood R. 08-Mar-00 0.2 1.15 1.15 0.146 0.116 0.03LSR 0.5 km u/s Confl. Driftwood R. 08-Mar-00Driftwood R. above confl. LSR 08-Mar-00 0.14 1.2 1.63 0.039 0.02 0.019Driftwood R. above confl. LSR 08-Mar-00LSR 11.5 km u/s Athabasca R. Confl. 09-Mar-00 0.19 1.04 1.249 0.134 0.116 0.018LSR 11.5 km u/s Athabasca R. Confl. 09-Mar-00LSR near Confluence with Athabasca R 09-Mar-00 0.187LSR near Confluence with Athabasca R 09-Mar-00Field Blank 09-Mar-00 L0.001 L0.01 0.001 0.001 L0.001Field Blank 09-Mar-00
Water Quality Guideline and Value - most stringent(for the Protection of Aquatic Life (PAL), unless noted):
2.2 mg/L: pH 6.5, temp 10C.
1.37 mg/L: pH 8.0, temp 10C

Table 1 - Page 6 of 12
Station DescriptionSample
DateAluminum,
tot.Antimony,
tot.Arsenic,
tot.Barium,
tot.Beryllium,
tot.Bismuth,
tot. Boron, tot.
101888 101914 101889,101939 101891 101892 101893 101925ug/L ug/L ug/L ug/L ug/L ug/L ug/L
LSR below Weir, near Outflow from Lesser Slave Lake-LB 13-Dec-99 96.5 0.1 0.88 61.4 0.04 L0.005 25.3LSR below Weir, near Outflow from Lesser Slave Lake-LB 13-Dec-99Sawridge Ck. at Hwy 88 Bridge u/s of Slave Lake STP Effl. 13-Dec-99 102 0.057 0.6 94 0.04 L0.005 26.2Slave Lake STP Final Effl. 13-Dec-99 63.8 0.4 2.46 18.1 L0.04 0.064 197Slave Lake STP Final Effl. 13-Dec-99LSR at Mitsue Bridge 14-Dec-99 121 0.103 0.99 62.4 L0.04 L0.005 20.7LSR at Mitsue Bridge 14-Dec-99LSR at Mitsue Bridge 15-Dec-99Slave Lake Pulp Mill Final Effl. 14-Dec-99 87 0.57 0.8 542 0.24 0.006 2742Slave Lake Pulp Mill Final Effl. 14-Dec-99LSR u/s of Otauwau R. 14-Dec-99 126 0.125 0.89 74.6 L0.04 L0.005 99LSR u/s of Otauwau R. 14-Dec-99Otauwau R. above Confl. LSR 14-Dec-99 104 0.081 1.1 117 L0.04 L0.005 34.1Otauwau R. above Confl. LSR 14-Dec-99Saulteaux R. above Confl. LSR 15-Dec-99 41 0.079 0.99 113 L0.04 L0.005 37.7Saulteaux R. above Confl. LSR 15-Dec-99LSR 0.5 km u/s Confl. Driftwood R. 15-Dec-99LSR 0.5 km u/s Confl. Driftwood R. 15-Dec-99Driftwood R. above confl. LSR 15-Dec-99 142 0.09 1.08 111 L0.04 L0.005 51Driftwood R. above confl. LSR 15-Dec-99LSR 11.5 km u/s Athabasca R. Confl. 16-Dec-99 49.1 0.121 1.27 78.5 L0.04 L0.005 111LSR 11.5 km u/s Athabasca R. Confl.(BOD REPL.) 16-Dec-99LSR 11.5 km u/s Athabasca R. Confl.(TRUE SPLIT #2) 16-Dec-99 55 0.12 1.28 78.1 L0.04 L0.005 113LSR 11.5 km u/s Athabasca R. Confl.(TRUE SPLIT #3) 16-Dec-99 48.2 0.116 1.32 77.8 L0.04 L0.005 112LSR near Confluence with Athabasca R 20-Dec-99LSR near Confluence with Athabasca R 20-Dec-99Field Blank 16-Dec-99 1.24 L0.004 L0.02 L0.1 L0.04 L0.005 L0.08
USEPA CEQG CEQG-AGR CEQG-AGR(Irr)87 ug/L 5 ug/L 100 ug/L 500 ug/L
Sample Date
Aluminum, tot.
Antimony, tot.
Arsenic,tot.
Barium, tot.
Beryllium, tot.
Bismuth, tot. Boron, tot.
101888 101914 101889,101939 101891 101892 101893 101925ug/L ug/L ug/L ug/L ug/L ug/L ug/L
LSR below Weir, near Outflow from Lesser Slave Lake-LB 06-Mar-00 11.9 0.098 1.05 61 L0.04 0.032 23.2LSR below Weir, near Outflow from Lesser Slave Lake-LB 06-Mar-00Sawridge Ck. at Hwy 88 Bridge u/s of Slave Lake STP Effl. 06-Mar-00 138 0.055 0.65 67.5 L0.04 L0.005 25Slave Lake STP Final Effl. 06-Mar-00 59 0.507 2.4 14.8 0.04 0.034 200Slave Lake STP Final Effl. 06-Mar-00LSR at Mitsue Bridge 07-Mar-00 149 0.11 1.01 64.3 L0.04 L0.005 30LSR at Mitsue Bridge 07-Mar-00Slave Lake Pulp Mill Final Effl. 07-Mar-00 93 0.52 0.87 432 0.14 L0.005 2625Slave Lake Pulp Mill Final Effl. 07-Mar-00LSR u/s of Otauwau R. 07-Mar-00 82.4 0.133 1.06 75.4 L0.04 L0.005 112LSR u/s of Otauwau R. 07-Mar-00Otauwau R. above Confl. LSR 07-Mar-00 86 0.067 0.82 95.1 L0.04 0.01 40Otauwau R. above Confl. LSR 07-Mar-00Saulteaux R. above Confl. LSR 08-Mar-00 33.2 0.072 0.74 126 L0.04 0.006 35.2Saulteaux R. above Confl. LSR 08-Mar-00LSR 0.5 km u/s Confl. Driftwood R. 08-Mar-00LSR 0.5 km u/s Confl. Driftwood R. 08-Mar-00Driftwood R. above confl. LSR 08-Mar-00 123 0.076 1.01 86.6 L0.04 0.008 46Driftwood R. above confl. LSR 08-Mar-00LSR 11.5 km u/s Athabasca R. Confl. 09-Mar-00 18.2 0.115 1.34 76.2 L0.04 L0.005 107LSR 11.5 km u/s Athabasca R. Confl. 09-Mar-00LSR near Confluence with Athabasca R 09-Mar-00LSR near Confluence with Athabasca R 09-Mar-00Field Blank 09-Mar-00 L1 L0.004 L0.02 L0.1 L0.04 L0.005 0.1Field Blank 09-Mar-00
for prevailing pH
Water Quality Guideline and Value - most stringent(for the Protection of Aquatic Life (PAL), unless noted):

Table 1 - Page 7 of 12
Station DescriptionSample
Date Cadmium, tot. Chromium, tot. Cobalt, tot.Copper,
tot. Iron, tot. Iron, diss. Iron, ext. Lead, tot.
101895 101898,101926 101937 101899 101936 101827 102082 101912ug/L ug/L ug/L ug/L ug/L ug/L mg/L ug/L
LSR below Weir, near Outflow from Lesser Slave Lake-LB 13-Dec-99 0.044 0.24 0.05 1.68 111 29 0.099 2.68LSR below Weir, near Outflow from Lesser Slave Lake-LB 13-Dec-99Sawridge Ck. at Hwy 88 Bridge u/s of Slave Lake STP Effl. 13-Dec-99 0.119 0.12 0.82 1.15 2898 553 2.96 2.19Slave Lake STP Final Effl. 13-Dec-99 0.068 0.55 1.03 5.04 1029 126 1.03 1.84Slave Lake STP Final Effl. 13-Dec-99LSR at Mitsue Bridge 14-Dec-99 L0.02 0.21 0.13 1.18 231 50 0.185 0.195LSR at Mitsue Bridge 14-Dec-99LSR at Mitsue Bridge 15-Dec-99Slave Lake Pulp Mill Final Effl. 14-Dec-99 23.6 45.5 3.46 16.7 347 283 0.3 1.13Slave Lake Pulp Mill Final Effl. 14-Dec-99LSR u/s of Otauwau R. 14-Dec-99 0.65 1.77 0.23 1.76 253 67 0.22 4.28LSR u/s of Otauwau R. 14-Dec-99Otauwau R. above Confl. LSR 14-Dec-99 0.028 0.26 0.217 1.49 2763 642 2.64 0.259Otauwau R. above Confl. LSR 14-Dec-99Saulteaux R. above Confl. LSR 15-Dec-99 L0.02 0.2 0.14 1.39 1543 1035 1.49 0.163Saulteaux R. above Confl. LSR 15-Dec-99LSR 0.5 km u/s Confl. Driftwood R. 15-Dec-99LSR 0.5 km u/s Confl. Driftwood R. 15-Dec-99Driftwood R. above confl. LSR 15-Dec-99 0.042 0.42 0.23 1.37 971 249 0.915 0.288Driftwood R. above confl. LSR 15-Dec-99LSR 11.5 km u/s Athabasca R. Confl. 16-Dec-99 0.608 1.38 0.32 1.63 287 149 0.284 0.129LSR 11.5 km u/s Athabasca R. Confl.(BOD REPL.) 16-Dec-99LSR 11.5 km u/s Athabasca R. Confl.(TRUE SPLIT #2) 16-Dec-99 0.656 1.34 0.33 1.7 288 149 0.278 0.146LSR 11.5 km u/s Athabasca R. Confl.(TRUE SPLIT #3) 16-Dec-99 0.62 1.29 0.34 1.78 284 145 0.277 0.134LSR near Confluence with Athabasca R 20-Dec-99LSR near Confluence with Athabasca R 20-Dec-99Field Blank 16-Dec-99 L0.02 L0.08 L0.02 0.09 L3 L3 L0.003 L0.01
CEQG CEQG AWQG CEQG CEQG.033 ug/L 1.0 ug/L 7 ug/L 300 ug/L 2 ug/L
(Cr VI) 50 ug/L
Sample Date Cadmium, tot. Chromium, tot. Cobalt, tot.
Copper, tot. Iron, tot. Iron, diss. Lead, tot.
101895 101898,101926 101937 101899 101936 101827 101912ug/L ug/L ug/L ug/L ug/L ug/L ug/L
LSR below Weir, near Outflow from Lesser Slave Lake-LB 06-Mar-00 L0.02 0.09 0.044 0.9 59 22 0.048LSR below Weir, near Outflow from Lesser Slave Lake-LB 06-Mar-00Sawridge Ck. at Hwy 88 Bridge u/s of Slave Lake STP Effl. 06-Mar-00 L0.02 0.31 0.504 0.98 2020 560 2.69Slave Lake STP Final Effl. 06-Mar-00 0.17 0.61 0.93 6.3 1198 378 1.87Slave Lake STP Final Effl. 06-Mar-00LSR at Mitsue Bridge 07-Mar-00 L0.02 0.32 0.12 1.07 246 47 0.118LSR at Mitsue Bridge 07-Mar-00Slave Lake Pulp Mill Final Effl. 07-Mar-00 15.8 37.5 3.03 11.9 229 194 0.935Slave Lake Pulp Mill Final Effl. 07-Mar-00LSR u/s of Otauwau R. 07-Mar-00 0.52 1.56 0.263 1.5 198 63 0.473LSR u/s of Otauwau R. 07-Mar-00Otauwau R. above Confl. LSR 07-Mar-00 L0.02 0.17 0.12 0.77 1902 332 0.148Otauwau R. above Confl. LSR 07-Mar-00Saulteaux R. above Confl. LSR 08-Mar-00 0.122 1.21 1.42 0.99 285 25 0.65Saulteaux R. above Confl. LSR 08-Mar-00LSR 0.5 km u/s Confl. Driftwood R. 08-Mar-00LSR 0.5 km u/s Confl. Driftwood R. 08-Mar-00Driftwood R. above confl. LSR 08-Mar-00 0.02 0.16 0.12 1.08 490 133 0.1Driftwood R. above confl. LSR 08-Mar-00LSR 11.5 km u/s Athabasca R. Confl. 09-Mar-00 0.51 1.43 0.29 1.58 210 115 14.8LSR 11.5 km u/s Athabasca R. Confl. 09-Mar-00LSR near Confluence with Athabasca R 09-Mar-00LSR near Confluence with Athabasca R 09-Mar-00Field Blank 09-Mar-00 L0.02 0.1 L0.02 L0.08 L3 L3 L0.01Field Blank 09-Mar-00
for prevailing hardness
for prevailing hardness
Water Quality Guideline and Value - most stringent(for the Protection of Aquatic Life (PAL), unless noted):
CEQG-AGR(Irr)
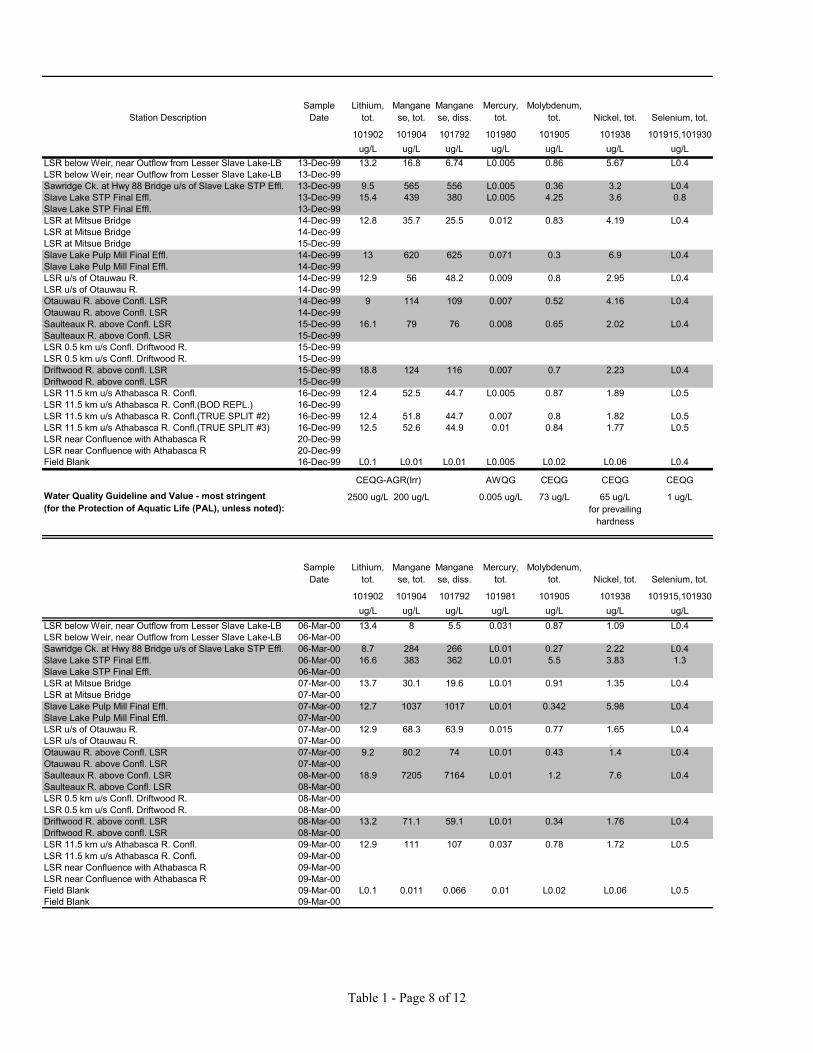
Table 1 - Page 8 of 12
Station DescriptionSample
DateLithium,
tot.Mangane
se, tot.Manganese, diss.
Mercury, tot.
Molybdenum, tot. Nickel, tot. Selenium, tot.
101902 101904 101792 101980 101905 101938 101915,101930ug/L ug/L ug/L ug/L ug/L ug/L ug/L
LSR below Weir, near Outflow from Lesser Slave Lake-LB 13-Dec-99 13.2 16.8 6.74 L0.005 0.86 5.67 L0.4LSR below Weir, near Outflow from Lesser Slave Lake-LB 13-Dec-99Sawridge Ck. at Hwy 88 Bridge u/s of Slave Lake STP Effl. 13-Dec-99 9.5 565 556 L0.005 0.36 3.2 L0.4Slave Lake STP Final Effl. 13-Dec-99 15.4 439 380 L0.005 4.25 3.6 0.8Slave Lake STP Final Effl. 13-Dec-99LSR at Mitsue Bridge 14-Dec-99 12.8 35.7 25.5 0.012 0.83 4.19 L0.4LSR at Mitsue Bridge 14-Dec-99LSR at Mitsue Bridge 15-Dec-99Slave Lake Pulp Mill Final Effl. 14-Dec-99 13 620 625 0.071 0.3 6.9 L0.4Slave Lake Pulp Mill Final Effl. 14-Dec-99LSR u/s of Otauwau R. 14-Dec-99 12.9 56 48.2 0.009 0.8 2.95 L0.4LSR u/s of Otauwau R. 14-Dec-99Otauwau R. above Confl. LSR 14-Dec-99 9 114 109 0.007 0.52 4.16 L0.4Otauwau R. above Confl. LSR 14-Dec-99Saulteaux R. above Confl. LSR 15-Dec-99 16.1 79 76 0.008 0.65 2.02 L0.4Saulteaux R. above Confl. LSR 15-Dec-99LSR 0.5 km u/s Confl. Driftwood R. 15-Dec-99LSR 0.5 km u/s Confl. Driftwood R. 15-Dec-99Driftwood R. above confl. LSR 15-Dec-99 18.8 124 116 0.007 0.7 2.23 L0.4Driftwood R. above confl. LSR 15-Dec-99LSR 11.5 km u/s Athabasca R. Confl. 16-Dec-99 12.4 52.5 44.7 L0.005 0.87 1.89 L0.5LSR 11.5 km u/s Athabasca R. Confl.(BOD REPL.) 16-Dec-99LSR 11.5 km u/s Athabasca R. Confl.(TRUE SPLIT #2) 16-Dec-99 12.4 51.8 44.7 0.007 0.8 1.82 L0.5LSR 11.5 km u/s Athabasca R. Confl.(TRUE SPLIT #3) 16-Dec-99 12.5 52.6 44.9 0.01 0.84 1.77 L0.5LSR near Confluence with Athabasca R 20-Dec-99LSR near Confluence with Athabasca R 20-Dec-99Field Blank 16-Dec-99 L0.1 L0.01 L0.01 L0.005 L0.02 L0.06 L0.4
AWQG CEQG CEQG CEQG
2500 ug/L 200 ug/L 0.005 ug/L 73 ug/L 65 ug/L 1 ug/L
Sample Date
Lithium, tot.
Manganese, tot.
Manganese, diss.
Mercury, tot.
Molybdenum, tot. Nickel, tot. Selenium, tot.
101902 101904 101792 101981 101905 101938 101915,101930ug/L ug/L ug/L ug/L ug/L ug/L ug/L
LSR below Weir, near Outflow from Lesser Slave Lake-LB 06-Mar-00 13.4 8 5.5 0.031 0.87 1.09 L0.4LSR below Weir, near Outflow from Lesser Slave Lake-LB 06-Mar-00Sawridge Ck. at Hwy 88 Bridge u/s of Slave Lake STP Effl. 06-Mar-00 8.7 284 266 L0.01 0.27 2.22 L0.4Slave Lake STP Final Effl. 06-Mar-00 16.6 383 362 L0.01 5.5 3.83 1.3Slave Lake STP Final Effl. 06-Mar-00LSR at Mitsue Bridge 07-Mar-00 13.7 30.1 19.6 L0.01 0.91 1.35 L0.4LSR at Mitsue Bridge 07-Mar-00Slave Lake Pulp Mill Final Effl. 07-Mar-00 12.7 1037 1017 L0.01 0.342 5.98 L0.4Slave Lake Pulp Mill Final Effl. 07-Mar-00LSR u/s of Otauwau R. 07-Mar-00 12.9 68.3 63.9 0.015 0.77 1.65 L0.4LSR u/s of Otauwau R. 07-Mar-00Otauwau R. above Confl. LSR 07-Mar-00 9.2 80.2 74 L0.01 0.43 1.4 L0.4Otauwau R. above Confl. LSR 07-Mar-00Saulteaux R. above Confl. LSR 08-Mar-00 18.9 7205 7164 L0.01 1.2 7.6 L0.4Saulteaux R. above Confl. LSR 08-Mar-00LSR 0.5 km u/s Confl. Driftwood R. 08-Mar-00LSR 0.5 km u/s Confl. Driftwood R. 08-Mar-00Driftwood R. above confl. LSR 08-Mar-00 13.2 71.1 59.1 L0.01 0.34 1.76 L0.4Driftwood R. above confl. LSR 08-Mar-00LSR 11.5 km u/s Athabasca R. Confl. 09-Mar-00 12.9 111 107 0.037 0.78 1.72 L0.5LSR 11.5 km u/s Athabasca R. Confl. 09-Mar-00LSR near Confluence with Athabasca R 09-Mar-00LSR near Confluence with Athabasca R 09-Mar-00Field Blank 09-Mar-00 L0.1 0.011 0.066 0.01 L0.02 L0.06 L0.5Field Blank 09-Mar-00
for prevailing hardness
CEQG-AGR(Irr)
Water Quality Guideline and Value - most stringent(for the Protection of Aquatic Life (PAL), unless noted):

Table 1 - Page 9 of 12
Station DescriptionSample
DateSilver,
tot. Strontium, tot.Thallium,
tot.Thorium,
tot. Tin, tot.Titanium,
tot.Uranium,
tot. Vanadium, tot.
101887 101918,101931 101921 101919 101917 101920 101922 101923,101935ug/L ug/L ug/L ug/L ug/L ug/L ug/L ug/L
LSR below Weir, near Outflow from Lesser Slave Lake-LB 13-Dec-99 L0.005 125 0.037 0.007 L0.1 1.9 0.243 0.28LSR below Weir, near Outflow from Lesser Slave Lake-LB 13-Dec-99Sawridge Ck. at Hwy 88 Bridge u/s of Slave Lake STP Effl. 13-Dec-99 0.006 120 0.026 0.032 L0.1 4.3 0.135 0.4Slave Lake STP Final Effl. 13-Dec-99 0.083 157 0.035 0.004 L0.1 7.6 0.191 0.5Slave Lake STP Final Effl. 13-Dec-99LSR at Mitsue Bridge 14-Dec-99 0.011 128 0.03 0.016 L0.1 3.1 0.26 0.42LSR at Mitsue Bridge 14-Dec-99LSR at Mitsue Bridge 15-Dec-99Slave Lake Pulp Mill Final Effl. 14-Dec-99 0.048 299 0.035 0.036 8.6 17.3 13.6 72.3Slave Lake Pulp Mill Final Effl. 14-Dec-99LSR u/s of Otauwau R. 14-Dec-99 0.022 131 L0.003 0.014 L0.1 3.8 0.63 2.6LSR u/s of Otauwau R. 14-Dec-99Otauwau R. above Confl. LSR 14-Dec-99 0.022 181 0.0037 0.06 L0.1 4.5 0.44 0.56Otauwau R. above Confl. LSR 14-Dec-99Saulteaux R. above Confl. LSR 15-Dec-99 L0.005 258 0.01 0.019 L0.1 2.4 0.93 0.41Saulteaux R. above Confl. LSR 15-Dec-99LSR 0.5 km u/s Confl. Driftwood R. 15-Dec-99LSR 0.5 km u/s Confl. Driftwood R. 15-Dec-99Driftwood R. above confl. LSR 15-Dec-99 L0.005 364 0.013 0.031 L0.1 6.5 0.78 0.62Driftwood R. above confl. LSR 15-Dec-99LSR 11.5 km u/s Athabasca R. Confl. 16-Dec-99 0.006 141 0.039 0.015 L0.1 2.4 0.66 2.05LSR 11.5 km u/s Athabasca R. Confl.(BOD REPL.) 16-Dec-99LSR 11.5 km u/s Athabasca R. Confl.(TRUE SPLIT #2) 16-Dec-99 L0.005 142 0.029 0.018 L0.1 3.3 0.66 2.05LSR 11.5 km u/s Athabasca R. Confl.(TRUE SPLIT #3) 16-Dec-99 L0.005 141 0.03 0.014 L0.1 2.5 0.685 2.06LSR near Confluence with Athabasca R 20-Dec-99LSR near Confluence with Athabasca R 20-Dec-99Field Blank 16-Dec-99 L0.005 0.008 0.006 L0.003 L0.1 0.3 L0.003 L0.008
CEQG CEQG
0.1 ug/L 0.8 ug/L10 ug/L 100 ug/L
Station DescriptionSample
DateSilver,
tot. Strontium, tot.Thallium,
tot.Thorium,
tot. Tin, tot.Titanium,
tot.Uranium,
tot. Vanadium, tot.
101887 101918,101931 101921 101919 101917 101920 101922 101923,101935ug/L ug/L ug/L ug/L ug/L ug/L ug/L ug/L
LSR below Weir, near Outflow from Lesser Slave Lake-LB 06-Mar-00 0.006 132 0.033 L0.003 L0.1 0.63 0.271 0.14LSR below Weir, near Outflow from Lesser Slave Lake-LB 06-Mar-00Sawridge Ck. at Hwy 88 Bridge u/s of Slave Lake STP Effl. 06-Mar-00 L0.005 90.3 0.093 0.047 L0.1 4.6 0.084 0.48Slave Lake STP Final Effl. 06-Mar-00 0.086 165 0.035 0.008 L0.1 9.5 0.21 0.43Slave Lake STP Final Effl. 06-Mar-00LSR at Mitsue Bridge 07-Mar-00 0.011 132 0.018 0.006 L0.1 3.1 0.254 0.51LSR at Mitsue Bridge 07-Mar-00Slave Lake Pulp Mill Final Effl. 07-Mar-00 0.021 285 0.076 0.007 1.6 16.3 13 64Slave Lake Pulp Mill Final Effl. 07-Mar-00LSR u/s of Otauwau R. 07-Mar-00 L0.005 133 0.029 0.01 L0.1 2.6 0.65 2.5LSR u/s of Otauwau R. 07-Mar-00Otauwau R. above Confl. LSR 07-Mar-00 0.012 163 0.031 0.038 L0.1 3.2 0.309 0.58Otauwau R. above Confl. LSR 07-Mar-00Saulteaux R. above Confl. LSR 08-Mar-00 L0.005 371 0.018 0.017 L0.1 2 1.34 0.172Saulteaux R. above Confl. LSR 08-Mar-00LSR 0.5 km u/s Confl. Driftwood R. 08-Mar-00LSR 0.5 km u/s Confl. Driftwood R. 08-Mar-00Driftwood R. above confl. LSR 08-Mar-00 L0.005 242 0.007 0.019 L0.1 3.8 0.31 0.52Driftwood R. above confl. LSR 08-Mar-00LSR 11.5 km u/s Athabasca R. Confl. 09-Mar-00 L0.005 141 0.021 L0.003 0.113 1.6 0.659 1.86LSR 11.5 km u/s Athabasca R. Confl. 09-Mar-00LSR near Confluence with Athabasca R 09-Mar-00LSR near Confluence with Athabasca R 09-Mar-00Field Blank 09-Mar-00 L0.005 0.012 L0.003 L0.003 L0.1 L0.2 L0.003 0.039Field Blank 09-Mar-00
CEQG-AGRWater Quality Guideline and Value - most stringent
(for the Protection of Aquatic Life (PAL), unless noted):
CEQG-AGR(Irr)

Table 1 - Page 10 of 12
Station DescriptionSample
Date Zinc, tot. Cations Anions
Carbon Dissolved Organic
Carbon, Part. Tot.
BOD5 d
BOD14 d COD
Palustric Acid
Abietic Acid
Dehydroabietic Acid
101924 120 125 6107 100533 8202 8204 8304 101112 101117 101118ug/L MEQ/L MEQ/L mg/L mg/L mg/L mg/L mg/L ug/L ug/L ug/L
LSR below Weir, near Outflow from Lesser Slave Lake-LB 13-Dec-99 5.1 2.4 2.38 11.4 0.28 0.6 0.8 24 L2 L1 L0.2LSR below Weir, near Outflow from Lesser Slave Lake-LB 13-Dec-99 0.8Sawridge Ck. at Hwy 88 Bridge u/s of Slave Lake STP Effl. 13-Dec-99 3.8 1.69 1.72 6.4 0.63 1.2Slave Lake STP Final Effl. 13-Dec-99 26.5 8.12 8.1 24.6 6.35 19.3 146 94 L2 L1 L0.2Slave Lake STP Final Effl. 13-Dec-99 18.8LSR at Mitsue Bridge 14-Dec-99 3.47 2.65 2.58 11.3 0.46 1.2 2.1 22 L2 L1 L0.2LSR at Mitsue Bridge 14-Dec-99 0.7LSR at Mitsue Bridge 15-Dec-99Slave Lake Pulp Mill Final Effl. 14-Dec-99 967 64.7 69.5 461 21 53.3 >96 1680 L2 L1 L0.2Slave Lake Pulp Mill Final Effl. 14-Dec-99 51.7LSR u/s of Otauwau R. 14-Dec-99 41.5 4.2 4.15 21.8 0.96 3.5 12.2 66 L2 L1 L0.2LSR u/s of Otauwau R. 14-Dec-99 3.4Otauwau R. above Confl. LSR 14-Dec-99 6.7 3.38 3.42 11.6 0.37 0.5 0.5 26Otauwau R. above Confl. LSR 14-Dec-99 0.7Saulteaux R. above Confl. LSR 15-Dec-99 1.97 4.24 4.54 15.9 0.32 0.8 1.6 34Saulteaux R. above Confl. LSR 15-Dec-99 0.5LSR 0.5 km u/s Confl. Driftwood R. 15-Dec-99 21.5 0.97 2.6 10.3 60LSR 0.5 km u/s Confl. Driftwood R. 15-Dec-99 2.8Driftwood R. above confl. LSR 15-Dec-99 2.76 5.1 5.43 21.2 0.73 1.2 2.4 47Driftwood R. above confl. LSR 15-Dec-99 1.1LSR 11.5 km u/s Athabasca R. Confl. 16-Dec-99 36.3 4.13 4.28 21.2 0.82 2.8 56 L2 L1 L0.2LSR 11.5 km u/s Athabasca R. Confl.(BOD REPL.) 16-Dec-99 2.8LSR 11.5 km u/s Athabasca R. Confl.(TRUE SPLIT #2) 16-Dec-99 38.3 4.14 4.28 21.7 0.81 2.8 58 L2 L1 L0.2LSR 11.5 km u/s Athabasca R. Confl.(TRUE SPLIT #3) 16-Dec-99 40.7 4.18 4.24 21.8 0.77 2.7 61 L2 L1 L0.2LSR near Confluence with Athabasca R 20-Dec-99 3.7LSR near Confluence with Athabasca R 20-Dec-99 3.8Field Blank 16-Dec-99 0.84 0.06 0.1 L0.2 0.05 0.4 0.6 L4
CEQG
30 ug/L
Station DescriptionSample
Date Zinc, tot. Cations Anions
Carbon Dissolved Organic
Carbon, Part. Tot.
BOD5 d
BOD14 d COD
Palustric Acid
Abietic Acid
Dehydroabietic Acid
101924 120 125 6107 100533 8202 8204 8304 101112 101117 101118ug/L MEQ/L MEQ/L mg/L mg/L mg/L mg/L mg/L ug/L ug/L ug/L
LSR below Weir, near Outflow from Lesser Slave Lake-LB 06-Mar-00 1.25 2.58 2.47 11.4 0.18 0.6 1.2 27 L2 L1 L0.2LSR below Weir, near Outflow from Lesser Slave Lake-LB 06-Mar-00 0.6Sawridge Ck. at Hwy 88 Bridge u/s of Slave Lake STP Effl. 06-Mar-00 3.43 1.66 1.68 5.1 0.49 0.8 10Slave Lake STP Final Effl. 06-Mar-00 56 9.59 9.05 28.7 3.25 17.3 70.6 99 L2 L1 L0.2Slave Lake STP Final Effl. 06-Mar-00 17.2LSR at Mitsue Bridge 07-Mar-00 1.57 11.4 0.33 1.2 2.8 25 L2 L1 L0.2LSR at Mitsue Bridge 07-Mar-00 1Slave Lake Pulp Mill Final Effl. 07-Mar-00 1058 37.7 38.8 195 15.3 43.4 97.4 688 L2 0.3 0.2Slave Lake Pulp Mill Final Effl. 07-Mar-00 42.8LSR u/s of Otauwau R. 07-Mar-00 35.7 4.01 3.77 17.8 1.2 2.3 5.2 51 L2 L1 0.1LSR u/s of Otauwau R. 07-Mar-00 2.3Otauwau R. above Confl. LSR 07-Mar-00 1.68 3 3.17 8.3 0.38 0.7 1.1 16Otauwau R. above Confl. LSR 07-Mar-00 0.6Saulteaux R. above Confl. LSR 08-Mar-00 8.1 6.3 6.8 19.5 0.43 0.7 2.5 52Saulteaux R. above Confl. LSR 08-Mar-00 0.8LSR 0.5 km u/s Confl. Driftwood R. 08-Mar-00 17.4 0.84 1.5 3.9 48LSR 0.5 km u/s Confl. Driftwood R. 08-Mar-00 1.6Driftwood R. above confl. LSR 08-Mar-00 2.74 3.44 3.42 23.1 0.47 0.7 2.8 55Driftwood R. above confl. LSR 08-Mar-00 0.7LSR 11.5 km u/s Athabasca R. Confl. 09-Mar-00 39.2 3.79 3.74 17 0.55 1.4 L2 L1 L0.2LSR 11.5 km u/s Athabasca R. Confl. 09-Mar-00 1.4LSR near Confluence with Athabasca R 09-Mar-00 1.5LSR near Confluence with Athabasca R 09-Mar-00 1.4Field Blank 09-Mar-00 L0.2 0.09 0.11 L0.2 L0.02 L0.2 0.2 L2 L1 L0.2Field Blank 09-Mar-00 0.2
Water Quality Guideline and Value - most stringent(for the Protection of Aquatic Life (PAL), unless noted):

Table 1 - Page 11 of 12
Station DescriptionSample
DateIsopimaric Acid
Levopimaric Acid
Neoabietic Acid
Pimaric Acid
Sandaracopimaric
Acid
12-Chlorodehyd
roabietic Acid
14-Chlorodehyd
roabietic Acid
12,14-Dichlorodehydroabietic Acid
101119 101120 101121 101122 101123 101113 101114 101488ug/L ug/L ug/L ug/L ug/L ug/L ug/L ug/L
LSR below Weir, near Outflow from Lesser Slave Lake-LB 13-Dec-99 L0.2 L2 L2 L0.2 L0.3 L0.2 L0.2 L0.2LSR below Weir, near Outflow from Lesser Slave Lake-LB 13-Dec-99Sawridge Ck. at Hwy 88 Bridge u/s of Slave Lake STP Effl. 13-Dec-99Slave Lake STP Final Effl. 13-Dec-99 L0.2 L2 L2 L0.2 L0.3 L0.2 L0.2 L0.2Slave Lake STP Final Effl. 13-Dec-99LSR at Mitsue Bridge 14-Dec-99 L0.2 L2 L2 L0.2 L0.3 L0.2 L0.2 L0.2LSR at Mitsue Bridge 14-Dec-99LSR at Mitsue Bridge 15-Dec-99Slave Lake Pulp Mill Final Effl. 14-Dec-99 L0.2 L2 L2 L0.2 L0.3 L0.2 L0.2 L0.2Slave Lake Pulp Mill Final Effl. 14-Dec-99LSR u/s of Otauwau R. 14-Dec-99 L0.2 L2 L2 L0.2 L0.3 L0.2 L0.2 L0.2LSR u/s of Otauwau R. 14-Dec-99Otauwau R. above Confl. LSR 14-Dec-99Otauwau R. above Confl. LSR 14-Dec-99Saulteaux R. above Confl. LSR 15-Dec-99Saulteaux R. above Confl. LSR 15-Dec-99LSR 0.5 km u/s Confl. Driftwood R. 15-Dec-99LSR 0.5 km u/s Confl. Driftwood R. 15-Dec-99Driftwood R. above confl. LSR 15-Dec-99Driftwood R. above confl. LSR 15-Dec-99LSR 11.5 km u/s Athabasca R. Confl. 16-Dec-99 L0.2 L2 L2 L0.2 L0.3 L0.2 L0.2 L0.2LSR 11.5 km u/s Athabasca R. Confl.(BOD REPL.) 16-Dec-99LSR 11.5 km u/s Athabasca R. Confl.(TRUE SPLIT #2) 16-Dec-99 L0.2 L2 L2 L0.2 L0.3 L0.2 L0.2 L0.2LSR 11.5 km u/s Athabasca R. Confl.(TRUE SPLIT #3) 16-Dec-99 L0.2 L2 L2 L0.2 L0.3 L0.2 L0.2 L0.2LSR near Confluence with Athabasca R 20-Dec-99LSR near Confluence with Athabasca R 20-Dec-99Field Blank 16-Dec-99
AWQG - total resin acids 100 ug/L
Station DescriptionSample
DateIsopimaric Acid
Levopimaric Acid
Neoabietic Acid
Pimaric Acid
Sandaracopimaric
Acid
12-Chlorodehyd
roabietic Acid
14-Chlorodehyd
roabietic Acid
12,14-Dichlorodehydroabietic Acid
101119 101120 101121 101122 101123 101113 101114 101488ug/L ug/L ug/L ug/L ug/L ug/L ug/L ug/L
LSR below Weir, near Outflow from Lesser Slave Lake-LB 06-Mar-00 L0.2 L2 L2 L0.2 L0.3 L0.2 L0.2 L0.2LSR below Weir, near Outflow from Lesser Slave Lake-LB 06-Mar-00Sawridge Ck. at Hwy 88 Bridge u/s of Slave Lake STP Effl. 06-Mar-00Slave Lake STP Final Effl. 06-Mar-00 L0.2 L2 L2 0.1 0.3 L0.2 L0.2 L0.2Slave Lake STP Final Effl. 06-Mar-00LSR at Mitsue Bridge 07-Mar-00 L0.2 L2 L2 L0.2 0.1 L0.2 L0.2 L0.2LSR at Mitsue Bridge 07-Mar-00Slave Lake Pulp Mill Final Effl. 07-Mar-00 0.1 L2 0.1 0.2 0.3 L0.2 L0.2 L0.2Slave Lake Pulp Mill Final Effl. 07-Mar-00LSR u/s of Otauwau R. 07-Mar-00 L0.2 L2 L2 L0.2 0.1 L0.2 L0.2 L0.2LSR u/s of Otauwau R. 07-Mar-00Otauwau R. above Confl. LSR 07-Mar-00Otauwau R. above Confl. LSR 07-Mar-00Saulteaux R. above Confl. LSR 08-Mar-00Saulteaux R. above Confl. LSR 08-Mar-00LSR 0.5 km u/s Confl. Driftwood R. 08-Mar-00LSR 0.5 km u/s Confl. Driftwood R. 08-Mar-00Driftwood R. above confl. LSR 08-Mar-00Driftwood R. above confl. LSR 08-Mar-00LSR 11.5 km u/s Athabasca R. Confl. 09-Mar-00 L0.2 L2 L2 L0.2 L0.3 L0.2 L0.2 L0.2LSR 11.5 km u/s Athabasca R. Confl. 09-Mar-00LSR near Confluence with Athabasca R 09-Mar-00LSR near Confluence with Athabasca R 09-Mar-00Field Blank 09-Mar-00 L0.2 L2 L2 L0.2 L0.3 L0.2 L0.2 L0.2Field Blank 09-Mar-00
Water Quality Guideline and Value - most stringent(for the Protection of Aquatic Life (PAL), unless noted):
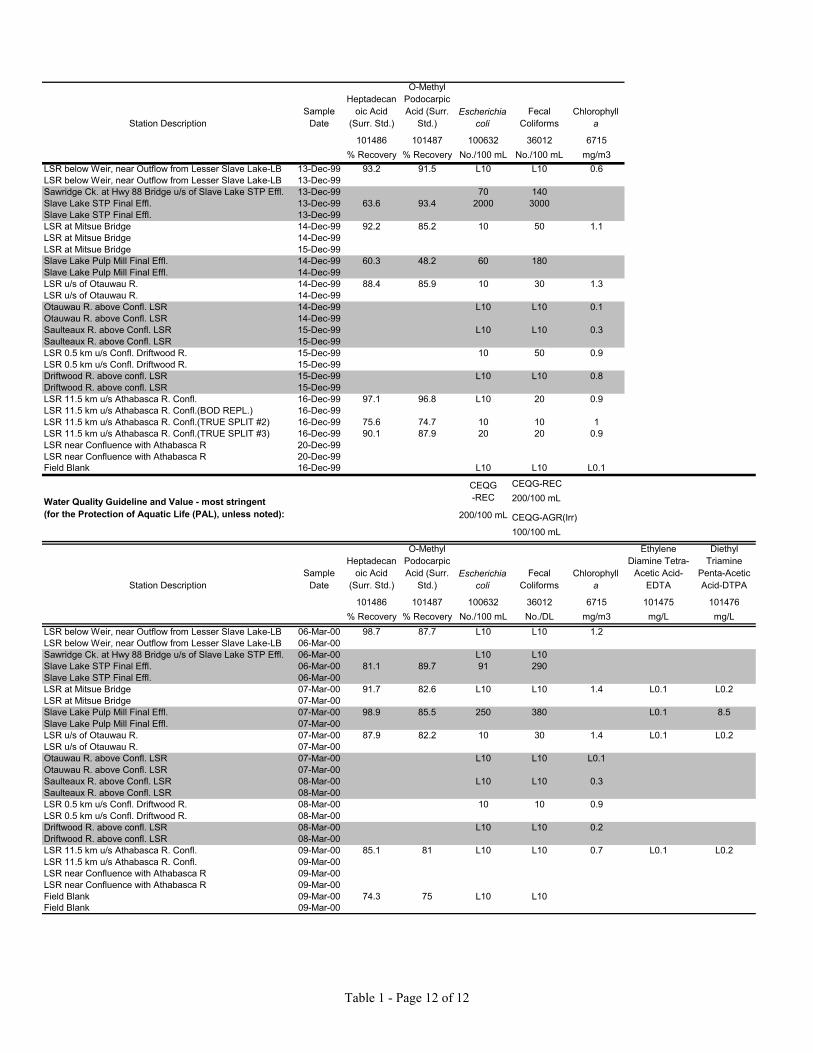
Table 1 - Page 12 of 12
Station DescriptionSample
Date
Heptadecanoic Acid
(Surr. Std.)
O-Methyl Podocarpic Acid (Surr.
Std.)Escherichia
coliFecal
ColiformsChlorophyll
a
101486 101487 100632 36012 6715% Recovery % Recovery No./100 mL No./100 mL mg/m3
LSR below Weir, near Outflow from Lesser Slave Lake-LB 13-Dec-99 93.2 91.5 L10 L10 0.6LSR below Weir, near Outflow from Lesser Slave Lake-LB 13-Dec-99Sawridge Ck. at Hwy 88 Bridge u/s of Slave Lake STP Effl. 13-Dec-99 70 140Slave Lake STP Final Effl. 13-Dec-99 63.6 93.4 2000 3000Slave Lake STP Final Effl. 13-Dec-99LSR at Mitsue Bridge 14-Dec-99 92.2 85.2 10 50 1.1LSR at Mitsue Bridge 14-Dec-99LSR at Mitsue Bridge 15-Dec-99Slave Lake Pulp Mill Final Effl. 14-Dec-99 60.3 48.2 60 180Slave Lake Pulp Mill Final Effl. 14-Dec-99LSR u/s of Otauwau R. 14-Dec-99 88.4 85.9 10 30 1.3LSR u/s of Otauwau R. 14-Dec-99Otauwau R. above Confl. LSR 14-Dec-99 L10 L10 0.1Otauwau R. above Confl. LSR 14-Dec-99Saulteaux R. above Confl. LSR 15-Dec-99 L10 L10 0.3Saulteaux R. above Confl. LSR 15-Dec-99LSR 0.5 km u/s Confl. Driftwood R. 15-Dec-99 10 50 0.9LSR 0.5 km u/s Confl. Driftwood R. 15-Dec-99Driftwood R. above confl. LSR 15-Dec-99 L10 L10 0.8Driftwood R. above confl. LSR 15-Dec-99LSR 11.5 km u/s Athabasca R. Confl. 16-Dec-99 97.1 96.8 L10 20 0.9LSR 11.5 km u/s Athabasca R. Confl.(BOD REPL.) 16-Dec-99LSR 11.5 km u/s Athabasca R. Confl.(TRUE SPLIT #2) 16-Dec-99 75.6 74.7 10 10 1LSR 11.5 km u/s Athabasca R. Confl.(TRUE SPLIT #3) 16-Dec-99 90.1 87.9 20 20 0.9LSR near Confluence with Athabasca R 20-Dec-99LSR near Confluence with Athabasca R 20-Dec-99Field Blank 16-Dec-99 L10 L10 L0.1
CEQG-REC200/100 mL
200/100 mL CEQG-AGR(Irr)100/100 mL
Station DescriptionSample
Date
Heptadecanoic Acid
(Surr. Std.)
O-Methyl Podocarpic Acid (Surr.
Std.)Escherichia
coliFecal
ColiformsChlorophyll
a
Ethylene Diamine Tetra-
Acetic Acid-EDTA
Diethyl Triamine
Penta-Acetic Acid-DTPA
101486 101487 100632 36012 6715 101475 101476% Recovery % Recovery No./100 mL No./DL mg/m3 mg/L mg/L
LSR below Weir, near Outflow from Lesser Slave Lake-LB 06-Mar-00 98.7 87.7 L10 L10 1.2LSR below Weir, near Outflow from Lesser Slave Lake-LB 06-Mar-00Sawridge Ck. at Hwy 88 Bridge u/s of Slave Lake STP Effl. 06-Mar-00 L10 L10Slave Lake STP Final Effl. 06-Mar-00 81.1 89.7 91 290Slave Lake STP Final Effl. 06-Mar-00LSR at Mitsue Bridge 07-Mar-00 91.7 82.6 L10 L10 1.4 L0.1 L0.2LSR at Mitsue Bridge 07-Mar-00Slave Lake Pulp Mill Final Effl. 07-Mar-00 98.9 85.5 250 380 L0.1 8.5Slave Lake Pulp Mill Final Effl. 07-Mar-00LSR u/s of Otauwau R. 07-Mar-00 87.9 82.2 10 30 1.4 L0.1 L0.2LSR u/s of Otauwau R. 07-Mar-00Otauwau R. above Confl. LSR 07-Mar-00 L10 L10 L0.1Otauwau R. above Confl. LSR 07-Mar-00Saulteaux R. above Confl. LSR 08-Mar-00 L10 L10 0.3Saulteaux R. above Confl. LSR 08-Mar-00LSR 0.5 km u/s Confl. Driftwood R. 08-Mar-00 10 10 0.9LSR 0.5 km u/s Confl. Driftwood R. 08-Mar-00Driftwood R. above confl. LSR 08-Mar-00 L10 L10 0.2Driftwood R. above confl. LSR 08-Mar-00LSR 11.5 km u/s Athabasca R. Confl. 09-Mar-00 85.1 81 L10 L10 0.7 L0.1 L0.2LSR 11.5 km u/s Athabasca R. Confl. 09-Mar-00LSR near Confluence with Athabasca R 09-Mar-00LSR near Confluence with Athabasca R 09-Mar-00Field Blank 09-Mar-00 74.3 75 L10 L10Field Blank 09-Mar-00
CEQG-RECWater Quality Guideline and Value - most stringent
(for the Protection of Aquatic Life (PAL), unless noted):