lower san francisquito creek · pdf filelandscape changes on lower san francisquito creek,...
TRANSCRIPT
H I STOR IC AL EC OL OGY PRO GR AM CONTR IBUT I O N N O. 579 • A PR 09
Historical Ecology of Lower San Francisquito Creek Phase 1 Technical memorandum accompanying project GIS data
Prepared for the San Francisquito Creek Joint Powers Authority By the San Francisco Estuary Institute
Dan Hermstad
Kristen Cayce
Robin Grossinger

This report should be cited as:
Hermstad, D., Cayce, K. and Grossinger, R. (2009). Historical Ecology of Lower San Francisquisto Creek, Phase 1. Technical memorandum accompanying project GIS Data, Contribution No. 579. Historical Ecology Program, San Francisco Estuary Institute, Oakland, California.
Introduction This memo is intended to accompany the GIS layers developed by SFEI to document historical changes in habitat and hydrology on lower San Francisquito Creek. Information about the timing, extent, and character of major landscape changes can be an important part of the technical foundation for the selection and design of flood protection alternatives. Historical landscape information can provide rationale for flood protection decisions in a number of ways. Some of the applications suggested by the data discovered in this project include the following.
• Stream routes documented over time show former stream positions, significant changes, and long-term tendencies
• Alluvial fill areas indicate large amounts of sediment deposition from the upper watershed
• Connections to tidal channels and tidal marsh show how marsh and secondary channels were used to disperse flood waters
• Large willow patches along the creek channel served as natural flood retention basins
• Shoreline erosion trends indicate the need for sediment deposition and marsh plain development to maintain buffer marshes, especially given projected sea-level rise.
The primary goal of this phase was to produce GIS layers and georeferenced imagery for use by the planning and engineering team of the San Francisquito Creek Joint Powers Authority. The memo serves as metadata for the GIS, helping explain the interpretation of original historical documents. Phase 1 was also intended to explore the potential value of historical ecology in a broader social context, towards developing community understanding of the history of changes to the watershed, and the challenges and opportunities this history presents. Accordingly, we carried out some limited initial data collection efforts as part of this phase, but much more local information remains to be collected. We present here a very brief summary of information collected to-date. The complex stream and floodplain changes over the past 150 years are relevant to contemporary management. The timeseries mapping presented here documents the natural location of floodplain elements such as willow groves, tidal marsh, and tidal channels. Elements of these features might be considered for natural flood storage capacity and ecosystem benefits. Of interest may also be the history of sedimentation in the lower stream reaches, where sediment aggradation has tended to exceed the stream's ability to maintain a channel. Apparent management of this sediment by local farmers to raise marsh levels may be a practice of contemporary relevance, given concerns about shoreline erosion and limited sediment supply. Rates of shoreline change, which have been dynamic and variable along the shore (with a recent erosive trend), are also an area of potential further exploration.
2
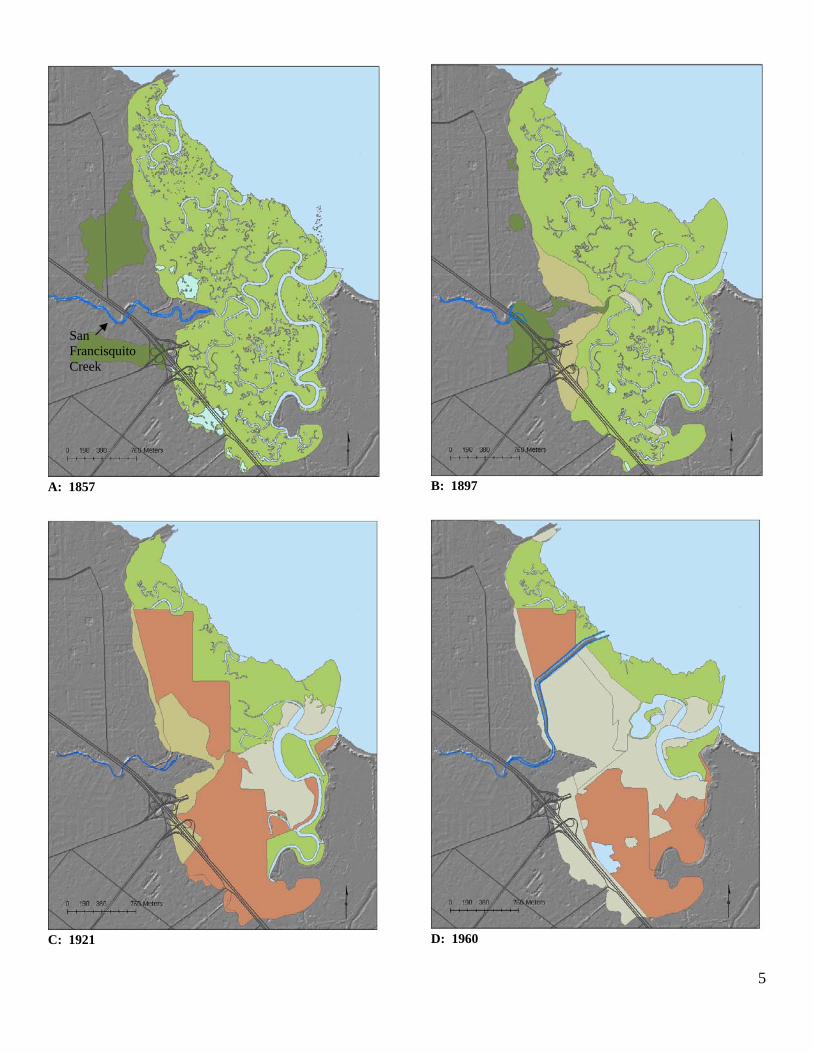
Landscape Changes on Lower San Francisquito Creek, 1857-2004 In the last 150 years, lower San Francisquito Creek has undergone dramatic modification. This history is illustrated by a series of exceptional early maps and aerial photographs.
In 1857, the US Coast Survey (USCS), a federal mapping agency renowned for its accuracy, surveyed the lower stream reaches and surrounding baylands (Figure 1A). At this time, tidal marsh habitat covered 1142 acres. The tidal marshes were dotted with small pannes and larger, salt-producing salinas. Also surveyed on this T-sheet are two large (63 and 118 acres) willow groves adjacent to the tidal marsh associated with high groundwater tables and seasonal flooding. San Francisquito Creek maintained a sinuous stream course with several major meanders in the reach between current day Highway 101 and the backshore extent of historical tidal marsh. The depiction of the shoreline on the 1857 T-sheet indicates that tidal marsh is accreting, developing a chain of small marsh patches out into the Estuary. By the 1897 resurvey of the area around San Francisquito Creek (carried out by same agency, now called the US Coast and Geodetic Survey), the creek mouth was mapped much further inland, at the present day Highway 101 crossing (Figure 1B). High sediment load apparently caused the creek to fill its channel, creating a distributary system about a half mile from the former tidal mouth. Since 1857, the willow groves have changed size, shape and position due to changes in land use and characteristics of San Francisquito Creek. In 1897, there have been only limited modifications to the broad tidal marsh area. While some levees are visible, they were generally not successful (Westdahl 1897). Wilson’s Landing and Clarke’s Landing are clearly visible by 1897, apparently creating small areas of landfill. However, tidal marsh habitat acreage remains roughly the same as in 1857 at 1109 acres (1142 acres in 1857). Interestingly, loss of tidal marsh can be seen along the backshore boundary as San Francisquito Creek appears to have deposited significant amounts of sediment over the marsh surface. We referred to this process as "alluvial fill." Over the same period -- presumably due to large sediment supply -- the shoreline continued to build out north of the San Francisquito tidal slough, offsetting the loss in the upland transition. Much more rapid human modification of marshlands occurred during 1900-1920. By this time, extensive levees have removed tidal action from much of the former marshland, extending the backshore further east (Figure 1C). Diked bayland becomes a significant portion of the study area, encompassing approximately 574 acres while tidal marshes have shrunk by over 60% to 428 acres. Numerous tidal flats and channels have been cut off, changed course, or otherwise altered during this time period. The first significant dredging of tidal channels begins at this time and dredged materials can be seen filling areas of former marshland. The dredged channels are notably widened; discarded bay fill begins to cover surrounding tidal marsh areas. In the 1921 view, as in the 1897 picture, San Francisquito Creek does not maintain a well-defined channel through the baylands, but rather appears to spread broadly. There is evidence of continued alluvial deposition over the baylands, in the form of distinct splay deposits. This may have been the result, in part or in full, of local efforts to increase the marsh surface level for agricultural use by directing stream sediments (Clark 1924). Shoreline erosion is evident by this time. Major re-routing of the San Francisquito Creek takes place in the late 1920’s (Applequist 1931, Silberling 1971) and can be seen in the 1960 image (Figure 1D). Controlled by two levees each side of the channel, the creek now has a well-defined, excavated channel. It turns sharply north
3
4
near the site of its former mouth, runs north for a length of approximately half a mile, turns to the northeast and exits to the bay through areas of former tidal marsh and diked bayland. Areas of fill have grown substantially, subsuming areas of former tidal marsh, diked bayland and alluvial fill. Filled areas allowed development such as a golf course and the Palo Alto Airport. Total area composed of fill, including bay fill and alluvial fill, is 370 acres. By this time, the Palo Alto Harbor has been fully excavated from surrounding marshlands and includes a back pool, (24 acres in size) that was formerly tidal marsh, tidal flat, and channel. Tidal marsh extent has been reduced to 270 acres. The shoreline continues to erode south of the creek outlet to the Estuary.
Landscape alterations continue in 2004 (Figure 1E). The imagery shows more extensive fill but there is also an increase in tidal marsh area since 1960. Total tidal marsh habitat contains 352 acres. This increase has resulted from a restoration project south of Cooley’s Landing, where a breached levee opened up tidal action to diked bayland. Fill now encompasses 685 acres of the study area. At the same time, a larger area of fill is now evident in an eastern portion of the study area where Mayfield Slough formerly passed. The creek channel remains in its re-routed position.
5
A: 1857
C: 1921
San Francisquito Creek
B: 1897
D: 1960
6
E: 2004
Habitats and Land Use
Channel
Fill, Undifferentiated
Fill, Alluvial (deposited by SF Creek since 1857)
Diked Bayland
Panne
Waters (including Ponds, Tidal Channels/Flats, Palo Alto Harbor and the SF Bay)
Tidal Marsh
Willow Grove
Figure 1: Changes in lower San Francisquito Creek habitats and hydrology, 1857-2004.
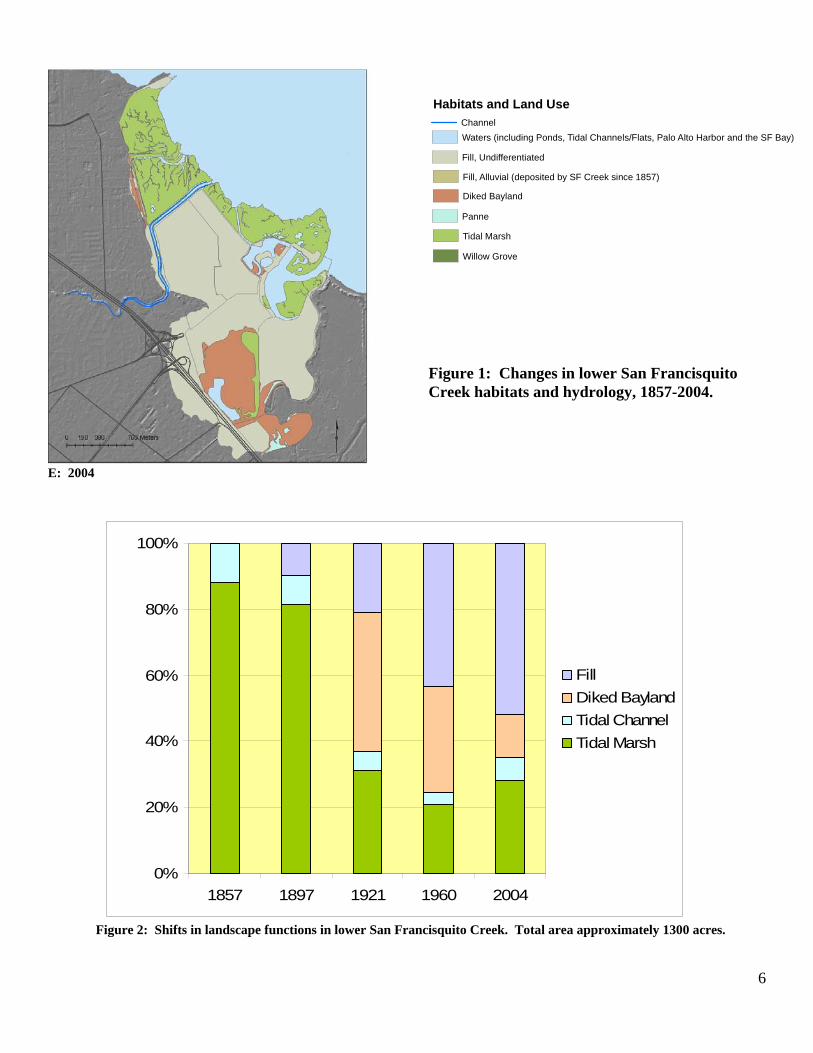
0%
20%
40%
60%
80%
100%
1857 1897 1921 1960 2004
FillDiked BaylandTidal ChannelTidal Marsh
Figure 2: Shifts in landscape functions in lower San Francisquito Creek. Total area approximately 1300 acres.
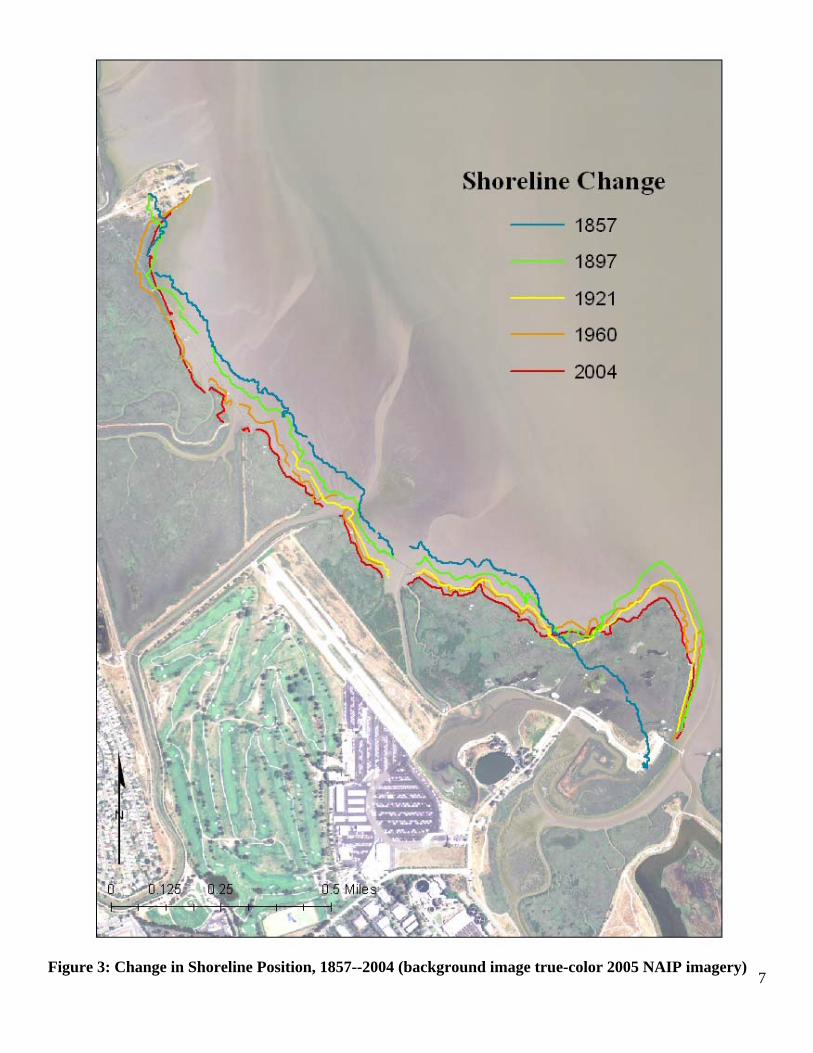
7Figure 3: Change in Shoreline Position, 1857--2004 (background image true-color 2005 NAIP imagery)
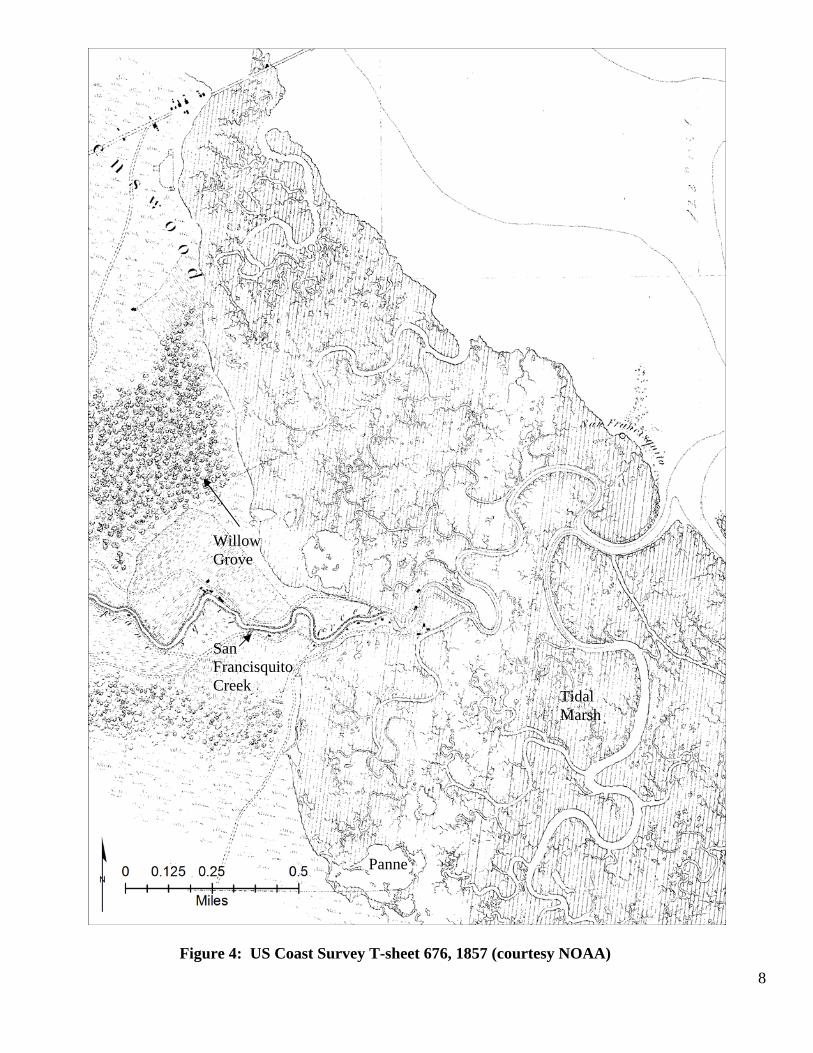
Willow Grove
San Francisquito Creek
Tidal Marsh
Panne
Figure 4: US Coast Survey T-sheet 676, 1857 (courtesy NOAA)
8
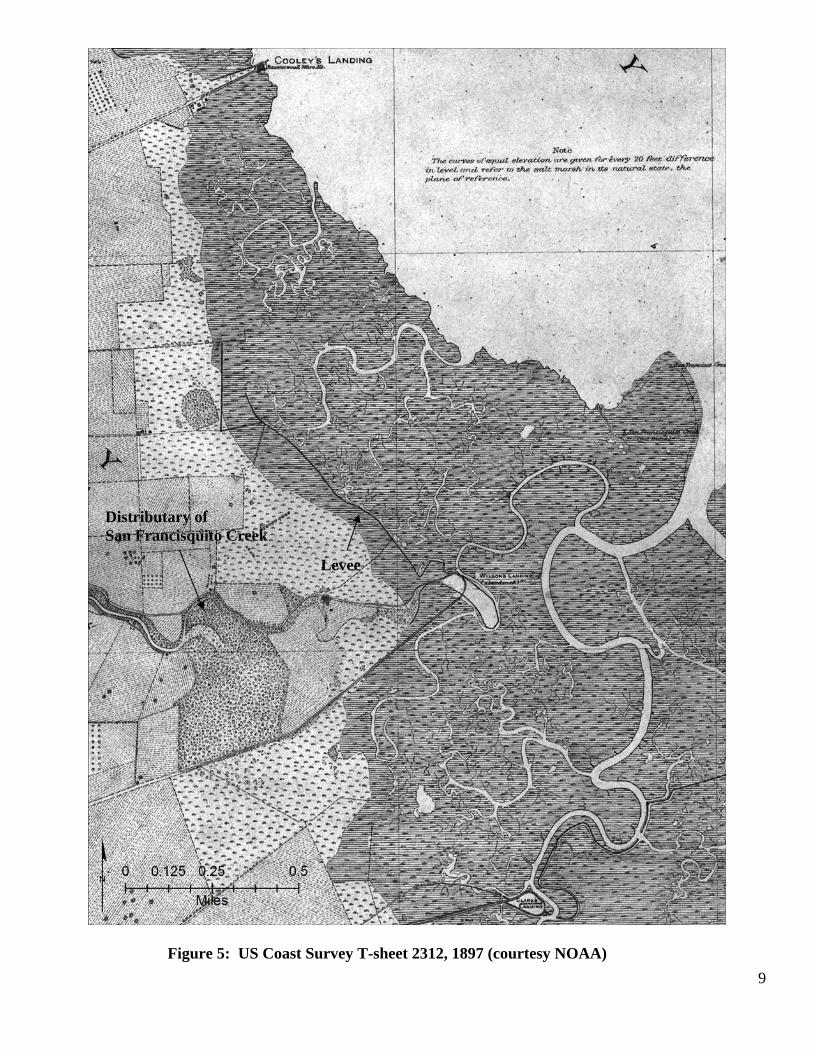
Distributary of San Francisquito Creek
Levee
Figure 5: US Coast Survey T-sheet 2312, 1897 (courtesy NOAA)
9

Alluvial Deposition
Bay Fill
Diked Bayland
Figure 6: National Ocean Survey Photograph, 1921 (courtesy Alan K. Brown)
10
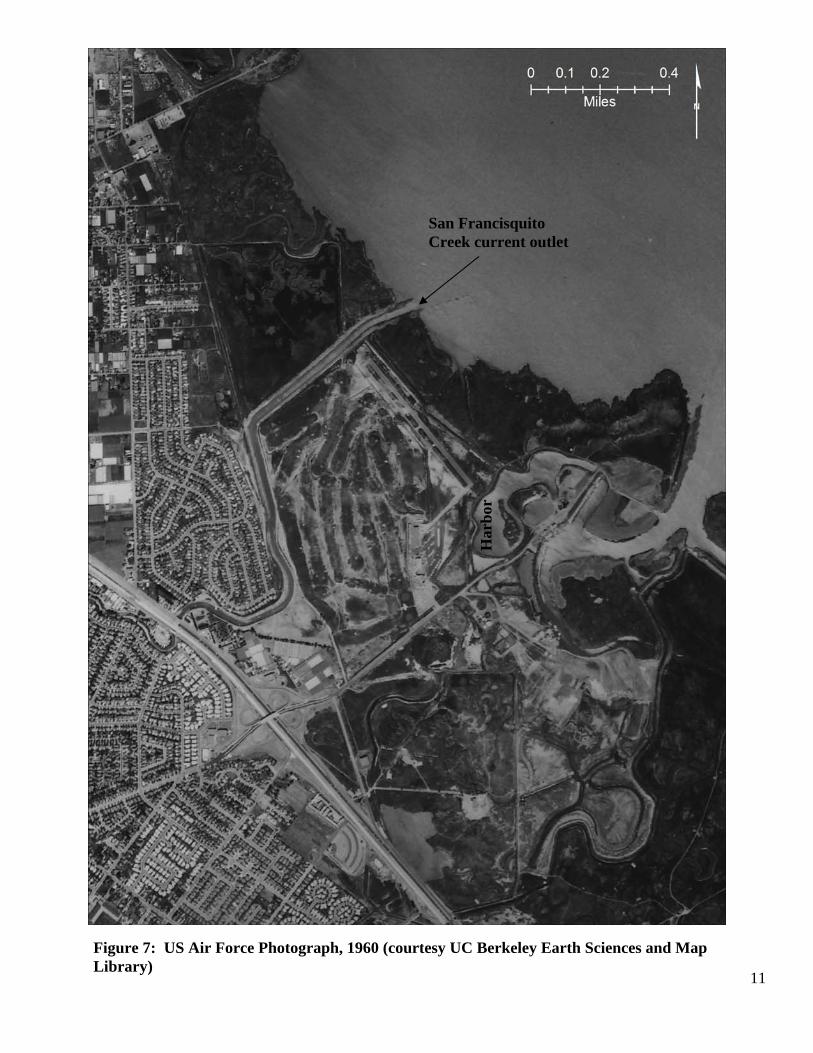
San Francisquito Creek current outlet
Har
bor
11
Figure 7: US Air Force Photograph, 1960 (courtesy UC Berkeley Earth Sciences and Map Library)

Figure 8: Color Infrared IKONOS Satellite Imagery, 2004 (courtesy City of San Jose)
12

13
APPENDIX: Methods Data Sources Habitat and land use figures were generated from a variety of sources collected for this project. 1857 and 1897 data were digitized into a GIS from the USCS/USCGS Topographic Sheets (T-sheets). These maps were surveyed using the most sophisticated geographic methods of the time, etched onto printing plates and printed on woven paper. Aerial photography was used to map 1921 and 1960 features. 2004 data were mapped from IKONOS color infrared satellite imagery. We obtained electronic copies of each dataset, accurately tied them to points on the ground during the georectification process, and vectorized into a Geographic Information System. Data Source Details 1857 and 1897 These years were mapped based on the T-sheets. Variations in detail exist between the two years. It appears that the earlier T-sheet shows pannes in the tidal marshes with much greater detail and accuracy. The 1897 T-sheet shows very few pannes despite few other major changes. It is possible, but unlikely that such a large number of pannes disappeared in that time period. For this reason, it is important to note that the number of pannes in the 1897 view is likely to be greater than that depicted. 1921 The map of 1921 habitats was produced based on unusually early aerial imagery obtained by Alan K. Brown from the National Ocean Survey, and provided to SFEI. This imagery contains a gap in the far northern portion of the study area. This lack of information occurs in an area of tidal marsh that has remained undisturbed throughout our analysis. For this reason, we have retained tidal channels from the previous era and assumed no significant change when surrounding areas also showed no significant change. Pannes and salinas were not mapped due to difficulties in distinguishing these features from aerial imagery, but these features likely existed on the ground. 1960 Data and maps were generated based on aerial imagery of this year, flown by the US Air Force and obtained from UC Berkeley. A single image covered the extent of the study area and presented few difficulties for mapping. Like 1921, pannes and salinas were not mapped from the aerial imagery. This habitat is excluded in the mapping, but believed to exist on the ground. 2004 IKONOS color infrared satellite imagery was used for this year. A greater level of detail was mapped for the tidal marshes so that levees are distinct as areas of fill. Pannes were included in this view as they were readily apparent, visible in the imagery, and indicate a recent configuration for tidal wetlands. Georectification Before digitization of habitats, the T-sheets and imagery required georectification, or tying points on the map or image to points on the ground. Georectification was completed in ArcGIS 9.2 using standard Arc toolsets. Persistent features such as street crossings and large trees were preferred. However, because of the small size of the study site and lack of such features in early coastal maps, points on small tidal channels (especially confluences) that are believed to be fairly

14
spatially stable were used to geo-reference parts of some images and maps. Where the study area required two images for complete coverage, the adjoining photo was georectfied to the first image of the same year. Care was taken to ensure consistency among the data sets. Overall accuracy for the images is believed to be approximately within 15 meters. Classification Habitat and land use classifications were determined based on map symbology, feature shape and relationship to other landscape features. Pixel values, or color signature, were also used for classifying from aerial and satellite imagery. Accommodations were made to address the differences between maps and images. For example, tidal channels were not altered from earlier mapped sources if they showed a similar shape, width, curvature and length, and met the 15 meter accuracy standard in the image being mapped. This is due to the difficulty of relating visible features (as in a photograph) to drawn historical features. As a result, greater change in channel width and alignment occurred in some places than is shown in the GIS. If of interest, these details can be examined in the original sources. Feature Definition
Tidal Marsh Habitat characterized by tidal wetland vegetation that was not impounded or otherwise enclosed by levees, dikes, ditches or any other restriction that prevented tidal inundation.
Tidal Channel/Flat
Linear and sinuous water courses in and around tidal marsh through which waters of the San Francisco Bay Estuary pass freely with the natural action of the tides. We included associated mudflats in this class as the datasets represented different tidal stages, making identification of the lower tidal flat boundary (MLLW) difficult. The size and shape of these channels were not altered if they appeared to retain a similar shape to the previously mapped year.
Bay Fill Bay sediments manually dredged from tidal channels to allow for boat passage. This material was placed on surrounding baylands.
Alluvial Fill
Creek sediment deposited by San Francisquito Creek over historic baylands since 1857. The shape of the feature in 1897 has a distinct fan shape, as inferred from landscape shapes and characteristic striation patterns evident in imagery. Alluvial Fill can include agriculture but was not classified as such once development took place. The southern boundary of the fan feature was not clearly evident.
Fill Deposited material of unknown origin. All developments were assumed to have been built on Fill.
Diked Bayland Areas of former tidal marsh that no longer receive tidal action, usually due to a barrier such as a levee or dike. A functioning dike or levee had to be present and visible for this classification.
Panne Natural, shallow ponds within tidal marsh habitat that fill and recede with high tidal waters. Pannes contain little to no vegetation. Very detailed pannes were mapped for the 1857 T-sheet.
Salina
Elongated, panne-like features that develop parallel to the marsh backshore and are inundated infrequently by very, very high tides. Salinas can have varying salinity levels due to micro-topography and freshwater influence.

15
References
Applequist H.C. 1931. Topographic sheet number 4606. U.S. Coast and Geodetic Survey.
Clark, W. O. 1924. Ground water in Santa Clara valley, California. Prepared in cooperation with the Department of Engineering of the State of California. U.S. Government Printing Office, Washington, D.C.
Silberling, Barbara. 1971. Historical Summary of Dredging in the Palo Alto Yacht Harbor.
Westdahl, F. 1897. Descriptive Report for Topographic sheet number 2312. U.S. Coast and Geodetic Survey.