l&s 39g - university of california, berkeley · 2015-10-20 · l&s 39g health, human...
TRANSCRIPT

L&S 39GHealth, Human Behavior, and Data
Prof. Ryan Edwards
Class 8
October 20, 2015
1

Sep 8 Bhattacharya chaps 1-2
Alastair & Catherine Oct 27 Ashenfelter
& Ziliak
Sep 15 Cutler et al. and Wachter
Eric & Natalie Nov 3 Ruhm
Sep 22 Bhattacharya chap 3
Catherine & Kyle Nov 10 Small &
Rosenbaum
Sep 29 Bhattacharya chap 4 Kyle Nov 17 Buckles &
Hungerman
Oct 6 Sutton and Bartholomew Nov 24 Carpenter
& Dobkin
Oct 13 Aron-Dine et al.
Kyle & Catherine Dec 1 Edwards &
Mason
Oct 20 Oster Angela & Eric
2

First draft deadline is next week: Monday October 26
• Needs to be at least a mockup of your paper
• With sections that include complete sentences
• At least one table or figure produced and discussed
• Be sure that the 3 sentences from your topic appear in the draft, whether verbatim or updated 1. Question you’re asking 2. Data3. Answer you expect
3

Today’s agenda
• Reminder about deadlines
• Some quick i>clicker questions about the readings
• Angela and Eric on the reading
• More in depth on the reading
4
i>clicker question 8.1
A. Alcohol
B. Caffeine
C. Smoking
D. All of these
E. None of these5
What’s clearly bad for baby?

i>clicker question 8.2
A. They’re wealthy moms who can afford it
B. They’re just like the moms who don’t drink heavily
C. They probably also use drugs heavily
D. They’re probably heavier than other moms
6
Suppose a study found that heavy drinking was bad for baby. What might you expect to find is true about
the moms who report heavy drinking?

Public Service Announcement
• Smokers are people just like the rest of us
• Everyone deserves respect
• The surgeon general of the U.S. warns about the multidimensional risks of smoking
• Smoking is addictive
• We approach the study of smoking with the goal of understanding health disparities, not blaming anyone
7

i>clicker question 8.3
A. Yes, I knew both types
B. No, I only knew one type of student
8
Think about other students in your high school graduating class. Did you know students who were
smokers and students who were nonsmokers?

i>clicker question 8.4
A. Yes, on average they’d be the same if they quit
B. No, they’d still be different
C. I don’t know
9
Think about the smokers among other students in your high school graduating class. If they were to
quit smoking, do you think they would be the same on average as nonsmoker students?

Oster, Expecting Better, and What To Do When There Are No RCTs
• Wars and other disasters may deprive moms and fetuses of nutrition (fetal programming hypothesis)
• There are no other randomized controlled trials
• Thank goodness!!
• But suppose you’re a pregnant health economist whose doctors tell you all sorts of advice
• Now what?10
Observational studies• A lot of research starts from observation
• But there is smart observation, and not-so-smart
• Lots and lots of characteristics and behaviors are related to one another
• If we want to know a particular ∂y/∂x but can’t randomize x, it’s critical to hold other z’s constant
yi = α + β xi + δ zi + εi
11
Study design: Following individuals over time
• Suppose we’re interested in how a bad x affects an outcome y
• We could observe people over time, measure x & y, then compare y across high-x and low-x people
• How useful will this be? Depends on
- How homogeneous the sample of people was
- Whether x is correlated with something else that we’re not measuring (more likely with less homogeneity)
12
Alcohol & pregnancy• One of my favorite passages in the chapter is on page 51:
- One phrase I kept coming across was "no amount of alcohol has been proven safe.”
- [T]oo much of many foods can be bad. If you have too many bananas (and I mean a LOT of bananas), the excess potassium can be a real problem. But no doctor is going around saying "No amount of bananas have been proven safe!" He'd be laughed out of the medical conference.
- [E]vidence … leads us to conclude that binge drinking is problematic. But if you are willing to conclude that, why wouldn't you be willing to conclude that light drinking is fine? That is what the evidence shows.
13
“Evidence” from studies of alcohol and pregnancy: The sample really matters
• External validity is how a study’s results may apply to other circumstances
• There are no RCTs that vary drinking across moms
• But there are studies of moms drinking
- In the U.S., where it’s become a huge taboo
- In other countries, like Australia, where moderate drinking is more quotidian
14

15
-The Vices: Caffeine, Alcohol, and Tobacco 45
Drinking in Pregnancy andBehavior Problems Among 2-Year-Olds
. ..
Versus
.. _.- _._ ......•...........•••• , .
E . .
, .0.12%o ..;:..
LO 10%, .
LO
.. .c..U 6%:E .u'0 4%Ql .•• -,- .......OJ..C 2%w·· .. ·.... ·.. ·
a. 0%Level of behaviorproblems withno drinking
Level of behaviorproblems withoccasionaldrinking(,;J drinkper week)
Level of behaviorproblems with
lightdrinking
(2-6 drinksper week)
Level of behaviorproblems withmoderatedrinking
(7-10 drinksper week)
in the paper, there is no evidence that more drinking leads tohigher levels of behavior problems. In fact, the statistics in thepaper show that light drinkers (that's 2 to 6 drinks per week) areactually significantly less likely to have children with behaviorproblems than women who do not drink at all.The other big concern with alcohol is low IQ. Again, my favor-
ite study on this issue comes out of Australia. It has a lot of thesame high-quality features: large study, drinking informationcollected during pregnancy, long-term follow-up. And, of course,the fact that it was run in Australia. This study started in theearly 1980s by asking about 7,200 pregnant women about theirdrinking during pregnancy. Roughly 5,000 of their children com-pleted an achievement test at age 14.5Drinking information was collected after the first 3 months of
pregnancy and after the last 3 months. These authors define their

16
&
46 EXPECTING BETTER
drinking categories by the day: no drinking, less than Y1 glass perday, lh to 1 glass per day, and greater than 1 glass per day.They measured IQ with a test called Raven's matrix. It works
like most IQ tests in that higher scores are better, and the test isdesigned so that the average person will score 100. Here's the data:'
Raven's Matrix Performance and Maternal Drinking
1.0.5 ,- --.• No drinking
• less Ihan 1/2 glass per day ...• 1/2-1 Glass per day
• More than 1glass per day ..,
··························.. ···.·····1
104 levels of........... _.- ••••••••••• - n •••• •• - _ .
no drinking1()3............................................................. . .
1.0.2 .
································.. ···195 I
Dnnking /n early pregnancy Drinking in late pregnancy
Stage of pregnancy
x
EC 99CP _'h ...>cr 9B
97
-!!§ ..
Just as in the study of behavior, there is no evidence here tosuggest that the children of light drinkers are worse off thanthose of women who drink nothing. In fact, their scores arehigher on average (although these results are not statisticallysignificant-theymay just reflect random variation). The research-ers concluded there is no evidence of worse test performance,even among the children of moms who have a drink or moreper day.
• This graph reports coe£fi . d' . htc'ents a Justed for maternal demographics and we.g .
Rave
n IQ
sco
re (m
ore
is b
ette
r)

17
This is not to say that one cannot unearth studies that find that light drinking is a problem.
The issue is that these studies are very deeply flawed.
One of the very nice things about the previous studies …was that … women who drank different amounts were not that different in other ways.

Alcohol, context, and omitted variables
• The cited study by Sood et al. (Pediatrics 2001)
- Data from Fetal Alcohol Research Center, Wayne State U
- 90% of moms were African American
- Of moms who reported no alcohol use, 18% reported cocaine use. Of moms who drank, 45% reported cocaine
- “These data suggest that no alcohol during pregnancy remains the best medical advice.”
• Oster: “At this point, I threw that paper in the trash. Maybe if I was wondering about combining my end-of-day glass of wine with cocaine it would be useful.”
18

Papers that omit variables still get published
• A literature shows reduced child neurocognitive outcomes associated with advanced paternal age
• Sperm can mutate with age, but no RCT evidence exists
• What else is paternal age correlated with?
- Maternal age (controlled)
- Birth order and family size (not controlled), Mother’s education (not controlled)
• Edwards and Roff (2010) show many “effects” are bogus
19
Caffeine & pregnancy• Turns out there was an RCT in Denmark!
• Also RCT using lab rats:
- Miscarriage in rats with 250mg per kg per day
- For humans, translates to 60 cups of coffee per day
• A lot of observational studies of self-reported caffeine use and pregnancy outcomes
20
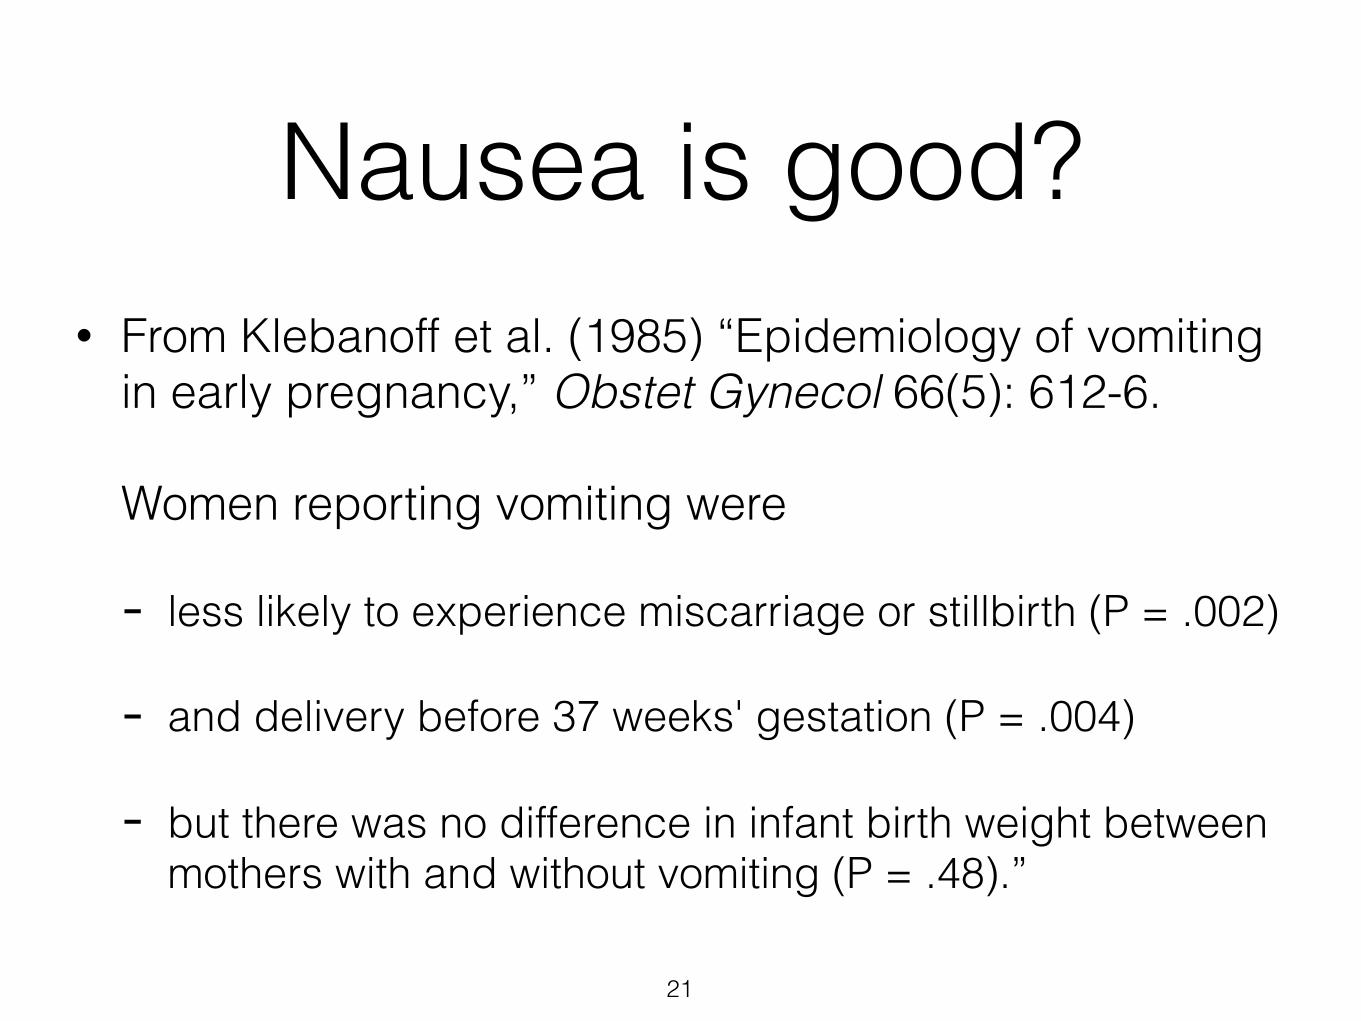
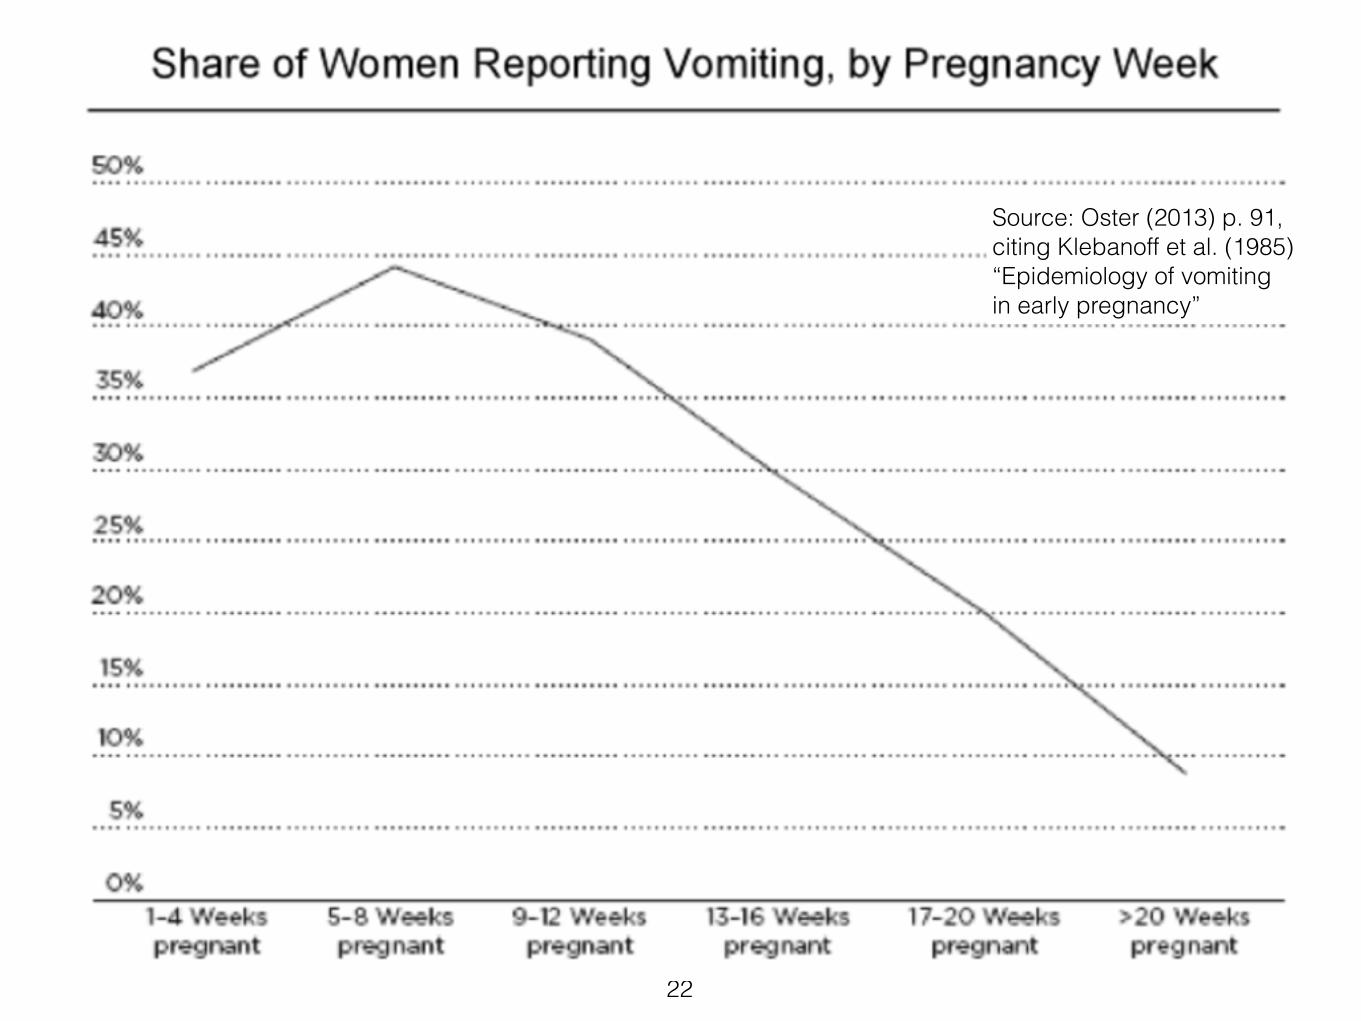
Nausea is good?• From Klebanoff et al. (1985) “Epidemiology of vomiting
in early pregnancy,” Obstet Gynecol 66(5): 612-6. Women reporting vomiting were
- less likely to experience miscarriage or stillbirth (P = .002)
- and delivery before 37 weeks' gestation (P = .004)
- but there was no difference in infant birth weight between mothers with and without vomiting (P = .48).”
21
22
Source: Oster (2013) p. 91, citing Klebanoff et al. (1985) “Epidemiology of vomiting in early pregnancy”
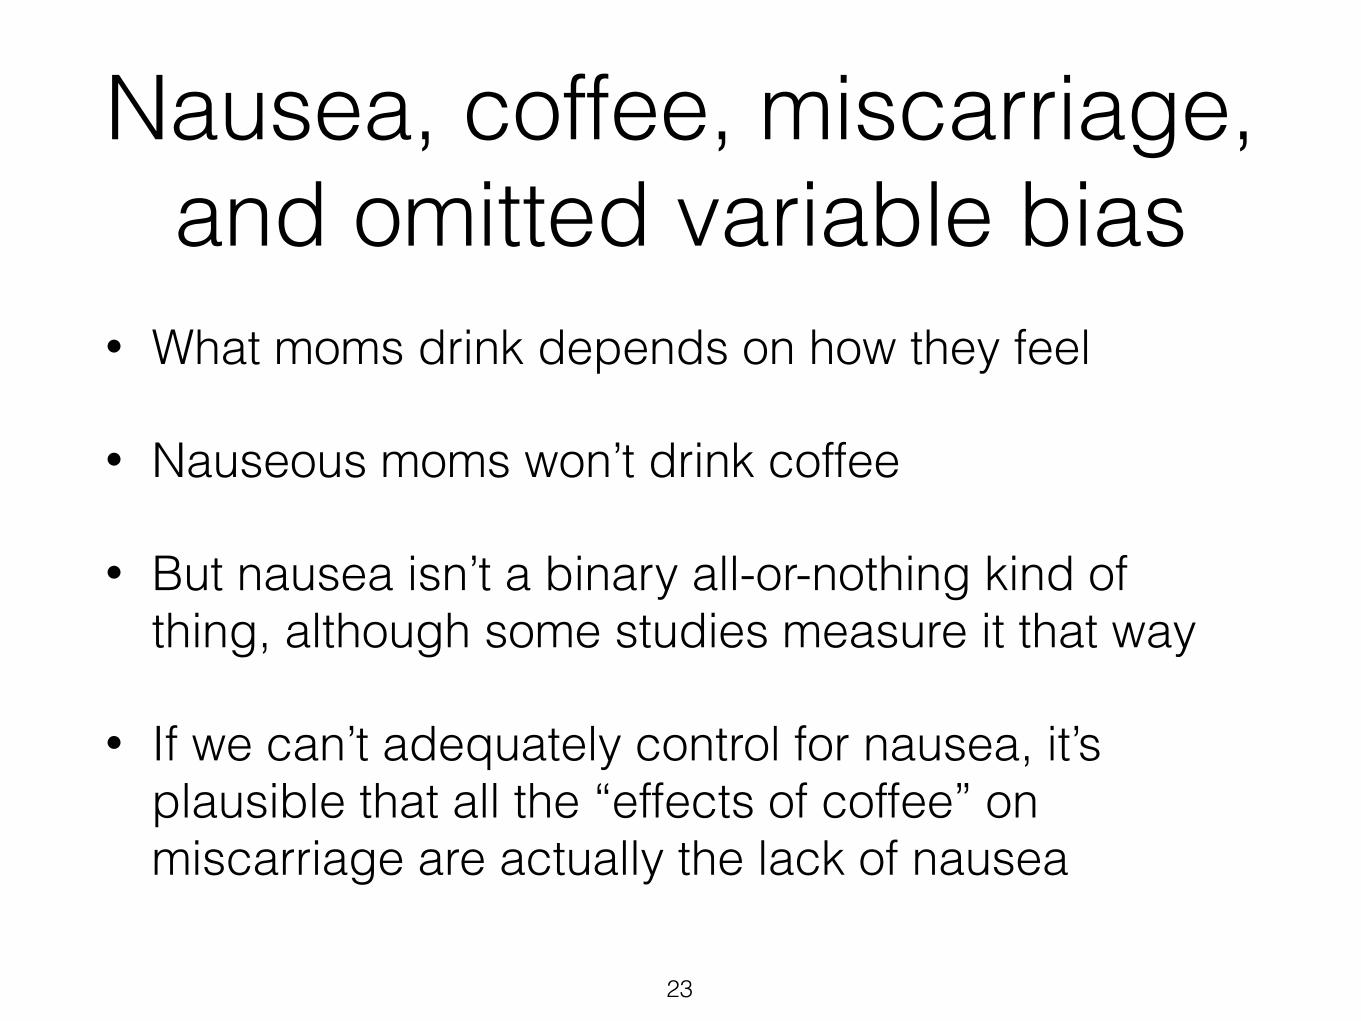
Nausea, coffee, miscarriage, and omitted variable bias
• What moms drink depends on how they feel
• Nauseous moms won’t drink coffee
• But nausea isn’t a binary all-or-nothing kind of thing, although some studies measure it that way
• If we can’t adequately control for nausea, it’s plausible that all the “effects of coffee” on miscarriage are actually the lack of nausea
23
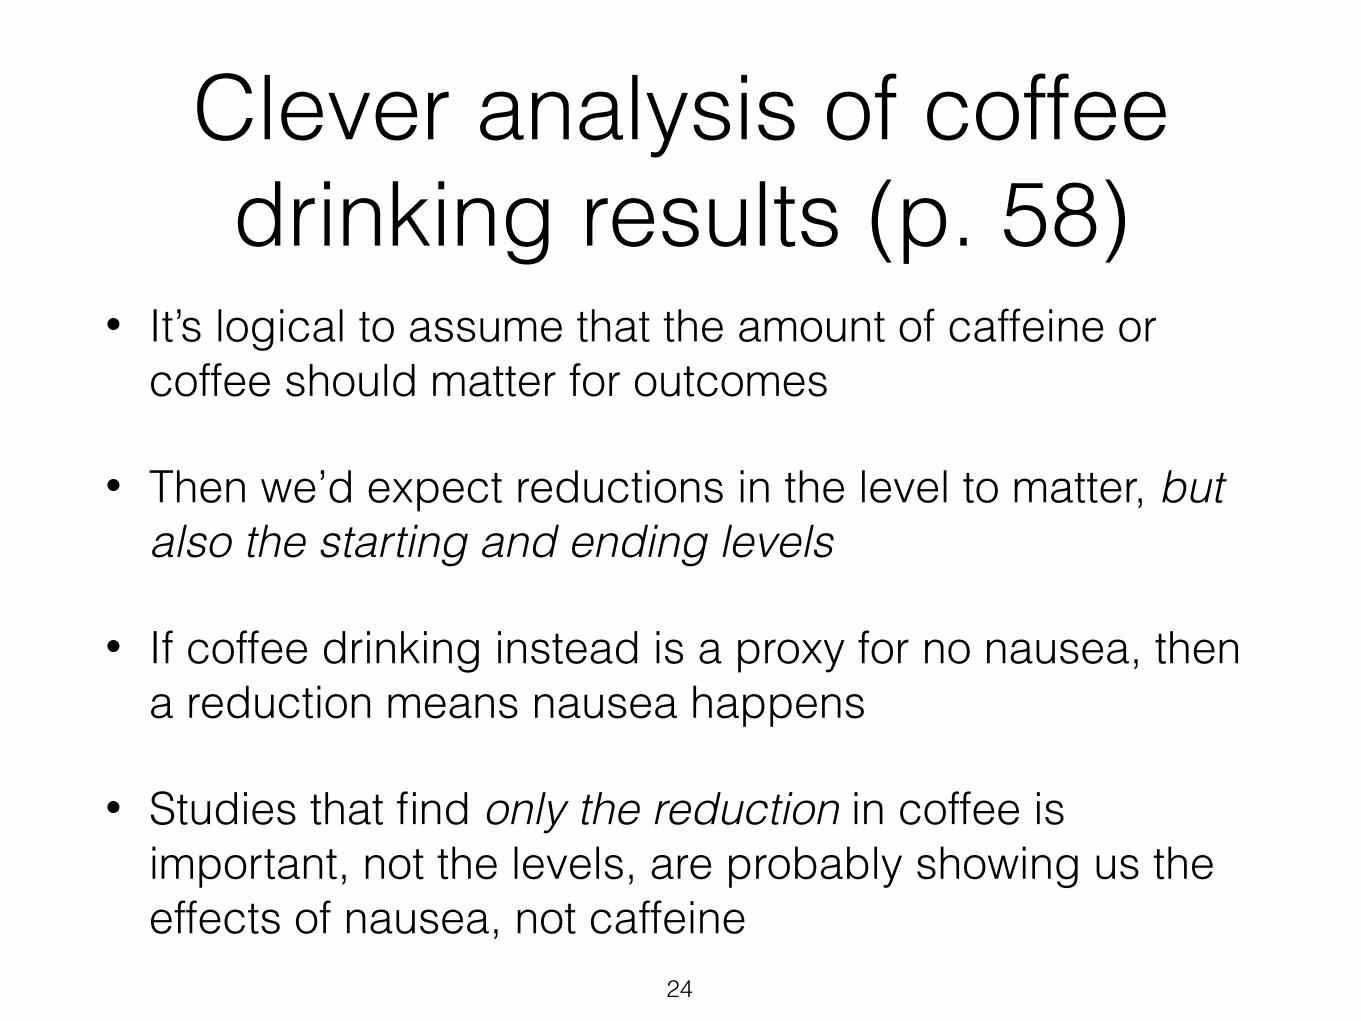
Clever analysis of coffee drinking results (p. 58)
• It’s logical to assume that the amount of caffeine or coffee should matter for outcomes
• Then we’d expect reductions in the level to matter, but also the starting and ending levels
• If coffee drinking instead is a proxy for no nausea, then a reduction means nausea happens
• Studies that find only the reduction in coffee is important, not the levels, are probably showing us the effects of nausea, not caffeine
24
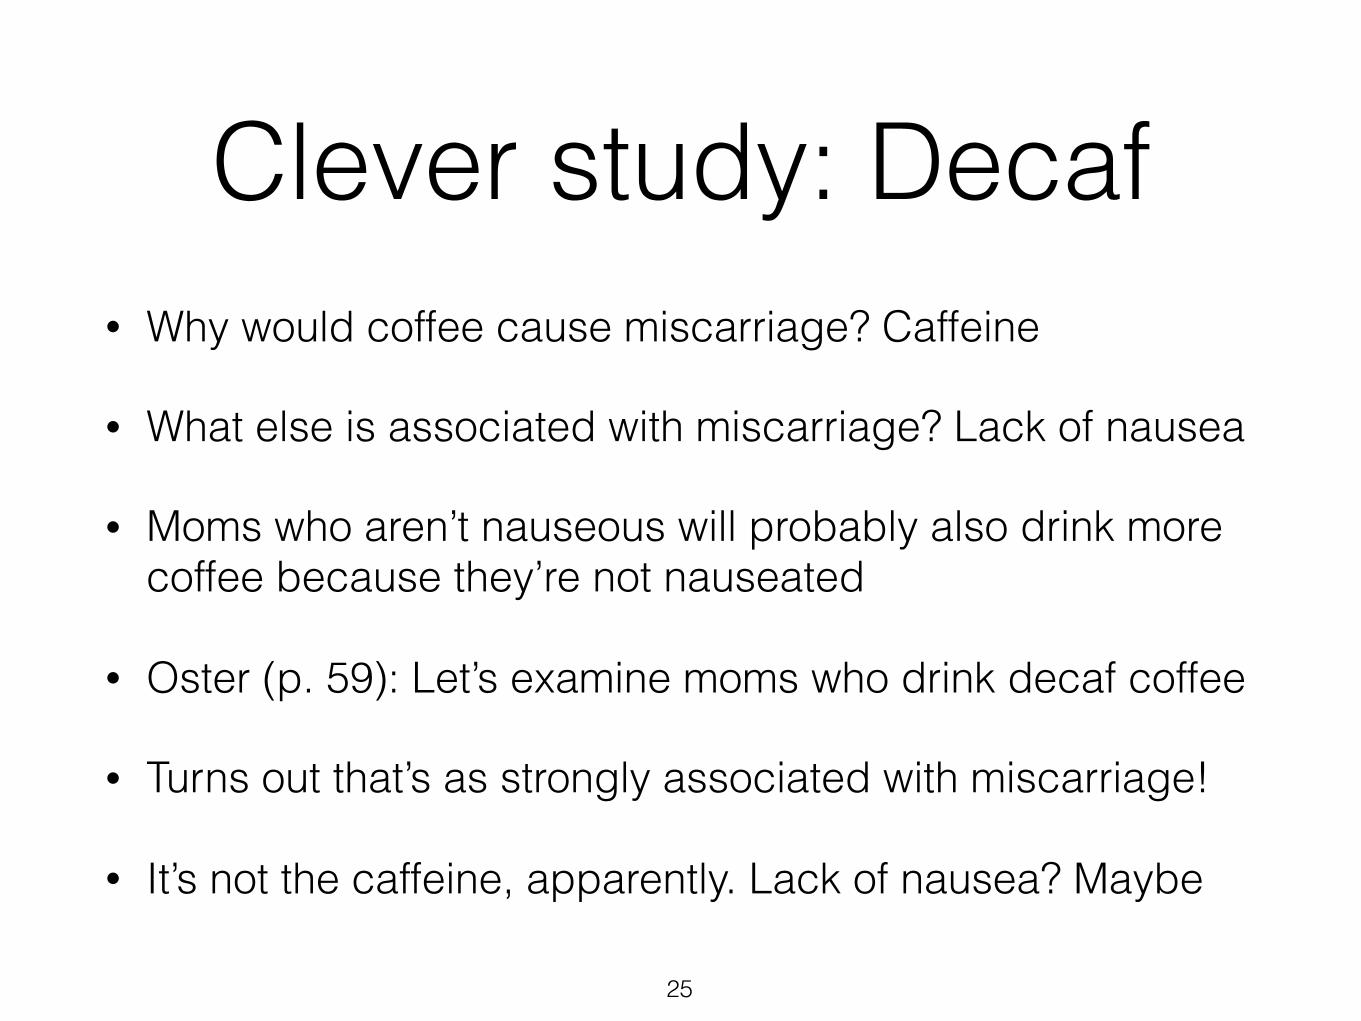
Clever study: Decaf• Why would coffee cause miscarriage? Caffeine
• What else is associated with miscarriage? Lack of nausea
• Moms who aren’t nauseous will probably also drink more coffee because they’re not nauseated
• Oster (p. 59): Let’s examine moms who drink decaf coffee
• Turns out that’s as strongly associated with miscarriage!
• It’s not the caffeine, apparently. Lack of nausea? Maybe
25

Danish RCT on caffeine! (Bech et al., BMJ 2007)
• Recruited of 1,207 pregnant women who reported 3+ cups of coffee per day
• Researchers asked them to replace with instant coffee, randomized between decaf and regular
• The study found no statistically significant differences in outcomes between control & treatment
• “Conclusion. A moderate reduction in caffeine intake in the second half of pregnancy has no effect on birth weight or length of gestation.”
26

Smoking & pregnancy• Oster “gets us” by starting off with a bunch of cross-
sectional associations between smoking and bad outcomes
• She knows that we’ll say, “what about omitted variables like the mother’s socioeconomic status?”
• Then she lowers the boom:
- Because smoking is (now) know to be bad,
- RCTs in which smoking moms are randomly chosen for smoking cessation programs exist
• (Only, ask yourself: Is a smoking mom in a program who then quits really the same as a never-smoking mom?)
27

Smoking is bad, m’kay• Not only is it bad to produce carbon
monoxide and absorb nicotine
• It’s also really hard to quit
• Oster cites treatment groups that drop from90% smoking to 80% smoking
• Average treatment effects are thus small because almost nobody successfully quits
• Scaled up, you’d get +14 oz of birth weight foractually quitting!
28
Smoking and weight (loss)• Navigate to our bCourses site
• In the Data folder, grab c8_r89smokeweight.csv(or the Excel version)
• Let’s look at two things:
- Compare the weight in kg (r8weight) of smokers (r8smoken == 1) and nonsmokers (r8smoken == 0)
- Examine the weights in waves 8 and 9 in kg of quitters (r8smoken == 1 and r9smoken == 0)
29