lululemon q1 2021 earnings infographic a4 final
TRANSCRIPT
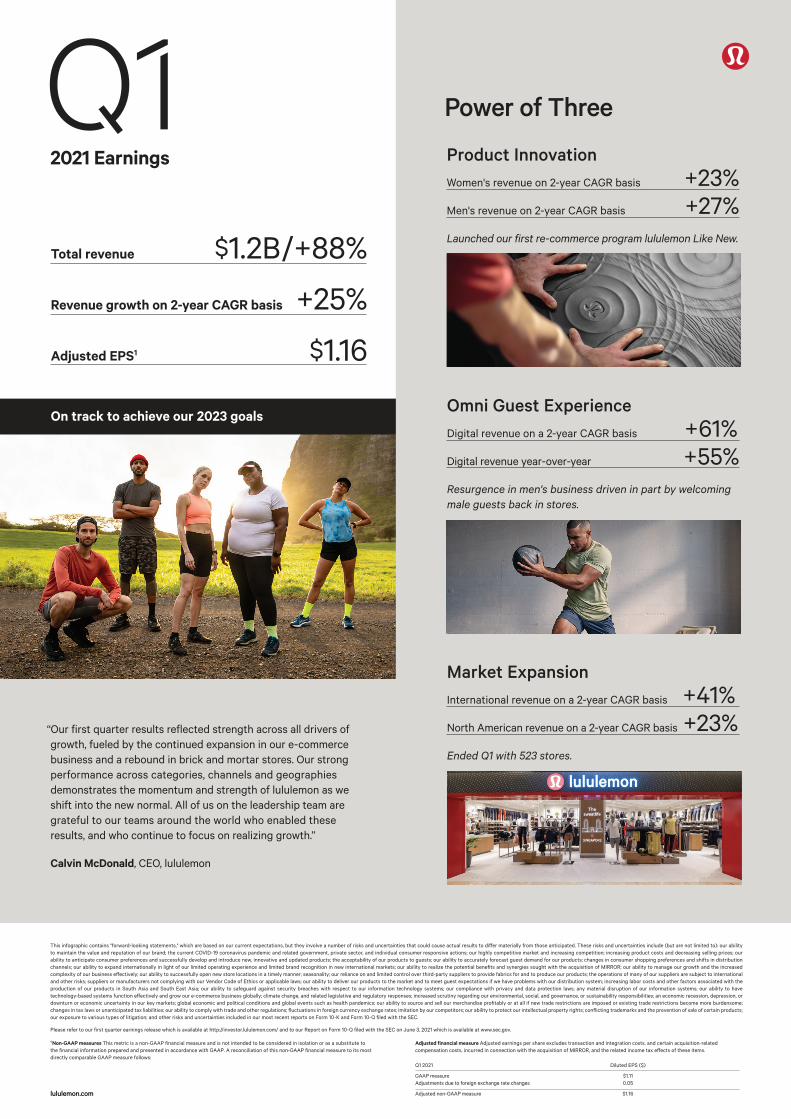
On track to achieve our 2023 goals
“Our first quarter results reflected strength across all drivers of growth, fueled by the continued expansion in our e-commerce business and a rebound in brick and mortar stores. Our strong performance across categories, channels and geographies demonstrates the momentum and strength of lululemon as we shift into the new normal. All of us on the leadership team are grateful to our teams around the world who enabled these results, and who continue to focus on realizing growth.”
Calvin McDonald, CEO, lululemon
Market ExpansionInternational revenue on a 2-year CAGR basis +41%North American revenue on a 2-year CAGR basis +23%Ended Q1 with 523 stores.
Omni Guest ExperienceDigital revenue on a 2-year CAGR basis +61%Digital revenue year-over-year +55%Resurgence in men's business driven in part by welcoming male guests back in stores.
Product InnovationWomen's revenue on 2-year CAGR basis +23%Men's revenue on 2-year CAGR basis +27%Launched our first re-commerce program lululemon Like New.
Power of Three
Please refer to our first quarter earnings release which is available at http://investor.lululemon.com/ and to our Report on Form 10-Q filed with the SEC on June 3, 2021 which is available at www.sec.gov.
This infographic contains "forward-looking statements," which are based on our current expectations, but they involve a number of risks and uncertainties that could cause actual results to di�er materially from those anticipated. These risks and uncertainties include (but are not limited to): our ability to maintain the value and reputation of our brand; the current COVID-19 coronavirus pandemic and related government, private sector, and individual consumer responsive actions; our highly competitive market and increasing competition; increasing product costs and decreasing selling prices; our ability to anticipate consumer preferences and successfully develop and introduce new, innovative and updated products; the acceptability of our products to guests; our ability to accurately forecast guest demand for our products; changes in consumer shopping preferences and shifts in distribution channels; our ability to expand internationally in light of our limited operating experience and limited brand recognition in new international markets; our ability to realize the potential benefits and synergies sought with the acquisition of MIRROR; our ability to manage our growth and the increased complexity of our business e�ectively; our ability to successfully open new store locations in a timely manner; seasonality; our reliance on and limited control over third-party suppliers to provide fabrics for and to produce our products; the operations of many of our suppliers are subject to international and other risks; suppliers or manufacturers not complying with our Vendor Code of Ethics or applicable laws; our ability to deliver our products to the market and to meet guest expectations if we have problems with our distribution system; increasing labor costs and other factors associated with the production of our products in South Asia and South East Asia; our ability to safeguard against security breaches with respect to our information technology systems; our compliance with privacy and data protection laws; any material disruption of our information systems; our ability to have technology-based systems function e�ectively and grow our e-commerce business globally; climate change, and related legislative and regulatory responses; increased scrutiny regarding our environmental, social, and governance, or sustainability responsibilities; an economic recession, depression, or downturn or economic uncertainty in our key markets; global economic and political conditions and global events such as health pandemics; our ability to source and sell our merchandise profitably or at all if new trade restrictions are imposed or existing trade restrictions become more burdensome; changes in tax laws or unanticipated tax liabilities; our ability to comply with trade and other regulations; fluctuations in foreign currency exchange rates; imitation by our competitors; our ability to protect our intellectual property rights; conflicting trademarks and the prevention of sale of certain products; our exposure to various types of litigation; and other risks and uncertainties included in our most recent reports on Form 10-K and Form 10-Q filed with the SEC.
lululemon.com
1 Non-GAAP measures This metric is a non-GAAP financial measure and is not intended to be considered in isolation or as a substitute to the financial information prepared and presented in accordance with GAAP. A reconciliation of this non-GAAP financial measure to its most directly comparable GAAP measure follows:
Adjusted financial measure Adjusted earnings per share excludes transaction and integration costs, and certain acquisition-related compensation costs, incurred in connection with the acquisition of MIRROR, and the related income tax e�ects of these items.
Q1 2021
GAAP measure Adjustments due to foreign exchange rate changes
Adjusted non-GAAP measure
Diluted EPS ($)
$1.110.05
$1.16
$1.2B/+88%Total revenue
+25%Revenue growth on 2-year CAGR basis
$1.16Adjusted EPS1
Q12021 Earnings