macroeconomic, trade and investment … trade and investment aggreagate, 2014 share of tourist...
TRANSCRIPT
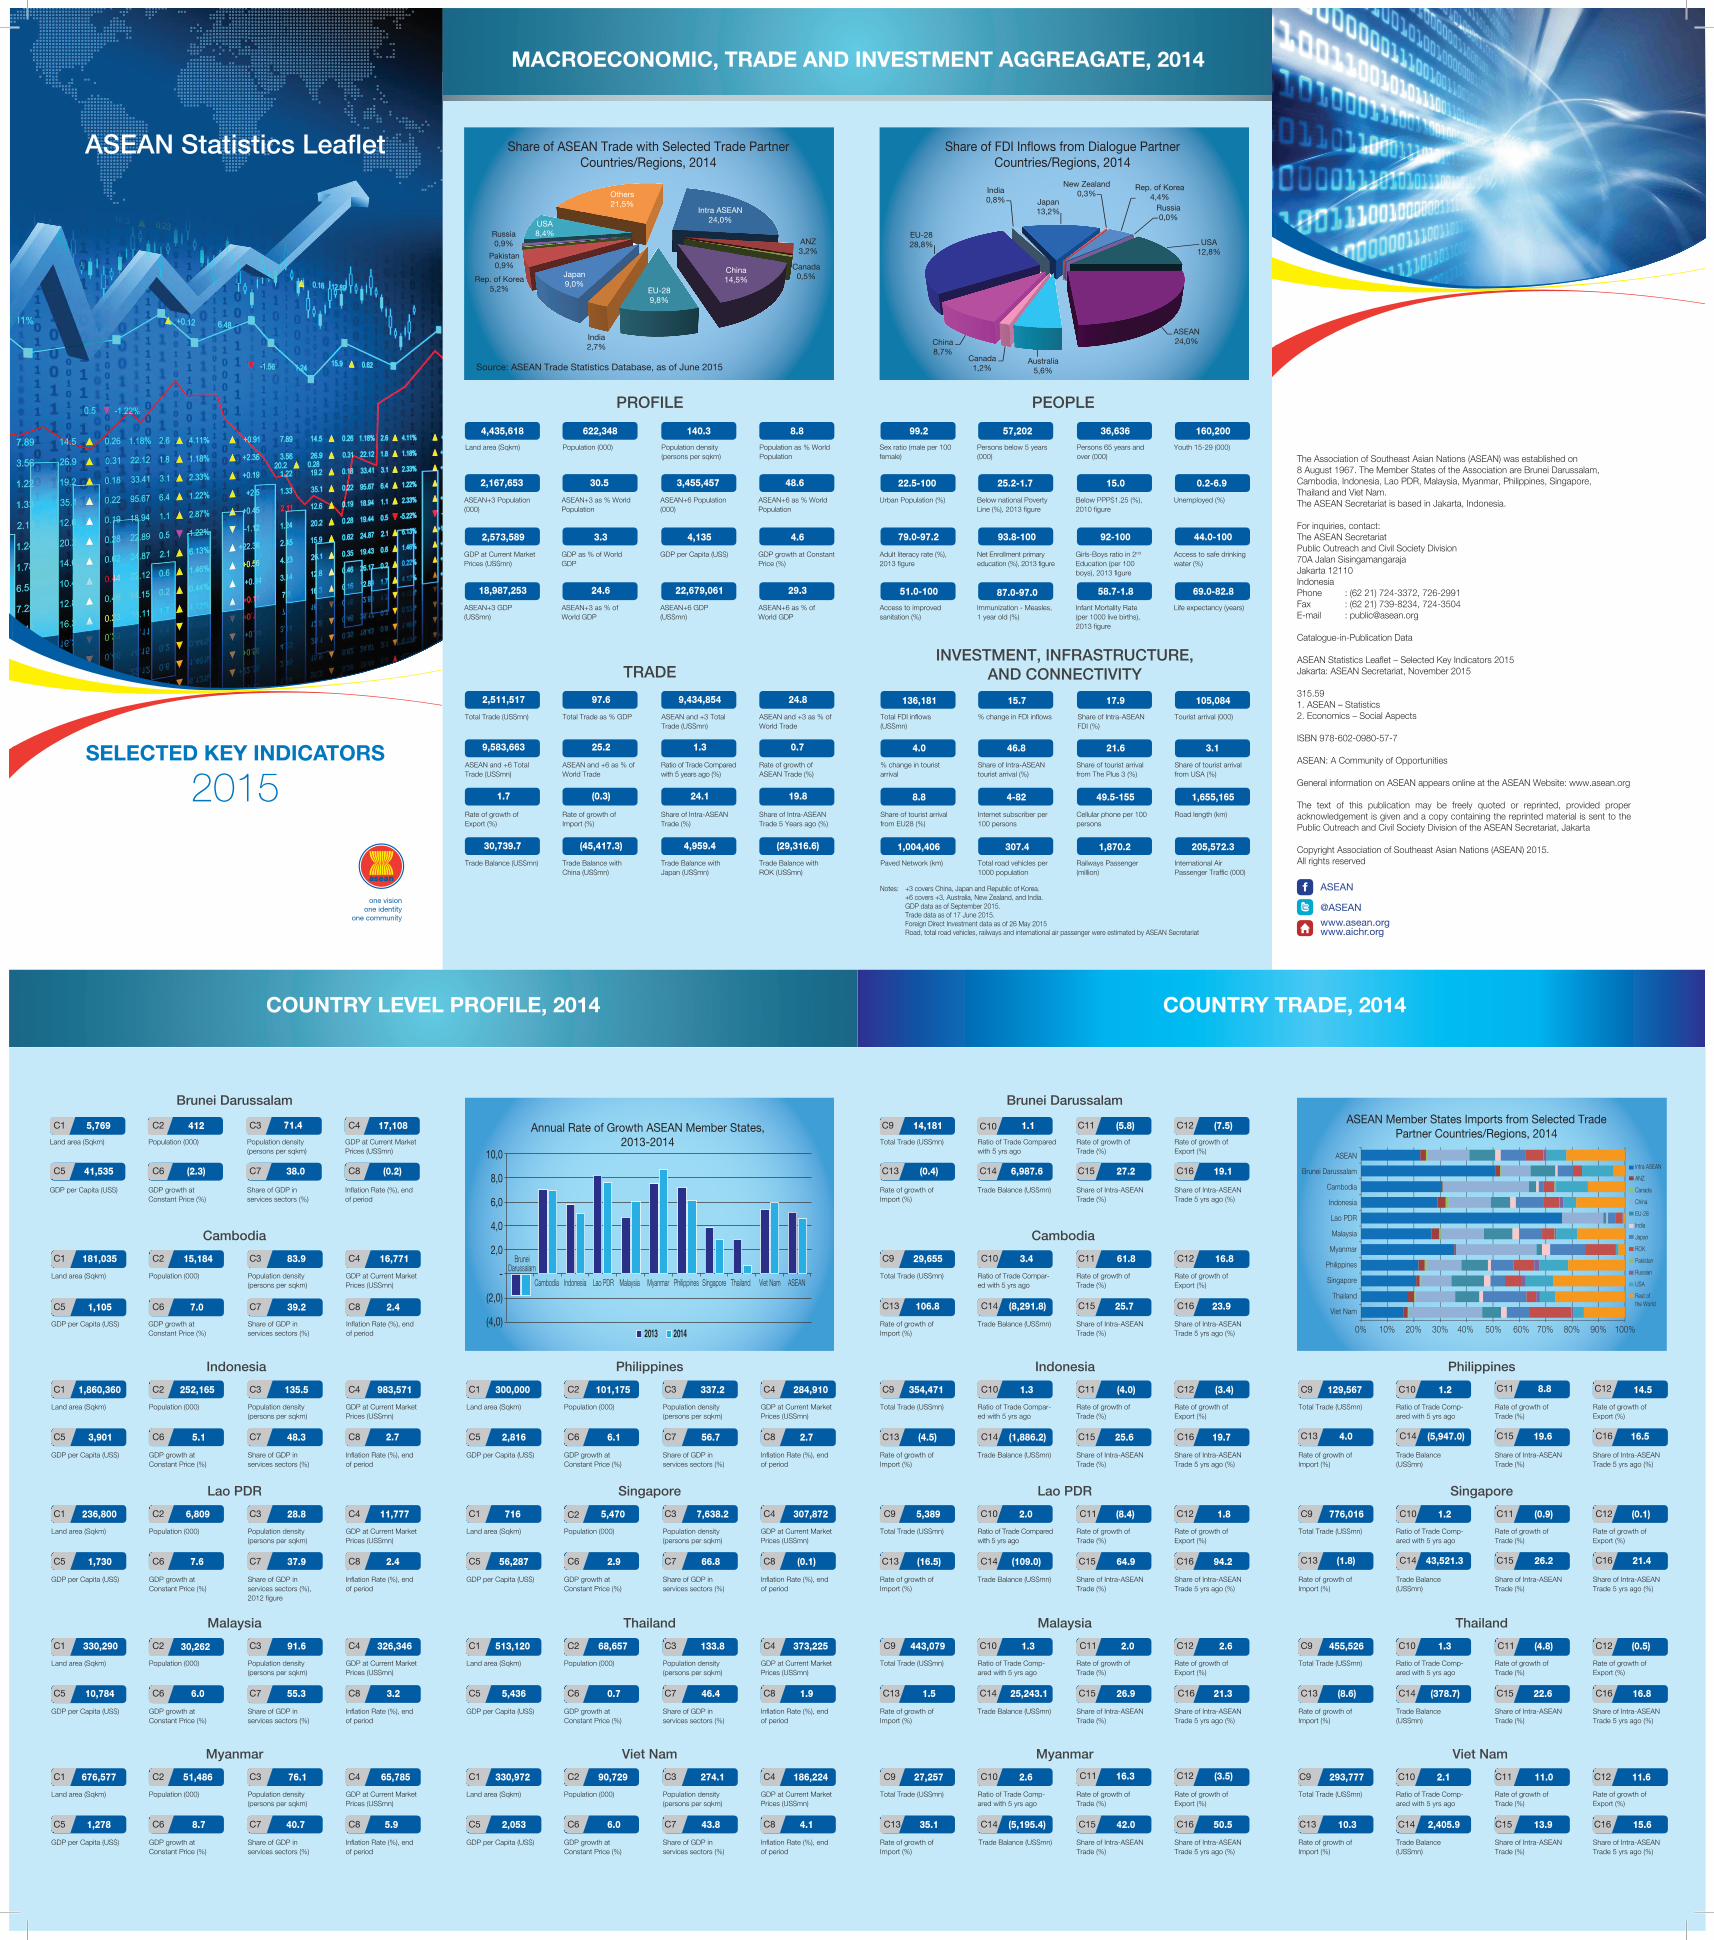
EU-2828,8%
India0,8% Japan
13,2%
New Zealand0,3%
Rep. of Korea4,4%
Russia0,0%
USA12,8%
ASEAN24,0%
Australia5,6%
Canada1,2%
China8,7%
one vision one identity
one community
PROFILE
Land area (Sqkm)
4,435,618
Population (000)
622,348
ASEAN+3 Population (000)
2,167,653
ASEAN+3 as % World Population
30.5
GDP at Current Market Prices (US$mn)
2,573,589
GDP as % of World GDP
3.3
ASEAN+3 GDP (US$mn)
18,987,253
ASEAN+3 as % of World GDP
24.6
Population density (persons per sqkm)
140.3
ASEAN+6 Population (000)
3,455,457
GDP per Capita (US$)
4,135
ASEAN+6 GDP (US$mn)
22,679,061
Population as % World Population
8.8
ASEAN+6 as % World Population
48.6
GDP growth at Constant Price (%)
4.6
ASEAN+6 as % of World GDP
29.3
TRADE
Total Trade (US$mn)
2,511,517
Total Trade as % GDP
97.6
ASEAN and +6 Total Trade (US$mn)
9,583,663
ASEAN and +6 as % of World Trade
25.2
Rate of growth of Export (%)
1.7
Rate of growth of Import (%)
(0.3)
Trade Balance (US$mn)
30,739.7
Trade Balance with China (US$mn)
(45,417.3)
ASEAN and +3 Total Trade (US$mn)
9,434,854
Ratio of Trade Compared with 5 years ago (%)
1.3
Share of Intra-ASEAN Trade (%)
24.1
Trade Balance with Japan (US$mn)
4,959.4
ASEAN and +3 as % of World Trade
24.8
Rate of growth of ASEAN Trade (%)
0.7
Share of Intra-ASEAN Trade 5 Years ago (%)
19.8
Trade Balance with ROK (US$mn)
(29,316.6)
Access to improved sanitation (%)
Immunization - Measles, 1 year old (%)
Infant Mortality Rate (per 1000 live births), 2013 figure
Life expectancy (years)
Access to safe drinking water (%)
PEOPLE
Sex ratio (male per 100 female)
99.2
Persons below 5 years (000)
57,202
Urban Population (%)
22.5-100
Below national Poverty Line (%), 2013 figure
25.2-1.7
Adult literacy rate (%), 2013 figure
79.0-97.2
Net Enrollment primary education (%), 2013 figure
93.8-100
51.0-100 87.0-97.0
Persons 65 years and over (000)
36,636
Below PPP$1.25 (%), 2010 figure
15.0
Girls-Boys ratio in 2nd Education (per 100 boys), 2013 figure
92-100
58.7-1.8
Youth 15-29 (000)
160,200
Unemployed (%)
0.2-6.9
44.0-100
69.0-82.8
Brunei Darussalam
Cambodia
Indonesia Philippines
Lao PDR Singapore
Malaysia
Myanmar Viet Nam
Total Trade (US$mn)
14,181
Ratio of Trade Compared with 5 yrs ago
1.1
Rate of growth of Import (%)
(0.4)
Trade Balance (US$mn)
6,987.6 C13 C14 C15 C16
C9 C10 C11 C12
Rate of growth of Trade (%)
(5.8)
Share of Intra-ASEAN Trade (%)
27.2
Rate of growth of Export (%)
(7.5)
Share of Intra-ASEAN Trade 5 yrs ago (%)
19.1
Total Trade (US$mn)Land area (Sqkm)
Total Trade (US$mn)Land area (Sqkm)
Total Trade (US$mn)
Total Trade (US$mn)Land area (Sqkm)
354,471 300,000
5,389 716
443,079
27,257 330,972
Ratio of Trade Compar-ed with 5 yrs ago
Population (000)
Ratio of Trade Compared with 5 yrs ago
Population (000)
Ratio of Trade Comp-ared with 5 yrs ago
Ratio of Trade Comp-ared with 5 yrs ago
Population (000)
1.3 101,175
2.0 5,470
1.3
2.6 90,729
Rate of growth of Import (%)
Rate of growth of Import (%)
GDP per Capita (US$)
Rate of growth of Import (%)
GDP per Capita (US$)
Rate of growth of Import (%)
Rate of growth of Import (%)
GDP per Capita (US$)
106.8
(4.5) 2,816
(16.5) 56,287
1.5
35.1 2,053
Trade Balance (US$mn)
Trade Balance (US$mn)GDP growth at Constant Price (%)
Trade Balance (US$mn)GDP growth at Constant Price (%)
Trade Balance (US$mn)
Trade Balance (US$mn)GDP growth at Constant Price (%)
(8,291.8)
(1,886.2) 6.1
(109.0) 2.9
25,243.1
(5,195.4) 6.0
C13
C13C5
C13C5
C13
C13C5
C14
C14C6
C14C6
C14
C14C6
C15
C15C7
C15C7
C15
C15C7
C16
C16C8
C16C8
C16
C16C8
C9C1
C9C1
C9
C9C1
C10C2
C10C2
C10
C10C2
C11C3
C11C3
C11
C11C3
C12C4
C12C4
C12
C12C4
Rate of growth of Trade (%)
Population density (persons per sqkm)
Rate of growth of Trade (%)
Population density (persons per sqkm)
Rate of growth of Trade (%)
Rate of growth of Trade (%)
Population density (persons per sqkm)
(4.0) 337.2
(8.4) 7,638.2
2.0
16.3 274.1
Share of Intra-ASEAN Trade (%)
Share of Intra-ASEAN Trade (%)
Share of GDP in services sectors (%)
Share of Intra-ASEAN Trade (%)
Share of GDP in services sectors (%)
Share of Intra-ASEAN Trade (%)
Share of Intra-ASEAN Trade (%)
Share of GDP in services sectors (%)
25.7
25.6 56.7
64.9 66.8
26.9
42.0 43.8
Rate of growth of Export (%)
GDP at Current Market Prices (US$mn)
Rate of growth of Export (%)
GDP at Current Market Prices (US$mn)
Rate of growth of Export (%)
Rate of growth of Export (%)
GDP at Current Market Prices (US$mn)
Total Trade (US$mn)
29,655
Ratio of Trade Compar- ed with 5 yrs ago
3.4 C9 C10 C11 C12
Rate of growth of Trade (%)
61.8
Rate of growth of Export (%)
16.8
(3.4) 284,910
1.8 307,872
2.6
(3.5) 186,224
Share of Intra-ASEAN Trade 5 yrs ago (%)
Share of Intra-ASEAN Trade 5 yrs ago (%)
Inflation Rate (%), end of period
Share of Intra-ASEAN Trade 5 yrs ago (%)
Inflation Rate (%), end of period
Share of Intra-ASEAN Trade 5 yrs ago (%)
Share of Intra-ASEAN Trade 5 yrs ago (%)
Inflation Rate (%), end of period
23.9
19.7 2.7
94.2 (0.1)
21.3
Thailand
Land area (Sqkm)
513,120
Population (000)
68,657
GDP per Capita (US$)
5,436
GDP growth at Constant Price (%)
0.7 C5 C6 C7 C8
C1 C2 C3 C4
Population density (persons per sqkm)
133.8
Share of GDP in services sectors (%)
46.4
GDP at Current Market Prices (US$mn)
373,225
Inflation Rate (%), end of period
1.9
Brunei Darussalam
Land area (Sqkm)
5,769
Population (000)
412
GDP per Capita (US$)
41,535
GDP growth at Constant Price (%)
(2.3)C5 C6 C7 C8
C1 C2 C3 C4
Population density (persons per sqkm)
71.4
Share of GDP in services sectors (%)
38.0
GDP at Current Market Prices (US$mn)
17,108
Inflation Rate (%), end of period
(0.2)
Cambodia
Land area (Sqkm)
181,035
Population (000)
15,184
GDP per Capita (US$)
1,105
GDP growth at Constant Price (%)
7.0 C5 C6 C7 C8
C1 C2 C3 C4
Population density (persons per sqkm)
83.9
Share of GDP in services sectors (%)
39.2
GDP at Current Market Prices (US$mn)
16,771
Inflation Rate (%), end of period
2.4
Indonesia
Land area (Sqkm)
1,860,360
Population (000)
252,165
GDP per Capita (US$)
3,901
GDP growth at Constant Price (%)
5.1 C5 C6 C7 C8
C1 C2 C3 C4
Population density (persons per sqkm)
135.5
Share of GDP in services sectors (%)
48.3
GDP at Current Market Prices (US$mn)
983,571
Inflation Rate (%), end of period
2.7
Lao PDR
Land area (Sqkm)
236,800
Population (000)
6,809
GDP per Capita (US$)
1,730
GDP growth at Constant Price (%)
7.6 C5 C6 C7 C8
C1 C2 C3 C4
Population density (persons per sqkm)
28.8
Share of GDP in services sectors (%), 2012 figure
37.9
GDP at Current Market Prices (US$mn)
11,777
Inflation Rate (%), end of period
2.4
Malaysia
Land area (Sqkm)
330,290
Population (000)
30,262
GDP per Capita (US$)
10,784
GDP growth at Constant Price (%)
6.0 C5 C6 C7 C8
C1 C2 C3 C4
Population density (persons per sqkm)
91.6
Share of GDP in services sectors (%)
55.3
GDP at Current Market Prices (US$mn)
326,346
Inflation Rate (%), end of period
3.2
Myanmar
Land area (Sqkm)
676,577
Population (000)
51,486
GDP per Capita (US$)
1,278
GDP growth at Constant Price (%)
8.7 C5 C6 C7 C8
C1 C2 C3 C4
Population density (persons per sqkm)
76.1
Share of GDP in services sectors (%)
40.7
GDP at Current Market Prices (US$mn)
65,785
Inflation Rate (%), end of period
5.9 50.5 4.1
Philippines
Singapore
Total Trade (US$mn)
Total Trade (US$mn)
129,567
776,016
Ratio of Trade Comp-ared with 5 yrs ago
Ratio of Trade Comp-ared with 5 yrs ago
1.2
1.2
Rate of growth of Import (%)
Rate of growth of Import (%)
4.0
(1.8)
Trade Balance (US$mn)
Trade Balance (US$mn)
(5,947.0)
43,521.3
C13
C13
C14
C14
C15
C15
C16
C16
C9
C9
C10
C10
C11
C11
C12
C12
Rate of growth of Trade (%)
Rate of growth of Trade (%)
8.8
(0.9)
Share of Intra-ASEAN Trade (%)
Share of Intra-ASEAN Trade (%)
19.6
26.2
Rate of growth of Export (%)
Rate of growth of Export (%)
14.5
(0.1)
Share of Intra-ASEAN Trade 5 yrs ago (%)
Share of Intra-ASEAN Trade 5 yrs ago (%)
16.5
21.4
Thailand
Total Trade (US$mn)
455,526
Ratio of Trade Comp-ared with 5 yrs ago
1.3
Rate of growth of Import (%)
(8.6)
Trade Balance (US$mn)
(378.7)C13 C14 C15 C16
C9 C10 C11 C12
Rate of growth of Trade (%)
(4.8)
Share of Intra-ASEAN Trade (%)
22.6
Rate of growth of Export (%)
(0.5)
Share of Intra-ASEAN Trade 5 yrs ago (%)
16.8
Viet Nam
Total Trade (US$mn)
293,777
Ratio of Trade Comp-ared with 5 yrs ago
2.1
Rate of growth of Import (%)
10.3
Trade Balance (US$mn)
2,405.9 C13 C14 C15 C16
C9 C10 C11 C12
Rate of growth of Trade (%)
11.0
Share of Intra-ASEAN Trade (%)
13.9
Rate of growth of Export (%)
11.6
Share of Intra-ASEAN Trade 5 yrs ago (%)
15.6
COUNTRY TRADE, 2014
MACROECONOMIC, TRADE AND INVESTMENT AGGREAGATE, 2014
Share of tourist arrival from USA (%)
INVESTMENT, INFRASTRUCTURE, AND CONNECTIVITY
Total FDI inflows (US$mn)
136,181
% change in FDI inflows
15.7
% change in tourist arrival
4.0
Share of Intra-ASEAN tourist arrival (%)
46.8
Share of tourist arrival from EU28 (%)
8.8
Internet subscriber per 100 persons
4-82
Paved Network (km)
1,004,406
Total road vehicles per 1000 population
307.4
Share of Intra-ASEAN FDI (%)
17.9
Share of tourist arrival from The Plus 3 (%)
21.6
Cellular phone per 100 persons
49.5-155
Railways Passenger (million)
1,870.2
Tourist arrival (000)
105,084
3.1
Road length (km)
1,655,165
International Air Passenger Traffic (000)
205,572.3
Notes: +3 covers China, Japan and Republic of Korea. +6 covers +3, Australia, New Zealand, and India. GDP data as of September 2015. Trade data as of 17 June 2015. Foreign Direct Investment data as of 26 May 2015 Road, total road vehicles, railways and international air passenger were estimated by ASEAN Secretariat
COUNTRY LEVEL PROFILE, 2014
SELECTED KEY INDICATORS
2015
Share of FDI Inflows from Dialogue Partner Countries/Regions, 2014
Share of ASEAN Trade with Selected Trade Partner Countries/Regions, 2014
ASEAN Statistics Leaflet
The Association of Southeast Asian Nations (ASEAN) was established on 8 August 1967. The Member States of the Association are Brunei Darussalam, Cambodia, Indonesia, Lao PDR, Malaysia, Myanmar, Philippines, Singapore, Thailand and Viet Nam. The ASEAN Secretariat is based in Jakarta, Indonesia.
For inquiries, contact:The ASEAN SecretariatPublic Outreach and Civil Society Division70A Jalan SisingamangarajaJakarta 12110IndonesiaPhone : (62 21) 724-3372, 726-2991Fax : (62 21) 739-8234, 724-3504E-mail : [email protected]
Catalogue-in-Publication Data
ASEAN Statistics Leaflet – Selected Key Indicators 2015Jakarta: ASEAN Secretariat, November 2015
315.591. ASEAN – Statistics2. Economics – Social Aspects
ISBN 978-602-0980-57-7
ASEAN: A Community of Opportunities
General information on ASEAN appears online at the ASEAN Website: www.asean.org
The text of this publication may be freely quoted or reprinted, provided proper acknowledgement is given and a copy containing the reprinted material is sent to the Public Outreach and Civil Society Division of the ASEAN Secretariat, Jakarta
Copyright Association of Southeast Asian Nations (ASEAN) 2015.All rights reserved
Source: ASEAN Trade Statistics Database, as of June 2015
@ASEAN
ASEAN
www.asean.orgwww.aichr.org
Annual Rate of Growth ASEAN Member States, 2013-2014
10,0
8,0
6,0
4,0
2,0
-
(2,0)
(4,0)
BruneiDarussalam
Cambodia Indonesia Lao PDR Malaysia Myanmar Philippines Singapore Thailand Viet Nam ASEAN
2013 2014
ASEAN Member States Imports from Selected Trade Partner Countries/Regions, 2014
Intra ASEAN
ANZ
Canada
China
EU-28
India
Japan
ROK
Pakistan
Russian
USA
Rest of the World
0% 10% 20% 30% 40% 50% 60% 70% 80% 90% 100%
Russia0,9%
Pakistan0,9%
Rep. of Korea5,2% EU-28
9,8%
Japan9,0%
USA8,4%
Others21,5%
Intra ASEAN24,0%
ANZ3,2%
Canada0,5%
China14,5%
India2,7%
ASEAN
Brunei Darussalam
Cambodia
Indonesia
Lao PDR
Malaysia
Myanmar
Philippines
Singapore
Thailand
Viet Nam

Singapore1/
Sex ratio (male per 100 female)
96.7 Persons below 5 (000)
181.4 C18 C19 C20
Persons 65 and over (000)
431.6 Youth 15-29 (000)
776.9
Urban Population (%)
100.0 Below national Poverty Line (%)
NA C22 C23 C24
Below PPP$1.25 (%)
NA Unemployed (%)
2.0
Adult literacy rate (%)
96.7 Net Enrollment primary education (%)
100.0 C26 C27 C28
Girls-Boys ratio in 2nd Education (per 100 boys)
98.0 Access to safe drinking water (%)
100.0
Access to improved sanitation (%)
100.0 Immunization - Measles, 2 year old (%)
94.0 C30 C31 C32
Infant Mortality Rate (per 1000 live births)
1.8 Life expectancy (years)
82.8
Note:1/ Singapore population by age-group is for Singapore Resident population
Lao PDR
Sex ratio (male per 100 female)
100.0 Persons below 5 (000)
957.6 C17 C18 C19 C20
Persons 65 and over (000)
249.9 Youth 15-29 (000)
2,019.1
Urban Population (%)
38.0Below national Poverty Line (%), 2013 figure
23.2 C21 C22 C23 C24
Below PPP$1.25 (%), 2010 figure
31.0 Unemployed (%) - 2010 figure
1.9
Adult literacy rate (%), 2013 figure
79.0 Net Enrollment primary education (%), 2012 figure
95.2 C25 C26 C27 C28
Girls-Boys ratio in 2nd Education (per 100 boys), 2011 figure
58.4 Access to safe drinking water (%), 2012 figure
70.0
Access to improved sanitation (%), 2012 figure
62.0 Immunization - Measles, 1 year old (%)
87.0 C29 C30 C31 C32
Infant Mortality Rate (per 1000 live births), 2013 figure
58.7 Life expectancy (years),
65.4
Myanmar
Sex ratio (male per 100 female)
93.1 Persons below 5 (000)
4,843.3 C17 C18 C19 C20
Persons 65 and over (000)
3,020.3 Youth 15-29 (000)
13,923.6
Urban Population (%)
30.8 Below national Poverty Line (%), 2011 figure
23.6 C21 C22 C23 C24
Below PPP$1.25 (%)
NA Unemployed (%)
4.0
Adult literacy rate (%)
89.5Net Enrollment primary education (%), 2013 figure
86.4 C25 C26 C27 C28
Girls-Boys ratio in 2nd Education (per 100 boys)
92.9 Access to safe drinking water (%)
69.5
Access to improved sanitation (%)
74.3 Immunization - Measles, 1 year old (%)
86.0 C29 C30 C31 C32
Infant Mortality Rate (per 1000 live births)
24.3 Life expectancy (years) (p)
69.0
Brunei Darussalam
Total FDI inflows (US$mn)
568 % change in FDI inflows (%)
(21.7)C33 C34 C35 C36
Share of Intra-ASEAN FDI (%)
24.9 Tourist arrival (000)
3,886
% change in tourist arrival
18.5Share of Intra-ASEAN tourist arrival (%)
94.3 C37 C38 C39 C40
Share of tourist arrival from The Plus 3 (%)
1.4 Share of tourist arrival from USA (%)
0.2
Share of tourist arrival from EU28 (%)
2 Internet subscriber per 100 persons
69C41 C42 C43 C44
Cellular phone per 100 persons
110Road length (km), 2012 figure
2,909
Paved Network (km), 2012 figure
2,707.0Total road vehicles per 1000 population, 2011 figure
376.7 C45 C46 C47 C48
Railways Passenger (million)
NA International Air Passenger Traffic (000), 2011 figure
2,017.0
Indonesia
Total FDI inflows (US$mn)
22,276 % change in FDI inflows (%)
20.8 C33 C34 C35 C36
Share of Intra-ASEAN FDI (%)
60.4 Tourist arrival (000)
9,435
% change in tourist arrival
7.2 Share of Intra-ASEAN tourist arrival (%)
39.0 C37 C38 C39 C40
Share of tourist arrival from The Plus 3 (%)
19.3 Share of tourist arrival from USA (%)
2.7
Share of tourist arrival from EU28 (%)
11 Internet subscriber per 100 persons
17C41 C42 C43 C44
Cellular phone per 100 persons
126Road length (km)
508,000
Paved Network (km)
287,926Total road vehicles per 1000 population
447.6 C45 C46 C47 C48
Railways Passenger (million)
277.7 International Air Passenger Traffic (000)
10,253
Singapore
Total FDI inflows (US$mn)
72,098.3 % change in FDI inflows (%)
28.4 C33 C34 C35 C36
Share of Intra-ASEAN FDI (%)
6.3 Tourist arrival (000)
15,095.2
% change in tourist arrival
(3.0)Share of Intra-ASEAN tourist arrival (%)
40.5 C37 C38 C39 C40
Share of tourist arrival from The Plus 3 (%)
20.4 Share of tourist arrival from USA (%)
3.2
Share of tourist arrival from EU28 (%)
8.4 Internet subscriber per 100 persons
82C41 C42 C43 C44
Cellular phone per 100 persons
148Road length (km)
3,496.0
Paved Network (km)
3,496.0 Total road vehicles per 1000 population
177.7 C45 C46 C47 C48
Railways Passenger (million)
1,058.5 International Air Passenger Traffic (000)
53,288
Cambodia
Total FDI inflows (US$mn)
1,727 % change in FDI inflows (%)
35.4 C33 C34 C35 C36
Share of Intra-ASEAN FDI (%)
21.6 Tourist arrival (000)
4,503
% change in tourist arrival
7.0 Share of Intra-ASEAN tourist arrival (%)
44.2 C37 C38 C39 C40
Share of tourist arrival from The Plus 3 (%)
26.7 Share of tourist arrival from USA (%)
4.2
Share of tourist arrival from EU28 (%)
12 Internet subscriber per 100 persons
9C41 C42 C43 C44
Cellular phone per 100 persons
155Road length (km), 2013 figure
51,404
Paved Network (km), 2013 figure
5,619.0Total road vehicles per 1000 population, 2013 figure
18.9 C45 C46 C47 C48
Railways Passenger (million)
-International Air Passenger Traffic (000), 2012 figure
3,997.0
Lao PDR
Total FDI inflows (US$mn)
913 % change in FDI inflows (%)
114 C33 C34 C35 C36
Share of Intra-ASEAN FDI (%)
15.1 Tourist arrival (000)
4,159
% change in tourist arrival
10.0Share of Intra-ASEAN tourist arrival (%)
77.5 C37 C38 C39 C40
Share of tourist arrival from The Plus 3 (%)
13.5 Share of tourist arrival from USA (%)
1.5
Share of tourist arrival from EU28 (%)
4 Internet subscriber per 100 persons
14C41 C42 C43 C44
Cellular phone per 100 persons
67Road length (km)
51,596
Paved Network (km)
8,272Total road vehicles per 1000 population
231.6 C45 C46 C47 C48
Railways Passenger (million)
0.4 International Air Passenger Traffic (000)
921.2
Myanmar
Total FDI inflows (US$mn)
946.2 % change in FDI inflows (%)
(63.9)C33 C34 C35 C36
Share of Intra-ASEAN FDI (%)
72.2 Tourist arrival (000), Jan-July Figure
3,081.4
% change in tourist arrival
242.3 Share of Intra-ASEAN tourist arrival (%)
51.9 C37 C38 C39 C40
Share of tourist arrival from The Plus 3 (%)
30.9 Share of tourist arrival from USA (%)
2.0
Share of tourist arrival from EU28 (%)
5.8 Internet subscriber per 100 persons
4C41 C42 C43 C44
Cellular phone per 100 persons
49Road length (km), 2013 figure
164,969
Paved Network (km), 2013 figure
39,076 Total road vehicles per 1000 population
95.3 C45 C46 C47 C48
Railways Passenger (million)
49.5 International Air Passenger Traffic (000)
3,187
Thailand
Total FDI inflows (US$mn)
11,537.9 % change in FDI inflows (%)
(11.2)C33 C34 C35 C36
Share of Intra-ASEAN FDI (%)
5.7 Tourist arrival (000)
24,779.8
% change in tourist arrival
(6.7)Share of Intra-ASEAN tourist arrival (%)
26.7 C37 C38 C39 C40
Share of tourist arrival from The Plus 3 (%)
28.3 Share of tourist arrival from USA (%)
3.1
Share of tourist arrival from EU28 (%)
14.9 Internet subscriber per 100 persons
35C41 C42 C43 C44
Cellular phone per 100 persons
144Road length (km), 2013 figures
231,735.6
Paved Network (km), 2013 figures
192,712.4 Total road vehicles per 1000 population, 2013 figures
491.1 C45 C46 C47 C48
Railways Passenger (million), 2013 figures
37.3 International Air Passenger Traffic (000)
52,130.8
Malaysia
Total FDI inflows (US$mn)
10,714.0 % change in FDI inflows (%)
(12.9)C33 C34 C35 C36
Share of Intra-ASEAN FDI (%)
25.9 Tourist arrival (000)
27,437.3
% change in tourist arrival
6.7 Share of Intra-ASEAN tourist arrival (%)
74.3 C37 C38 C39 C40
Share of tourist arrival from The Plus 3 (%)
9.3 Share of tourist arrival from USA (%)
1.0
Share of tourist arrival from EU28 (%)
4.0 Internet subscriber per 100 persons
68C41 C42 C43 C44
Cellular phone per 100 persons
149Road length (km)
210,658
Paved Network (km)
165,088 Total road vehicles per 1000 population
814.6 C45 C46 C47 C48
Railways Passenger (million)
3.0 International Air Passenger Traffic (000)
40,762
Philippines
Total FDI inflows (US$mn)
6,200.5 % change in FDI inflows (%)
60.6 C33 C34 C35 C36
Share of Intra-ASEAN FDI (%)
1.3 Tourist arrival (000)
4,833.4
% change in tourist arrival
3.2 Share of Intra-ASEAN tourist arrival (%)
9.5 C37 C38 C39 C40
Share of tourist arrival from The Plus 3 (%)
42.1 Share of tourist arrival from USA (%)
15.0
Share of tourist arrival from EU28 (%)
8.3 Internet subscriber per 100 persons
40C41 C42 C43 C44
Cellular phone per 100 persons
111Road length (km)
32,526
Paved Network (km)
27,816 Total road road vehicles per 1000 population
79.9 C45 C46 C47 C48
Railways Passenger (million)
436.1 International Air Passenger Traffic (000)
19,914
Viet Nam
Total FDI inflows (US$mn)
9,200.1 % change in FDI inflows (%)
3.4 C33 C34 C35 C36
Share of Intra-ASEAN FDI (%)
16.8 Tourist arrival (000)
7,874.3
% change in tourist arrival
4.0 Share of Intra-ASEAN tourist arrival (%)
19.0 C37 C38 C39 C40
Share of tourist arrival from The Plus 3 (%)
43.7 Share of tourist arrival from USA (%)
5.6
Share of tourist arrival from EU28 (%)
9.9 Internet subscriber per 100 persons
48C41 C42 C43 C44
Cellular phone per 100 persons
147Road length (km), 2012 figure
326,000.0
Paved Network (km), 2012 figure
216,000.0 Total road road vehicles per 1000 population, 2012 figure
17.9 C45 C46 C47 C48
Railways Passenger (million), 2012 figure
11.8 International Air Passenger Traffic (000), 2012 figure
13,203.0
Philippines
Sex ratio (male per 100 female)
101.0 Persons below 5 (000)
11,306.2 C17 C18 C19 C20
Persons 65 and over (000)
4,811.8 Youth 15-29 (000)
27,749.1
Urban Population (%)
44.0 Below national Poverty Line (%), 2013 figure
25,2C21 C22 C23 C24
Below PPP$1.25 (%), 2010 figure
23.0 Unemployed (%)
6.7
Adult literacy rate (%),2008 figure
95.4 Net Enrollment primary education (%), 2013 figure
93.8 C25 C26 C27 C28
Girls-Boys ratio in 2nd Education (per 100 boys), 2013 figure
100.0 Access to safe drinking water (%), 2011 figure
82.7
Access to improved sanitation (%), 2011 figure
91.6 Immunization - Measles, 1 year old (%), 2013 figure
91.0 C29 C30 C31 C32
Infant Mortality Rate (per 1000 live births), 2013 figure
23.0 Life expectancy (years),2011 figure
70.4
Brunei Darussalam
Sex ratio (male per 100 female)
107.6 Persons below 5 (000)
32.4 C17 C18 C19 C20
Persons 65 and over (000)
16.7 Youth 15-29 (000)
110.2
Urban Population (%), 2012 figure
78.7 Below national Poverty Line (%)
NA C21 C22 C23 C24
Below PPP$ 1.25 (%)
NA Unemployed (%)
6.9
Adult literacy rate (%), 2013 figure
97.2 Net Enrollment primary education (%), 2010 figure
97.4 C25 C26 C27 C28
Girls-Boys ratio in 2nd Education (per 100 boys), 2012 figure
88.0 Access to safe drinking water (%), 2012 figure
100.0
Access to improved sanitation (%), 2012 figure
80.0 Immunization - Measles, 1 year old (%)
97.0 C29 C30 C31 C32
Infant Mortality Rate (per 1000 live births), 2013 figure
7.6 Life expectancy (years), 2013 figure
77.1
Cambodia
Sex ratio (male per 100 female)
96.0 Persons below 5 (000)
1,592.8 C17 C18 C19 C20
Persons 65 and over (000)
684.6 Youth 15-29 (000)
4,786.9
Urban Population (%)
22.5 Below national Poverty Line (%), 2013 figure
16.0 C21 C22 C23 C24
Below PPP$ 1.25 (%), 2010 figure
28.0 Unemployed (%)
0.2
Adult literacy rate (%), 2013 figure
80.7 Net Enrollment primary education (%), 2012 figure
97.0 C25 C26 C27 C28
Girls-Boys ratio in 2nd Education (per 100 boys), 2013 figure
94.0 Access to safe drinking water (%)
54.5
Access to improved sanitation (%)
55.9 Immunization - Measles, 1 year old (%)
94.0 C29 C30 C31 C32
Infant Mortality Rate (per 1000 live births), 2013 figure
33.0 Life expectancy (years), 2013 figure
66.6
Indonesia
Sex ratio (male per 100 female)
101.0 Persons below 5 (000)
24,086.8 C17 C18 C19 C20
Persons 65 and over (000)
13,274.2 Youth 15-29 (000)
64,093.4
Urban Population (%)
53.3 Below national Poverty Line (%)
11.0 C21 C22 C23 C24
Below PPP$1.25 (%), 2010 figure
16.0 Unemployed (%)
5.9
Adult literacy rate (%)
95.9 Net Enrollment primary education (%), 2013 figure
95.6 C25 C26 C27 C28
Girls-Boys ratio in 2nd Education (per 100 boys), 2012 figure
101.0 Access to safe drinking water (%)
44.0
Access to improved sanitation (%)
51.0 Immunization - Measles, 1 year old (%), 2013 figure
77.9 C29 C30 C31 C32
Infant Mortality Rate (per 1000 live births), 2013 figure
27.2 Life expectancy (years)
70.1
Malaysia
Sex ratio (male per 100 female)
106.3 Persons below 5 (000)
2,547.6 C17 C18 C19 C20
Persons 65 and over (000)
1,733.4 Youth 15-29 (000)
8,887.3
Urban Population (%)
74.0Below national Poverty Line (%), 2012 figure
1.7 C21 C22 C23 C24
Below PPP$1.25 (%), 2010 figure
0.0 Unemployed (%)
2.9
Adult literacy rate (%), 2013 figure
94.2 Net Enrollment primary education (%), 2013 figure
97.3 C25 C26 C27 C28
Girls-Boys ratio in 2nd Education (per 100 boys), 2013 figure
99.2 Access to safe drinking water (%), 2013 figure
92.9
Access to improved sanitation (%), 2013 figure
99.8 Immunization - Measles, 1 year old (%)
94.0 C29 C30 C31 C32
Infant Mortality Rate (per 1000 live births), 2012 figure
6.3 Life expectancy (years)
74.9
C17
C21
C25
C29
Thailand
Sex ratio (male per 100 female)
95.2 Persons below 5 (000)
3,942.3 C17 C18 C19 C20
Persons 65 and over (000)
5,971.3 Youth 15-29 (000)
15,533.9
Urban Population (%
49.0 Below national Poverty Line (%), 2009 figure
13.2 C21 C22 C23 C24
Below PPP$1.25 (%), 2010 figure
0.04 Unemployed (%)
0.8
Adult literacy rate (%), 2010 figure
96.1 Net Enrollment primary education (%), 2010 figure
103.1 C25 C26 C27 C28
Girls-Boys ratio in 2nd Education (per 100 boys), 2012 figure
106.0 Access to safe drinking water (%), 2012 figure
97.0
Access to improved sanitation (%), 2012 figure
97.2 Immunization - Measles, 1 year old (%), 2012 figure
98.0 C29 C30 C31 C32
Infant Mortality Rate (per 1000 live births), 2011 figure
6.6 Life expectancy (years)
74.3
Viet Nam
Sex ratio (male per 100 female)
97.4 Persons below 5 (000)
7,712.0 C18 C19 C20
Persons 65 and over (000)
6,441.8 Youth 15-29 (000)
22,319.3
Urban Population (%)
33.1 Below national Poverty Line (%),
8.4 C22 C23 C24
Below PPP$1.25 (%), 2010 figure
14.0 Unemployed (%)
2.1
Adult literacy rate (%), 2013 figure
94.8 Net Enrollment primary education (%), 2013 figure
96.6 C26 C27 C28
Girls-Boys ratio in 2nd Education (per 100 boys)
92.0 Access to safe drinking water (%), 2012 figure
91.0
Access to improved sanitation (%), 2012 figure
77.4 Immunization - Measles, 1 year old (%)
97.0
C17
C21
C25
C29 C30 C31 C32
Infant Mortality Rate (per 1000 live births)
14.9 Life expectancy (years),
73.2
THE PEOPLE, 2014
THE PEOPLE, 2014
THE INVESTMENT, INFRASTRUCTURE, AND CONNECTIVITY, 2014
THE INVESTMENT, INFRASTRUCTURE, AND CONNECTIVITY, 2014
12,0
10,0
8,0
6,0
4,0
2,0
-2005 2006 2007 2008 2009 2010 2011 2012 2013 2014
BruneiDarussalam
Cambodia
Indonesia
Malaysia
Myanmar
Philippines
Singapore
Thailand
Viet Nam
Unemployment Rate, 2005-2014
Road Length and Paved Network
length of road
length of paved road
450.000400.000350.000250.000200.000150.000100.00050.000
-
2000
2005
2012
2000
2005
2013
2000
2005
2014
2000
2005
2014
2000
2005
2014
2000
2005
2013
2000
2005
2014
2000
2005
2014
2000
2005
2013
2000
2005
2012
CambodiaBruneiDarussalam
Indonesia Lao PDR Malaysia Myanmar Philippines Singapore Thailand Viet Nam
Access to Safe Drinking Water ASEAN
Cambodia Indonesia Lao PDR Malaysia Myanmar Philippines Singapore Thailand Viet Nam
2004 2006 2010-2014
100
80
60
40
20
0
Internet User per 100 persons
Brunei Darussalam
Cambodia
Indonesia
Lao PDR
Malaysia
Myanmar
Philippines
Singapore
Thailand
Viet Nam
0 10 20 30 40 50 60 70 80 90
2014
2013
2012
2011
2010
2009