mainstreaming the 2030 agenda for sustainable … · 1980 1983 1986 1989 1992 1995 1998 2001 2004...
TRANSCRIPT

MAINSTREAMING THE 2030 AGENDA FOR SUSTAINABLE DEVELOPMENT
INTO INDONESIA’S DEVELOPMENT PLAN
Bangkok, 3 December 2015
Dr. Leonard V. H. TampubolonDeputy Minister of Economic Affairs
Ministry of National Development Planning/National Development Planning AgencyRepublic of Indonesia
1

Mainstreaming the 2030 Agenda for Sustainable Development Into Indonesia’s Development Plan
Ministry of National Development Planning of Indonesia
Outline
Current Condition
Policy Strategies
Targets
Partnerships
2

CURRENT CONDITION
3

Mainstreaming the 2030 Agenda for Sustainable Development Into Indonesia’s Development Plan
Ministry of National Development Planning of Indonesia
Economic growth is slowing down and regional disparity remains high..
2
3
4
5
6
7
8
9
10
Mar‐04
Feb‐05
Jan‐06
Dec‐06
Nov
‐07
Oct‐08
Sep‐09
Aug‐10
Jul‐1
1
Jun‐12
May‐13
Apr‐14
Mar‐15
Actual GDP Potential GDP
Java Island contributes 60%to Indonesia’s GDP
Economic growth has been trending down. As a result, Indonesia is facing a lower potential GDP.
4

Mainstreaming the 2030 Agenda for Sustainable Development Into Indonesia’s Development Plan
Ministry of National Development Planning of Indonesia
Poverty rate reduction has also been slowing down while inequality rising…
0
5
10
15
20
25
30
35
40
45
1980
1983
1986
1989
1992
1995
1998
2001
2004
2007
2010
2013
Gini Poverty (old) Poverty (New)
‐8
‐6
‐4
‐2
0
2
4
6
8
10
12
0
10
20
30
40
50
60
ChangesGini
1990s 2000s Increase
Poverty rate reduction has been slowing down in the past 10 years and in 2015, poverty rate increased.
Inequality in Indonesia has been rising the fastest among other developing countries.
5

Mainstreaming the 2030 Agenda for Sustainable Development Into Indonesia’s Development Plan
Ministry of National Development Planning of Indonesia
Challenges remain in human resources development..
0
10
20
30
40
50
60
70
80
90
Maximum
Mean
Minimum
AVERAGE LENGTH OF SCHOOLING PER PROVINCE, 2012
0
2
4
6
8
10
12
14
Papua
NTB
Kalbar
NTT
Sulbar
Jatim
Jateng
Gorontalo
Babel
Kalsel
Lampung
Sumsel
Jambi
Sulsel
Kalteng
Sulteng
Jabar
Sultra
Bali
Bengkulu
Banten
Malut
Sumbar
Riau
Aceh
Kaltim
Sumut
Sulut
Maluku
Yogyaka …
Pabar
Kepri
Jakarta
Terendah Rata-rata Tertinggi
ADULT ILLITERACY RATE PER PROVINCE, 2011
Delivery in HealthFacilities (%)
Complete Basic Immunization Coverage (%)
Highest 99,0DIY
83,1DIY
National 70,4 58,9
Lowest 25,2MALUKU
29,2PAPUA
DISPARITIES IN SERVICE DELIVERY
Source: Riskesdas, 2013
Maternal and Infant Mortality Rate 1994-2012 and Mid Term Development Plan (RPJMN) Target 2019
MATERNAL AND INFANT MORTALITY RATE
390
334307
228
359 306
57
46
3534 32
24
0
10
20
30
40
50
60
0
100
200
300
400
500
1994 1997 2002‐2003 2007 2012 2019
Infant M
ortality Ra
te
Materna
l Mortality Ra
te
Maternal Mortality Rate per 100.000 Live BirthsInfant Mortality Rate per 1.000 Live Births
Source: SDKI
6

Mainstreaming the 2030 Agenda for Sustainable Development Into Indonesia’s Development Plan
Ministry of National Development Planning of Indonesia
• Economic growth still heavily relies on natural resources i.e. oil and gas, minerals, forestry. This resource‐driven growth has caused depletion and degradation (RPJMN 2015‐2019).
• In 2013, the proportion of households with access to safe drinking water is 67.7% while those with access to basic sanitation facilities only 60.9%. Therefore, 100 million people still have no access to drinking water and 120 million have no access to proper sanitation (BPS, 2013).
Environmental development has also been facing challenges as well…
7

POLICY STRATEGIES
8

Mainstreaming the 2030 Agenda for Sustainable Development Into Indonesia’s Development Plan
Ministry of National Development Planning of Indonesia
Mid-Term National Development Plan 2015-2019
DEVELOPMENT NORMS1. Building society and human beings;2. Improved efforts for welfare, prosperity, productivity should not create a widening inequality:
• Special attention is given to improve the productivity of lower and middle income people without blocking, inhibiting, shrinking, and reducing flexibility of major actors to continue to be an agent of growth.
3. Development activities must not impair or reduce carrying capacity of environment and the ecosystem balance.
3 DIMENSIONS OF DEVELOPMENT
Human Development
Education
Health
Housing
Mental/Character
Primary Sector Development
Food Sovereignty
Energy Sovereignty and Electricity
Maritime and Marine
Tourism and Industry
Equalization and Regional
Development
Among Income Groups
Among Regions: (1) Villages; (2) Borderlands;
Non‐Java; Eastern Regions
Certainty and Law Enforcement Security and Order Politics and Democracy Governance and Reform
NECESSARY CONDITIONS
9
Mainstreaming the 2030 Agenda for Sustainable Development Into Indonesia’s Development Plan
Ministry of National Development Planning of Indonesia
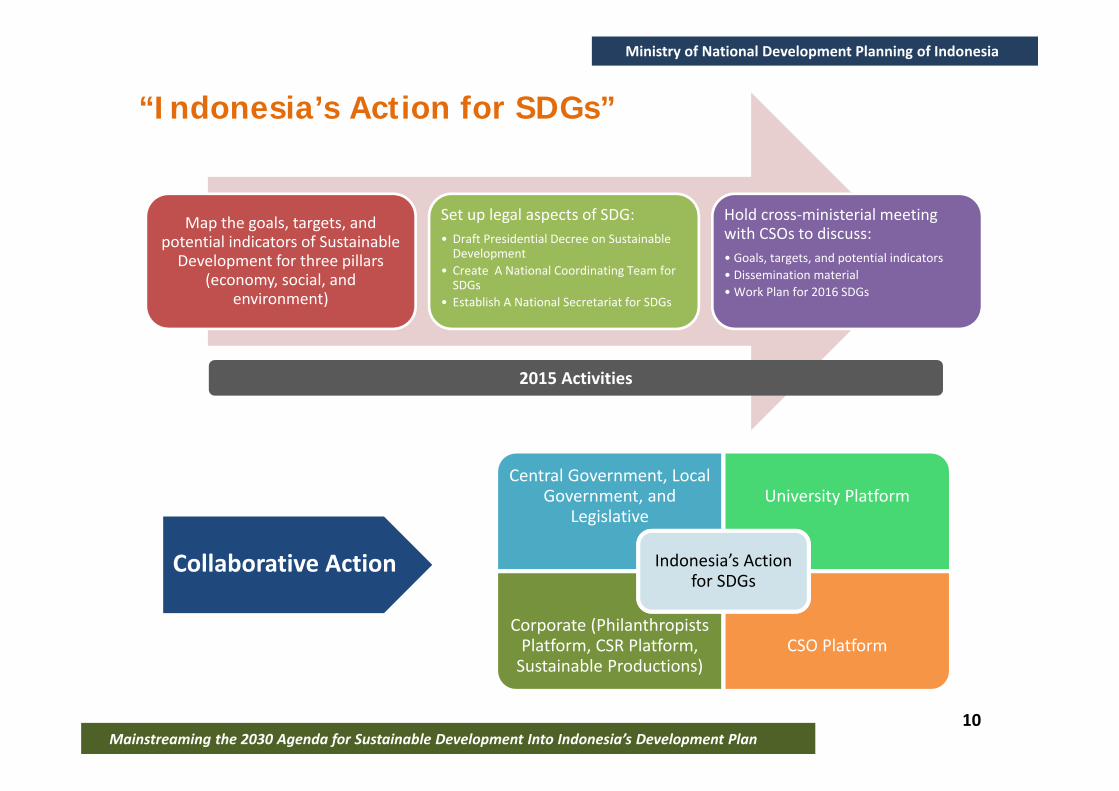
Map the goals, targets, and potential indicators of Sustainable Development for three pillars
(economy, social, and environment)
Set up legal aspects of SDG:• Draft Presidential Decree on Sustainable Development
• Create A National Coordinating Team for SDGs
• Establish A National Secretariat for SDGs
Hold cross‐ministerial meeting with CSOs to discuss:• Goals, targets, and potential indicators• Dissemination material• Work Plan for 2016 SDGs
“Indonesia’s Action for SDGs”
2015 Activities
Central Government, Local Government, and
LegislativeUniversity Platform
Corporate (Philanthropists Platform, CSR Platform, Sustainable Productions)
CSO Platform
Indonesia’s Action for SDGs
Collaborative Action
10
TARGETS
11

Mainstreaming the 2030 Agenda for Sustainable Development Into Indonesia’s Development Plan
Ministry of National Development Planning of Indonesia
Indonesia’s Medium Term Development Plan 2015-2019 has aligned with all 17 goals of SDGs.. (1)
Decrease poverty rate to 7‐8% from 11% (2014)62.4 mio of formal workers & 3.5 mioinformal workers covered by Social Protection from 29.5 mio and 1.3 miorespectively (2014)
Increase avg length of schooling to 8,8 years from 8,1 years (2013)Increase literacy rate to 96.1% from 94.1%(2013) Ratio of gross enrollment rate for secondary school between 20% rich and 20% poor to 0.9 from 0.85 (2012)
Increase electrification ratio to 96,6% from 81.5% (2014)
Decrease prevalence of preschoolers’ underweight to 17% from 19.6% (2013)Decrease prevalence of toddlers’ stunting to 28% from 32.9% (2013)Increase domestic food production
Increase gender development index from 69.6 (2013)Increase gender empowerment index from 70.5 (2013)Decrease prevalence of violence on children
8% economic growth from 5,1% (2014)8.6% growth of manufacturing sector from 4.7% (2014) contributing 21.6% of GDP (2014: 20,7%)10 mio new jobs created
Decrease maternal mortality rate to 309 per 100,000 live births from 346 (2010)Decrease infant mortality rate to 24 per 1,000 live births from 32 (2012)Decrease prevalence of HIV, TB, obesity, high blood pressure
Universal access to safe drinking water and basic sanitation from 70% and 60.9% respectively.
Increase power generation capacity to 86,6GW from 50.7GWBuild new roads, rail ways, airports, portsShorten dwelling time from 6‐7 days to 3‐4 days
SDGs vs 2019 RPJMN 2015‐2019 Targets
12

Mainstreaming the 2030 Agenda for Sustainable Development Into Indonesia’s Development Plan
Ministry of National Development Planning of Indonesia
Indonesia’s Mid Term Development Plan 2015-2019 has aligned with all 17 goals of SDGs.. (2)
Decrease gini ratio from 0.41(2014) to 0.36 (2019Increase contribution of non‐Java islands in GDP from 42% (2013) to 44.9% (2019)Decrease the number of underdeveloped villages by 5000 villages
Decrease greenhouse gas emission Increase environmental quality indexIncrease people’s awareness about extreme weather and disasters
Increase the percentage of children under 5 whose births have been registered with civil authority to 77.4% in 2019Increase the anti‐corruption index to 4.0 (2019) from 3.6 (201)
Eliminate urban slum areasDecrease housing backlog from 7.9 (2014) mio to 5 mio (2019)Increase share of urban public transportation from 23% (2014) to 32% (2019)
Decrease illegal fishing activities Increase the number of protected fish speciesIncrease marine protected area s from 15,7 mio ha (2014) to 20 mio ha (2019)
Increase tax ratio to from 11.4% (2014) to 16% (2019)Maintain fiscal resilience and fiscal sustainabilityIncrease the non oil and gas export growth by 14 .3% in 2019
Fuel Subsidy Reallocation
Additional forest rehabilitation: 750.000 ha in 2019Increase coverage of protected areas to 20 mio ha in 2019
SDGs vs 2019 RPJMN 2015‐2019 Targets
13

PARTNERSHIPS
14

Mainstreaming the 2030 Agenda for Sustainable Development Into Indonesia’s Development Plan
Ministry of National Development Planning of Indonesia
Possible Future Partnership and Cooperation
CURRENT IMPORTANT ISSUES:
1. Sustainable Development Goals (SDGs) vs High Growth:It has been perceived that there is a trade‐off between one and another
2. Long‐term economic growth vs Short‐Term Economic Growth: It is agreed that in the long‐term SDGs will be beneficial to support high economic growth, but not in the short‐term. On the other hand, a short‐term growth is also important for most developing countries
SDGs: Higher concerns and targets on environmental and social issues
Slower Economic Growth: SDGs could slow‐down the rate of economic growth
15
Mainstreaming the 2030 Agenda for Sustainable Development Into Indonesia’s Development Plan
Ministry of National Development Planning of Indonesia
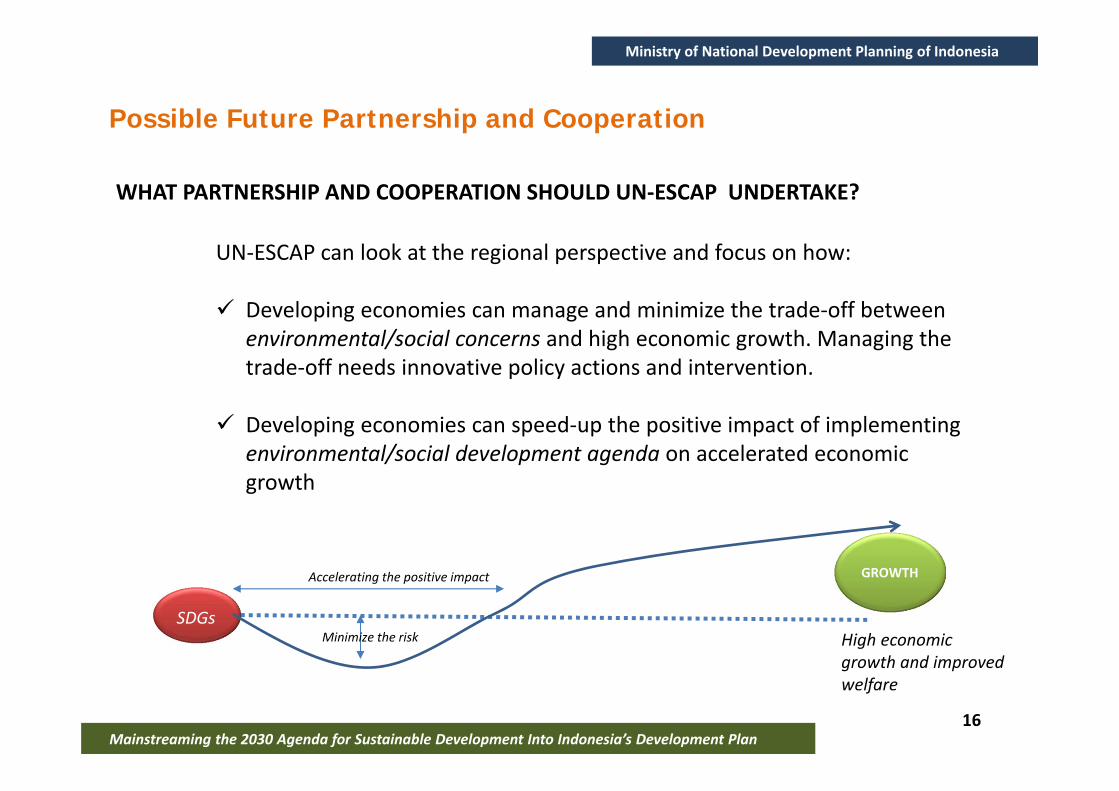
Possible Future Partnership and Cooperation
WHAT PARTNERSHIP AND COOPERATION SHOULD UN‐ESCAP UNDERTAKE?
UN‐ESCAP can look at the regional perspective and focus on how:
Developing economies can manage and minimize the trade‐off between environmental/social concerns and high economic growth. Managing the trade‐off needs innovative policy actions and intervention.
Developing economies can speed‐up the positive impact of implementing environmental/social development agenda on accelerated economic growth
GROWTH
High economic growth and improved welfare
Minimize the risk
Accelerating the positive impact
SDGs
16

THANK YOU
17