managing critical truck parking tech memo #2:...
TRANSCRIPT
March 2017
W. Ford Torrey, IV Research Associate
American Transportation Research Institute Atlanta, GA
Daniel Murray Vice President
American Transportation Research Institute St. Paul, MN
Managing Critical Truck Parking Tech Memo #2: Minnesota Case Study – Utilizing Truck GPS Data to Assess Parking Supply and Demand

ATRI BOARD OF DIRECTORS
Judy McReynolds Chairman of the ATRI Board Chairman, President and CEO ArcBest Corporation Fort Smith, AR David S. Congdon Vice Chairman and CEO Old Dominion Freight Line Thomasville, NC Michael L. Ducker President and CEO FedEx Freight Memphis, TN Rich Freeland President and COO Cummins Inc. Columbus, IN Hugh H. Fugleberg President and COO Great West Casualty Company South Sioux City, NE Dave Huneryager President and CEO Tennessee Trucking Association Nashville, TN Derek Leathers President and CEO Werner Enterprises Omaha, NE Chris Lofgren President and CEO Schneider National, Inc. Green Bay, WI
Robert E. Low President and CEO Prime Inc. Springfield, MO Rich McArdle President UPS Freight Richmond, VA Jeffrey J. McCaig Chairman Trimac Transportation, Inc. Houston, TX Gregory L. Owen Head Coach and CEO Ability/ Tri-Modal Transportation Services Carson, CA Annette Sandberg President and CEO Transsafe Consulting, LLC Davenport, WA Rebecca M. Brewster President and COO American Transportation Research Institute Atlanta, GA Chris Spear President and CEO American Trucking Associations Arlington, VA

ATRI RESEARCH ADVISORY COMMITTEE
Scott Mugno, RAC Chairman Vice President, Safety, Sustainability and Vehicle Maintenance FedEx Ground
Jon Blackham Policy and Government Affairs Canadian Trucking Alliance
Amy Boerger Vice President Sales Cummins, Inc.
Randy Boyles Senior Vice President, Mobile Strategy PeopleNet Bill Brown Manager of Fleet Telematics Southeastern Freight Lines Michael Conyngham Director of Research International Brotherhood of Teamsters Bob Costello Senior Vice President and Chief Economist American Trucking Associations Tom Cuthbertson Vice President, Regulatory Compliance Omnitracs, LLC Dennis Dellinger President Cargo Transporters Chip Duden Vice President, Strategic Business Analytics Werner Enterprises Paul J. Enos Chief Executive Officer Nevada Trucking Association
Scott George Chief Executive Officer TCW, Inc. Mike Golias Director for Research, Intermodal Freight Transportation Institute University of Memphis Stan Hampton Vice President of Driver Personnel J.B. Hunt Victor Hart Director of Safety DOT Transportation, Inc. Sanford Hodes Ryder System, Inc. Senior Vice President and Deputy General Counsel Ken Howden Director, 21st Century Truck Partnership U.S. Department of Energy Kelly Killingsworth VP of Inbound Transportation Wal-mart Stores, Inc. Victoria King VP Public Affairs UPS Dustin Koehl Vice President, Sales and Marketing Total Transportation of Mississippi Caroline Mays Director, Freight and International Trade Section Texas DOT Chris McLoughlin Cargo Risk Manager C.H. Robinson Worldwide, Inc.
Lisa Mullings President and CEO National Association of Truck Stop Operators Tom Murtha Senior Planner Chicago Metropolitan Agency for Planning Brenda Neville President Iowa Motor Truck Association Dean Newell Vice President, Safety Maverick, Inc. Karen Rasmussen President and CEO HELP Inc. Wellington F. Roemer, III President and CEO Wellington F. Roemer Insurance, Inc. Mark Savage Deputy Chief Colorado State Patrol Andrea Sequin Director, Regulatory Services Schneider National, Inc. Carl Stebbins Corporate Director of Admissions and Marketing New England Tractor Trailer Training School Harold Sumerford, Jr. Chief Executive Officer J&M Tank Lines James E. Ward President and CEO D.M. Bowman Tom Weakley Director of Operations Owner-Operator Independent Drivers Association Foundation
Managing Critical Truck Parking Tech Memo #2: Minnesota Case Study - Utilizing Truck GPS Data to Assess Parking Supply and Demand 2
TABLE OF CONTENTS
1.0 INTRODUCTION ....................................................................................................... 3
2.0 PHASE ONE – GOOSE CREEK REST AREA ANALYSIS ...................................... 3
2.1 Methodology ................................................................................................... 3
2.2 Results ............................................................................................................. 4
3.0 PHASE TWO – ANALYSIS OF DES MOINES RIVER, CLEAR LAKE, AND MINNESOTA VALLEY REST AREAS ............................................................................ 6
3.1 Methodology ................................................................................................... 6
3.2 Results ............................................................................................................. 6
4.0 CONCLUSION ........................................................................................................ 10
TABLE OF FIGURES
Figure 1: Goose Creek Rest Area - Overcapacity by Day-of-Week ........................... 5
Figure 2: Goose Creek Rest Area - Overcapacity by Hour-of-Day ............................ 5
Figure 3: Minnesota Valley Rest Area - Overcapacity by Day-of-Week .................... 7
Figure 4: Minnesota Valley Rest Area - Overcapacity by Hour-of-Day ..................... 7
Figure 5: Clear Lake Rest Area - Overcapacity by Day-of-Week ............................... 8
Figure 6: Clear Lake Rest Area - Overcapacity by Hour-of-Day ................................ 8
Figure 7: Des Moines Rest Area - Overcapacity by Day-of-Week ............................. 9
Figure 8: Des Moines Rest Area - Overcapacity by Hour-of-Day .............................. 9

Managing Critical Truck Parking Tech Memo #2: Minnesota Case Study - Utilizing Truck GPS Data to Assess Parking Supply and Demand 3
1.0 INTRODUCTION At its annual meeting in 2015, the American Transportation Research Institute (ATRI) Research Advisory Committee (RAC)1 selected “Managing Critical Truck Parking” as its number one research priority. ATRI’s RAC-directed truck parking research was conducted through a series of discrete tasks, the results of each being documented in separate reports. This Tech Memo details the results of a truck parking analysis case study undertaken for the Minnesota Department of Transportation (MNDOT). ATRI was contacted by MNDOT to conduct an analysis using truck Global Positioning System (GPS) data for several rest stop locations, based on a customized methodology that utilizes ATRI’s large database of truck GPS points2. This first-of-its-kind research is attempting to assess truck parking supply and demand by cross-referencing GPS data (i.e. truck activity) at several Minnesota rest stops. 2.0 PHASE ONE – GOOSE CREEK REST AREA ANALYSIS 2.1 Methodology ATRI selected October 2015 as the observation period for this study. The first location assessment was the Goose Creek Rest Area, which lies along the I-35 northbound corridor north of the Twin Cities. ATRI used rest area truck counts derived from its GPS database and expanded these counts, using an extrapolation factor associated with MNDOT truck count data, to estimate the total number of trucks at the stop for each hour of the observation month. Rest Area Counts To prepare the October 2015 data, a geographic bounding box was created around truck parking in the rest area, and the needed data was extracted if a point’s latitude and longitude fell inside this bounding box. Next, the point data were joined with spatial polygons resulting in the points receiving a text identifier of where in the study area the truck was positioned. The number of trucks parked by hour-of-day and day-of-week were then found by:
• Removing trucks with a speed greater than zero miles per hour (MPH) to establish that a truck was parked;
• Converting the date/time stamp on a truck’s GPS ping from Greenwich Mean Time (GMT) to Central Standard Time (CST);
• Extracting hour-of-day and day-of-week information from the converted date/time stamp; • Creating a unique identifier (UID) for each point using the truck identification number,
hour-of-day, and day-of-week indicator;
1 ATRI’s RAC is comprised of industry stakeholders representing motor carriers, trucking industry suppliers, labor and driver groups, law enforcement, federal government and academia. The RAC is charged with annually recommending a research agenda for the Institute. 2 ATRI’s anonymized truck GPS dataset is comprised of a continuous stream of truck position data that is reported from more than six hundred thousand trucks. For each individual truck, a latitude/longitude, date and time stamp, speed and other information is recorded continuously. Rates of position are extremely frequent; anywhere from every 30 seconds to every several minutes.

Managing Critical Truck Parking Tech Memo #2: Minnesota Case Study - Utilizing Truck GPS Data to Assess Parking Supply and Demand 4
• Removing duplicate UIDs to account for a truck pinging a location more than once in any given hour on any given day; and
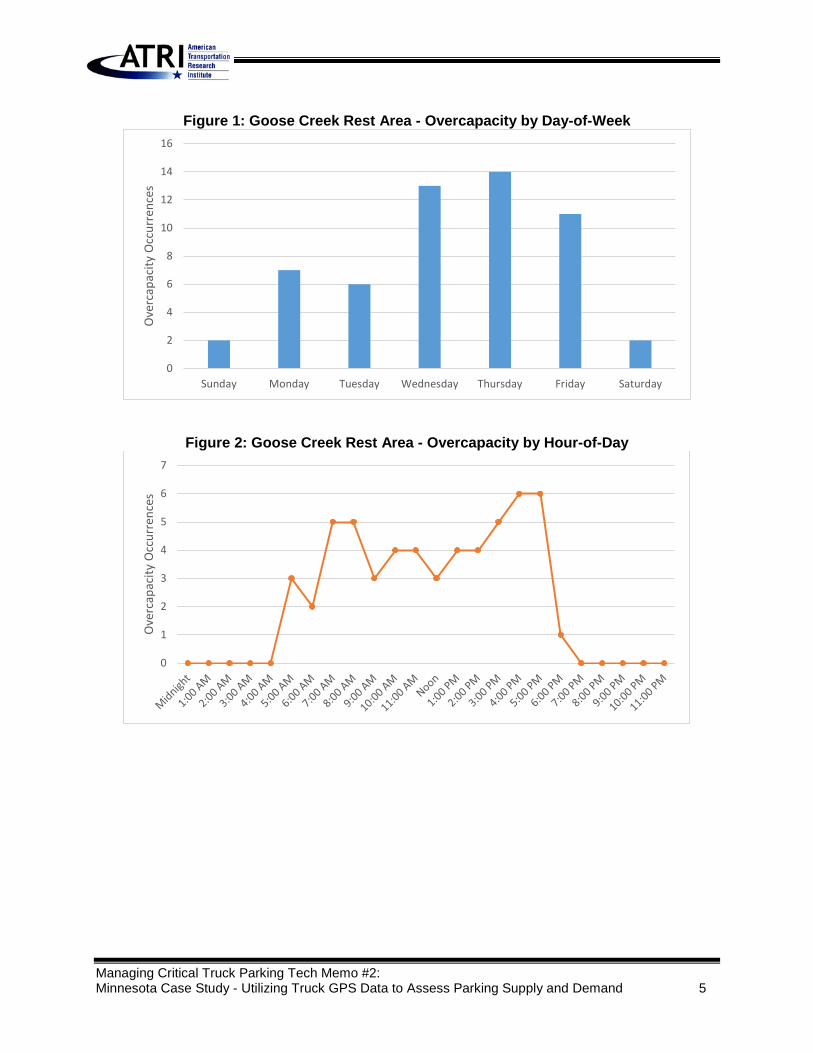
• Aggregating the number of UIDs by the hour-of-day and day-of-week. Truck Count Expansion ATRI developed an expansion factor for every hour in the observation period. This factor was used to expand GPS rest area counts in order to estimate the total number of trucks occupying the location. ATRI used truck count data from ATR 191, a MNDOT weigh-in-motion (WIM) traffic counting station 17 miles upstream of the Goose Creek rest area, and ATRI GPS data at the same geographical location to develop the expansion factor. First, the MNDOT WIM data was analyzed to determine the number of trucks observed by day and hour-of-day on I-35. Next, ATRI GPS data was cross-referenced with the truck count data to determine the proportion of ATRI’s sample to the WIM data; this was done for each hour for each day. This expansion factor was then applied to the ATRI GPS data found at the Goose Creek rest stop, providing a reasonable estimation of the number of trucks parked in the rest stop. For example, if the MNDOT WIM data showed 18 trucks on the road at a particular time on a particular day, and the ATRI GPS data showed nine trucks, it can reasonably be assumed that ATRI GPS data is capturing 50 percent of the trucks for that time period, and applying a factor of two to ATRI’s Goose Creek GPS units can estimate truck parking usage. When the expansion factors were applied for all hours of the selected October dates at Goose Creek, a truck parking usage matrix was developed, including occurrences where capacity was exceeded during certain hours of certain days. 2.2 Results Goose Creek Rest Area Overcapacity Counts The Goose Creek Rest Area experienced 55 of its hours being overcapacity at some point during October of 2015; this translates to being overcapacity 7.4 percent of the month. The latter part of the week experienced more crowding with Wednesday, Thursday, and Friday seeing the bulk of the overcapacity (Figure 1). Additionally, the issue was concentrated during the daylight hours between 5:00 a.m. and 6:00 p.m. with the other hours of the day seeing no overcapacity issue, suggesting overcapacity being the result of drivers stopping for their hours-of-service (HOS) rest break (Figure 2).
Managing Critical Truck Parking Tech Memo #2: Minnesota Case Study - Utilizing Truck GPS Data to Assess Parking Supply and Demand 5
Figure 1: Goose Creek Rest Area - Overcapacity by Day-of-Week
Figure 2: Goose Creek Rest Area - Overcapacity by Hour-of-Day
0
2
4
6
8
10
12
14
16
Sunday Monday Tuesday Wednesday Thursday Friday Saturday
Ove
rcap
acity
Occ
urre
nces
0
1
2
3
4
5
6
7
Ove
rcap
acity
Occ
urre
nces
Managing Critical Truck Parking Tech Memo #2: Minnesota Case Study - Utilizing Truck GPS Data to Assess Parking Supply and Demand 6
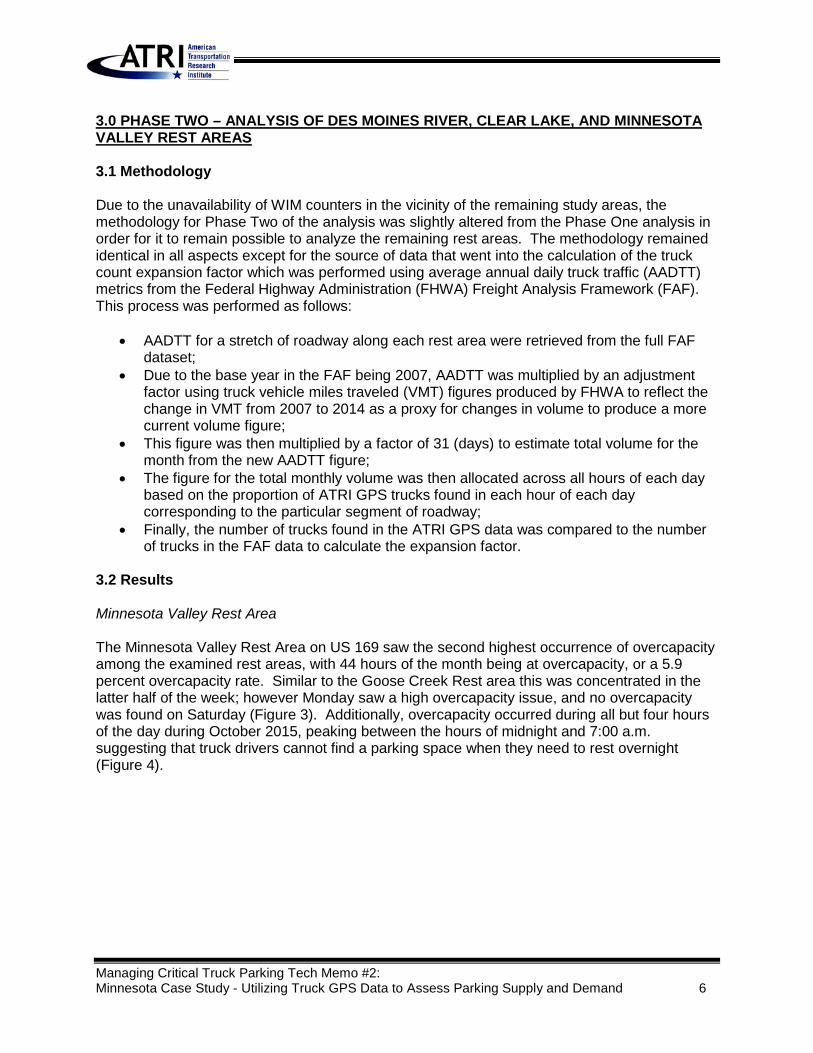
3.0 PHASE TWO – ANALYSIS OF DES MOINES RIVER, CLEAR LAKE, AND MINNESOTA VALLEY REST AREAS 3.1 Methodology Due to the unavailability of WIM counters in the vicinity of the remaining study areas, the methodology for Phase Two of the analysis was slightly altered from the Phase One analysis in order for it to remain possible to analyze the remaining rest areas. The methodology remained identical in all aspects except for the source of data that went into the calculation of the truck count expansion factor which was performed using average annual daily truck traffic (AADTT) metrics from the Federal Highway Administration (FHWA) Freight Analysis Framework (FAF). This process was performed as follows:
• AADTT for a stretch of roadway along each rest area were retrieved from the full FAF dataset;
• Due to the base year in the FAF being 2007, AADTT was multiplied by an adjustment factor using truck vehicle miles traveled (VMT) figures produced by FHWA to reflect the change in VMT from 2007 to 2014 as a proxy for changes in volume to produce a more current volume figure;
• This figure was then multiplied by a factor of 31 (days) to estimate total volume for the month from the new AADTT figure;
• The figure for the total monthly volume was then allocated across all hours of each day based on the proportion of ATRI GPS trucks found in each hour of each day corresponding to the particular segment of roadway;
• Finally, the number of trucks found in the ATRI GPS data was compared to the number of trucks in the FAF data to calculate the expansion factor.
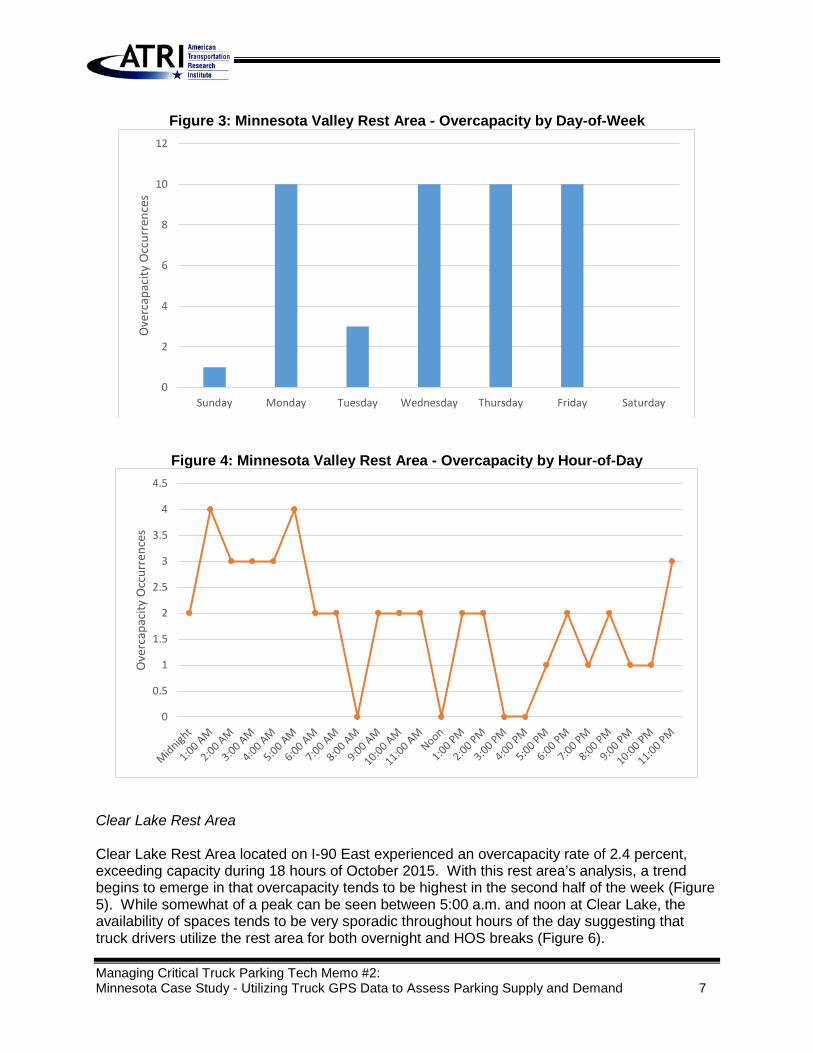
3.2 Results Minnesota Valley Rest Area The Minnesota Valley Rest Area on US 169 saw the second highest occurrence of overcapacity among the examined rest areas, with 44 hours of the month being at overcapacity, or a 5.9 percent overcapacity rate. Similar to the Goose Creek Rest area this was concentrated in the latter half of the week; however Monday saw a high overcapacity issue, and no overcapacity was found on Saturday (Figure 3). Additionally, overcapacity occurred during all but four hours of the day during October 2015, peaking between the hours of midnight and 7:00 a.m. suggesting that truck drivers cannot find a parking space when they need to rest overnight (Figure 4).
Managing Critical Truck Parking Tech Memo #2: Minnesota Case Study - Utilizing Truck GPS Data to Assess Parking Supply and Demand 7
Figure 3: Minnesota Valley Rest Area - Overcapacity by Day-of-Week
Figure 4: Minnesota Valley Rest Area - Overcapacity by Hour-of-Day
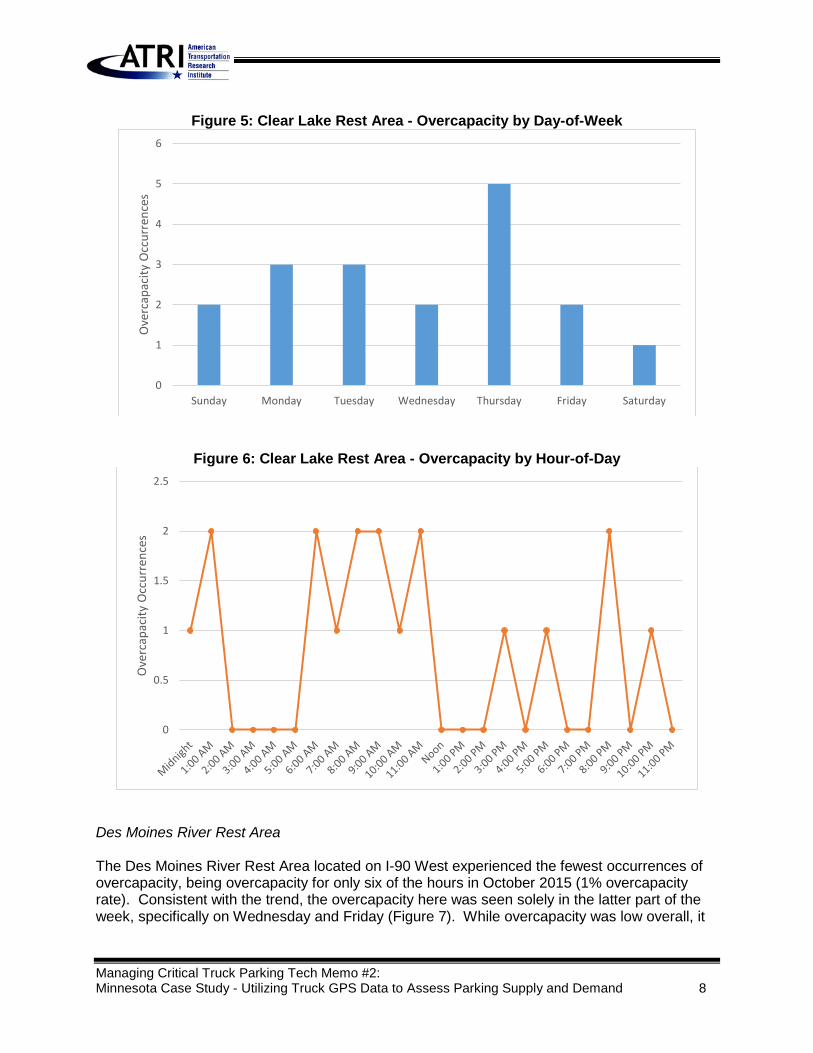
Clear Lake Rest Area Clear Lake Rest Area located on I-90 East experienced an overcapacity rate of 2.4 percent, exceeding capacity during 18 hours of October 2015. With this rest area’s analysis, a trend begins to emerge in that overcapacity tends to be highest in the second half of the week (Figure 5). While somewhat of a peak can be seen between 5:00 a.m. and noon at Clear Lake, the availability of spaces tends to be very sporadic throughout hours of the day suggesting that truck drivers utilize the rest area for both overnight and HOS breaks (Figure 6).
0
2
4
6
8
10
12
Sunday Monday Tuesday Wednesday Thursday Friday Saturday
Ove
rcap
acity
Occ
urre
nces
0
0.5
1
1.5
2
2.5
3
3.5
4
4.5
Ove
rcap
acity
Occ
urre
nces
Managing Critical Truck Parking Tech Memo #2: Minnesota Case Study - Utilizing Truck GPS Data to Assess Parking Supply and Demand 8
Figure 5: Clear Lake Rest Area - Overcapacity by Day-of-Week
Figure 6: Clear Lake Rest Area - Overcapacity by Hour-of-Day
Des Moines River Rest Area The Des Moines River Rest Area located on I-90 West experienced the fewest occurrences of overcapacity, being overcapacity for only six of the hours in October 2015 (1% overcapacity rate). Consistent with the trend, the overcapacity here was seen solely in the latter part of the week, specifically on Wednesday and Friday (Figure 7). While overcapacity was low overall, it
0
1
2
3
4
5
6
Sunday Monday Tuesday Wednesday Thursday Friday Saturday
Ove
rcap
acity
Occ
urre
nces
0
0.5
1
1.5
2
2.5
Ove
rcap
acity
Occ
urre
nces

Managing Critical Truck Parking Tech Memo #2: Minnesota Case Study - Utilizing Truck GPS Data to Assess Parking Supply and Demand 9
was essentially concentrated between 5:00 a.m. and 6:00 a.m. with overcapacity occurring at 9:00 a.m. and 11:00 a.m. as well (Figure 8).
Figure 7: Des Moines Rest Area - Overcapacity by Day-of-Week
Figure 8: Des Moines Rest Area - Overcapacity by Hour-of-Day
0
0.5
1
1.5
2
2.5
3
3.5
4
4.5
Sunday Monday Tuesday Wednesday Thursday Friday Saturday
Ove
rcap
acity
Occ
urre
nces
0
0.5
1
1.5
2
2.5
3
3.5
Ove
rcap
acity
Occ
urre
nces
Managing Critical Truck Parking Tech Memo #2: Minnesota Case Study - Utilizing Truck GPS Data to Assess Parking Supply and Demand 10
4.0 CONCLUSION
This quantitative analysis corroborates that truck parking capacity assessments can be developed using real world truck GPS data. The analysis showed that while overcapacity occurs at some locations much more frequently than others, all of the locations examined in this analysis experienced overcapacity at some point during October 2015. Additionally, this analysis uncovered a consistent trend whereby truck drivers had the greatest difficulty finding available parking in the latter part the week.