managing supply chain analytics - guiding organizations to
TRANSCRIPT
Tino T. Herden
Managing Supply Chain Analytics – Guiding organizationsto execute Analytics initiatives in Logistics and SupplyChain Management

Managing Supply Chain Analytics
Guiding organizations to execute Analytics initiatives in Logistics and Supply Chain
Management
vorgelegt von
M. Sc.
Tino T. Herden
ORCID: 0000-0002-5867-4708
an der Fakultät VII – Wirtschaft und Management
der Technischen Universität Berlin
zur Erlangung des akademischen Grades
Doktor der Ingenieurwissenschaften
- Dr.-Ing. -
genehmigte Dissertation
Promotionsausschuss:
Vorsitzender: Prof. Dr. Rüdiger Zarnekow
Gutachter: Prof. Dr.-Ing. Frank Straube
Gutachter: Prof. Dr. André Ludwig
Tag der wissenschaftlichen Aussprache: 06. November 2019
Berlin 2020

II

III
Abstract
The application of Analytics in the domain of Logistics and Supply Chain Management
(LSCM) – Supply Chain Analytics (SCA) – presents a wide range of advantages. The
domain has historically been a first mover in the application of analytical methods due to
the complex decision-making under uncertainty and has the potential to exploit manifold
new data sources accessible through recent technological advances. Scholars have
provided evidence for the performance increase in this domain due to Analytics and have
also argued for competitive advantages enabled through it. Surveys amongst practitioners
and reports show similar potential to improve the efficiency of processes, create new
business opportunities with it and eventually increase customer orientation. However,
LSCM organizations are not extensively and comprehensively utilizing these potential
advantages and the value and benefits resulting from it. Organizations are either prevented
to take advantage through barriers, or they disbelieve in the advantages and behave
reluctant, while new competitors exploit Analytics to gain market share. These issues
demonstrate that executing Analytics initiatives goes beyond the application of analytical
methods and requires supporting and directing managerial actions. This thesis
investigates these managerial actions and practices for Analytics initiatives in LSCM.
Thereby, initiative describes the entire lifecycle of Analytics solutions, from the
definition of the problem to be solved and its development to its use and maintenance in
the value-added processes. With a variety of research methods, including Grounded
Theory, Clustering, Case Studies, and the Q-Methodology, this thesis examines SCA
initiatives in exploratory and confirmatory research designs. In four articles,
investigations are conducted of (1) characteristics distinguishing LSCM from other
domains in the execution of Analytics, (2) Analytics initiatives currently executed in
LSCM, (3) the process of executing Analytics initiatives in LSCM to gain valuable
Analytics solutions, and (4) barriers LSCM organizations encounter in the execution of
Analytics initiatives and the measures they employ to overcome the barriers. These
articles result in a map of characteristics to distinguish domains in the execution of
Analytics initiatives and an individual profile of LSCM, six distinct Archetypes of SCA
initiatives, comprehensive explanations of the competitive advantage from Analytics in
LSCM, and frameworks of barriers and measures in SCA. The individual results of each
article are used to describe the value LSCM organizations can create for their customers,
and by further combining the results of the articles with 15 process approaches to manage

IV
Analytics initiatives, a supplemented approach to manage Analytics initiatives, especially
SCA initiatives, is developed. In this pursuit, Analytics is established as a tool, that
requires human creativity and expertise to unfold its full potential. As such a tool, it
provides solutions to support humans in their decision-making and can lead to improved
decisions if, like any other tool, it is applied in the appropriate approach. With the research
results described above, this thesis provides guidance for managers in LSCM to manage
SCA initiatives such that they understand this appropriate approach for Analytics in
LSCM and are enabled to employ it for (competitive) advantage and continuous
improvements of processes and customer satisfaction.
V
Zusammenfassung
Die Anwendung von Analytics in der Logistik und Supply Chain Management (LSCM)
Domäne – Supply Chain Analytics (SCA) – bietet eine Vielzahl von Vorteilen. Die
Domäne war in der Vergangenheit aufgrund der komplexen Entscheidungsfindung unter
Unsicherheit ein „First Mover“ bei der Anwendung analytischer Methoden und verfügt
über das Potenzial, die zahlreichen neuen Datenquellen ertragreich zu nutzen, die durch
die jüngsten technologischen Fortschritte zugänglich sind. Die wissenschaftliche
Literatur hat Belege für die Leistungssteigerung in der LSCM Domäne durch Analytics
erbracht und auch für Wettbewerbsvorteile argumentiert, die durch sie ermöglicht
werden. Umfragen unter Praktikern und Berichte zeigen ein ähnliches Potenzial, die
Effizienz von Prozessen zu verbessern, damit neue Geschäftsmöglichkeiten zu schaffen
und schließlich die Kundenorientierung zu erhöhen. LSCM-Organisationen nutzen diese
potenziellen Vorteile jedoch nicht umfassend aus und erschließen somit den daraus
resultierenden Wert und Nutzen nicht im vollen Umfang. Unternehmen werden entweder
durch Barrieren daran gehindert, die Vorteile auszunutzen, oder sie glauben nicht an die
Vorteile und verhalten sich zögerlich, während neue Wettbewerber Analytics einsetzen,
um Marktanteile zu gewinnen. Diese Probleme zeigen, dass die Durchführung von
Analytics-Initiativen über die Anwendung von Analysemethoden hinausgeht und die
Unterstützung und Steuerung von Managementmaßnahmen erfordert. Diese Arbeit
untersucht diese Managementmaßnahmen und -praktiken für Analytics-Initiativen in der
LSCM Domäne. Dabei beschreibt Initiative den gesamten Lebenszyklus von Analytics-
Lösungen, von der Definition des zu lösenden Problems, über die Lösungsentwicklung
bis hin zu dessen Einsatz und Wartung in den Wertschöpfungsprozessen. Mit einer
Vielzahl von Forschungsmethoden, einschließlich Grounded Theory, Clustering, Case
Studies und der Q-Methodik, untersucht diese Arbeit SCA-Initiativen in explorativen und
konfirmatorischen Forschungsdesigns. In vier wissenschaftlichen Artikeln werden
Untersuchungen durchgeführt zu (1) Merkmalen, die LSCM von anderen Domänen bei
der Durchführung von Analytics-Initiativen abgrenzt, (2) Analytics-Initiativen, die
derzeit in der LSCM Domäne durchgeführt werden, (3) dem Prozess der Ausführung von
Analytics-Initiativen in LSCM, um wertvolle Analytics-Lösungen zu schaffen, und (4)
Barrieren, auf die LSCM-Organisationen bei der Durchführung von Analytics-Initiativen
treffen und den Maßnahmen, die sie anwenden, um die Barrieren zu überwinden. Diese
Artikel haben resultiert in kartografierten Merkmalen zur Unterscheidung von Domänen
VI
bei der Durchführung von Analytics-Initiativen und einem individuellen Profil von
LSCM bezüglich dieser Merkmale; sechs abgegrenzten Archetypen von SCA-Initiativen;
umfassenden Erklärungen der Erlangung von Wettbewerbsvorteile durch Analytics in
LSCM; sowie Rahmenkonzepte von Barrieren und Maßnahmen in SCA. Einerseits
werden die Ergebnisse der einzelnen Artikel dazu verwendet, um den Wert zu
beschreiben, den LSCM-Organisationen für ihre Kunden schaffen können. Andererseits
wird durch die weiterführende Kombination der Ergebnisse der Artikel mit 15
Prozessansätzen zum Management von Analytics-Initiativen ein ergänzender Ansatz zum
Management von Analytics-Initiativen, insbesondere von SCA-Initiativen, entwickelt. In
diesem Bestreben etabliert diese Arbeit Analytics als ein Werkzeug, das menschliche
Kreativität und Expertise erfordert, um sein volles Potenzial zu entfalten. Als solches
Werkzeug bietet es Lösungen zur Unterstützung des Menschen bei seiner
Entscheidungsfindung und kann zu verbesserten Entscheidungen führen, wenn es wie
jedes andere Werkzeug im geeigneten Ansatz eingesetzt wird. Mit den oben
beschriebenen Forschungsergebnissen bietet diese Arbeit Anleitung für Manager in
LSCM, um SCA-Initiativen so zu managen, dass sie diesen geeigneten Ansatz für
Analytics in LSCM verstehen und in die Lage versetzt werden, ihn für (Wettbewerbs-)
Vorteile und kontinuierliche Verbesserungen der Prozesse und der Kundenzufriedenheit
einzusetzen.
VII
Content
Abstract ........................................................................................................................... III
Zusammenfassung ........................................................................................................... V
Content ........................................................................................................................... VII
Figures ......................................................................................................................... XIII
Tables ............................................................................................................................ XV
Abbreviations ............................................................................................................... XVI
1 Introduction ............................................................................................................... 1
1.1 Research Motivation .......................................................................................... 1
1.1.1 Theoretical Motivation ............................................................................... 2
1.1.2 Practical Motivation .................................................................................... 6
1.1.3 Summary Motivation .................................................................................. 9
1.2 Research Objective ........................................................................................... 11
1.3 Unit of analysis ................................................................................................ 15
1.4 Structure ........................................................................................................... 17
1.4.1 Introduction and theoretical background .................................................. 17
1.4.2 Article 1: Mapping Domain characteristics influencing Analytics initiatives
17
1.4.3 Article 2: Archetypes of Supply Chain Analytics .................................... 18
1.4.4 Article 3: Explaining the Competitive Advantage Generated from Analytics
with the Knowledge-based View ............................................................................ 19
1.4.5 Article 4: Overcoming Barriers in Supply Chain Analytics ..................... 20
1.4.6 Managing Supply Chain Analytics ........................................................... 21
2 Theoretic Background ............................................................................................. 23
2.1 Logistics and Supply Chain Management ........................................................ 23
2.1.1 Logistics .................................................................................................... 23
2.1.2 Supply Chain Management ....................................................................... 24
VIII
2.1.3 Synopsis .................................................................................................... 25
2.2 Analytics and related terms .............................................................................. 26
2.2.1 Analytics .................................................................................................... 27
2.2.2 Big Data ..................................................................................................... 28
2.2.3 Data Science .............................................................................................. 29
2.2.4 Artificial Intelligence ................................................................................ 30
2.2.5 Synopsis .................................................................................................... 32
2.3 Analytics in different Domains......................................................................... 32
2.3.1 Supply Chain Analytics ............................................................................. 32
2.3.2 Marketing Analytics .................................................................................. 34
2.3.3 Healthcare Analytics ................................................................................. 36
2.3.4 Public Sector Analytics ............................................................................. 37
2.3.5 Sports Analytics ........................................................................................ 39
3 Mapping domain characteristics influencing Analytics initiatives - The example of
Supply Chain Analytics ................................................................................................... 41
3.1 Introduction ...................................................................................................... 41
3.2 Theoretical background .................................................................................... 44
3.2.1 The matter of domain in Analytics ............................................................ 44
3.2.2 The impact of domain on Analytics .......................................................... 46
3.2.3 Modes of incorporating domain knowledge in Analytics initiatives ........ 48
3.3 Methodology ..................................................................................................... 50
3.3.1 Sample and data collection ........................................................................ 51
3.3.2 Data Coding and Analysis ......................................................................... 53
3.3.3 Trustworthiness ......................................................................................... 54
3.4 Results and discussion ...................................................................................... 55
3.4.1 The map of characteristics of Analytics initiatives differentiating domains
55
3.4.2 Specifics of the LSCM domain ................................................................. 66

IX
3.5 Conclusion and directions for further Research ............................................... 70
3.5.1 Theoretical Implications ........................................................................... 70
3.5.2 Managerial Implications ........................................................................... 71
3.5.3 Future research and Limitations ............................................................... 72
4 Archetypes of Supply Chain Analytics Initiatives – an exploratory study ............. 75
4.1 Introduction ...................................................................................................... 75
4.2 Theoretical Background ................................................................................... 78
4.2.1 Analytics ................................................................................................... 78
4.2.2 Supply Chain Analytics ............................................................................ 79
4.2.3 Dismantling Supply Chain Analytics Initiatives ...................................... 81
4.3 Methodology .................................................................................................... 84
4.3.1 Data Collection ......................................................................................... 84
4.3.2 Data Analysis ............................................................................................ 84
4.4 Results and Discussion ..................................................................................... 87
4.4.1 Cluster 1 – Educating ................................................................................ 87
4.4.2 Cluster 2 – Observing ............................................................................... 89
4.4.3 Cluster 3 – Alerting ................................................................................... 89
4.4.4 Cluster 4 – Advancing .............................................................................. 90
4.4.5 Cluster 5 – Refining .................................................................................. 91
4.4.6 Cluster 6 – Investigating ........................................................................... 92
4.4.7 Discussion on Archetypes ......................................................................... 92
4.4.8 Discussion on overcoming barriers with archetypes ................................ 94
4.5 Conclusion........................................................................................................ 95
4.5.1 Theoretical Contribution ........................................................................... 97
4.5.2 Managerial Contribution ........................................................................... 98
4.6 Final remarks .................................................................................................. 100
4.6.1 Limitations .............................................................................................. 100
X
4.6.2 Future Research ....................................................................................... 100
5 Explaining the Competitive Advantage Generated from Analytics with the
Knowledge-based View – The Example of Logistics and Supply Chain Management103
5.1 Introduction .................................................................................................... 103
5.2 Theoretical Background ................................................................................. 106
5.2.1 Knowledge-based view ........................................................................... 106
5.2.2 Analytics .................................................................................................. 113
5.2.3 Parallelism of knowledge-based view and Analytics .............................. 120
5.3 Methodology ................................................................................................... 124
5.3.1 Research Design ...................................................................................... 125
5.3.2 Data Collection ........................................................................................ 126
5.3.3 Data Analysis .......................................................................................... 129
5.3.4 Trustworthiness ....................................................................................... 129
5.4 Results and Discussion ................................................................................... 130
5.4.1 Starting position for Analytics initiatives ................................................ 130
5.4.2 Focus of Analytics initiatives .................................................................. 132
5.4.3 Problem-solving process ......................................................................... 134
5.4.4 Roles in Analytics initiatives ................................................................... 136
5.4.5 Including external expertise .................................................................... 138
5.4.6 Data as a resource .................................................................................... 141
5.4.7 Deploying Analytics solutions ................................................................ 143
5.4.8 The responsibilities of the user ................................................................ 145
5.4.9 Organizational factors of Analytics initiatives ........................................ 148
5.4.10 The long-term usability of solution in Analytics initiatives .................... 150
5.5 Conclusion ...................................................................................................... 151
5.5.1 Theoretical implications .......................................................................... 154
5.5.2 Managerial Implications .......................................................................... 155

XI
5.5.3 Future research and limitations ............................................................... 157
6 Overcoming Barriers in Supply Chain Analytics – Investigating measures in LSCM
organizations ................................................................................................................. 159
6.1 Introduction .................................................................................................... 159
6.2 Theoretical Background ................................................................................. 161
6.2.1 Supply chain Analytics ........................................................................... 161
6.2.2 Barriers of Supply Chain Analytics ........................................................ 163
6.2.3 Measures to fully utilize the benefits of Analytics ................................. 167
6.3 Methodology .................................................................................................. 170
6.3.1 Research Design ..................................................................................... 170
6.3.2 Data Collection ....................................................................................... 171
6.3.3 Data Analysis .......................................................................................... 173
6.3.4 Reliability ................................................................................................ 174
6.4 Results and Discussion ................................................................................... 176
6.4.1 Barriers .................................................................................................... 177
6.4.2 Measures ................................................................................................. 183
6.4.3 Discussion on applying measures and handling barriers ........................ 190
6.5 Conclusion...................................................................................................... 194
6.5.1 Managerial Implications ......................................................................... 195
6.5.2 Limitations and Further Research ........................................................... 196
7 Enabling LSCM organizations to use Analytics ................................................... 199
7.1 Scope of application ....................................................................................... 199
7.1.1 The focus of this thesis ........................................................................... 199
7.1.2 The scope of data collection ................................................................... 201
7.2 The value for the customer ............................................................................. 206
7.2.1 Indirect value for the customers .............................................................. 206
7.2.2 Direct value for the customers ................................................................ 209
XII
7.3 An approach to manage Supply Chain Analytics initiatives .......................... 211
7.3.1 Motivation and procedure of deriving an approach to manage Supply Chain
Analytics initiatives ............................................................................................... 212
7.3.2 Comparison of approaches to manage Analytics initiatives ................... 215
7.3.3 A supplemented CRISP-DM approach to manage Supply Chain Analytics
219
7.3.4 Case study-based evaluation of approach to manage Supply Chain
Analytics initiatives ............................................................................................... 234
8 Conclusion ............................................................................................................. 239
8.1 Summary ......................................................................................................... 240
8.2 Limitations ...................................................................................................... 244
8.3 Future Research .............................................................................................. 246
References ..................................................................................................................... 248
Appendix A ................................................................................................................... 266
Appendix B ................................................................................................................... 281
XIII
Figures
Figure 1: Summary of research motivation .................................................................... 10
Figure 2: A problem’s definition .................................................................................... 14
Figure 3: Affiliation of thesis content to SEP ................................................................. 14
Figure 4: Focus of article 1 ............................................................................................. 18
Figure 5: Focus of article 2 ............................................................................................. 19
Figure 6: Focus of article 3 ............................................................................................. 20
Figure 7: Focus of article 4 ............................................................................................. 21
Figure 8: Intended goal of aggregating and enriching the articles ................................. 22
Figure 9: (left) Duration of Interviews with Experts, (right) Experts Experience in
Analytics ......................................................................................................................... 52
Figure 10: The paradigm scheme of components ........................................................... 54
Figure 11: Map of domain-specific aspects of Analytics initiatives .............................. 57
Figure 12: Characteristics of a Supply Chain Analytics Initiative ................................. 82
Figure 13: Dendrogram of Cluster Analysis with Ward's method.................................. 86
Figure 14: Cluster Evaluation (best evaluated in grey) .................................................. 87
Figure 15: Proposed Supply Chain Analytics archetypes (no chronology or sequence
intended) ......................................................................................................................... 88
Figure 16: Knowledge integration illustrated ............................................................... 108
Figure 17: Sustainable competitive advantage from knowledge illustrated ................. 110
Figure 18: Knowledge creation illustrated .................................................................... 112
Figure 19: Knowledge sources and transfer illustrated. ............................................... 113
Figure 20: Visualizing the knowledge-based view ....................................................... 114
Figure 21: The process of Analytics initiatives illustrated ........................................... 116
Figure 22: Process accompanying conditions illustrated .............................................. 118
Figure 23: Enabling advantages from Analytics illustrated.......................................... 119
Figure 24: The value creation process of Analytics initiatives ..................................... 121
Figure 25: Creating competitive advantage from Analytics ......................................... 152
Figure 26: Barriers of Supply Chain Analytics ............................................................ 178
Figure 27: Measures to support Supply Chain Analytics ............................................. 184
Figure 28: Overview of cases for article 2 .................................................................... 203
Figure 29: CRISP-DM approach to Analytics initiatives (Chapman et al., 2000) ....... 213

XIV
Figure 30: Comparison of sequence, number and scope of phases of management
approaches to Analytics initiatives ................................................................................ 217
Figure 31: Overview of the sCRISP-A to manage Supply Chain Analytics initiatives 219
XV
Tables
Table 1: Propositions and rival explanations ................................................................ 127
Table 2: Case study interviewees and organizations .................................................... 128
Table 3: Interview Participants ..................................................................................... 172
Table 4: Overview of interviewed experts for article 1 ................................................ 202
Table 5: Overview of interviewed experts for article 3 ................................................ 204
Table 6: Overview of interviewed experts for article 4 ................................................ 205
Table 7: Characteristics of compared approaches to manage Analytics initiatives ...... 216
Table 8: Tasks of the orientation phase ........................................................................ 221
Table 9: Tasks of the business understanding phase .................................................... 224
Table 10: Tasks of the data understanding phase ......................................................... 226
Table 11: Tasks of the data preparation phase .............................................................. 227
Table 12: Tasks of the modeling phase ........................................................................ 229
Table 13: Tasks of the evaluation phase ....................................................................... 230
Table 14: Tasks of the deployment phase ..................................................................... 232
Table 15: Tasks of support phase ................................................................................. 234
XVI
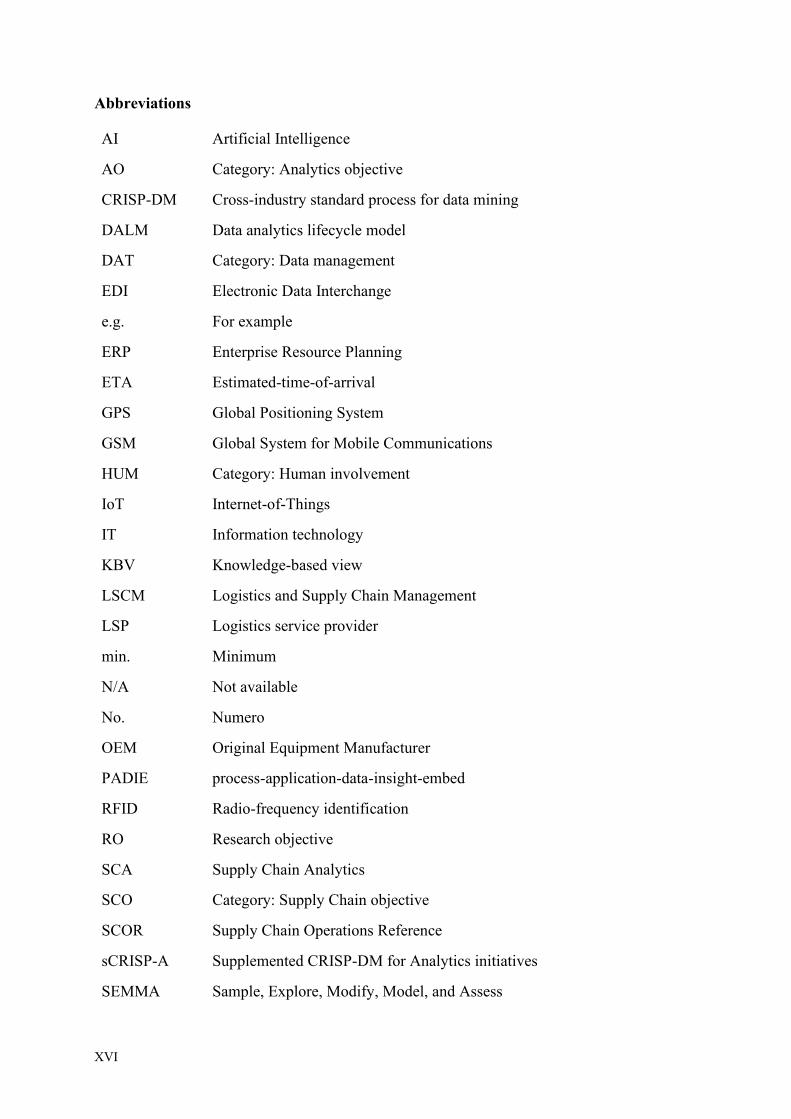
Abbreviations
AI Artificial Intelligence
AO Category: Analytics objective
CRISP-DM Cross-industry standard process for data mining
DALM Data analytics lifecycle model
DAT Category: Data management
EDI Electronic Data Interchange
e.g. For example
ERP Enterprise Resource Planning
ETA Estimated-time-of-arrival
GPS Global Positioning System
GSM Global System for Mobile Communications
HUM Category: Human involvement
IoT Internet-of-Things
IT Information technology
KBV Knowledge-based view
LSCM Logistics and Supply Chain Management
LSP Logistics service provider
min. Minimum
N/A Not available
No. Numero
OEM Original Equipment Manufacturer
PADIE process-application-data-insight-embed
RFID Radio-frequency identification
RO Research objective
SCA Supply Chain Analytics
SCO Category: Supply Chain objective
SCOR Supply Chain Operations Reference
sCRISP-A Supplemented CRISP-DM for Analytics initiatives
SEMMA Sample, Explore, Modify, Model, and Assess

XVII
SEP Strategy execution process
TA Category: Type of Analytics
TEC Category: Technological aspects
TSP Theory on structuring problems
UPGMA Unweighted Pair Group Method with Arithmetic Mean
VOIP Voice over Internet Protocol
WPGMA Weighted Pair Group Method with Arithmetic Mean
yrs. Years

XVIII
1
1 Introduction
“The purpose of computing is insight, not numbers” is the motto of Richard W.
Hamming’s book “Numerical methods for scientists and engineers” (1962, p. 395), which
covers problem solving with the help of computing for scientists and engineers. The book
is an early example of modelling and data analysis that goes beyond the question of
calculating and raises concerns about the purpose of calculations. The author highlights
that computing may not only answer questions, but rather can help to gain understanding
of the situation around the question that is examined. He indicates a residual to be handled
– a lack of knowledge about the purpose of the calculation – and a problem proposer who
may not exactly know, what he wants. In the light of this thesis, the lacking knowledge
may include the actual problem, the applicability of the solution or whether a user would
actually apply the solution. These issues, which are managerial instead of numerical, are
similarly occurring for Supply Chain Analytics and are under investigation in this thesis.
1.1 Research Motivation
During the research for this thesis and a short-lived timespan before it, a large body of
research about Analytics in Logistics and Supply Chain Management (LSCM) emerged,
motivating this thesis. To preemptively summarize the subsequently presented research
motivation, Analytics composes a field full of potential to reduce costs, improve
efficiency and enable new courses for actions for organizations in LSCM. However, it is
a complex field with technological, organizational and human-based drivers of
complexity leading to a vast variety of barriers and reluctance hindering the successful
realization of the desired benefits and creation of value or rather valuable solutions. Thus,
this thesis does not intend to develop further new technological solutions, algorithms or
models, organizations may equally be obstructed and reluctant to apply. The motivation
of this thesis, founded on the subsequent section, is to gain understanding and insights on
these barriers, the reluctance and the requirements to enable benefits from Analytics.
Based on understanding and insights, this thesis intends to provide organizations in
LSCM and organizations executing LSCM activities with means to identify, comprehend
and control these drivers of complexity. Consequently, the motivation is to enable them
to successfully use Analytics, realize the desired benefits and generate valuable solutions,
such that they can create sustainable competitive advantage and continuous improvement.
In summary, this thesis focusses on means and practices of the management of Analytics
in LSCM – the management of “Supply Chain Analytics” (SCA).
2
1.1.1 Theoretical Motivation
Prior to discussing the body of research, a short notice on taxonomy is necessary. For the
purpose of research on management of Analytics, the terms Analytics, Data Science, Big
Data (Analytics) and Artificial Intelligence (AI) are considered as synonyms. As will be
discussed in section 2.2, these terms show differences in the foundational technologies or
the deployed analytical methods but are identically based on the analysis of data to impact
decision-making in organizations and display similar organizational effects and barriers.
Hence, the terms are regarded synonymous in this thesis for their objective to create value
from data.
The following discussion on theoretical motivation considers scientific literature on
theoretical arguments and inference from usually smaller samples (e.g., case studies and
small sample surveys). From this literature, the extracted aspects of eligibility,
accessibility, performance increase, competitive advantage, and barriers have been
extracted.
A primary consideration has to be, whether the domain of LSCM is eligible to adopt and
apply Analytics. Thereby, eligibility is supposed to describe whether the domain meets
the requirements and has a need for Analytics. The relationship between Analytics and
LSCM has been emphasized in the literature from various points of view. LSCM is
considered as an early adopter and traditional user of analytical methods such as statistical
forecasting and Operations Research (Chae, Olson, et al., 2014; Davenport, 2009;
Matthias et al., 2017; Sanders, 2016; Souza, 2014). LSCM has developed into a
knowledge-based domain relying on data and analytics for better decision-making.
Additionally, many activities in LSCM focus on exploitation of data (Brinch et al., 2018;
Trkman et al., 2010). A variety of activities benefit from Analytics and accurate provision
of data, since the decisions in these activities are rich in optional actions and requirements
to be considered, as well as their trade-offs (Chae, Yang, et al., 2014; Souza, 2014; Wang
et al., 2016). In addition, the demand for Analytics in LSCM is growing due to increases
in the complexity of decision-making caused by increased competition, uncertainty,
customization, need for sustainability and globalization (Chae, Yang, et al., 2014; Lai et
al., 2018; Roßmann et al., 2018). The domain of LSCM is also considered as data intense
due to producing a lot of operational data per organization which are eventually shared in
collaborative activities with business models (e.g., forth-party logistics providers)
completely reliant on data exchange for coordination, planning and integration of shared
3
logistical tasks (Chae, Yang, et al., 2014; Dutta and Bose, 2015; Hopkins and Hawking,
2018; Ludwig, 2014). This makes LSCM a good fit for Analytics. This characteristic has
been recognized by practitioners for its potential of high returns for organizations (Jeske
et al., 2013; Kiron et al., 2012; Lavalle et al., 2011). Further, an achieved increase in
performance may eventually improve the performance of supply chain partners (Oliveira
et al., 2012; Richey et al., 2016). In summary, LSCM is very well suited to employ
quantitative methods from Analytics to exploit data.
The aspect of accessibility shall describe the technological changes that enable new
opportunities for creating value from Analytics in LSCM and, of course, in other domains.
The most famous component of this, is the huge amount of data collected today, since a
considerable number of publications on SCA mentions the newest projection of the
worldwide amount of data in some future year (e.g., Chae, Yang, et al., 2014; Roßmann
et al., 2018). The increasing ease of collecting data has led to an increase of collected data
in LSCM as well (Schoenherr and Speier-Pero, 2015; Waller and Fawcett, 2013). Along
the process, data is collected from all sorts of sources including GPS sensors, RFID
sensors creatively used in various forms, mobile devices, transactional IT systems, point-
of-sales devices, different forms of scanners, and increasingly from machines and assets
which are delivered with data collection abilities through several sensors sending status
and performance (Kache and Seuring, 2017; Matthias et al., 2017; Richey et al., 2016;
Sanders, 2016; Souza, 2014; Wang et al., 2016). Additionally, data may come from
external sources such as data exchange with partners and customers, social media,
customer feedback, or external signals such as traffic conditions (Kache and Seuring,
2017; Matthias et al., 2017; Sanders, 2016; Srinivasan and Swink, 2018). Besides data
collection, the exchange of data has improved especially in velocity due to the internet
giving real-time abilities in an internet speed like information exchange internally and
externally (Kache and Seuring, 2017; Sanders, 2016; Wang et al., 2016). Finally,
technologies and methods have improved. Methods for analyzing data have had large
developments, especially in machine learning techniques to exploit the larger amount of
data and sources (Chae, Olson, et al., 2014; Sanders, 2016; Waller and Fawcett, 2013).
Technologies like in-memory databases, virtualization (“cloud computing”) and
distributed computing (e.g., Hadoop) provide the technical abilities to exploit the data
(Hahn and Packowski, 2015; Hopkins and Hawking, 2018; Roßmann et al., 2018).

4
The review of scientific literature presented an extensive potential for the performance
increase of LSCM activities. However, taking a deeper look, most effects are indirect
from better and more frequent visibility, gained transparency into the past, present and
future, and resulting decision-making. Having an extensively transparent insight into past
performance, issues, failures/unwanted behavior of assets or employees, costs of
activities and suppliers, bottlenecks as well as all ongoing activities along the supply
chain allows to identify improvement potential and distribute resources in a more efficient
way (Brinch et al., 2018; Chae, Yang, et al., 2014; Dutta and Bose, 2015; Sanders, 2016;
Wang et al., 2016; Zhu et al., 2018). This is key to mastering the increasing challenging
environment for logistics, such as dense urban areas (Straube, Reipert, et al., 2017).
Visibility about the future due to forecasts and improved understanding of uncertainties
in supply, demand and costs allows to create better and optimized plans for improved
utilization (effectiveness) with reduced slack resources and expensive reactions (e.g.,
safety stocks, overtime, expedited shipments, markdowns) (Hazen et al., 2014; Richey et
al., 2016; Roßmann et al., 2018; Sanders, 2016; Srinivasan and Swink, 2018). Finally,
monitoring the present actions in real-time allows dynamic decision-making for faster
reactions to changing market conditions, changing needs of customers, and suppliers,
degrading performance and incidents with subsequently faster corrective actions and
shorter downtime (Chavez et al., 2017; Dutta and Bose, 2015; Kache and Seuring, 2017;
Wang et al., 2016; Zhu et al., 2018) Given that improved decisions are made from this
transparency and visibility, improving efficiency, utilization and time, it eventually leads
to reduced costs (Dutta and Bose, 2015; Kache and Seuring, 2017; Richey et al., 2016) as
an indirect effect from Analytics applied to LSCM. An important concluding point is that
Analytics effects are indirect by enabling and triggering actions with improved outcome
(Chae, Yang, et al., 2014) and thus do not guarantee performance increase from
investments in Analytics if process flexibility and process maturity do not allow to
execute the actions (Oliveira et al., 2012; Srinivasan and Swink, 2018). There is no
performance increase from analyzing data itself, what makes measuring Analytics impact
on LSCM performance difficult.
Research has also argued for the competitive advantage created from adopting Analytics
in LSCM. Scholars have argued for competitive advantage based on observing
performance increase, gained market share, and improved management decisions –
generally an improved position in competition – after investing and adopting Analytics
5
to LSCM (Dutta and Bose, 2015; Matthias et al., 2017; Oliveira et al., 2012). Adding to
this list is the strategic opportunity for improved differentiation from competitors, which
is, however, not directly labeled as competitive advantage (Roßmann et al., 2018). It has
been argued, that SCA itself is a resource, which is valuable, inimitable, and non-
substitutable and thus is resultingly a source of sustained competitive advantage (Chae,
Olson, et al., 2014). Furthermore, scholars argue it to be a second order support or driver
of capabilities, which generate competitive advantage. This includes manufacturing
capabilities, represented by the ability to manufacture goods of high quality, flexible and
with low costs for customer satisfaction, as well as effectiveness and efficiency
capabilities, and innovation capabilities (Chavez et al., 2017; Hopkins and Hawking,
2018; Trkman et al., 2010). However, these interpretations of the impact of Analytics to
LSCM are theoretical.
As indicated above, adopting and applying Analytics is no sure-fire success. There are
barriers and challenges to using it in LSCM and, thus, obstruct the benefits explained
above, and managers require guidance to overcome these barriers. An extensive
discussion on barriers follows in a later part of this thesis. As a preliminary review, it
shall be emphasized, that barriers are observable at multiple stages and influencing
multiple resources. On a management level, commitment and knowledge might be
missing (Lai et al., 2018; Richey et al., 2016). On an operational level, the employees
might be inexperienced with Analytics, uncreative about using data to their advantage, or
unable to explain the value of their ideas (Kache and Seuring, 2017; Sanders, 2016;
Schoenherr and Speier-Pero, 2015). On a cultural level, a lack of openness to new data
driven solutions may exist, possibly a strong unwillingness against it (Dutta and Bose,
2015; Richey et al., 2016). Concerning resources, IT systems’ readiness for Analytics or
rather the ability to integrate the systems’ data might be missing (Kache and Seuring,
2017; Richey et al., 2016; Schoenherr and Speier-Pero, 2015). The data, which are core
to Analytics, might not be available or have a bad quality, resulting in inaccurate or faulty
analyses (Hazen et al., 2014; Schoenherr and Speier-Pero, 2015). Finally, the physical
process may not be ready to exploit the opportunities presented by Analytics since
maturity and flexibility are missing (Oliveira et al., 2012; Srinivasan and Swink, 2018).
In summary, organizations require guidance for managerial actions for Analytics in
LSCM before they can exploit the quantitative methods.
6
1.1.2 Practical Motivation
For the practical motivation, reports from organizations (e.g., technology and Analytics
providers, service providers and associations in LSCM, consultancies) have been
considered, which infer the effects of Analytics on LSCM from their own projects or
larger samples. Discussed below are the extracted aspects of gains in efficiency, customer
orientation, business potential, and reluctance. These aspects strongly relate to the
theoretical aspects displayed above but present the perspectives and communications
from practitioners.
The practitioners’ perception, expectations and actual gains in efficiency are similar to
the theoretically argued performance effects. Analytics has been reported to gain strategic
priority due to improved decision-making abilities from increased visibility, even though
the monetary return is unclear (Johnson and Cole, 2016; Thieullent et al., 2016). Thereby,
organization-wide strategies to exploit Analytics are indicated to be more efficient with
leaders in LSCM expecting higher returns than followers (Pearson et al., 2014; Schmidt
et al., 2015). This concurs with the research results emphasizing the need for process
maturity to gain benefits from Analytics in LSCM. The reported gains from Analytics in
LSCM are usually discussed related to applications. A frequently used example is
predictive maintenance of machines and transportation assets, which achieves benefits
like less failures and higher availability, and results in higher yield, higher utilization and
subsequently reduced cost (Lueth et al., 2016; Monahan et al., 2017; Opher et al., 2016;
Thieullent et al., 2016). Real-time visibility of assets and process conditions is repeatedly
emphasized for achieved asset control and utilization from dynamic adjustments on new
information (“real-time optimization”) as well as fast reactions on incidents, both
avoiding cost (Henke et al., 2016; Jeske et al., 2013; Pearson et al., 2014; Thieullent et
al., 2016; UPS, 2016). Further specifically named applications are demand forecasting
(with increased accuracy), which avoids cost of committing too much or too few
resources, and systematic analysis of expenses, which allows improved control of
expenses (Henke et al., 2016; Jeske et al., 2013; Johnson and Cole, 2016; Phillipps and
Davenport, 2013). Additionally reported improvements are shortened time of processes,
optimized resource consumption, identification of issues and their root cause, improved
process quality and performance, removal of unnecessary process steps, and optimization
of processes along the supply chain, all eventually resulting in cost savings (Erwin et al.,
2016; Henke et al., 2016; Jeske et al., 2013; Johnson and Cole, 2016; Opher et al., 2016;
7
Thieullent et al., 2016). The expectations from organizations planning to adopt SCA, are
similar to these reported benefits (Henke et al., 2016; Kersten et al., 2017; Thieullent et
al., 2016). In summary, reports show a similar impact of SCA as scientific research.
Considering the review above, the reported and theorized benefits are principally
internally focused on operations and show little effect on the customer. However,
Analytics is also reported as a critical mean for customer orientation in LSCM. Research
has mentioned the customer briefly as an eventual beneficiary, since monitoring of
suppliers and service providers becomes easier and resulting in the fulfillment of
customer requirements (Sanders, 2016; Wang et al., 2016). Further, it becomes possible
to perceive customer needs and behavior in more detail, and act more customer oriented,
which has been stated as key argument for investments in Analytics (Kache and Seuring,
2017; Ramanathan et al., 2017; Sanders, 2016). Practitioners’ reports address this aspect
from several perspectives. One such effect being increased customer satisfaction from
avoided product shortages, is mentioned repeatedly (Jeske et al., 2013; Thieullent et al.,
2016). Further, Analytics in LSCM has been explained as necessary to cope with changes
in customer behavior and requirements based on Business-to-Customer trends and the
digital transformation. These changes lead to increased expectations in customization of
products and services, immediacy and convenience, which result in higher demand
uncertainty (Monahan et al., 2017; Opher et al., 2016; Thieullent et al., 2016; UPS, 2016).
Business-to-Business sector customers are expected to demand similar data and
Analytics-driven services as they observe in Business-to-Customer sectors like tracking
and tracing, but also transparency and comparability of cost and quality, and full-service
offerings (Dichter et al., 2018; Garner and Kirkwood, 2017). Additionally, Analytics is
argued as a critical driver for improved understand of customer needs, the context of their
needs, and reasons for their satisfaction or dissatisfaction (Dichter et al., 2018; Jeske et
al., 2013). Based on Analytics, internally executed customer segmentation and externally
offered data-driven services are drivers to address customers more individualized and
oriented on their identified needs (Jeske et al., 2013; Kersten et al., 2017).
The previous aspect already indicates how business of LSCM is changing, but the
business potential from SCA is far greater. The business potential from Analytics in
LSCM is highlighted by organizations perceiving it favorably to use LSCM as starting
business area for Analytics in the organization due to promising returns, a source of
untapped efficiency and continuous improvement, and a mean to create reliable
8
orchestration of supply chains without the need of full control (Jeske et al., 2013; Kiron
et al., 2012; Lavalle et al., 2011; Opher et al., 2016). However, this paragraph shall
highlight the relevance for data-driven business models and digital services in LSCM due
to new forms of collaboration and innovation enabling new revenue streams (Jeske et al.,
2013; Kersten et al., 2017; Straube, Bahnsen, et al., 2017). Business models are impacted
by Analytics in three different ways: (1) upgrading existing services and products by
incorporating Analytics into them, (2) changing the business model due to new possible
actions enabled by Analytics, and (3) creating new Analytics-driven business models
(Lueth et al., 2016). Upgrading the existing business models can result from enhancing
products and services with data and Analytics-driven features that add value to the
customer such as end-to-end track and trace (“visibility”), or end-to-end booking (Dichter
et al., 2018; Lueth et al., 2016). An example of changing the business model in LSCM
based on Analytics would be crowd-based last mile solutions, which depend on analysis
of real-time data streams on demand and available supply in the crowd (Jeske et al., 2013).
The reports further present examples between upgrade and change of business models,
taking and redesigning existing services such as brokerage and forwarding with Analytics
to prove better service quality, automation for increased efficiency, and advanced abilities
to identify opportunities for customers (Dichter et al., 2018; Monahan et al., 2017).
However, these opportunities are under threat from technology-savvy organizations,
which might deploy Analytics-driven innovations faster and shape customer expectations
while attacking profitable processes and might be preferred by shippers due to the savings
opportunities (Dichter et al., 2018; Garner and Kirkwood, 2017). Finally, an example for
new business models for LSCM is the monetization of data including offerings to
completely new partners. Data can be collected with Internet-of-Things (IoT) devices
attached to distributed and moving assets in the network or is already collected to execute
global operations (Dichter et al., 2018; Jeske et al., 2013). Thus, revenue may be
generated from data on climate, pollution, traffic, origin and destination pairs, which can
be of interest to governmental agencies, economic analysts, insurances or banks.
In line with the barriers discussed in the theoretical motivation, but in contrast to the
potential value of Analytics for LSCM, practitioner reports show reluctance in adopting
Analytics to LSCM, which, like barriers, leads to missed benefits of analytics. Scientific
research has briefly indicated missing adoption and investments (Brinch et al., 2018;
Schoenherr and Speier-Pero, 2015). But the presented picture in practitioners’ reports is
9
more dramatic. These reports present multiple areas where organizations in LSCM
struggle with Analytics or with creating a conducive environment to adopt Analytics,
since organizations experience challenges in collaboration, workforce, cost and data
(APICS, 2015; Kersten et al., 2017; Pearson et al., 2014; Thieullent et al., 2016). Some
organizations adopting Analytics do not realize the aspired success due to the barriers or
missing commitment (Thieullent et al., 2016). However, some organizations also see no
priority to invest in Analytics. A variety of reports (LSCM specific surveys and cross-
industry comparisons) identify LSCM as a “laggard” in Analytics with 50% to less than
10% of organizations reported to have implemented some form of Analytics (Erwin et
al., 2016; Kersten et al., 2017; Pearson et al., 2014; Thieullent et al., 2016). Taking a
deeper look, UPS presents implementation spanning over several levels of maturity with
few organizations achieving the highest levels and warns about a widening gap with
latecomers at risk of becoming disadvantaged in competition (UPS, 2016). In addition,
LSCM is below average in creating value from Analytics in cross-industry comparison,
is ranked lowest as thought leader in business function comparison and about 40% of
respondents in a LSCM survey don’t plan to invest (Bange et al., 2015; Erwin et al., 2016;
Kersten et al., 2017). Germany is especially highlighted for investing heavily in hardware
under the industry 4.0 movement while not investing in Analytics in a comparable manner
which creates a risky imbalance (Thieullent et al., 2016). Today’s high degree of
excellence in LSCM has been achieved without Analytics and the sector takes pride in it,
but there is a limit for these methods, which Analytics can overcome (UPS, 2016).
Analytics has currently no priority for many organizations in LSCM, with some
organizations expecting it to become critical within 5 years and others never (Johnson
and Cole, 2016; Lueth et al., 2016; Pearson et al., 2014; Schmidt et al., 2015). But, as
mentioned above, shippers increasingly rely on Analytics-driven technologically savvy
organizations, which absorb some profitable services of traditional LSCM organizations
and “it seems there’s a disconnect between what shippers and [Logistics Service
Providers] believe will happen” (Johnson and Cole, 2016, p. 12).
1.1.3 Summary Motivation
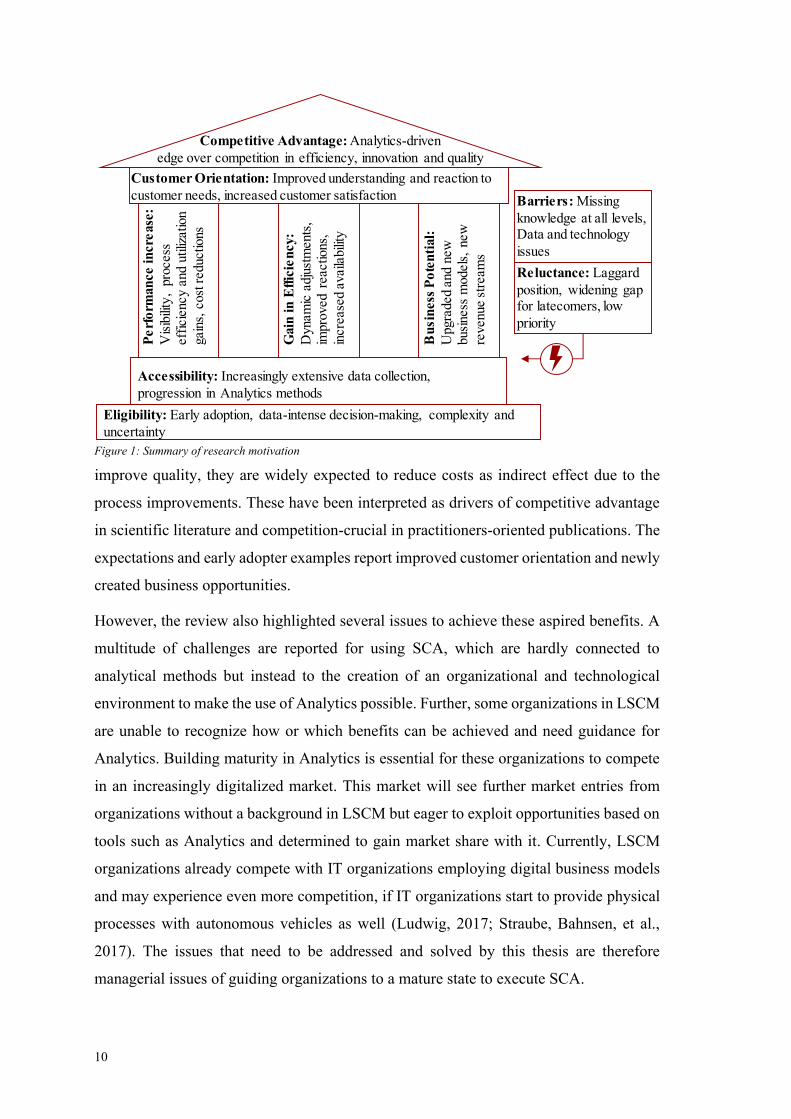
As illustrated in Figure 1, reviewing the scientific literature and practitioners’ reports has
presented an extensive range of advantages and values that can be gained from adopting
and employing Analytics in LSCM. While the advantages primarily revolve around
improvements of processes to increase efficiency, increase utilization, reduce times, and
10
improve quality, they are widely expected to reduce costs as indirect effect due to the
process improvements. These have been interpreted as drivers of competitive advantage
in scientific literature and competition-crucial in practitioners-oriented publications. The
expectations and early adopter examples report improved customer orientation and newly
created business opportunities.
However, the review also highlighted several issues to achieve these aspired benefits. A
multitude of challenges are reported for using SCA, which are hardly connected to
analytical methods but instead to the creation of an organizational and technological
environment to make the use of Analytics possible. Further, some organizations in LSCM
are unable to recognize how or which benefits can be achieved and need guidance for
Analytics. Building maturity in Analytics is essential for these organizations to compete
in an increasingly digitalized market. This market will see further market entries from
organizations without a background in LSCM but eager to exploit opportunities based on
tools such as Analytics and determined to gain market share with it. Currently, LSCM
organizations already compete with IT organizations employing digital business models
and may experience even more competition, if IT organizations start to provide physical
processes with autonomous vehicles as well (Ludwig, 2017; Straube, Bahnsen, et al.,
2017). The issues that need to be addressed and solved by this thesis are therefore
managerial issues of guiding organizations to a mature state to execute SCA.
Eligibility: Early adoption, data-intense decision-making, complexity and
uncertainty
Accessibility: Increasingly extensive data collection,
progression in Analytics methods
Barriers: Missing
knowledge at all levels, Data and technology
issues
Reluctance: Laggard
position, widening gap for latecomers, low
priority
Customer Orientation: Improved understanding and reaction to
customer needs, increased customer satisfaction
Pe
rfo
rman
ce
in
cre
ase
:
Vis
ibili
ty,
pro
cess
eff
icie
ncy a
nd u
tiliz
ation
gain
s, c
ost
reductions
Bu
sin
ess
Po
ten
tial:
Upgra
ded a
nd n
ew
busi
ness
models
, new
revenue s
tream
s
Gain
in
Eff
icie
ncy:
Dynam
ic a
dju
stm
ents
, im
pro
ved r
eactions,
incre
ase
d a
vaila
bili
ty
Competitive Advantage: Analytics-driven
edge over competition in efficiency, innovation and quality
Figure 1: Summary of research motivation
11
1.2 Research Objective
As presented in the previous section, major struggles for organizations in LSCM and
managing LSCM activities – from here on “LSCM organizations” – with Analytics are
managerial and this thesis intends to provide guidance to overcome them. To form an
appropriate research design to address these struggles, this thesis assumes a managerial
approach, adopted from strategic management, to create specific research objectives,
develop directions for the thesis and gain structure. Hence, this thesis follows the five-
stage strategy execution process (SEP) as presented by Gamble et al. (2015). Besides
structure, the SEP provides an overall coherence to this research and a practitioner-
oriented terminology for the research process, which fits the application-oriented nature
of this thesis. The following list provides the adaptation of the SEP of Gamble et al.
(2015) to this thesis:
• Stage 1: Developing a strategic vision, mission and values [of the thesis]
• Stage 2: Setting objectives [for the scientific articles compiling the thesis]
• Stage 3: Crafting a strategy to achieve the objectives [by creating research designs
for the scientific articles] and move the [thesis] along the intended path
• Stage 4: Executing the strategy [by conducting the research]
• Stage 5: Evaluating and analyzing the external environment and the [research’s]
internal situation to identify corrective adjustments
Starting with Stage 1 of the SEP, the vision is supposed to describe course and direction
(Gamble et al., 2015). Explicitly, the vision of the thesis is:
LSCM organizations are enabled to use Analytics such that it creates a
sustainable competitive advantage and continuous improvement of processes and
customer satisfaction.
There are three components to this vision. First, organizations shall be enabled, which
addresses their capabilities to use Analytics and to consequently deploy the results into
business processes and having an organization wide acceptance for and familiarity with
Analytics. The word ‘enabled’ thereby refers to goal-oriented and deliberated actions
when using Analytics and setting up a supporting organizational environment. Second,
the effect from using Analytics shall be sustainable competitive advantage. By using
Analytics, organizations are supposed to position themselves better in the market by
having superior products, services, or value-added services and possessing deeper insight
12
into their market. Third, the internal effect shall be continuous improvement of processes
and customer satisfaction for products and services. These examples ought to underline
that process improvement can occur in forms perceptible by customers or solely internal,
while both can provide value to the focal organization and customers.
From this vision, a mission is derived. The mission describes the present scope and
purpose (Gamble et al., 2015), in this case, of the thesis. This mission represents the
overall research objective of this thesis. Regarding the research motivation (section 1.1),
organizations have high expectations towards Analytics but lack the ability to use it in a
successful manner, to provide value from it or are not enabled to use it at all.
Consequently, the mission/research objective of this thesis, pursued by collecting and
analyzing empirical evidence from organizations successfully applying Analytics, is to:
Provide guidance that enables LSCM organizations to use Analytics successfully
and turn it into sustainable competitive advantage and continuous improvement
of processes and customer satisfaction.
Following the vision, “enable” refers to goal-oriented and deliberated actions and the
existence of a supporting organizational environment in LSCM organizations.
To conclude stage 1 of the SEP, values are developed for pursuing the vision and mission
statement of this thesis. Due to the activities being of a research nature, the values for this
thesis are derived from recommendations for creating influential scientific results
(Fawcett et al., 2014). The resulting values for this thesis are as follows:
(1) The divergence from previous research is clearly articulated and the contribution
explicitly presented
(2) The research is justified by clearly highlighting the reasoning behind conducted
research and shortage in existing research
(3) The research is written with precision to create understanding and persuasion for
the results.
(4) The research is grounded in existing theory and uses it appropriately
(5) The methodology and data collection process are explained and justified in detail,
transparent and adhere to scientific standards while bias is aimed to be minimized.
(6) Results are tested for validity and reliability.
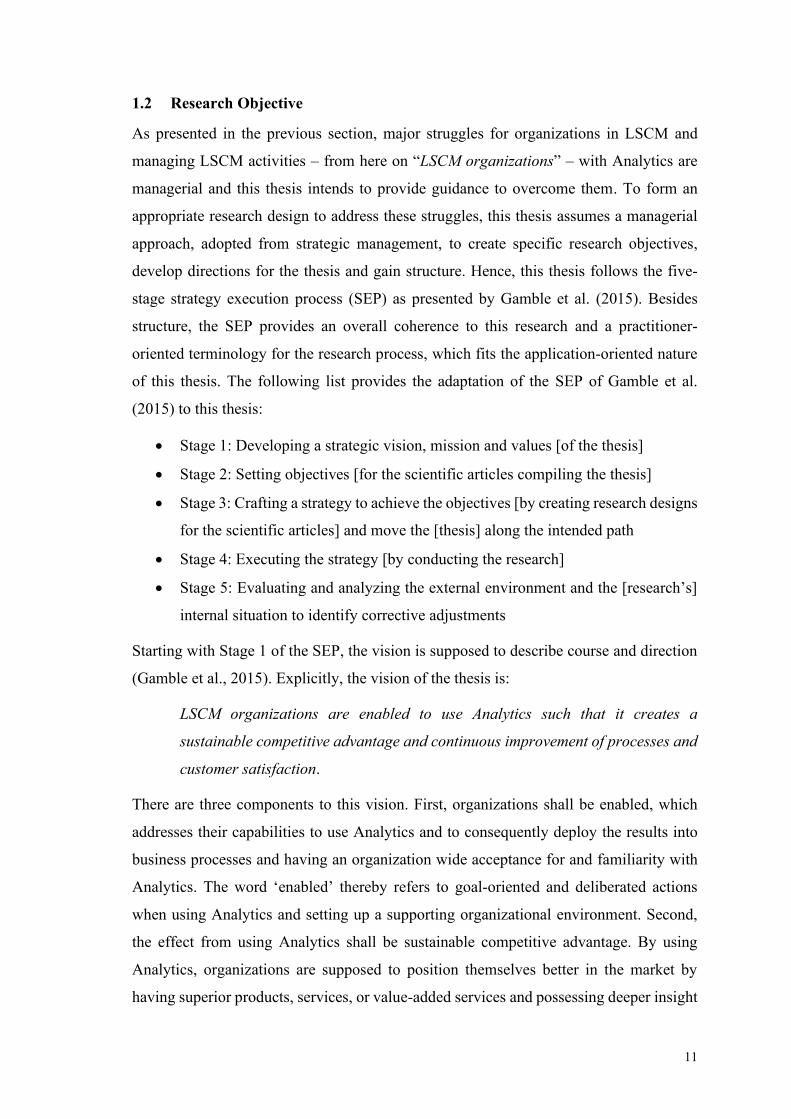
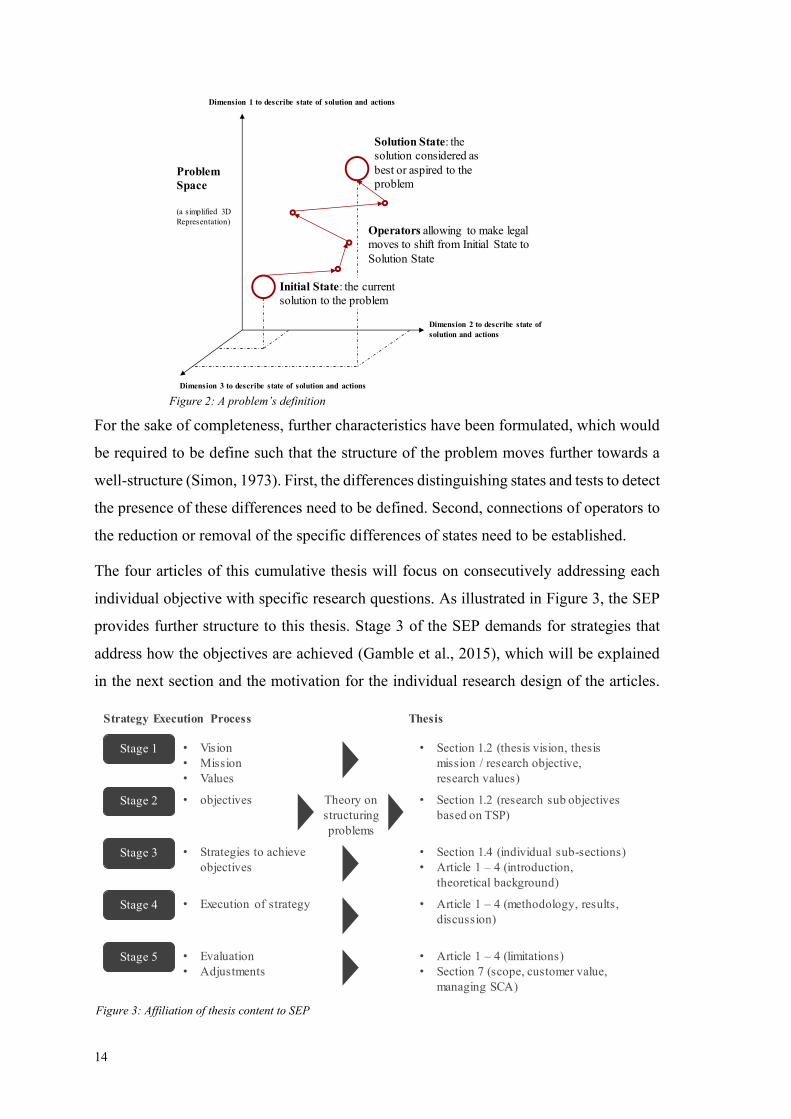
Subsequently, objectives are set to convert the vision into specific targets in stage 2 of the
SEP, whereby objectives represent desired results in the SEP (Gamble et al., 2015). To

13
derive the objectives, this thesis adapts the theory on structuring problems (TSP) from the
early AI research, which provides abstract directions for solving a problem (Simon,
1973). According to the TSP, a problem is defined by the following characteristics:
(1) Defined criteria to test proposed solutions
(2) Problem space delineating an initial state, a goal state and all other reachable states
(3) Attainable and legal state changes in the problem space
(4) Knowledge about the problem is presented by the problem space
(5) The problem space reflects the behavior of the external world
(6) Processes of state changes require a practical amount of activities (“computation”)
and information for the processes is effectively available
The definitiveness of these characteristic specifies the problem’s position on a theoretical
continuum between well-structured and ill-structured problems. According to the TSP,
the position on the structure continuum determines the ability of a “solver” to solve the
problem (Simon, 1973) – since the solver possesses guidance to solve the problem. For
the purpose of this thesis, the solvers are LSCM managers using the results of this
research to solve their problems. Further, their problems are to enable their LSCM
organizations to use Analytics in a manner creating sustainable competitive advantage
and continuously improving processes and customer satisfaction. Transferring the
abstract TSP to this thesis allows sub research objective to be derived, which in turn
contribute to defining this problem’s characteristics and moving it towards being well-
structured. Consequentially, four characteristics have been chosen due to their relevance
and close relation, as illustrated in Figure 2. The sub research objectives are as follows:
(1) Definition of the problem space: Identify the different dimensions, which
delineate the states of LSCM organizations adopting and employing Analytics.
(2) Definition of the initial state: Describe and characterize the current state of
LSCM organizations using Analytics.
(3) Definition of the solution state: Describe and characterize how LSCM
organizations create sustainable competitive advantage and continuous
improvement of processes and customer satisfaction.
(4) Identification of operators to change states and conditions of their
applicability: Identify operators allowing a path of state changes from the initial
state of LSCM organizations using Analytics to the solution state along reachable
states in the problem space.
14
For the sake of completeness, further characteristics have been formulated, which would
be required to be define such that the structure of the problem moves further towards a
well-structure (Simon, 1973). First, the differences distinguishing states and tests to detect
the presence of these differences need to be defined. Second, connections of operators to
the reduction or removal of the specific differences of states need to be established.
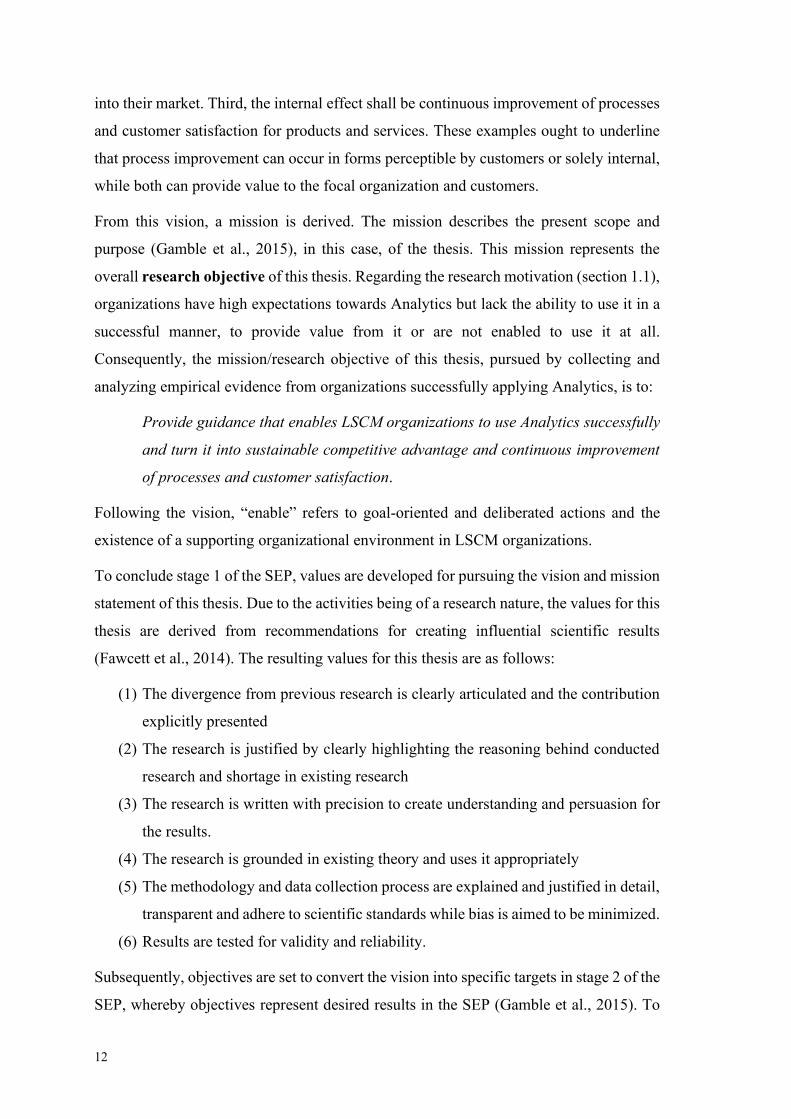
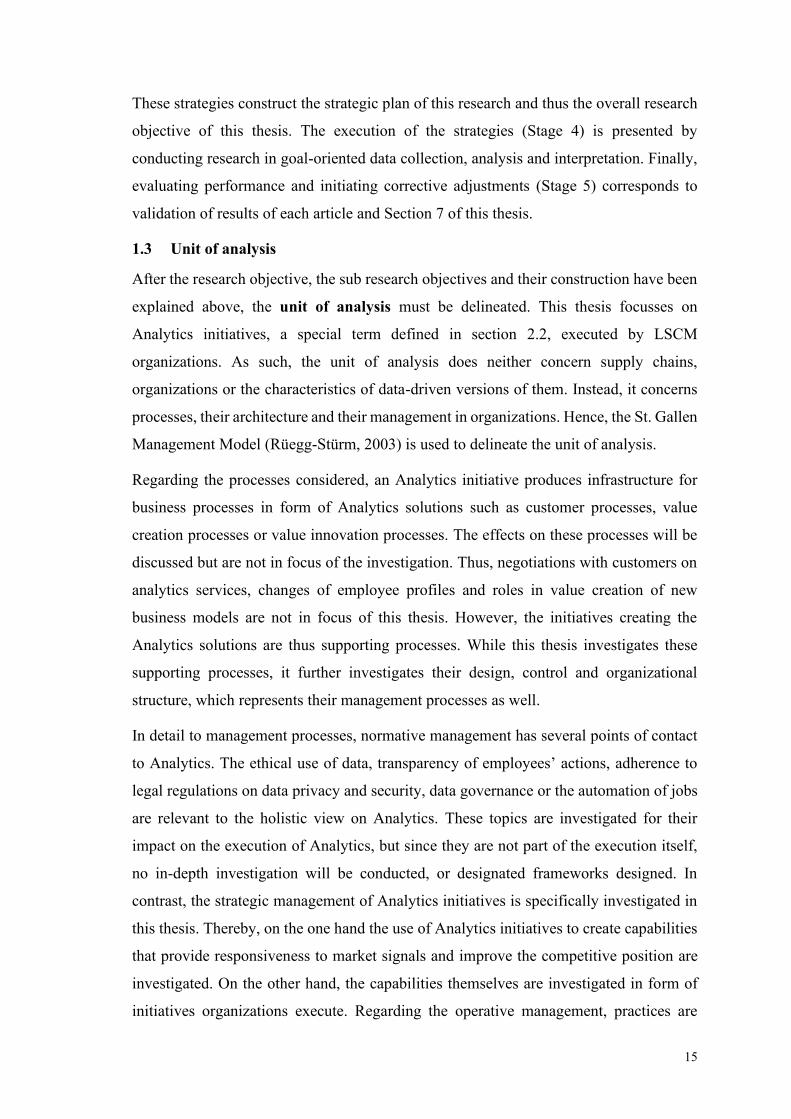
The four articles of this cumulative thesis will focus on consecutively addressing each
individual objective with specific research questions. As illustrated in Figure 3, the SEP
provides further structure to this thesis. Stage 3 of the SEP demands for strategies that
address how the objectives are achieved (Gamble et al., 2015), which will be explained
in the next section and the motivation for the individual research design of the articles.
Problem
Space
(a simplified 3D
Representation)
Dimension 1 to describe state of solution and actions
Dimension 3 to describe state of solution and actions
Solution State: the
solution considered as
best or aspired to the
problem
Initial State: the current
solution to the problem
Operators allowing to make legal
moves to shift from Initial State to
Solution State
Dimension 2 to describe state of
solution and actions
Figure 2: A problem’s definition
Strategy Execution Process Thesis
Stage 1 • Vision
• Mission
• Values
• Section 1.2 (thesis vision, thesis
mission / research objective,
research values)
Stage 2 • objectives • Section 1.2 (research sub objectives
based on TSP)
Stage 3 • Strategies to achieve
objectives
• Section 1.4 (individual sub-sections)
• Article 1 – 4 (introduction,
theoretical background)
Stage 4 • Execution of strategy • Article 1 – 4 (methodology, results,
discussion)
Stage 5 • Evaluation
• Adjustments
• Article 1 – 4 (limitations)
• Section 7 (scope, customer value,
managing SCA)
Theory on
structuring
problems
Figure 3: Affiliation of thesis content to SEP
15
These strategies construct the strategic plan of this research and thus the overall research
objective of this thesis. The execution of the strategies (Stage 4) is presented by
conducting research in goal-oriented data collection, analysis and interpretation. Finally,
evaluating performance and initiating corrective adjustments (Stage 5) corresponds to
validation of results of each article and Section 7 of this thesis.
1.3 Unit of analysis
After the research objective, the sub research objectives and their construction have been
explained above, the unit of analysis must be delineated. This thesis focusses on
Analytics initiatives, a special term defined in section 2.2, executed by LSCM
organizations. As such, the unit of analysis does neither concern supply chains,
organizations or the characteristics of data-driven versions of them. Instead, it concerns
processes, their architecture and their management in organizations. Hence, the St. Gallen
Management Model (Rüegg-Stürm, 2003) is used to delineate the unit of analysis.
Regarding the processes considered, an Analytics initiative produces infrastructure for
business processes in form of Analytics solutions such as customer processes, value
creation processes or value innovation processes. The effects on these processes will be
discussed but are not in focus of the investigation. Thus, negotiations with customers on
analytics services, changes of employee profiles and roles in value creation of new
business models are not in focus of this thesis. However, the initiatives creating the
Analytics solutions are thus supporting processes. While this thesis investigates these
supporting processes, it further investigates their design, control and organizational
structure, which represents their management processes as well.
In detail to management processes, normative management has several points of contact
to Analytics. The ethical use of data, transparency of employees’ actions, adherence to
legal regulations on data privacy and security, data governance or the automation of jobs
are relevant to the holistic view on Analytics. These topics are investigated for their
impact on the execution of Analytics, but since they are not part of the execution itself,
no in-depth investigation will be conducted, or designated frameworks designed. In
contrast, the strategic management of Analytics initiatives is specifically investigated in
this thesis. Thereby, on the one hand the use of Analytics initiatives to create capabilities
that provide responsiveness to market signals and improve the competitive position are
investigated. On the other hand, the capabilities themselves are investigated in form of
initiatives organizations execute. Regarding the operative management, practices are
16
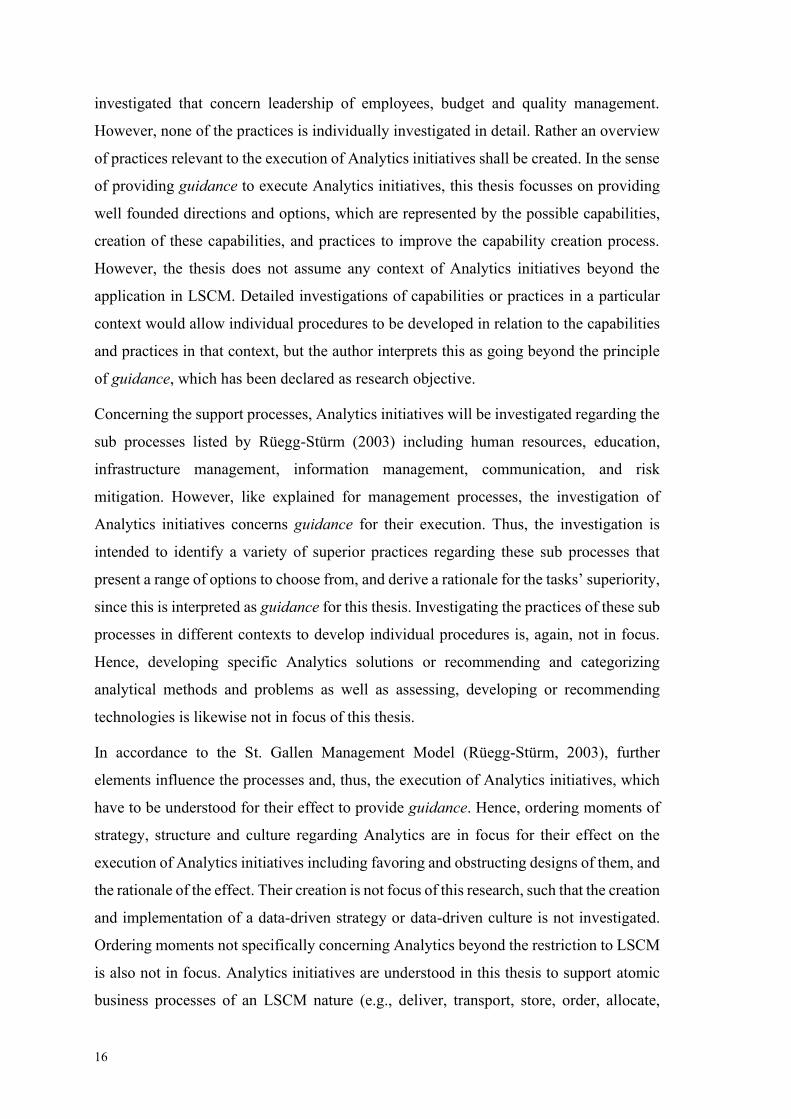
investigated that concern leadership of employees, budget and quality management.
However, none of the practices is individually investigated in detail. Rather an overview
of practices relevant to the execution of Analytics initiatives shall be created. In the sense
of providing guidance to execute Analytics initiatives, this thesis focusses on providing
well founded directions and options, which are represented by the possible capabilities,
creation of these capabilities, and practices to improve the capability creation process.
However, the thesis does not assume any context of Analytics initiatives beyond the
application in LSCM. Detailed investigations of capabilities or practices in a particular
context would allow individual procedures to be developed in relation to the capabilities
and practices in that context, but the author interprets this as going beyond the principle
of guidance, which has been declared as research objective.
Concerning the support processes, Analytics initiatives will be investigated regarding the
sub processes listed by Rüegg-Stürm (2003) including human resources, education,
infrastructure management, information management, communication, and risk
mitigation. However, like explained for management processes, the investigation of
Analytics initiatives concerns guidance for their execution. Thus, the investigation is
intended to identify a variety of superior practices regarding these sub processes that
present a range of options to choose from, and derive a rationale for the tasks’ superiority,
since this is interpreted as guidance for this thesis. Investigating the practices of these sub
processes in different contexts to develop individual procedures is, again, not in focus.
Hence, developing specific Analytics solutions or recommending and categorizing
analytical methods and problems as well as assessing, developing or recommending
technologies is likewise not in focus of this thesis.
In accordance to the St. Gallen Management Model (Rüegg-Stürm, 2003), further
elements influence the processes and, thus, the execution of Analytics initiatives, which
have to be understood for their effect to provide guidance. Hence, ordering moments of
strategy, structure and culture regarding Analytics are in focus for their effect on the
execution of Analytics initiatives including favoring and obstructing designs of them, and
the rationale of the effect. Their creation is not focus of this research, such that the creation
and implementation of a data-driven strategy or data-driven culture is not investigated.
Ordering moments not specifically concerning Analytics beyond the restriction to LSCM
is also not in focus. Analytics initiatives are understood in this thesis to support atomic
business processes of an LSCM nature (e.g., deliver, transport, store, order, allocate,
17
schedule, replenish) without concerning the organizational structure the business
processes are executed in (e.g., manufacturing, retail, or logistics services organization).
These atomic business processes are assumed to induce similar problems to be solved in
Analytics initiatives despite the organizational structure. Furthermore, interaction topics,
stakeholders and environmental spheres similarly comprise the potential to influence the
execution of Analytics initiatives. These aspects of the St. Gallen Management Model
will be collected for their influence and relevance. They will be investigated in regard to
their relevance, such that customers (users) and employees (analysts) will be investigated
in more detail as compared to for example non-governmental organizations.
1.4 Structure
The structure of this thesis is created to consecutively advance in the definition of the
problem – as described by Simon (1973) – of how to enable organizations to manage
SCA. Thus, six structural elements emerge: Introduction and theoretical background, the
four individual research inquiries, and guidance to manage SCA. Subsequently, this thesis
ends with a conclusion, limitations and implications for research and management.
1.4.1 Introduction and theoretical background
The introduction of this thesis explains the theoretical and practical research motivation.
Thus, aggregated aspects from respectively scientific literature and organizational reports
are presented. These argue for the necessity of research and appraise the impact of it. In
addition, the introduction explains the overall research objective of this thesis and outlines
how the individual research questions of the scientific articles compiling the thesis relate
to that overall research question. Furthermore, the unit of analysis is described.
The theoretical background introduces relevant terms and background related to LSCM
and Analytics. For that purpose, definitions and relevant related terms are considered.
Further, to substantiate the domain specific research on Analytics limited to the domain
of LSCM, the use of Analytics in different domains is briefly reviewed.
1.4.2 Article 1: Mapping Domain characteristics influencing Analytics initiatives
The first objective of defining the problem space is an exploratory task into different
factors, which might affect the outcome of adopting and employing Analytics in LSCM.
Thereby, for the purpose of this research, using Analytics refers to the execution of
initiatives, which are either discoveries leading up to a major decision with changes in
executing LSCM activities based on the results, or to a data product (or Analytics
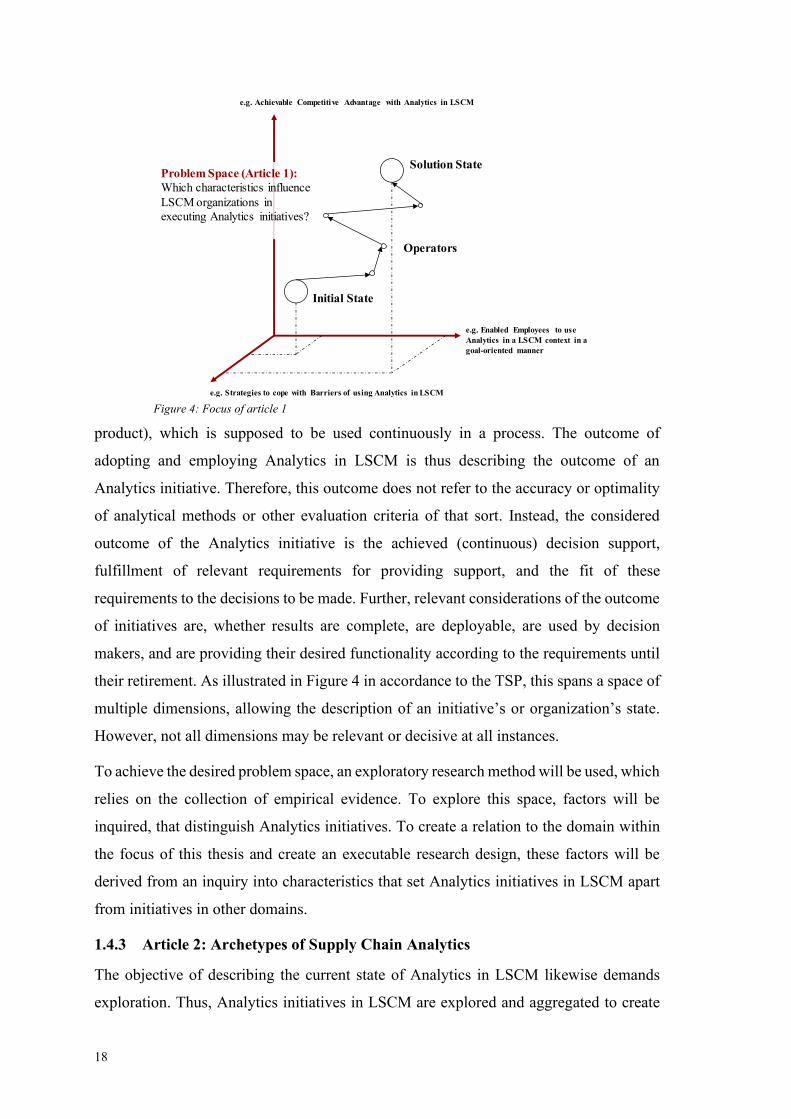
18
product), which is supposed to be used continuously in a process. The outcome of
adopting and employing Analytics in LSCM is thus describing the outcome of an
Analytics initiative. Therefore, this outcome does not refer to the accuracy or optimality
of analytical methods or other evaluation criteria of that sort. Instead, the considered
outcome of the Analytics initiative is the achieved (continuous) decision support,
fulfillment of relevant requirements for providing support, and the fit of these
requirements to the decisions to be made. Further, relevant considerations of the outcome
of initiatives are, whether results are complete, are deployable, are used by decision
makers, and are providing their desired functionality according to the requirements until
their retirement. As illustrated in Figure 4 in accordance to the TSP, this spans a space of
multiple dimensions, allowing the description of an initiative’s or organization’s state.
However, not all dimensions may be relevant or decisive at all instances.
To achieve the desired problem space, an exploratory research method will be used, which
relies on the collection of empirical evidence. To explore this space, factors will be
inquired, that distinguish Analytics initiatives. To create a relation to the domain within
the focus of this thesis and create an executable research design, these factors will be
derived from an inquiry into characteristics that set Analytics initiatives in LSCM apart
from initiatives in other domains.
1.4.3 Article 2: Archetypes of Supply Chain Analytics
The objective of describing the current state of Analytics in LSCM likewise demands
exploration. Thus, Analytics initiatives in LSCM are explored and aggregated to create
Problem Space (Article 1): Which characteristics influence LSCM organizations in executing Analytics initiatives?
Solution State
Initial State
Operators
e.g. Achievable Competitive Advantage with Analytics in LSCM
e.g. Strategies to cope with Barriers of using Analytics in LSCM
e.g. Enabled Employees to use Analytics in a LSCM context in a goal-oriented manner
Figure 4: Focus of article 1
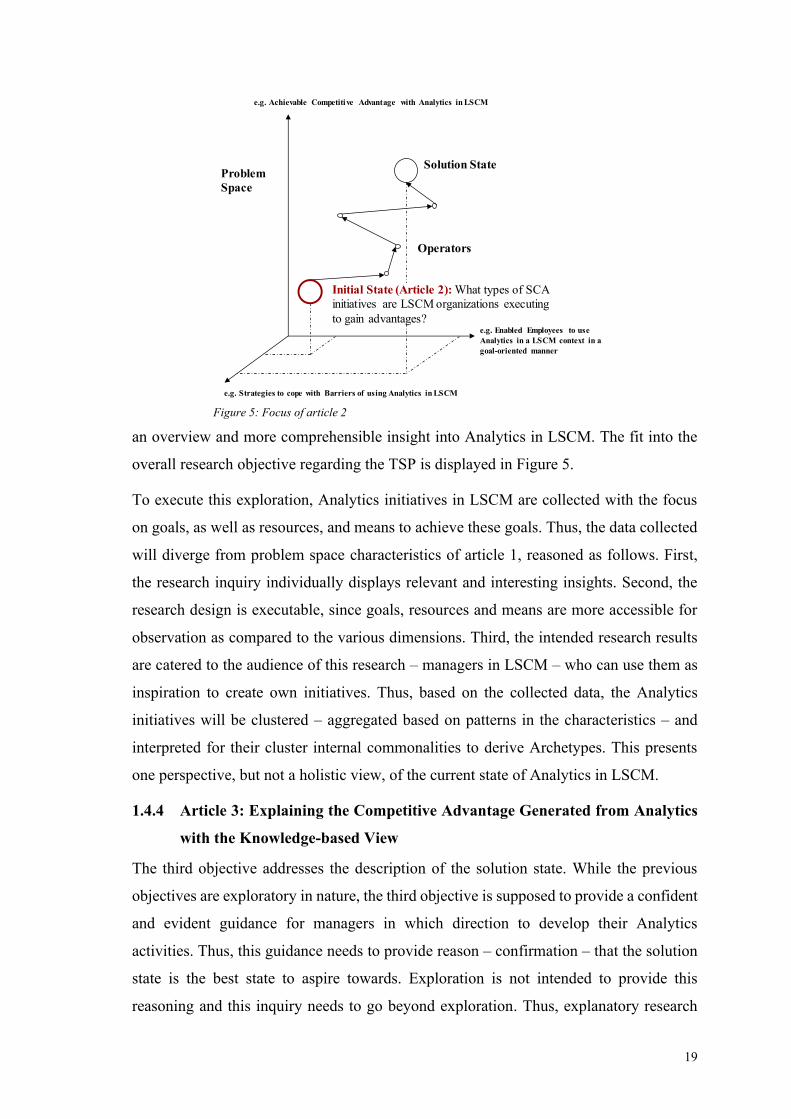
19
an overview and more comprehensible insight into Analytics in LSCM. The fit into the
overall research objective regarding the TSP is displayed in Figure 5.
To execute this exploration, Analytics initiatives in LSCM are collected with the focus
on goals, as well as resources, and means to achieve these goals. Thus, the data collected
will diverge from problem space characteristics of article 1, reasoned as follows. First,
the research inquiry individually displays relevant and interesting insights. Second, the
research design is executable, since goals, resources and means are more accessible for
observation as compared to the various dimensions. Third, the intended research results
are catered to the audience of this research – managers in LSCM – who can use them as
inspiration to create own initiatives. Thus, based on the collected data, the Analytics
initiatives will be clustered – aggregated based on patterns in the characteristics – and
interpreted for their cluster internal commonalities to derive Archetypes. This presents
one perspective, but not a holistic view, of the current state of Analytics in LSCM.
1.4.4 Article 3: Explaining the Competitive Advantage Generated from Analytics
with the Knowledge-based View
The third objective addresses the description of the solution state. While the previous
objectives are exploratory in nature, the third objective is supposed to provide a confident
and evident guidance for managers in which direction to develop their Analytics
activities. Thus, this guidance needs to provide reason – confirmation – that the solution
state is the best state to aspire towards. Exploration is not intended to provide this
reasoning and this inquiry needs to go beyond exploration. Thus, explanatory research
Problem
Space
Solution State
Operators
e.g. Achievable Competitive Advantage with Analytics in LSCM
e.g. Strategies to cope with Barriers of using Analytics in LSCM
e.g. Enabled Employees to use
Analytics in a LSCM context in a
goal-oriented manner
Initial State (Article 2): What types of SCA
initiatives are LSCM organizations executing
to gain advantages?
Figure 5: Focus of article 2
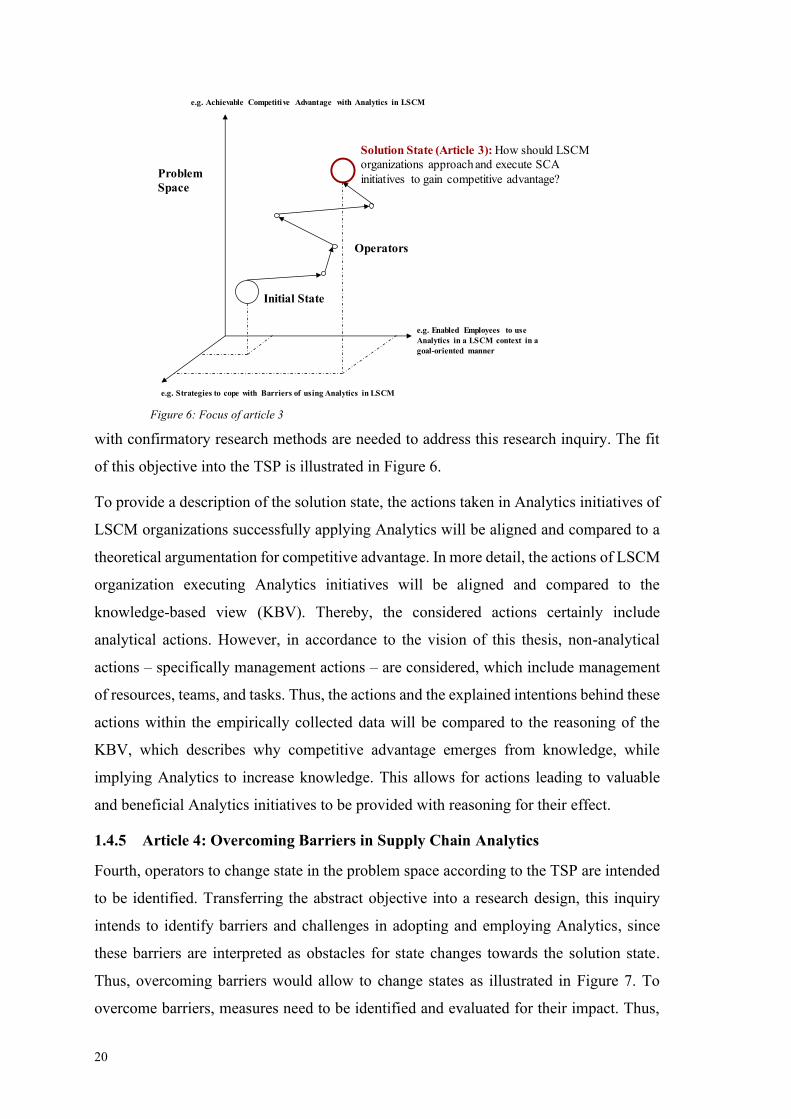
20
with confirmatory research methods are needed to address this research inquiry. The fit
of this objective into the TSP is illustrated in Figure 6.
To provide a description of the solution state, the actions taken in Analytics initiatives of
LSCM organizations successfully applying Analytics will be aligned and compared to a
theoretical argumentation for competitive advantage. In more detail, the actions of LSCM
organization executing Analytics initiatives will be aligned and compared to the
knowledge-based view (KBV). Thereby, the considered actions certainly include
analytical actions. However, in accordance to the vision of this thesis, non-analytical
actions – specifically management actions – are considered, which include management
of resources, teams, and tasks. Thus, the actions and the explained intentions behind these
actions within the empirically collected data will be compared to the reasoning of the
KBV, which describes why competitive advantage emerges from knowledge, while
implying Analytics to increase knowledge. This allows for actions leading to valuable
and beneficial Analytics initiatives to be provided with reasoning for their effect.
1.4.5 Article 4: Overcoming Barriers in Supply Chain Analytics
Fourth, operators to change state in the problem space according to the TSP are intended
to be identified. Transferring the abstract objective into a research design, this inquiry
intends to identify barriers and challenges in adopting and employing Analytics, since
these barriers are interpreted as obstacles for state changes towards the solution state.
Thus, overcoming barriers would allow to change states as illustrated in Figure 7. To
overcome barriers, measures need to be identified and evaluated for their impact. Thus,
Problem
Space
Initial State
Operators
e.g. Achievable Competitive Advantage with Analytics in LSCM
e.g. Strategies to cope with Barriers of using Analytics in LSCM
e.g. Enabled Employees to use
Analytics in a LSCM context in a
goal-oriented manner
Solution State (Article 3): How should LSCM
organizations approach and execute SCA
initiatives to gain competitive advantage?
Figure 6: Focus of article 3
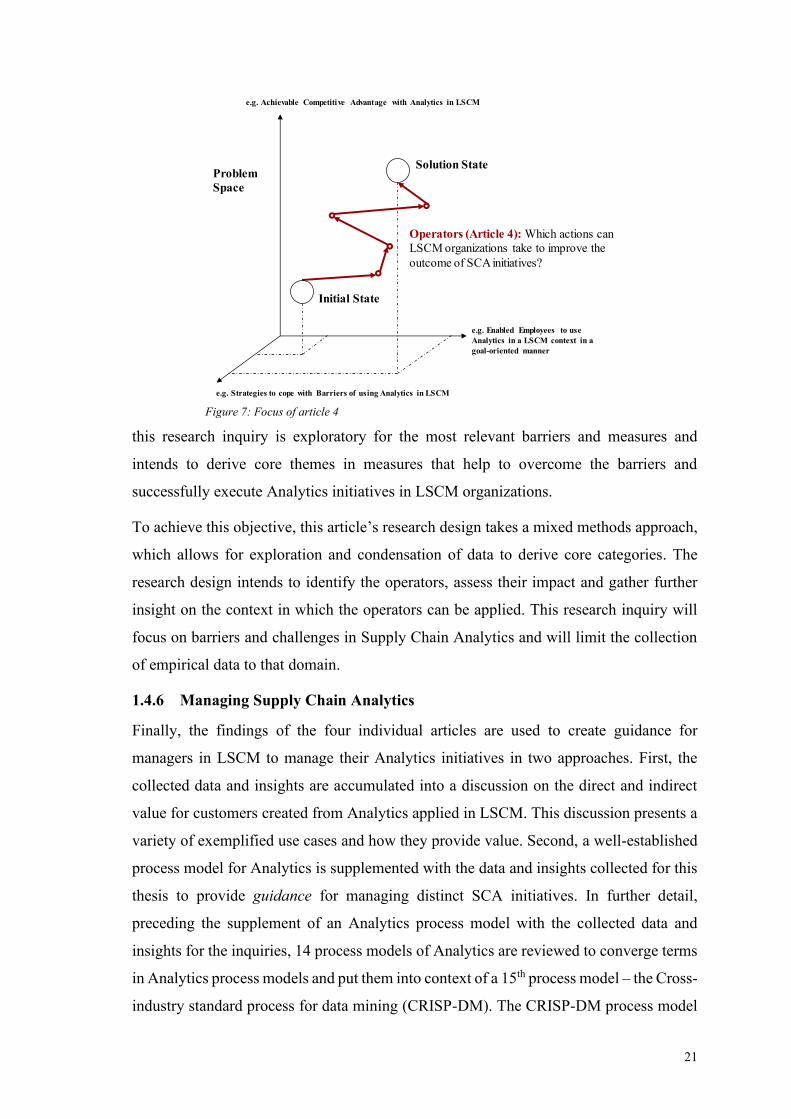
21
this research inquiry is exploratory for the most relevant barriers and measures and
intends to derive core themes in measures that help to overcome the barriers and
successfully execute Analytics initiatives in LSCM organizations.
To achieve this objective, this article’s research design takes a mixed methods approach,
which allows for exploration and condensation of data to derive core categories. The
research design intends to identify the operators, assess their impact and gather further
insight on the context in which the operators can be applied. This research inquiry will
focus on barriers and challenges in Supply Chain Analytics and will limit the collection
of empirical data to that domain.
1.4.6 Managing Supply Chain Analytics
Finally, the findings of the four individual articles are used to create guidance for
managers in LSCM to manage their Analytics initiatives in two approaches. First, the
collected data and insights are accumulated into a discussion on the direct and indirect
value for customers created from Analytics applied in LSCM. This discussion presents a
variety of exemplified use cases and how they provide value. Second, a well-established
process model for Analytics is supplemented with the data and insights collected for this
thesis to provide guidance for managing distinct SCA initiatives. In further detail,
preceding the supplement of an Analytics process model with the collected data and
insights for the inquiries, 14 process models of Analytics are reviewed to converge terms
in Analytics process models and put them into context of a 15th process model – the Cross-
industry standard process for data mining (CRISP-DM). The CRISP-DM process model
Problem
Space
Solution State
Initial State
e.g. Achievable Competitive Advantage with Analytics in LSCM
e.g. Strategies to cope with Barriers of using Analytics in LSCM
e.g. Enabled Employees to use
Analytics in a LSCM context in a
goal-oriented manner
Operators (Article 4): Which actions can
LSCM organizations take to improve the
outcome of SCA initiatives?
Figure 7: Focus of article 4
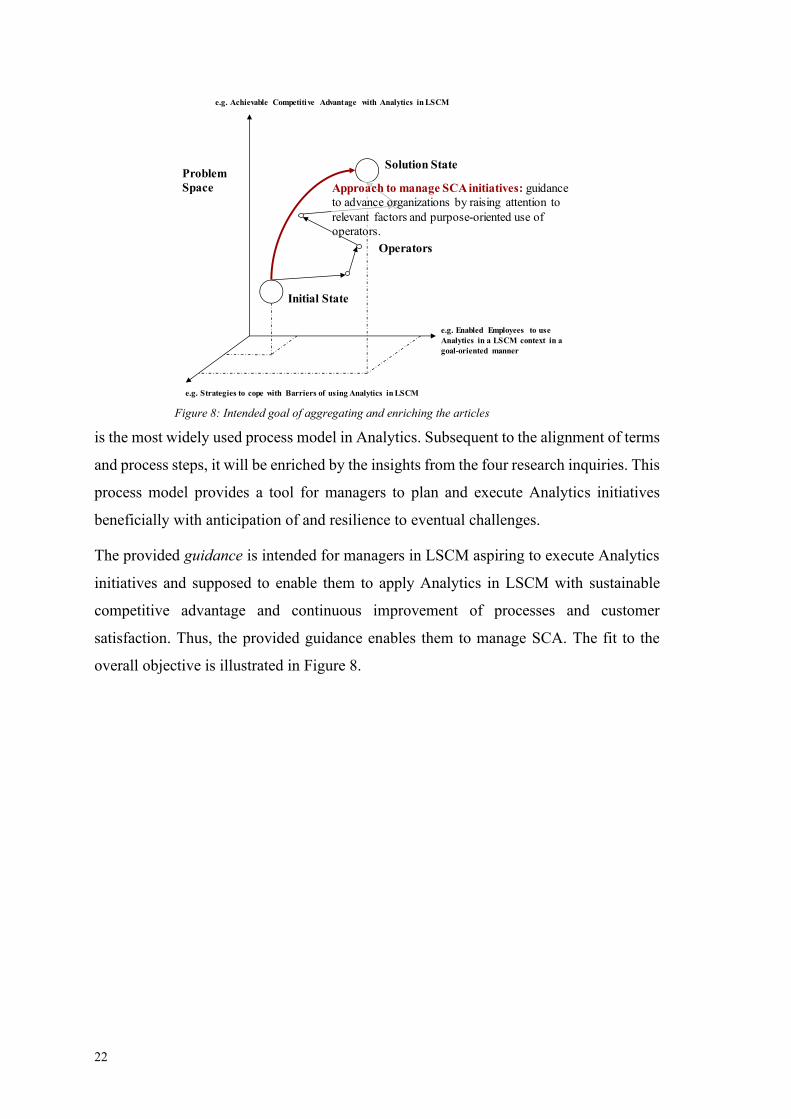
22
is the most widely used process model in Analytics. Subsequent to the alignment of terms
and process steps, it will be enriched by the insights from the four research inquiries. This
process model provides a tool for managers to plan and execute Analytics initiatives
beneficially with anticipation of and resilience to eventual challenges.
The provided guidance is intended for managers in LSCM aspiring to execute Analytics
initiatives and supposed to enable them to apply Analytics in LSCM with sustainable
competitive advantage and continuous improvement of processes and customer
satisfaction. Thus, the provided guidance enables them to manage SCA. The fit to the
overall objective is illustrated in Figure 8.
Problem Space
Solution State
Initial State
Operators
Approach to manage SCA initiatives: guidance to advance organizations by raising attention to relevant factors and purpose-oriented use of operators.
e.g. Achievable Competitive Advantage with Analytics in LSCM
e.g. Strategies to cope with Barriers of using Analytics in LSCM
e.g. Enabled Employees to use Analytics in a LSCM context in a goal-oriented manner
Figure 8: Intended goal of aggregating and enriching the articles
2 Theoretic Background
This section introduces the leading terms of this thesis. First, Logistics and Supply Chain
Management are defined and the treatment of both terms as one for this thesis is argued.
Second, Analytics is explained and the relationship to the terms Big Data, Data Science
and Artificial Intelligence is described. Third, Supply Chain Analytics, the intersection
of Logistics and Supply Chain Management with Logistics is portrayed together with
other subfields of Analytics to illustrate the unique characteristics of it.
2.1 Logistics and Supply Chain Management
The core of this thesis is the part of Analytics that is referred to as Domain (Davenport et
al., 2010). The Domain is the field of application that is in focus of Analytics to create
improvements or insight. The design of this thesis intends to enable these improvements
and insight in the domain of Logistics and Supply Chain Management with the purpose
to contribute to the scientific literature and practical execution of Analytics in this
domain.
2.1.1 Logistics
The term Logistics has been defined in various ways. Pfohl (2010) categorized definitions
in lifecycle oriented, service oriented and flow oriented. The latter is notably more
specific about subject and tasks and will be considered in more detail. The subject of
Logistics is material flows from the initial supplier to the final customer and related
information flows, which have to be planned, controlled, executed and monitored
(Straube, 2004). These flows are necessary since the materials must transform in time and
space to get from time and location of suppliers to the time and location of consumption
by the customer (Pfohl, 2010). The focus of the material flow in relation to a focal
organization has led to create several subfields of Logistics including procurement
Logistics, distribution Logistics, site Logistics or disposal Logistics (Gudehus, 2012).
These differ in the specific activities, but the high-level tasks of planning, controlling,
execution and monitoring are relevant for all of them.
As indicated in the definitions above, to accomplish logistical tasks, the lines of business
units and organizations have to be crossed. Baumgarten (1980) explained the thought of
Logistics being a discipline mastering material flows inside and outside of the own
organization in physical, informational and organizational regards in the beginning of the
1980s. While he does so in the prologue of the book and while todays ‘holistic’ view of
24
Logistics concerning the flows across organizations is already envisioned in the substance
of his book, which represents the state-of-the-art of Logistics at the time, the rest of the
book addresses matters of internal material flow. In practical application, cross
organizational logistics networks were widely established in the 1990s (Straube, 2004).
The holistic way of thinking about Logistics, a core concept in the Logistics literature
(Baumgarten and Walter, 2001; Kopfer and Bierwirth, 2003; Pfohl, 2010; Straube, 2004)
that has been introduced as early as 1974 (Pfohl, 1974), manifests the concept of
interdisciplinary and interorganizational management of material flows by promoting to
understand logistics networks as systems orienting their actions on customers’ demands
and needs, no matter whether the system entails several organizations or is distributed
globally. This way of thinking demands instruments of exchanging information (Straube,
2004).
2.1.2 Supply Chain Management
The second term of relevance, Supply Chain Management, has similarly to Logistics no
uniformly accepted definition. Reoccurring elements in leading Supply Chain
Management literature are integrated and collaborating organizations, established
relationships between these organizations, and approaches leveraging the relationships to
organize business activities of these organizations and flows of assets, products,
information and funds such that products are produced and delivered to the customer
efficiently and with minimal costs (Bowersox et al., 2007; Chopra and Meindl, 2016;
Christopher, 2011; Hugos, 2011; Simchi-Levi et al., 2003). The collaborating
organizations are supposed to be all organizations upstream from the customer, which are
necessary for designing, making, distributing and using products (and services) such as
suppliers, manufacturers, warehouses, and stores (Hugos, 2011; Simchi-Levi et al., 2003).
Their collaboration is supposed to increase the surplus of the supply chain such that all
supply chain members benefit (Chopra and Meindl, 2016) and the customer value is
superior (Christopher, 2011). This perspective is sometimes similarly to Logistics
literature labeled as ‘holistic’ (Christopher, 2011; Hugos, 2011; Simchi-Levi et al., 2003).
The term Supply Chain Management was introduced by consultants of Booze Allen
Hamilton in the beginning of the 1980s as a result of several projects in logistics. The
concept is supposed to differ from classical material flow and manufacturing concepts in
a variety of aspects. According to Oliver and Webber (1982), the supply chain is
recognized as single entity including the several business functions involved in the
25
material flow in an organization. It represents strategic decision-making, since the
functionality of the supply chain becomes a shared objective. Further, inventory is
considered as balancing mechanic and, finally, the supply chain should ultimately be
considered as an integrated system and not as conjunctions via interfaces. However, the
article of Oliver and Webber (1982) does not introduce the concept as replacement,
opposition or subordinate to Logistics. It rather describes it as completing the concept of
logistics. By considering supply chain management as novel approach to Logistics, their
conception can be interpreted as uplifting the function of Logistics, which was
underrecognized for strategic purpose to this point, or incorporating a Logistics focus into
strategic decision-making.
2.1.3 Synopsis
While the previous introductions present two parallel existing terms with resembling
objectives, focus and requirements of interorganizational thinking, which seemingly were
not intended to exist in conflict or competition, a dispute about the terms relationship to
each other has developed. The dispute goes so far that the relationship of these terms has
been the subject of research. Larson and Halldorsson (2004) develop four different
perspectives about how the two terms are related. With their research based on a survey
of educators, they show the existence of different perspectives of the relationship of the
two terms and some aspects being more likely to be associated with one or the other term.
However, their research does not show any value in the existence of two terms. The
aspects they use to distinguish the terms, which are practices, methods and tasks, are all
eventually relevant for organizations with non-simple material flows. Rather, an
implication of their research is that the two terms for the same thing but with differently
understood relationship increases the complexity between organizations to align,
communicate and achieve optimal performance of the Logistics system or Supply Chain.
Consequently, having two terms might be a barrier to achieve either term’s objective of
the Logistics system or Supply Chain acting as a system for increased efficiency, reduced
cost and, most importantly, superior customer value.
Concluding, while there remains to be a controversy about the relationship between
Logistics on the one hand and Supply Chain Management on the other, the discourse
about this relationship does not seem to provide any value. Both claim to focus on
executing the operational, tactical and strategical actions to ensure provision of goods and
services with the goals of appropriate effectiveness, efficiency, quality and sustainability
26
under holistic thinking concerning interdisciplinary and interorganizational perspectives.
Value is, as argued by the author of this thesis, provided in science for organizations by
developing insights and means to improve the executed actions towards their goals –
improve effectiveness, efficiency, quality and sustainability and guide to holistic thinking
– and not by arguing about how to label a field. Thus, for the remainder of this thesis, the
two terms are treated as equal and fairly labeled as Logistics and Supply Chain
Management (LSCM). Regarding this thesis’ focus on process, as the working definition
of LSCM, it is comprised of the processes that enable the flow of materials and related
assets, information and funds from the initial supplier to the final customer by actions of
planning, controlling, executing and monitoring. Holistic thinking, efficiency and cost
minimization are understood as quality criteria for LSCM, but not necessarily as part of
the definition.
2.2 Analytics and related terms
As one of the interviewees in the research designs presented below mentioned “terms
describing the field [of Analytics] change faster than the actual methods”. In this thesis,
to consider the phenomenon of data analysis for decision-making as will be explained
below, the term Analytics has been chosen as central term. The term is more explicitly
associated with management issues, and the author of this thesis perceives Analytics as
start for an essential wave of data analysis for decision-making in organizations leading
it to be widespread today and during the conduct of this thesis’s research. Further, the
term Analytics is perceived by the author as most stable, while press, public attention and
conversations on other terms left an impression of hype-inflated and unsubstantiated
expectations. In this section, Analytics is defined and put in relation to the terms Big Data,
Data Science and Artificial Intelligence by highlighting differences and similarities. In
addition, following common phrasing in literature using the terms Analytics initiative or
Data initiative for describing goal-oriented Analytics activities, this thesis will use the
term Analytics initiative as well (Davenport and Harris, 2007; Holsapple et al., 2014;
Marchand and Peppard, 2013; Ransbotham et al., 2016). Especially reflecting LaValle et
al. (2010), as working definition of Analytics initiatives, it comprises all actions over
the full life-cycle of an Analytics solution that contribute to its sustainable impact and
continuity, including the determination of the objectives with Analytics, the execution of
analytical activities, the development of Analytics solutions, the deployment of Analytics
solutions, and their active and regular maintenance and performance preservation.
27
2.2.1 Analytics
There is a variety of definitions and explanations for Analytics. Davenport and Harris
(2007), who initiated the broader recognition of Analytics with their famous book
“Competing on Analytics”, describe Analytics as “extensive use of data, statistical and
quantitative analysis, explanatory and predictive models, and fact-based management to
drive decisions and actions”. This description is focused on activities, which include
management in addition to the use of analytical methods and makes the purpose of
decision-making and subsequent actions immanent – the idea of Analytics not being done
for the purpose of Analytics is made part of the description. This idea was made central
to a meta definition Holsapple et al. (2014) have derived from considering several
definitions, which is recognized as the working definition of Analytics for this thesis.
They describe Analytics as being concerned with “evidence-based problem recognition
and solving that happen within the context of business situations”. Thereby, evidence-
based is supposed to emphasize that decision-making from Analytics is not (just) based
on data or facts, but also on justified estimates, well-reasoned approximations, or credible
explanations.
A common way to subcategorize Analytics is the distinction of Descriptive Analytics,
Predictive Analytics and Prescriptive Analytics (Bedeley et al., 2018; Cao and Duan,
2017; Davenport, 2013; Holsapple et al., 2014; Ransbotham et al., 2015). Descriptive
Analytics is described as the backward looking form of Analytics, identifying trends,
describing context and providing aggregations, which are evident from the data and can
be reported from it (Bedeley et al., 2018; Cao and Duan, 2017; Davenport, 2013). In some
cases, Descriptive Analytics is also explained to look for causes and “why” things
happened (Ransbotham et al., 2015; Spiess et al., 2014). Predictive Analytics is focused
on estimating and forecasting future events or behavior based on models that consider
what happened in the past (Bedeley et al., 2018; Davenport, 2013; Ransbotham et al.,
2015). Thus, the basic assumption is that patterns in the data will sustain. Finally,
Prescriptive Analytics is providing guidance by assessing the best – ‘optimal’ – actions
regarding different scenarios of future events and behavior (Bedeley et al., 2018;
Ransbotham et al., 2015). While this could be easily compared to the field of Operations
Research, Prescriptive Analytics is opposingly supposed to be integrated and employed
in business processes requiring the creation of solutions in close collaboration with
experts from other areas, the adoption of a wide scope, the integration of problems, and
28
the flexibility of solution, what makes Operations Research a field Analytics leverages
from as one of several components (Liberatore and Luo, 2010; Phillipps and Davenport,
2013).
A focus that is repeatedly addressed in the literature concerning the term Analytics is
managerial issues. Providing means to managers to set up the organizations to gain the
aspired value from Analytics and enabling organizations to deploy Analytics is the core
topic of Davenport and Harris (2007). The execution of initiatives, operationalization and
influencing factors on value generation have been addressed including factors which can
omit the realization of the value after analytical methods have been conducted such as
communication and consumability of the results (LaValle et al., 2010; Ransbotham et al.,
2015; Seddon et al., 2017; Wedel and Kannan, 2016; Wixom et al., 2013). Thereby, the
focus diverges from the analytical methods to the broader integration of the methods’
results into the value creation process. Further managerial issues that have been addressed
are organizational culture and skill gaps, including the skill gaps of managers that need
to be filled, the fit of Analytics into the structure of an organization and the application
areas of Analytics in organizations (Acito and Khatri, 2014; Beer, 2018; Marchand and
Peppard, 2013).
2.2.2 Big Data
The second term of interest, Big Data, can be traced back to an article describing
necessary developments in data management principles to keep pace with requirements
to harness the information from organizational activities, especially in e-commerce
(Laney, 2001). To support businesses, IT organizations were demanded to implement data
management architectures which can handle an increasing data volume, the velocity data
is created and the variety of formats that must be collected. At that point, the three ‘V’s’
focused on backend technologies to enable analytical approaches but not on the analytical
part. As a simple way to describe Big Data, the V’s were carried on and expanded,
especially in scientific literature, to lists somewhere between three and ten V’s (Brinch et
al., 2018; Sivarajah et al., 2017; Tsai et al., 2015; Wang and Alexander, 2015). This more
recent characterization of Big Data expands the focus beyond data management and
architectures to the exploitation of data by analytical means. However, scholars
repeatedly comment on Big Data as concept and field of research to be not well
established and the impact of the V’s to be imprecise (Brinch et al., 2018; Gandomi and
Haider, 2015; Sivarajah et al., 2017). It was further emphasized that the exploitation of
29
value from Big Data requires Analytics (Carillo, 2017; Gandomi and Haider, 2015;
Troester, 2012). In this regard, the terms Big Data and Big Data Analytics are used
synonymous to Analytics (Akter et al., 2016; Debortoli et al., 2014; Hopkins and
Hawking, 2018), as it is understood in this thesis.
The characteristics of data emphasized with the Big Data term change the analytical
approaches to store and analyzing data, since processing is more challenging, has to
happen in short time for larger and more complex streams of data and has to handle
different and incomplete types of data (Tsai et al., 2015). Commonly associated with Big
Data are forms of distributed processing, which distributes the workload of storing and
analyzing data across different machines to be handled in parallel (Philip Chen and
Zhang, 2014). Different forms are specialized for different purpose such as batch
processing, like the quite famous Hadoop, or for stream processing, like Splunk or
Apache Kafka. Analytics Solutions that require such distributed processing usually
display a high degree of technical complexity as presented by Markl et al. (2013).
2.2.3 Data Science
Data Science is the third term of interest. While the term exists for a longer time, larger
popularity can be traced back to an article about Data Scientists, describing it as the
“sexiest job of the 21st century” (Davenport and Patil, 2012). The term describes an
advanced type of analysts, who can handle large amounts of data, can code, employ
advanced quantitative techniques and can communicate the results in understandable
manner, often with a background in a scientific field that uses complex quantitative
methods (e.g., a PhD in physics, social science or ecology). However, the article backfired
and created an ambiguous term that could mean almost anything and is applied to a variety
of jobs, frustrating the authors and leaving the Data Science field similarly undefined
(Davenport, 2014a). Several scholars have provided a short summary or definition for
Data Science. Dhar (2013) describes it as “the study of the generalizable extraction of
knowledge from data” and in the discussion that follows, describes a focus on more
complex analytical and quantitative methods as well as on decision-making, primarily
automated. O’Neil and Schutt (2013) present an extensive discussion about the ambiguity
of the term and eventually present Data Science as the activities executed by data
scientists, which are the extraction of meaning and interpretation of data with a variety of
analytical methods and integrating a variety of skills. The Essential Knowledge series of
the MIT Press, defines it as “encompassing a set of principles, problem definitions,
30
algorithms, and processes for extracting nonobvious and useful patterns from large data
sets” in the book on Data Science (Kelleher and Tierney, 2018). In the considered
literature, the emphasis is usually on ‘extraction’ of insight from data with few attentions
to subsequently creating value from the insights. Concerning the relation of Data Science
and Analytics, the terms are used synonymous for insight extraction from data with the
difference that Data Science comprises more complex methods but less focus on
practicality in business (Larson and Chang, 2016; Marchand and Peppard, 2013; Viaene,
2013).
The Data Scientists are the focal point of the discussion about Data Science. In the
discussion on the Data Scientists, it is agreed that they execute the analytical tasks. Apart
from that, their responsibility and capability is argued between having a large variety of
skills and executing the larger part of initiatives (Debortoli et al., 2014; Dhar, 2013;
Grossman and Siegel, 2014) and them taking a limited role in initiatives and working with
a team that contributes complemental skills and capabilities, argued with strong rejection
of an omnipotent Data Scientist (Carillo, 2017; Viaene, 2013; Vidgen et al., 2017).
Whatever their role is, Data Scientists are explained to need a sense for Business
(Davenport, 2013; Marchand and Peppard, 2013). They are further described to use more
advanced methods, such as machine learning and skills for using Big Data, which are
traditionally not taught in statistics courses (Dhar, 2013; Larson and Chang, 2016;
McAfee and Brynjolfsson, 2012). But “just” hiring Data Scientists is not the guarantee to
create value from data (Carillo, 2017; Marchand and Peppard, 2013).
2.2.4 Artificial Intelligence
Fourth and final, AI is another term currently used in context of creating value from data.
The scientific field of AI has a long history with a primary focus on the challenge of
creating intelligence for machines, with the creation of solutions for business as second
order. Russell and Norvig (2016), and Boden (2016) display a variety of definitions and
approaches to define AI and discuss the ambiguity about expectations in the field.
Summarizing their considerations, an AI is a virtual machine that is dependent on a
physical machine, whereby AI is understood as their combination either as computer, a
program on a computer or an Agent, which is a certain program that can operate
autonomously, perceive its environment, persists over time, adapts to changes and creates
and pursues goals. The capabilities that display intelligence are further under discussion.
While capabilities of visions, reasoning, language, learning and further are usually used

31
to describe intelligence, the necessity of displaying human-like understanding and
grasping of the meaning of these capabilities for being an AI is seen differently. Boden
(2016) explains the visionary goal of the field to be the creation of an “Artificial General
Intelligence” with this human-like capacity. Since there is still no full understanding of
what human intelligence is and how it works, this is estimated to be unachievable by some
scholars in the field of AI.
In a business context, achieving intelligence is rarely in scope. Rather the capabilities –
typically labeled as “tools” – and the techniques to achieve them are in focus in a business
context (Akerkar, 2019). The techniques are distinguished in knowledge-based systems
and machine learning. The knowledge-based system/expert systems are based on
programmed rules by experts the AI has to follow, which brought a first wave of industrial
applications of AI in the end of the 1970s and beginning of the 80s but failed to deliver
on their ambitious goals (Alpaydin, 2016; Russell and Norvig, 2016). Machine learning
extracts these rules from data – learns from data/trains on data – by using mathematical
techniques such as Bayesian probabilities and neural networks, dominating the current
attention and progress in AI (Akerkar, 2019; Alpaydin, 2016; Boden, 2016; Russell and
Norvig, 2016). Deep learning is a sub form of machine learning originating from more
complex neural networks, technically named deep neural networks for their model
structure. Especially the techniques of machine learning, now usable due to technological
advances, are argued to provide advanced opportunities as analytical methods to exploit
value from data (Beer, 2018; Davenport, 2013; Vidgen et al., 2017). However, the use of
AI in organization has a wider scope than analytical issues. From a generic perspective,
AI is distinguished in three forms (Rao, 2016). First, Assisted AI, which simplifies and
accelerates tasks while humans make the decisions. Second, Augmented AI provides
extensive input for the humans’ decisions and resultingly shares decision rights. Third, in
the Autonomous AI case, the machine acts and decides autonomously. Davenport and
Ronanki (2018) took a use case perspective of AI employed by organizations and
distinguish in one use case group of Analytics – referring to it as “Analytics on steroids”
– and other groups of automating repetitive processes and communication tasks. Thus,
Analytics is one area which is empowered by methods from AI (Akerkar, 2019; Gandomi
and Haider, 2015; Philip Chen and Zhang, 2014).

32
2.2.5 Synopsis
In summary, the literature behind these terms above similarly describes the concept of
exploiting data for better decision-making. However, the focal points of this exploitation
differ. Big Data tends to focus on technological aspects along with opportunities to exploit
data with characteristics that require these technologies. The focus of Data Science is on
execution of the ever more powerful methods and the resulting opportunities of exploiting
insights from data. The machine learning techniques and methods provided by AI focus
on learning from data, which provides advanced opportunities for analytical issues but is
only one of several usages of AI, what would make the use of the term AI misleading for
this thesis. Finally, management aspects, execution of initiatives, the organizational
objectives of analytical approaches and other aspects of implementing the methods in
organizations are in focus of Analytics. For this research, the practical and scientific
insights associated with all terms are relevant. However, for the reason of the management
focus associated with the term Analytics and the further reasons explained in the
introduction to this section, Analytics is used as central and comprehensive term in this
thesis.
2.3 Analytics in different Domains
In this section a deeper look will be taken into current research in a variety of domain-
specific Analytics to illustrate the differences of Analytics in different domains. For this
purpose, different data-rich domains have been chosen, which encounter different
challenges (LSCM, Marketing and healthcare), one that seems trailing behind (public
sector) and, at last, one field that is seemingly different to traditional organizational
processes, to show similarities in using Analytics (Sports).
2.3.1 Supply Chain Analytics
LSCM is suitable to use Analytics, as it is a data-driven and data rich environment and is
seen as an early adopter of quantitative Methods from Operations Research (Chae, Olson,
et al., 2014; Souza, 2014). The use is driven by the overall objective of matching supply
with demand, since demand may not be postponed and the supply is perishable, as usual
for service industries (Souza, 2014). In addition, supply and demand become increasingly
uncertain due to fast changing customer expectations, process variations, inconsistent
suppliers, and ever-increasing networks (Chae, Olson, et al., 2014; Kache and Seuring,
2017; Wang et al., 2016). The objective of matching is accompanied with a multitude of
objectives pursued with Analytics in the literature, which are basically the objectives
33
LSCM pursues anyway. Popular are the objectives of reducing costs, increasing
efficiency and effectiveness, and increasing customer orientation, while further objectives
are improving quality, reducing time/increasing agility and flexibility (Chavez et al.,
2017; Kache and Seuring, 2017; Schoenherr and Speier-Pero, 2015; Souza, 2014; Wang
et al., 2016). Subsequently, the benefits organizations aspire to achieve with Analytics to
meet these objectives are of better integration with supply chain partners and improved
planning input (Kache and Seuring, 2017; Wang et al., 2016). However, the most notable
emphasized benefit aspired, which might not require the most complex methods but can
be technologically and organizationally challenging, is visibility (or transparency).
Visibility is stressed to contribute to the objectives above by improved capabilities to
handle variability, uncertainty, environmental influences, market conditions, supplier and
customer needs, and sudden problems, by assessment of progress to achieving goals and
need for adjustments, by determining compliance of suppliers to quality and regulations,
by gaining insights on supply chain wide inventories and activities, by detecting the need
for corrections of poor performance to ultimately make better and faster decisions,
especially in real time. (Chavez et al., 2017; Kache and Seuring, 2017; Sanders, 2016;
Wang et al., 2016).
Due to the scope of LSCM, the Analytics applications are countless. Along different time
frames and different organizational levels, organizations created applications on the
demand side (e.g., as planning input) for demand forecasting, analyzing purchasing
patterns, and product assortment optimization. On the supply side applications have been
created for supplier segmentation, supplier selection, supplier evaluation, risk detection,
risk management, definition of auction mechanisms, design of negotiation strategies, and
analysis of spend profiles. Further, distribution and manufacturing applications include
location optimization/network design, scheduling, segmentation of routes, vehicle
routing, forecasting of estimated-time-of-arrival (ETA), predictive maintenance, capacity
planning, reduction of shrink, reduction of material waste, labor scheduling, labor
efficiency optimization, optimization of fuel efficiency, optimization of driver behavior,
material requirements planning, master production planning, support product design and
identification of bottlenecks (Chae, Olson, et al., 2014; Sanders, 2016; Souza, 2014;
Waller and Fawcett, 2013; Wang et al., 2016). These applications are fueled by internal
data from ERP and other Systems and the transactions, static data captured and Analytics
results, which go into other applications, as well as increasingly the data from several
34
dispersed entities of the supply chain like suppliers, carriers and points of sale including
inventories, cost, process times, demand and their forecasts (Souza, 2014; Wang et al.,
2016). Larger data volumes and more precise data become available due to sensor
technology like RFID, GPS or IoT capturing temperature, light intensity and vibration,
which are used in the supply chain (Kache and Seuring, 2017; Sanders, 2016).
However, this multiplicity of applications, data and data sources comes at a price.
Organizations suffer from fragmented efforts without systemization and coordination.
This makes the aspiration of organization and supply chain wide objectives extremely
challenging and defies the benefits achieved (Sanders, 2016). A study on cloud logistics
has emphasized that logistical objects and resources lack standardized categorization and
ontology including their informational representation (Glöckner et al., 2017), which
magnifies the issue. Further challenges highlighted for LSCM are the cost of Analytics,
the unwillingness of partners to share information, what hinders supply chain wide
approaches, and the complexity especially of optimization problems (Sanders, 2016;
Schoenherr and Speier-Pero, 2015; Wang et al., 2016). Further, rather common barriers
are reported as well including lack of experienced personnel, data security issues, lack of
integration of systems, change management issues, lack of data for the applications
intended and abundance of data without applications determined (Kache and Seuring,
2017; Sanders, 2016; Schoenherr and Speier-Pero, 2015).
2.3.2 Marketing Analytics
Marketing is a historically data-rich domain, which started professional data collection
with organizations like Nielsen in the 1920s and advanced data analysis as early as the
1960s (Wedel and Kannan, 2016). The use of Analytics in Marketing aims at harnessing
the customer for better decision-making (Germann et al., 2013), with two overall
objectives: personalization and effective resource allocation. Detailed data about the
customer and analysis of the data enables personalized marketing which leads to the
growth of more profitable customers with better customer relationships (Leeflang et al.,
2014; Rust and Huang, 2014; Wedel and Kannan, 2016). This contrasts the mass market
centered and transaction driven marketing, and eventually displays a paradigm change to
the customer as profit center with opportunities for additional sales (Leeflang et al., 2014;
Rust and Huang, 2014). Personalization aspires even to address contextual needs, e.g.,
based on the customers position (Rust and Huang, 2014; Wedel and Kannan, 2016). Even
though personalization has become less resource demanding, complete personalization
35
might not display the best use of resources (Wedel and Kannan, 2016), leading to the
second objective of resource allocation. More detailed knowledge about the customer, or
his customer journey, enables to direct resources to more profitable customers and limits
resources to others (Leeflang et al., 2014; Rust and Huang, 2014; Zhao, 2013). The
benefits for Marketing from Analytics are improved decisions due to more decision
consistency, exploration of broader decisions, abilities to assess the relative impact of
decision variables and more granular decision-making by exploiting customers’
heterogeneity and needs, which they provide voluntarily by communication or
unknowingly by online behavior (Germann et al., 2013; Rust and Huang, 2014; Wedel
and Kannan, 2016). Thereby, the impact of Analytics on Marketing positively depends
on competition strength and frequency of customer preference changes (Germann et al.,
2013; Leeflang et al., 2014).
Analytics applications in Marketing are either decision supportive or decision automating
(Germann et al., 2013). This includes segmentation for personalized Marketing via Email,
estimation for click-through rates for automated bidding on online advertisement space,
survival analysis for churn prediction, lead scoring and several predictive techniques for
direct-marketing opportunities like next best offer, cross selling/up selling campaigns or
win-back campaigns (Leeflang et al., 2014; Leventhal, 2015; Zhao, 2013). However, the
estimation of the customer lifetime value with Analytics stands out (Rust and Huang,
2014; Wedel and Kannan, 2016; Zhao, 2013) . The data enabling these applications are
now coming from all sorts of data producing sources: smartphones, smart TVs, internet
clickstreams and click-through behavior, blogs, tweets, or other social media-based
customer content and interactions (e.g., videos, comments, likes), or the purchase history
with marketing eventually knowing more about customers than their friends (Leeflang et
al., 2014; Rust and Huang, 2014; Wedel and Kannan, 2016; Zhao, 2013). The value in
these data comes from the possibility to observe customers of competitors instead of
solely observing the own customers (Wedel and Kannan, 2016).
Challenges are privacy issues from all the data flood (Wedel and Kannan, 2016) and
usually very low accuracy for future predictions, despite all the data (Leventhal, 2015).
Further, with the growth of data and the various Marketing channels, the question for
accountability of the different Marketing measures increases (Leeflang et al., 2014). This
leads to subsequent challenges, since mass Marketing will still be necessary as Marketing
channel and an organization must track and account for various channels and touching
36
points of customers with advertisements and spillovers across channels (Leventhal, 2015;
Wedel and Kannan, 2016). The emphasis on accountability and data heavy decision-
making in Marketing is further argued to slow down decisions as well as hindering
creativity and innovations and thus reduce Marketing performance overall (the so-called
“data-innovation dilemma”) (Germann et al., 2013; Leeflang et al., 2014).
2.3.3 Healthcare Analytics
Healthcare is another data rich environment, but these data are usually stored as hardcopy
and get increasingly digitalized opening the opportunities for Analytics (Raghupathi and
Raghupathi, 2014). Thereby, a variety of actors is interested in the Analytics enabled
potential of these data including physicians, patients, policy makers, insurances and the
general public (Shneiderman et al., 2013; Srinivasan and Arunasalam, 2013). Due to the
different actors, a multitude of objectives has evolved. An overall objective is to improve
health of patients and quality of healthcare (Kohn et al., 2014; Shneiderman et al., 2013).
Considering the different actors, sub-objectives are to enable participation of patients in
decision-making and care for their health, personalizing treatment accounting for
individual patient characteristics, creating access to healthcare, keeping the health system
economically sustainable (e.g., preventing fraud), directing the knowledge growth of
healthcare to guide decision-making, improving allocation of resources including medical
specialists, and optimization of the care process (Belle et al., 2015; Kohn et al., 2014;
Raghupathi and Raghupathi, 2014; Shneiderman et al., 2013; Srinivasan and Arunasalam,
2013). All these objectives are accompanied by the aspired reduction of costs (Raghupathi
and Raghupathi, 2014; Shneiderman et al., 2013).
Resulting, a variety of applications using healthcare data exists including assessment of
national health status or trends (e.g., obesity or spreads of diseases), improved alert
systems for critical patient conditions, prediction of critical conditions, pattern
recognition in drug interactions, predictions of treatment or healthcare habit to adjust the
respective (Kohn et al., 2014; Shneiderman et al., 2013), and genomics, which is
supposed to deliver the necessary insight for personalized care and treatment
development for complex diseases (Belle et al., 2015). The data comes from a magnitude
of point-of-care data sources including clinical sensors, images, electronics health records
or written notes (Kohn et al., 2014; Shneiderman et al., 2013). However, increasingly
external sources create relevant data for Healthcare Analytics including personal sensors,
37
social media, pharmacies, or laboratories (Raghupathi and Raghupathi, 2014;
Shneiderman et al., 2013).
Yet, the data is a major challenge for healthcare Analytics. First, there is a magnitude of
data types such as different imaging techniques, physiological signals or textual records.
Second, coming from different devices, data exist in different data formats, images have
different resolutions or dimensions, and signals must be geospatially and temporally
aligned and are highly context dependent (Belle et al., 2015; Shneiderman et al., 2013).
Third, data is frequently stored in siloed systems with inefficient sharing at care providers
or in personal devices preventing a holistic view of a patient’s medical condition (Belle
et al., 2015; Kohn et al., 2014). Fourth, using this data raises privacy issues (Viceconti et
al., 2015). Fifth, even with all issues resolved, there is still variability in the target
variables since humans differ, complicating the creation of accurate and robust models.
However, highly accurate models are needed because the costs of an error are very high
since they influence potentially lifesaving decision (Raghupathi and Raghupathi, 2014;
Srinivasan and Arunasalam, 2013).
2.3.4 Public Sector Analytics
Governments and agencies historically store data for several reasons including legal
reporting or administrative usage (Fredriksson et al., 2017), while they provide a myriad
of applications and services: tax, health, defense, public safety and national security,
social services, transportation, disaster management, agriculture, energy, government
finance, fire and police services, education or waste collection (Daniell et al., 2016;
Gamage, 2016; Malomo and Sena, 2017). However, with this range comes
decentralization with a resulting immature state of progression in Analytics (Daniell et
al., 2016; Desouza and Jacob, 2017; Gamage, 2016; Malomo and Sena, 2017).
Due to its fundamental task, a major objective of applying Analytics is a more efficient
allocation of public resources. Analytics-based, this might be achieved by understanding
current needs and preferences to direct resources to the most needed areas as well as
predicting future needs, acting proactively and designing prevention measures (Daniell et
al., 2016; Fredriksson et al., 2017; Malomo and Sena, 2017). This is accompanied by the
objectives of cost reduction of public services (Gamage, 2016; Malomo and Sena, 2017)
and increased transparency of public decision-making (Fredriksson et al., 2017; Klievink
et al., 2017) with subsequent increased involvement in and acceptance of policies by
citizens (Daniell et al., 2016).

38
Consequently from the variety of services, there is a multitude of example applications:
route optimization for waste collection, transparency initiatives about commissioned
services, optimized infrastructure expansions, resource allocation after environmental or
humanitarian disasters, improvement of ambulance fleet dispatch, pattern recognition for
city inspector allocation (Daniell et al., 2016; Desouza and Jacob, 2017; Malomo and
Sena, 2017). However, these examples are limited in range and usually bound to local
authorities with rare spillover to other cities. Further, some authorities create digital
channels for service delivery with little known generated benefits (Malomo and Sena,
2017). While data in the public sector is usually structured and static with missing
granularity for Analytics, increasingly real-time sensor and camera data are used to
monitor traffic or identify needed infrastructure investments (Gamage, 2016; Malomo
and Sena, 2017). In addition, the use of social media data has been attempted but has
revealed several issues including the unequal access of socioeconomic groups to digital
communication technologies (Desouza and Jacob, 2017).
The public sector is facing a variety of challenges which are disruptive to many Analytics
initiatives. Data access across different authorities is a major challenge due to their siloed
organizations resulting in different IT systems and infrastructure, with different standards
(or rather a lack of standards across authorities), and different methodologies of data
collection (Desouza and Jacob, 2017; Malomo and Sena, 2017). Further, there are
uncertainties amongst authorities of what can legally be shared since rules are inaccurate
and concerns of breaching privacy regulations and consequent loss of trust are high, as
well as, in case of commissioned services, agreements about data sharing might even be
missing (Gamage, 2016; Malomo and Sena, 2017). This is magnified due to unsolved
questions of privacy about personal data raising ethical concerns about using and sharing
of data (Malomo and Sena, 2017) and in some cases the prohibition of public
organizations to perform tasks outside their statutory tasks since they are funded for
respective tasks (Klievink et al., 2017). If all these issues would be resolved, the public
sector still experiences a skill gap since the private sector can pay higher salaries
(Gamage, 2016). And even if this gap could be overcome, the general operating principal
of the public sector would complicate the use of Analytics, since decisions are made for
society at large, the policy making is driven by a non-monetary public value and this
public value is dependent on the political value system of the elected representatives,
which might be driven by short (or rather shortsighted) time horizons with reelections in
39
mind (Daniell et al., 2016). Efficient or effective resource allocation thus becomes vague.
Overall, the public sector has a high degree of uncertainty about where and how to use
Analytics (Klievink et al., 2017).
2.3.5 Sports Analytics
Sports is a field craving for quantified data (Hutchins, 2016) and most professional Sports
teams nowadays use Analytics, including the use for on-field decisions (Davenport,
2014b). Sports is seemingly different from other domains, since Sports are usually limited
in time, space with rules for behavior, a predetermined objective and, in many Sports,
very intense interactions between opposing individuals and teams, which thus compete
on the field while cooperating in leagues which might even share revenues
(Gudmundsson and Horton, 2017; Stein et al., 2017; Troilo et al., 2016). In terms of
markets, Sports and their professional teams compete with other forms of entertainment
(Miller, 2015), resulting in Sports being quite similar to other conventional industries
with stakeholders demanding the creation of value (Caya and Bourdon, 2016).
The objectives of using Analytics vary with the stakeholder level. In professional Sports,
competitors are organized in leagues and federations which strive to attract and retain
fans and sponsors (Caya and Bourdon, 2016; Miller, 2015). The team stakeholders like
managers and coaches are interested in increasing revenues and financial performance
from selling tickets and merchandise as well as to improve their performance in the
respective Sport by developing tactics, player preparation, evaluation and recruitment or
identifying weaknesses of opposing teams (Caya and Bourdon, 2016; Stein et al., 2017;
Troilo et al., 2016). The individual athletes desire – in self-service or with specialists – to
improve their athletic performance by enhancing understanding of on-field performance,
training, diets, general health and injury prevention (Caya and Bourdon, 2016; Davenport,
2014b).
Consequently, different stakeholders demand various applications. To engage fans,
entertainment products are created from data, Analytics and metrics (Caya and Bourdon,
2016). To increase revenue, dynamic pricing or sponsorship measurements are performed
(Caya and Bourdon, 2016; Troilo et al., 2016). Coaches want to explore, which tactics
and lineups work. They do so by identifying promising on-field positions for actions, by
classifying styles of athletes and their most likely behaviors, by understanding patterns in
successful and unsuccessful attacks, or by assessing the importance of players to teams
(Davenport, 2014b; Gudmundsson and Horton, 2017; Stein et al., 2017). Athletes and
40
coaches are interested in performance metrics of competitions and trainings reflecting
productivity and effectiveness of players, which are constantly advanced to include the
context of players performance. This context might include the presence or absence of
team members (plus/minus analysis), difficulties of performed actions including distance
to goal or proximity of opponents, weather changing field position or athletes’ stamina
(Davenport, 2014b; Gudmundsson and Horton, 2017; Stein et al., 2017). The applications
are possible due to optical tracking with cameras from TV providers or many installed in
stadia as well as device tracking with wearable devices collecting location and movement
GPS-based as well as biometric data. These trackers provide trajectory data which can be
combined with, often manually collected, event data to enable advanced Analytics
(Davenport, 2014b; Gudmundsson and Horton, 2017; Stein et al., 2017).
The resulting demand for analytical talent and budget usually leads to professional sports
organizations cooperating with third-party vendors (Caya and Bourdon, 2016; Davenport,
2014b). The financial power for such invests and the potential benefits is concentrated to
the very popular men sports and leaves behind lower level professional sports, semi-
professional sports, most women sports and amateurs, eventually creating a digital divide
(Hutchins, 2016). It further requires an open mindset and a positive reception towards
usefulness from coaches and athletes not always available in “old-line coaches” (Caya
and Bourdon, 2016; Davenport, 2014b). In addition, applications often have only a niche
of user because of differences in Sports (Caya and Bourdon, 2016; Gudmundsson and
Horton, 2017). However, while the specific applications might not be copied from one
sport to another, the idea and concept of an application might be transferred and adapted
to another sport. Likewise, ideas and concepts of applications of one domain could be
transferred to other domains, such as the investigation of plus/minus patterns in
treatments could provide input to healthcare or the context-based analysis of delivery
vehicles in different delivery areas could provide insights to LSCM.

Submitted version. Published as: Herden, T.T. (2020). Mapping domain characteristics influencing
Analytics initiatives: The example of Supply Chain Analytics. Journal of Industrial Engineering and
Management, 13(1), 56-78. https://doi.org/10.3926/jiem.3004 (published by omniaScience, CC BY-NC 4.0)
41
3 Mapping domain characteristics influencing Analytics initiatives - The example
of Supply Chain Analytics
Purpose: Analytics research is increasingly divided by the domains Analytics is applied
to. Literature offers little understanding whether aspects such as success factors, barriers
and management of Analytics must be investigated domain-specific, while the execution
of Analytics initiatives is similar across domains and similar issues occur. This article
investigates characteristics of the execution of Analytics initiatives that are distinct in
domains and can guide future research collaboration and focus. The research was
conducted on the example of Logistics and Supply Chain Management and the respective
domain-specific Analytics subfield of Supply Chain Analytics. The field of Logistics and
Supply Chain Management has been recognized as early adopter of Analytics but has
retracted to a midfield position comparing different domains.
Design/methodology/approach: This research uses Grounded Theory based on 12 semi-
structured Interviews creating a map of domain characteristics based of the paradigm
scheme of Strauss and Corbin.
Findings: A total of 34 characteristics of Analytics initiatives that distinguish domains in
the execution of initiatives were identified, which are mapped and explained. As a
blueprint for further research, the domain-specifics of Logistics and Supply Chain
Management are presented and discussed.
Originality/value: The results of this research stimulates cross domain research on
Analytics issues and prompt research on the identified characteristics with broader
understanding of the impact on Analytics initiatives. The also describe the status-quo of
Analytics. Further, results help managers control the environment of initiatives and
design more successful initiatives.
3.1 Introduction
Analytics has been praised to have a tremendous impact on the world economy by
changing the basics of competition and providing leading organizations with an edge in
operations improvements and new business models (Henke et al., 2016). This has
attracted professionals and researchers alike, creating a variety of domain-specific
subfields of Analytics. However, researchers usually do not work across domains
42
(Holsapple et al., 2014), while they usually not explain how the specific characteristics
of their domain alter the use of Analytics.
One of these subfields is Supply Chain Analytics (SCA) (Chae, Olson, et al., 2014;
Sanders, 2016; Souza, 2014) or SCM Data Science (Waller and Fawcett, 2013), which
concerns the application of Analytics in Logistics and Supply Chain Management
(LSCM). Scholars offer little explanation about differences of executing Analytics
initiatives in LSCM as compared to other domains. While scholars investigate the effects
of Analytics on LSCM (Chae, Olson, et al., 2014; Chavez et al., 2017), they do not
elaborate on the domain-specific execution of Analytics initiatives. Meanwhile, LSCM
research demands education programs for data scientists designated to LSCM (Waller
and Fawcett, 2013), but while LSCM theory may help analysts to understand the context,
benefits to the understanding of a specific practical problem are unknown. In addition,
scholars demand training of personnel in the LSCM domain in Analytics as well
(Schoenherr and Speier-Pero, 2015), while Analytics research argues for the benefits of
domain independent analysts collaborating with domain experts such as in cross
functional-teams instead of creating designated analysts (Bose, 2009; Harris and Craig,
2011; Lavalle et al., 2011). Scholars present opportunities and challenges of Analytics in
LSCM (Kache and Seuring, 2017; Sanders, 2016), while opportunities do not impact
LSCM processes and challenges are not described for their domain specifics. Further,
scholars have not presented research on challenges being domain-specific or cross
domain.
It is not the purpose of this research to call the advantages of domain-specific research on
Analytics into question. Domain-specific research is advantageous for addressing use
cases from a domain. It is argued to be more meaningful and have increased impact of
Analytics solutions, due to incorporated domain knowledge (Waller and Fawcett, 2013).
However, goal-oriented exchange between domains with similar issues may create
benefits in spillovers, as it does in collaborating business units in organizations
(Grossman and Siegel, 2014). Collaboration across domains on domain-independent
issues can provide benefits due to improved understanding of the issues and broader
solution search and direct domain-specific research towards issues critically demanding
domain knowledge. However, there is no good basis for distinction such as characteristics
of Analytics initiatives displaying potentially differentiating effects and issues in different
domains. Mapping these characteristics entails the potential to explain maturity and
43
adoption differences in executing Analytics initiatives across the various domains. For
instance, while LSCM displays an early adopter of Analytics (Davenport, 2009), this
forward-thinking position did not permeate through the field with few organizations
keeping up with implementing more advanced approaches (2017) but the field regarded
as laggard concerning Analytics (Bange et al., 2015; Thieullent et al., 2016).
Summarized, literature differentiates Analytics by domain with little necessity (Carillo,
2017) besides a more target-oriented addressing of an audience. Domains advance
differently in applying Analytics and research lack explanations. A clearer understanding
of distinctions can direct domain-specific efforts towards critical domain-specific issues
and stimulate cross-domain research and exchange on domain-independent issues. Thus,
this research pursues the mapping of characteristics of Analytics initiatives potentially
differentiating domains. As such, it follows the call for more investigation of differences
of domains in Analytics (Cao et al., 2015). In this effort, this research focuses on the
domain of LSCM and the Analytics subfield of SCA. Considering MacInnis (2011), this
work contributes by sketching and delimiting SCA. Consequentially, the research
question addressed is: what are characteristics of Analytics initiatives setting domains
apart in executing them and which specifications of these characteristics exhibits the
domain of LSCM?
This research concerns the increasing use of data to influence and transform businesses
(Carillo, 2017), which is assumed with the label of Analytics. The distinction to terms
such as Data Science and Business Intelligence is vague, leading to constant mix by some
scholars (Agarwal and Dhar, 2014; Chen et al., 2012; Larson and Chang, 2016; Song and
Zhu, 2016). While Data Science is understood as tool for Analytics (2015) and Business
Intelligence as technology focused (Larson and Chang, 2016), managerial issues of both
are treated as concerning Analytics as well. For the purpose of this research, a distinction
based on methods and technologies does not provide any value, while the distinction will
be revisited later.
The remainder of the paper is organized as follows: Section 2 provides the theoretical
background. Section 3 focuses on the methodology. In section 4 the resulting map of
characteristics of Analytics initiatives is presented and discussed. Section 5 concludes
this research and provides implications and limitations.
44
3.2 Theoretical background
In this article, differences between Analytics initiatives resulting from differences relating
to the domain are investigated. Thus, this section presents theoretical considerations on
the domain, practical impact and the incorporation of domain knowledge into Analytics.
3.2.1 The matter of domain in Analytics
The domain refers to the context (Kenett, 2015), subject field (Holsapple et al., 2014),
area (McAfee and Brynjolfsson, 2012) or business function (Bedeley et al., 2018; Carillo,
2017) in which Analytics is applied. Analytics can be applied to a variety of business
processes and industries (Davenport and Harris, 2007) and no limitations of domains to
use Analytics has been identified. This has resulted in an abundance of domain-specific
subfields including Marketing Analytics, Supply Chain Analytics, Financial Analytics
and more, while there is little exchange between these subfields (Holsapple et al., 2014).
Scholars consideration of the domain’s influence on executing Analytics initiatives is
more of a side note. However, the domain is the subject of data analysis and solution
deployment and its role in an Analytics initiative is essential considering that the domain
and its issues are the overall reason the initiative exists. An initiative does not come out
of the void and is supposed to be based on a business need or opportunity of a domain
(Grossman and Siegel, 2014; Lavalle et al., 2011; Watson, 2014). The value Analytics
can generate by providing solutions and insights is correspondingly related to the domain,
in which the insights and models/algorithms are deployed to and applied in (Anant Gupta,
2014; Bedeley et al., 2018; Gupta and George, 2016). This essential link to the domain
might be fragile if the domain representatives are not convinced Analytics will meet their
needs. Thus, intensive communication, exchange and knowledge integration of analysts
and domain representatives is necessary such that the domain will buy-in and the solution
deployment is not destined to fail (Dutta and Bose, 2015; Grossman and Siegel, 2014;
Wixom et al., 2013). After all, the domain is typically the sponsor of an initiative
(Grossman and Siegel, 2014), including the investment of time from domain experts
(Viaene and Bunder, 2011).
Besides creating a gateway to purpose, sponsoring and subject of deployment of
Analytics solutions, the domains knowledge influences the search for insights. Section
3.2.3 discusses further details on incorporating domain knowledge into an Analytics
initiative. This domain knowledge includes among others knowledge about an
organizations mission, goals, objectives and strategies, about organizational policies and
45
plans and the understanding of the potential impact of Analytics initiatives on
organizational performance. Further, it includes knowledge enabling the interpretation of
business problems and appropriate solutions (Ransbotham et al., 2015; Watson, 2014).
Scholars argue for the criticality of this knowledge in the success (or rather
meaningfulness) of Analytics initiatives (Chen et al., 2012; Debortoli et al., 2014; Harris
et al., 2010; Janssen et al., 2017; Wixom et al., 2013).
In detail, domain knowledge provides guidance for the analytical process by determining
subsequent steps and a course of action, identifying challenges, giving directions for
decision points, and validating results (Ittoo et al., 2016; McAfee and Brynjolfsson, 2012;
Ransbotham et al., 2015; Viaene, 2013; Wixom et al., 2013). It enhances the identification
of the most valuable opportunities and needs or the best way to apply analytical skills to
provide value to the organization (Grossman and Siegel, 2014; Harris et al., 2010;
McAfee and Brynjolfsson, 2012). The understanding of the business problem can be
improved by domain knowledge, as well as the assumptions behind business ideas and
the objective behind applying Analytics (Chiang et al., 2012; Viaene, 2013). Regarding
data, domain knowledge leads to choosing the right data and data sources, better
understanding of the data as well as potential sources of measurement and collection
inaccuracy of the data (Harris et al., 2010; Kenett, 2015). It helps to make sense of results
of analyses and patterns found (Debortoli et al., 2014; Richards, 2016) and therefore the
creation of more valuable models and solutions and especially to avoid finding insights
already known to the domain expert but new to the Analyst (Chiang et al., 2012;
Grossman and Siegel, 2014; Harris and Craig, 2011; Viaene, 2013). In relation to this,
domain knowledge is indicated to improve Analysts effectiveness and thus the fit of
solution to problem (Carillo, 2017; Wixom et al., 2013), Analyst efficiency and Analysts
engagement (Harris and Craig, 2011). Finally, domain knowledge improves
communication of results (Chiang et al., 2012; Debortoli et al., 2014).
Of course, the domain is not the sole factor indicated to influence Analytics initiatives.
Authors have named internal factors including company size (Cao et al., 2015; Davenport
et al., 2010), the data-savviness of employees and a data-driven culture (Acito and Khatri,
2014; Carillo, 2017; Gupta and George, 2016; Ransbotham et al., 2016), executive
support, prior successes and available expertise (Acito and Khatri, 2014; Ransbotham et
al., 2016). Another moderating factor is the fit of Analytics to organizational strategy,
46
structure, and processes (Cao and Duan, 2017). This underlines that one Analytics
approach of an organization cannot simply be transferred to another.
3.2.2 The impact of domain on Analytics
A study on Analytics in different business functions shows that some domains are more
likely to be supported by Analytics than others. Domains that attract most attention are
finance, LSCM, strategy and business development, as well as sales and marketing
(Lavalle et al., 2011). These domains are more experienced with statistical and
quantitative techniques, are considered historically data-driven, and are expected to have
a high payback (Acito and Khatri, 2014; Anant Gupta, 2014; Kiron et al., 2012). This
section investigates the impact of domains by considering objectives and challenges.
The objectives of collecting and analyzing data across domains differ and Analytics
solutions cannot be transferred from one domain (or organization) to another with the
expectation of similar results (Kambatla et al., 2014; Lavalle et al., 2011). This results
from domains pursuing different business objectives, working differently and having
different issues. Considering different industries, domains differ in regulations,
competitiveness, technological change and standards, Analytics standards, time-
sensitiveness, or their public importance (Acito and Khatri, 2014; Trieu, 2017). To
exemplify, medicine and aviation aim to reduce the cognitive load of the decision maker
in highly stressful environments, in which they have high information demands with
inadequate time to sort out the most vital information beyond the simple filtering or
aggregation (Richards, 2016). In less stressful environments but with requirements for
broad oversight and real-time availability, monitoring is pursued by retail and LSCM
(Watson, 2014). In contrast, marketing or retail applications target the detection of
changes in behavior potentially presenting new opportunities with a completely different
time horizon (Shuradze and Wagner, 2016; Trieu, 2017). Another marketing objective of
capturing opinions is similarly pursued by politics. But while Marketing requires insights
for personalization, political candidates require insights guiding a collective political
agenda to all voters (Gandomi and Haider, 2015; Shuradze and Wagner, 2016). Predicting
behavior (e.g., demand) is an essential objective in LSCM and utilities but caters
subsequent objectives such as optimal resource allocation (Acito and Khatri, 2014;
Watson, 2014). Insurances want to gain deeper understanding of why behavioral changes
happened to prevent fraud (Watson, 2014). Finally, domains with high frequencies of
47
reoccurring verbal and written interactions, such as tourism, aspire automation of these
processes with Analytics (Gandomi and Haider, 2015).
Different domains also bring different challenges for Analytics. Considering the
examples below, these challenges result from complexity of conducted analytical
methods or from internal and external organizational matters. Challenges closely linked
to methods and techniques appear in complex analytical tasks like environmental studies,
which demand the combination of spatio-temporal scaled inputs of satellite imagery,
weather data and terrestrial monitoring (Kambatla et al., 2014). Domains intending to
understand the structure of social networks must control dynamic evolution of
connections between entities and dynamic interactions via these connections. Further
challenges arise from methods generating large volumes of data output during an analysis
requiring storage, like an astro-physical simulation (2014). Additionally, the cost of
inaccuracy of the Analytics solutions differs such that false positives (or rather false
negatives) of a diseases or fatal condition in healthcare have a different impact as
compared to customer preferences in marketing (Kambatla et al., 2014).
Technical challenges can be more frequent and relevant in domains with complex data
integration needs. For example, in healthcare data is captured in heterogenic formats and
collection is widely distributed over points-of-care (Acito and Khatri, 2014; Kambatla et
al., 2014). Further technical challenges from data including data growth, data quality or
the degree of unstructured data (Chen et al., 2012; Kambatla et al., 2014), which are,
however, hard to connect to certain domain characteristics.
Organizational challenges concern domains working with person-related data. The
challenges of securing privacy and subsequent data security are pressing in domains like
healthcare, e-commerce or e-government and can trigger ethical issues, which create the
need to ethically justify the use of the data (Acito and Khatri, 2014; Chen et al., 2012;
Kambatla et al., 2014). Further organizational challenges are the creation of data without
any or adequate collection and storage, such as domains that do not store event logs, such
as LSCM, or produce loads of handwritten notes with valuable information, such as
healthcare (Chen et al., 2012). Special organizational challenges arise in business
domains, since the increase of self-service Analytics create the challenge of inadequate
knowledge of users leading to subverted effectiveness of the decisions made (Richards,
2016). In addition, business organizations tend to deploy several models and algorithms
at once with different data, requirements of speed, different sources of data and data

48
structure, while models, algorithms and their output are not integrated for consistency
(Kambatla et al., 2014).
The differences of objectives and challenges across the domains affect various aspects of
Analytics. The consideration above suggest that different domains have different
requirements for Analytics, have different influence on organizational aspects of
Analytics, and integrate Analytics differently into processes (Cao et al., 2015; Davenport
et al., 2010; Janssen et al., 2017). Further, domains have different spending on Analytics,
while the organizational performance is impacted differently (Cao et al., 2015; Trieu,
2017).
Considering the practical impact of domain characteristics, industry reports give
appropriate insight and show substantial differences in the most frequent use cases,
adoption rates, main challenges, and data-based business models potentially disruptive in
different domains (Henke et al., 2016; Toonen et al., 2016). Striking differences in
tendencies for data-driven decision-making as opposed to intuition are reported as well
(Erwin et al., 2016). However, reports show similarities in challenges and recurring use
cases recur across domains as well (Bange et al., 2017; Toonen et al., 2016).
Concluding, domains differ in objectives and challenges and further show different
experiences with Analytics. As indicated, these differences result in and from altered
organizational, technical, data related or methodological characteristics.
3.2.3 Modes of incorporating domain knowledge in Analytics initiatives
Two aspects are explored regarding the incorporation of domain knowledge into
Analytics initiatives: the domain knowledge holder and the interaction of analysts with
the domain.
Considering the knowledge holder, the necessity of analysts to hold domain knowledge
and be proficient in numerical disciplines specific to the domain they work in has been
argued (Chen et al., 2012; Debortoli et al., 2014; Grossman and Siegel, 2014; Harris and
Craig, 2011). Supposedly, this is key to successful analysts able to communicate with the
domain representatives. The skills list of the ultimate breed of analysts, the data scientist,
usually includes domain knowledge (Carillo, 2017; Debortoli et al., 2014), as part of
portraying a jack-of-all-trades. In the contrasting second mode, the domain knowledge
holder is a domain expert, supporting analysts to understand data, patterns, results and
their implications because analysts lack the knowledge (Ittoo et al., 2016; Janssen et al.,
49
2017; Richards, 2016; Watson, 2014). This promotes cross-functional teams in which key
personnel from different functions represent the needs of their respective function and
communicate the progress and result to it (Bose, 2009; Dutta and Bose, 2015; Rothberg
and Erickson, 2017). A hybrid version of these two modes argues for analysts to receive
the domain knowledge on the fly during an initiative. They take part in the data collection,
get sense of variations, visit premises, and have focused conversations to gain a
comprehensive and holistic view, as well as create conditions for cooperative work on the
solution with domain experts (Kenett, 2015; Viaene, 2013). This hybrid counters missing
communication on important features of the domain by experts, which take them for
granted, requiring scrutiny of analysts.
Regarding interaction, two idiosyncratic modes have been identified with two hybrids.
The first mode is the centralization of analysts in a separate unit as center of excellence ,
which deploys analysts into domains on demand (Debortoli et al., 2014; Grossman and
Siegel, 2014; Lavalle et al., 2011). Advantageously, an organization’s Analytics expertise
is shared in that unit, including governance, tools, methods and specialized expertise
creating a more consistent level of effectiveness across domains (Kiron et al., 2012;
Lavalle et al., 2011). This is especially useful for predefined questions reoccurring across
domains (Debortoli et al., 2014). However, it creates distance between analysts and
domains and potentially reduces analysts’ understanding about domains and awareness
of their needs (Grossman and Siegel, 2014), and is vulnerable to organizational politics
(Kiron et al., 2012). In contrast, analysts can be organized domain-specific and
decentralized (Carillo, 2017; Grossman and Siegel, 2014; Wedel and Kannan, 2016;
Wixom et al., 2013). The popularity of this approach can be observed in the richness of
domain-specific job postings (Carillo, 2017; Debortoli et al., 2014). When the need for
Analytics is initially recognized, closeness is desired, and this mode creates close
collaboration between analysts and domain representatives, leads to tailored solutions to
domain requirements, and provides analysts with freedom to explore and experiment
(Grossman and Siegel, 2014; Kiron et al., 2012; Lavalle et al., 2011). However, this siloed
approach ignores the commonalities of tasks across domains, which would allow
exchange with potential benefits, eliminate the need for tailored solutions, and saves
resources. It can result in skill gaps, isolated expertise, and a lack of leadership to harness
and develop analysts, resulting in domains left behind (Carillo, 2017; Grossman and
Siegel, 2014; Wixom et al., 2013). It delays the development of broad expertise across
50
the organization with flexibility to respond quickly to emerging issues without excessive
overhead (Wedel and Kannan, 2016).
Two distinct hybrid modes are discussed below, while a multitude of gradations is
imaginable. First, analysts can be rotated through several domains by assignment
exposing them to several domains and facilitating their interaction with key stakeholder
(Harris et al., 2010; Harris and Craig, 2011; Wixom et al., 2013). That way, analysts are
more aware of the organizations main activities, challenges and processes and develop
more understanding of the organization overall including strategy and value creation
potential from Analytics solutions (Harris et al., 2010). Thereby, the fit to strategy is
indicated as a distinguishing factor between low and high performers (Cao and Duan,
2017). Rotation further creates exchange between domains and stimulates the adoption
of Analytics across domains (Lavalle et al., 2011). The rotation can be vice versa, such
as domain experts being deployed to Analytics functions as support as well (Wixom et
al., 2013). The second hybrid organizes analysts by deploying some Analysts in domains
and keeping some centralized (Debortoli et al., 2014; Grossman and Siegel, 2014;
Watson, 2014). This hybrid accounts for problems which can be performed by generalists
and for business problems requiring highly specialized Analysts, which should be
strongly familiar with the domain (Debortoli et al., 2014; Grossman and Siegel, 2014).
For example, problems without predefined solutions or of an experimental nature that
might include innovative technologies and concepts.
3.3 Methodology
This research aims to explore characteristics of Analytics initiatives setting domains apart
exemplified on the LSCM domain. This aim requires a research design facilitated in
empirical data. Since the research about these individual aspects is limited and incidental
in existing literature, this research is exploratory. Thus, a Grounded Theory approach has
been chosen using semi-structured interviews for data collection (Manuj and Pohlen,
2012; Strauss and Corbin, 1998).
Grounded Theory combined with semi-structured interviews was used previously in
LSCM research to map phenomena and develop distinctions. Grounded Theory was
employed to map themes and properties of enhanced communication that have
explanatory value for differences in business performance in the employee-to-employee
relationships between supply chain organizations (2012), benefit categories of supply
chain clusters have been identified with detailed reasoning of distinction (Rivera et al.,
51
2016), and definitions of supply chain complexity and supply chain decision-making
complexity have been designed, and antecedents, moderators, outcomes and interrelations
have been identified (Manuj and Sahin, 2011). Summarized, Grounded Theory generates
depth and understanding of research topics in LSCM when little is known about the
research subject and is resultingly suitable for this research.
3.3.1 Sample and data collection
Initially, experts on SCA were contacted for interviews, but these experts expressed their
concern about their inability to make statements about differences of LSCM as compared
to other domains, since their experience is limited to one domain. Consequently, experts
with experience in executing Analytics initiatives in different domains were sought by
approaching “Data Analytics Companies” (Beer, 2018). Specifically, experts in these
organizations were contacted and asked about their experience with different domains
and their experience with LSCM. Experts that signaled knowledgeability about LSCM
and several other domains were asked for interviews. For this purpose, a list of top
solution vendors and integrators for Analytics was extracted from market reports. A list
of 110 “Data Analytics Companies” was compiled and participants from managerial and
senior positions were chosen for establishing contact. An initial sample of interviewees
has been sought based on experience, job title, profile and willingness to participate.
Subsequently, theoretical sampling was used in accordance with the Grounded Theory
approach (Manuj and Pohlen, 2012; Mello and Flint, 2009; Strauss and Corbin, 1998).
Thus, the choice of contacted experts was determined by the emerging theory from
analyzing the conducted interviews. With emerging theory, interviewees were recruited
with the objective to develop further understanding in certain aspects. Therefore, personal
and company profiles were taken into focus, while job title and experience requirements
were relaxed. Later interview requests targeted more technology focused organizations
as well as experts in Prescriptive Analytics topics. Eventually 13 interviewees have been
recruited resulting in twelve interviews including one interview with two interviewees.
For reasons of anonymity, position and organizations are presented as lists:
• Positions: Head of Analytics (2), Director Analytics (3), (Senior) Manager
Analytics (3), Consultant Analytics (2), Solution Architect Analytics (3)
• Organization: Solution Vendors (5), Solution and Service Vendors (2),
Consultancy (1), Solution Vendor and Consultancy (2), Integrator (1), Service
Vendor and Consultancy (1)
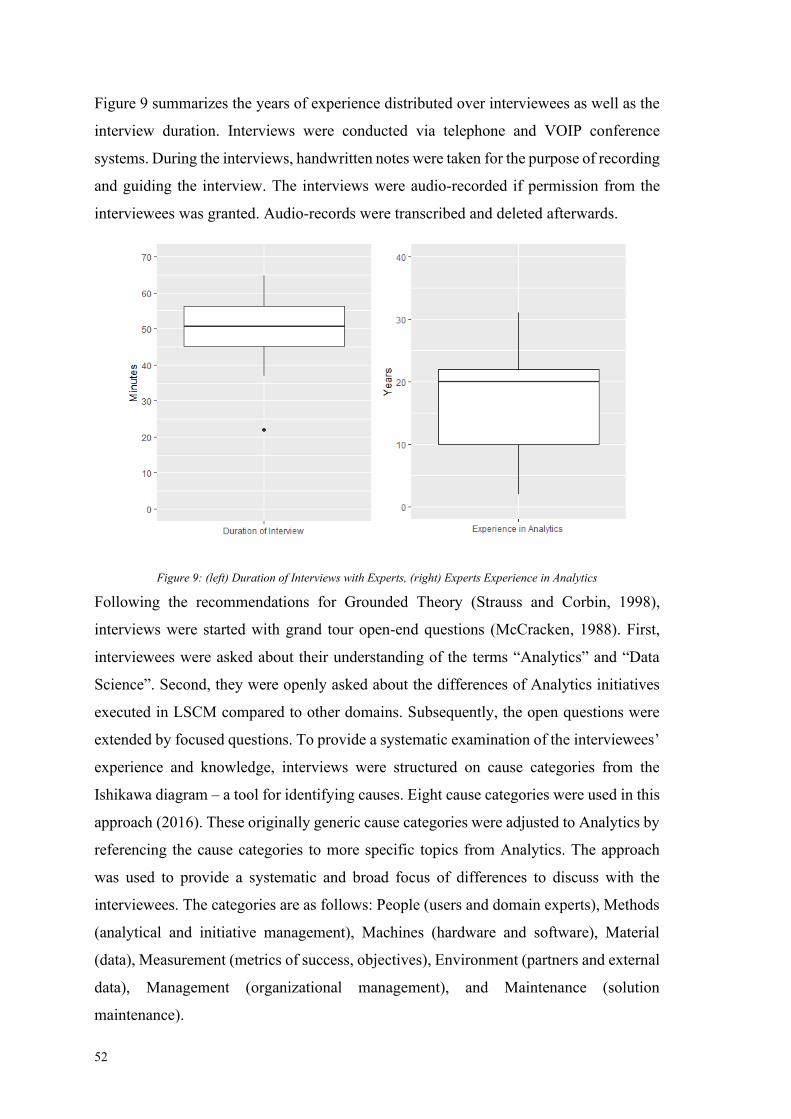
52
Figure 9 summarizes the years of experience distributed over interviewees as well as the
interview duration. Interviews were conducted via telephone and VOIP conference
systems. During the interviews, handwritten notes were taken for the purpose of recording
and guiding the interview. The interviews were audio-recorded if permission from the
interviewees was granted. Audio-records were transcribed and deleted afterwards.
Figure 9: (left) Duration of Interviews with Experts, (right) Experts Experience in Analytics
Following the recommendations for Grounded Theory (Strauss and Corbin, 1998),
interviews were started with grand tour open-end questions (McCracken, 1988). First,
interviewees were asked about their understanding of the terms “Analytics” and “Data
Science”. Second, they were openly asked about the differences of Analytics initiatives
executed in LSCM compared to other domains. Subsequently, the open questions were
extended by focused questions. To provide a systematic examination of the interviewees’
experience and knowledge, interviews were structured on cause categories from the
Ishikawa diagram – a tool for identifying causes. Eight cause categories were used in this
approach (2016). These originally generic cause categories were adjusted to Analytics by
referencing the cause categories to more specific topics from Analytics. The approach
was used to provide a systematic and broad focus of differences to discuss with the
interviewees. The categories are as follows: People (users and domain experts), Methods
(analytical and initiative management), Machines (hardware and software), Material
(data), Measurement (metrics of success, objectives), Environment (partners and external
data), Management (organizational management), and Maintenance (solution
maintenance).
53
Interviewees reported the differences of domains in executing Analytics initiatives to be
nuances. However, these nuances corresponded to the characteristics aspired to identify.
Thus, the characteristics, or rather phenomena (1998), and how they influence Analytics
initiatives were mapped as presented in section 3.4. Interviewees elucidated the nuances,
they perceive, based on Analytics initiatives they have contributed to. The systematically
semi-structured interviews lead to three forms of characteristics: (1) interviewees
presented distinguishing characteristics of LSCM from other domains, (2) interviewees
explained characteristics with differentiation potential through examples that distinguish
other domains and commented that LSCM does not differ from the majority of domains,
(3) interviewees explained distinguishing characteristics that were previously different in
domains but not currently. The latter was primarily influenced by the current hype-level
of Analytics causing changes in the characteristics across domains.
3.3.2 Data Coding and Analysis
Data was analyzed in accordance with the guidelines of Grounded Theory as described
by Strauss and Corbin (1998). In the first step of the analysis of interview transcripts,
open coding was performed following each interview with the intention to incorporate
new aspects into the subsequent interview. In open coding, the interviews were
conceptualized on a sentence-by-sentence basis by labeling them with short explaining
phrases or terms. Similar statements were given the same label. The labels, and concepts
they represent, were used to identify “categories” in subsequent steps, which reflect
phenomena such as events, conditions or actions/interactions. After twelve interviews,
theoretical saturation was attained such that incremental interviews were not expected to
yield additional information. The analysis was performed using the ATLAS.ti software
and resulted in 90 labels. After all Interviews were conducted, following Strauss and
Corbin (1998), the labels were reevaluated to discover the categories. Thus, the concepts
were grouped under higher order categories with an improved ability to explain or predict
phenomena. For this purpose, a category by category comparison was conducted.
Resulting higher order categories were subsequently given names with explanatory value
and these categories were developed into phenomena by using the interview chunks to
derive explanations describing the phenomena and delineating them from other
phenomena. These steps eventually concluded in 34 categories.
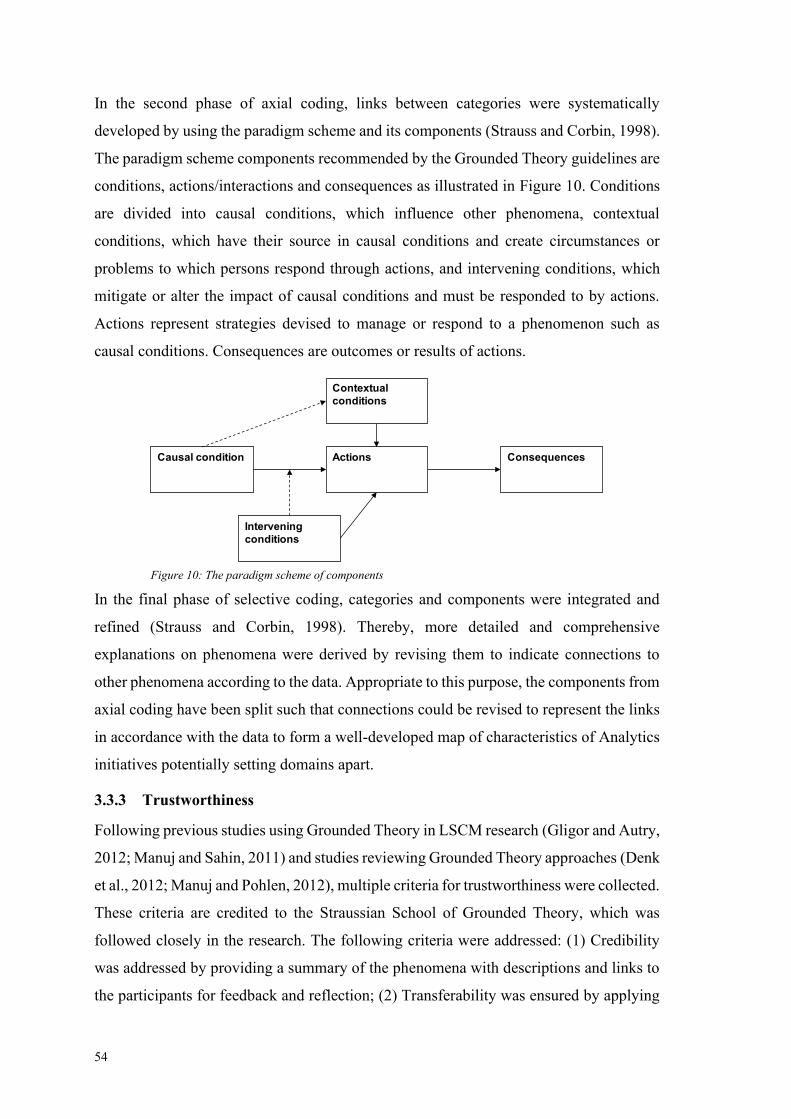
54
In the second phase of axial coding, links between categories were systematically
developed by using the paradigm scheme and its components (Strauss and Corbin, 1998).
The paradigm scheme components recommended by the Grounded Theory guidelines are
conditions, actions/interactions and consequences as illustrated in Figure 10. Conditions
are divided into causal conditions, which influence other phenomena, contextual
conditions, which have their source in causal conditions and create circumstances or
problems to which persons respond through actions, and intervening conditions, which
mitigate or alter the impact of causal conditions and must be responded to by actions.
Actions represent strategies devised to manage or respond to a phenomenon such as
causal conditions. Consequences are outcomes or results of actions.
In the final phase of selective coding, categories and components were integrated and
refined (Strauss and Corbin, 1998). Thereby, more detailed and comprehensive
explanations on phenomena were derived by revising them to indicate connections to
other phenomena according to the data. Appropriate to this purpose, the components from
axial coding have been split such that connections could be revised to represent the links
in accordance with the data to form a well-developed map of characteristics of Analytics
initiatives potentially setting domains apart.
3.3.3 Trustworthiness
Following previous studies using Grounded Theory in LSCM research (Gligor and Autry,
2012; Manuj and Sahin, 2011) and studies reviewing Grounded Theory approaches (Denk
et al., 2012; Manuj and Pohlen, 2012), multiple criteria for trustworthiness were collected.
These criteria are credited to the Straussian School of Grounded Theory, which was
followed closely in the research. The following criteria were addressed: (1) Credibility
was addressed by providing a summary of the phenomena with descriptions and links to
the participants for feedback and reflection; (2) Transferability was ensured by applying
Actions Consequences
Contextual
conditions
Intervening
conditions
Causal condition
Figure 10: The paradigm scheme of components
55
theoretical sampling; (3) Dependability was addressed by following the guidelines of
Strauss and Corbin for Grounded Theory (Strauss and Corbin, 1998) and McCracken for
interview design (McCracken, 1988); (4) Confirmability was aspired by a technique using
an altered form of bracketing (Kvale, 1983) as described by Manuj (2011), which requires
the authors to write down the essential points known about the research subject. The pre-
existing knowledge was afterwards compared to the results. Phenomena that overlapped
in pre-existing knowledge description and results were reviewed for existence in the
transcripts; (5) Integrity was established by maintaining anonymity of the interviewees;
(6) fit was ensured by the methods for credibility and dependability; (7) Understanding
was also addressed by the summary provided to interviewees and the inquiry to feedback
and reflect them; (8) Control was given to interviewees who had some control to direct
the interview to topics they perceived as important; (9) Generality was aspired with the
length and open questions of the interviews and the subsequent systematic structure
intended to cover as many areas as possible.
3.4 Results and discussion
This section explores the results by presenting the characteristics of Analytics initiatives
differentiating domains and specifics of LSCM.
3.4.1 The map of characteristics of Analytics initiatives differentiating domains
The characteristics derived from the data analysis have been map according to the
paradigm scheme of Strauss and Corbin (1998). Due to substantial differences of
characteristics allocated to components, the components have been further segmented.
This resulted in eleven sub-components with 32 characteristics of Analytics initiatives
differentiating domains. A twelfth component has been created describing the concept of
Analytics, which is independent from the domain. The components and their
characteristics, which are explained in the upcoming section, are illustrated in Figure 11.
3.4.1.1 The concept of Analytics
Two domain independent characteristics were identified, which describe the
interviewees’ conceptualization of Analytics and distinct roles and attributes of Analysts.
The term degrees of Analytics hints at the degrees of business intelligence of Davenport
and Harris (2007) and addresses different levels of complexity of analytical methods.
However, they represent contemporary complexity levels, which are subject to change
over time. Analytics has been recognized as most complex degree of analytical methods
56
to the overall concept of Business Intelligence twelve years prior (Davenport and Harris,
2007). However, the interviewees of this study recognized Analytics as overall term, with
Business Intelligence as least complex degree, Analytics, with a second function for the
term, as label for the moderate degree, and data science as most complex degree of
analytical methods. In the introduction, the terms were expressed as being hard to
distinguish and interviewees explained this as somewhat artificially created. The methods
and technologies constantly evolve, but distinct labels advertised as innovations help to
draw attention to the topic. This attention helps to either market evolved analytical
concepts to more mature organizations for new use cases or present interesting
opportunities to organizations less experienced in Analytics. Resultingly, this leads to
confusion but helps to increase the popularity of analytical methods. In regard to this, a
label similar to “cognitive intelligence”, an invented term to describe the business version
of artificial intelligence (Maissin et al., 2016), might be a plausible candidate for the next
label. In short, Business Intelligence is currently understood to comprise methods of
manually and experience- or intuition-driven analysis of structured data, mostly from data
warehouses, vulnerable to human bias and with less advanced methods. Analytics is
understood as comprising more advanced methods on structured data resulting in model-
and algorithm-driven insight relying on human intuition and experience to a lesser degree.
Data Science was understood by interviewees to refer to the most complex and advanced
analytical methods (machine learning, advanced statistics) supposedly minimizing human
bias and applied to unstructured data as well, often with a more experimentation and
proof-of-concept focus as opposed to driving business decision-making.
Four Analytics roles were extracted, which are justified to exist in parallel in an
organization. First, business users use embedded analytical functions from software
accessible to them. Second, controllers aggregate and group data and numbers and must
assure correctness of data for the purpose of reporting higher management as well as legal
authorities. Third, business analysts are business function-specific analysts familiar to
some advanced methods for structured data in terms of purpose and application with the
intend to produce consumable insights for management or other non-analysts. Fourth,
data scientists are application developers with a full range of knowledge about methods
and tools at hand, from simple methods in graphical user interfaces to advanced methods
applied “at the command line”, who have deep technical and analytical knowledge and

57
Map
of
Do
main
-sp
ecif
ics
of
An
aly
tics
Init
iati
ves
Ex
tra-o
rgan
izati
on
al
cau
sal co
nd
itio
n
infl
ue
ncin
g p
roce
sses
▪D
evelo
pm
ent
of
data
Analy
tics
term
s▪
Hype-l
evel
of
Analy
tics
▪P
ain
Poin
ts▪
Regula
tions
Intr
a-p
roce
ssu
al cau
sal
co
nd
itio
n in
flu
en
cin
g I
nit
iati
ves
▪S
tate
of
pro
gre
ssio
n
An
aly
tical
Acti
on
s in
In
itia
tiv
es
▪D
esc
riptive A
naly
tics
▪P
redic
tive A
naly
tics
▪P
resc
riptive A
naly
tics
(Aim
ed
) C
on
seq
uen
ces
of
Init
iati
ve
s
▪F
inancia
l obje
ctive
▪A
ccura
cy o
bje
ctive
▪E
ffic
iency o
bje
ctive
Org
an
izati
on
al
co
nte
xt
co
nd
itio
n fo
r In
itia
tiv
es
▪B
udget
▪T
op M
anagem
ent su
pport
An
aly
tics I
nit
iati
ves
life
cycle
Acti
on
s
▪O
pera
tionaliz
ation
▪M
ain
tenance o
f S
olu
tion
Th
e c
on
cep
t o
f A
naly
tics
▪D
egre
es
of
Analy
tics
▪D
ata
Analy
tics
Role
s
Ap
pli
cati
on
co
nte
xt
co
nd
itio
n fo
r
Init
iati
ve
s
▪pro
ble
m-s
olv
ing
appro
ach
▪S
elf
-Serv
ice A
naly
tics
▪D
ata
abundance
Intr
a-o
rgan
izati
on
al
cau
sal co
nd
itio
n
infl
ue
ncin
g p
roce
sses
▪D
ata
dri
ven C
ulture
▪P
rior
Know
ledge o
n
Analy
tics
Org
an
izati
on
al
inte
rve
nin
g
co
nd
itio
ns o
n I
nit
iati
ves
▪C
ross
ing f
unctional
boundari
es
▪D
ata
ow
ners
hip
iss
ues
▪D
ata
securi
ty I
ssues
Ap
pli
cati
on
(p
roce
ssu
al)
in
terv
en
ing
co
nd
itio
ns o
n I
nit
iati
ves
▪In
here
nt A
naly
tics
Use
Case
s
▪in
here
nt
Analy
tics
pro
cess
es
and m
eth
ods
▪D
ata
short
age
▪D
ata
qualit
y I
ssues
▪H
ete
rogeneity o
f use
d d
ata
▪U
sing e
xte
rnal d
ata
▪U
sing m
obile
senso
r data
Ap
pli
cati
on
(te
ch
nic
al)
inte
rve
nin
g c
on
dit
ion
s o
n
Init
iati
ve
s
▪In
tegra
ted s
yst
em
s la
ndsc
ape
▪S
tandard
s fo
r data
exchange
Cau
sal co
nd
itio
ns
Co
nte
xt
con
dit
ions
Inte
rven
ing
co
nd
itio
ns
Acti
on
s
Co
nseq
uen
ces
Figure 11: Map of domain-specific aspects of Analytics initiatives
58
skills and try to stay up to date on methods. Their jack-of-all-trades-image was rejected
in the interviews and they were rather criticized for their tendency to produce non-
consumable results for non-analysts and to develop applications, which are not scalable,
reinvent existing concepts and do not address business needs.
3.4.1.2 Causal conditions
Causal conditions represent sets of characteristics influencing other characteristics and
conditions that explain why persons, or organizations, respond as they do (Strauss and
Corbin, 1998). Due to the interviews, three sets have been identified: extra-organizational
causal conditions, intra-organizational causal conditions and conditions influencing
Analytics processes in an organization and subsequently the Analytics initiatives.
The first characteristic of extra-organizational causal conditions is the mentioned
patterns of development of data Analytics terms leading to new taxonomy about “every
5-7 years or so”. The new and unheard-of concepts usually highlight aspects that were
already used to a lesser degree in previous iterations. These changes mobilize new groups
to use Analytics or existing user groups to identify new use cases domains differently.
Second, as infamously represented by the Gartner hype-cycle, technologies and concepts
undergo cycles of temporary publicity, leading to changing Hype-levels of Analytics.
This results in an eruption of projects to create benefits from data in a sort of “gold rush
atmosphere” with exaggerated expectations on profitability and ease of applying
Analytics. At the moment of this study, organizations are eager to create Analytics
subsidiaries (e.g., Data Labs, Data Factories) with high top management attention, fast to
perish if they fail. This kind of adoption based on momentum of other adopters and
success stories is also termed bandwagon behavior, which can lead to a mindless adoption
as opposed to mindful and thus wary and appropriate to the organization (Fiol and
O’Connor, 2003; Swanson and Ramiller, 2004), with domains displaying this behavior in
different degrees. Third, interviewees described the rather abstract phenomenon of
external pain points that create different stimulus to interest and need for Analytics in
different domain. This characteristic was retained as vivo code (Strauss and Corbin, 1998)
to express the recurring inability of interviewees to explain it more tangible. This pain
point could be something like competitive pressure, reducing environmental impact,
regulations or customers demanding Analytics solutions. Forth, a specifically mentioned
external stimulus to use Analytics are regulations. The regulatory demand to report
various aspects of organizational operations and actions is a strong motivation to deploy
59
Analytics, especially if future prognoses are demanded such as for the banking domain to
avoid market crashes and monetary devaluation.
For intra-organizational causal conditions, one characteristic with different impact in
different domains is the data-driven culture, which supposedly has a plethora of effects
on the application of Analytics in organizations, as discussed by scholars (Holsapple et
al., 2014; Kiron et al., 2012; McAfee and Brynjolfsson, 2012). This culture positively
influences the cooperation of users and experts within Analytics initiatives, and
acceptance and use of the Analytics solution but requires sufficient change management.
Otherwise users show unwillingness and devalue solutions (“this is a one-time effect”,
“data have been flawed and antiquated”). Another characteristic of this causal condition
is the prior knowledge on Analytics. This prior knowledge paves the way for the
application of Analytics, collaborative initiatives and the use cases that can be addressed.
However, interviewees highlighted the background knowledge being less important than
the willingness and interest to achieve a successful improvement of processes using
Analytics. But this motivation is often dependent on knowledge.
Finally, the causal conditions above influence the intra-processual causal condition,
represented by the characteristic of state of progression of Analytics. This characteristic
refers to maturity, advancement of use cases and adoption rate, that differs across
domains.
3.4.1.3 Context conditions
Context conditions describe conditions originating in causal conditions and creating
circumstances and issues for Analytics initiatives to which people respond to through
actions and interactions (Strauss and Corbin, 1998). In contrast, intervening conditions
moderate the effect of causal conditions. The identified context conditions have been
grouped into conditions concerning organizational processes and conditions concerning
the application of Analytics.
Regarding organizational context conditions, the first identified characteristic is budget
to execute Analytics initiatives, which might be additionally allocated, reallocated from
IT or not allocated at all. It can be allocated goal oriented to create innovations or
“halfhearted” by hiring “some Data Scientists” without any ideas for use cases due to
hype. In contrast different behavior of domains in the past, organizations across domains
are currently allocating budgets into Analytics in magnitudes surprising and unseen by
the interviewees, while organizations without financial means wait for technology
60
providers to develop applicable solutions. Second, long-term value from Analytics
requires strategic Top Management support, as discussed by scholars (Davenport and
Harris, 2007). Interviewees explained strategic vision easily lacking in either IT and
business units, with the former prioritizing technical specifications and standardization
over functionality and displaying protectionism, and the latter being stuck in daily
business or concerned about increased workload. Top management support is required
for a goal-oriented course of actions with Analytics, encourage change and create
visibility of the value of Analytics – a value that is recognized differently across domains.
An interviewee described: "if nobody recognizes the value of an initiative, it will not have
success".
Concerning application context conditions, it must be recognized that Analytics has low
sole standing self-purpose and requires a problem-solving approach to address business
problems or cases – “something with a user story behind” – at the core of initiatives, as
emphasized by scholars (Herden and Bunzel, 2018). The problem needs to be clearly
defined and its solution promise valuable returns, whether for data aggregation of reports
or for strategic enterprise-wide analytics initiatives. This business problem was expressed
to be more relevant than superior algorithms or models, with timely available solutions
“put on the road" being more valuable than non-deployable and delayed superior
algorithms. This problem-solving approach proliferates with increasing experience with
Analytics but organizations across domains are still performing Analytics initiatives
without a problem. These are unlikely to address business needs and result in abandoned
pilots, undeployed solutions, or missing users for deployed solutions. A second
characteristic and a strategy to ensure to address business problem is to give business
users means to apply Analytics by themselves – so called self-service Analytics.
However, this requires users’ abilities to apply quantitative methods, while access to data
and tools must be provided with only some domains putting it to the test. Third, due to
the promised value from data and the technological ease of data collection, organizations
across domains experience a data abundance leveling the varying data access in the past.
This does not imply access to all the data required for their initiatives. Organizations
collect and store data without a specific purpose to harvest the value at a later point in
time, while the number of data sources increases constantly, and collection is becoming
cheaper. Consequently, they try to harvest value from data forcefully while contradicting
the problem-solving approach with sporadic success.
61
3.4.1.4 Intervening conditions
Intervening conditions mitigate or alter the impact of causal conditions on Analytics
initiatives and are responded by actions (Strauss and Corbin, 1998). They contrast context
conditions, which are triggered by causal conditions. The identified intervening
conditions were grouped into organizational conditions, conditions concerning the
process of executing Analytics initiatives and conditions concerning the required
technologies.
The first organizational intervening condition was mostly recognized as specific to the
LSCM domain, which is the crossing of functional boundaries. The characteristic
describes data being collected, stored and owned by partners and Analytics solutions
required to be deployed across boundaries to these partners as well. However, boundaries
can already occur in the same organization between business functions, which are rarely
crossed in some domains. A closely linked second characteristic is data ownership issues.
Thereby, as opposed to the previous characteristic data owners with no business
relationship are considered, which possess relevant data. Data collected by a third party
or using a technology of a third party is often owned by that third party resulting in
additional agreements. These are increasingly used in some domains as source of revenue
– “most data owners have recognized the revenue potential by now” – and increase the
cost of Analytics initiatives. Unwillingness of this third party can further prevent access
to necessary data for an initiative. This issue is interrupting organizations across all
domains, but interviewees suggested that organizations could accept Analytics solutions
from data owners instead, while saving resources by buying (decision-ready) insights.
Third, the characteristic of data security issues is usually a major concern in domains with
highly sensitive data required to protect privacy of individuals. This induces steps to limit
access to data or to anonymize them complicating their use in analytical methods and
demands additional infrastructure in hardware and software to increase protection against
unauthorized access.
The category of application (processual) intervening conditions is the largest. The first
characteristic, interviewees unanimously agreed upon to be the main and most tangible
distinction coming differentiator of domains, is the inherent Analytics use cases. This is
self-evident, since the business tasks, processes, objectives, roles, people filling the roles,
their knowledge and their vocabulary are different. Thus, metrics, data, and requirements
of Analytics Solutions are different resulting in various use cases inherent to every
62
domain. However, some use cases recur in numerous domains. Second, interviewees
agreed unanimously upon the lack of domain inherent Analytics processes and methods.
Analytics is characterized by the transferability to any domain. This includes the process
of executing initiatives, the process management techniques and, in particular, the “very
transferable" analytical methods. However, choice and adjustments of a methods are
dependent on the specific use case resulting in some methods being used more often in
certain domains. Third, while there is some abundance of data as explained above, for
certain problems and use cases a shortage of data can occur in some domains, since not
everything interesting is currently collected or collectable. The required data collection
technology may not exist or is not available for a reasonable resource commitment. Thus,
the development of a technology or its reduced price can spontaneously enable a range of
organizations to execute certain initiatives such was with internet-of-things (IoT) sensor
data as discussed below. Fourth and closely linked to data shortage are data quality issues,
which have been indicated as cross domain issues (Hazen et al., 2017) but to varying
degrees in different domains. They result from false entries, missing entries, conflicting
entries and unstandardized data entries and prevent integrated analysis and more complex
Analytics initiatives, which can even occur in the same organization. Hence, resources
are redirected from Analytics initiatives to initiatives to integrate data. Fifth, as discussed
above, for complex analytical approaches, usually several data sources must be combined
crossing boundaries of organizations, business units or process steps leading to issues
with heterogeneity of data as a characteristic. Even comparable processes may entail
different machines or different people in charge of processes and, thus, create differences
in data (e.g., data collection frequency, data availability, data structure, or data
granularity). As a result, integration binds resources otherwise used for insight generation
in some domains. Sixth, a contemporary stimulus for adopting Analytics is the use of
external data, due to wide applicability and increased availability. One interviewee
explained that “as of now, using external data is common sense” and most domains use
them for improved results (e.g., for LSCM, data on infrastructure, weather, traffic, natural
disasters, political conditions, and regional customer characteristics and preferences).
Finally, the use of mobile sensor data has increased due to advances in their technology
and especially integrability and remote data access ability. In particular, the characteristic
is becoming quite relevant in some domains, and resultingly distinguishing it from other
domains, due to IoT sensor devices, transmitting data via GSM or other mobile signals.
These sensors create access to new kinds of mobile data (e.g., ambience, vibration,
63
brightness, sound level, movement, image-based condition, position), while data becomes
available in a higher granularity and frequency.
Concerning application (technical) intervening conditions, some domains experience
issues in these conditions that increase the impact of issues discussed in previous
categories. The first technological characteristic altering organizations ability to apply
Analytics is an integrated systems landscape, which enhances Analytics if present and
obstructs otherwise. The replacement of outdated systems, which lack the performance
of modern systems, can be too great of a risk for organizations dependent on these
systems’ functionalities and worrying about losing them. System landscapes grow
naturally and so are their data structures resulting in established organizations losing
overview of their systems in terms of functionality and operating method as well as in
inappropriate or missing updates to the systems. Once deliberately employed tailored and
task-specific systems lack scalability and integrability in focus of today’s systems
landscapes and, nowadays, the effort of orchestrating these systems is challenging and
resource consuming. Start-ups and younger organizations are usually spared from these
challenges but most organizations in established domains cope with them and must
redesign their systems landscape. A second prominent characteristic that creates
challenges for organizations in execution of Analytics initiatives is standards for data
exchange. Internal data exchange standards are averted from legacy systems in the
systems landscape or overturned by merger and acquisition. Externally, some domains
developed standards for certain data exchange processes such as the EDI (Electronic Data
Interchange) standard, but these are usually barely sufficient for Analytics requirements.
The currently used interface landscape created to enable data exchange is argued by
interviewees to be sufficient for current needs and the development of a standard would
lack a necessary authority such that scholars’ demand for a common shared understanding
on the definition of standards and interfaces (Kache and Seuring, 2017) might not be met
any time soon.
3.4.1.5 Actions
Actions represent strategies devised to manage, handle, carry out or respond to conditions
(Strauss and Corbin, 1998). Thus, the analytical actions identified in this study are
initiated or altered by the various identified causal, context and intervening conditions.
Distinguished are Analytical actions in initiatives that represent the use cases of analytical
methods and actions related to the lifecycle of Analytics initiatives.
64
In accordance with a widely recognized perspective, the analytical actions in initiatives
are distinguished in Descriptive, Predictive and Prescriptive (Holsapple et al., 2014;
Souza, 2014; Wang et al., 2016), which were explained by interviewees to represent
complexity levels but only to a limited extent. All approaches employ (relatively) simple
and complex methods and initiatives usually demand the combinations of different
approaches. Regarding the first approach of Descriptive Analytics, the methods are
predominantly less analytically complex with rule-based data aggregation analysis.
However, they can become technically complex when several heterogeneous data sources
are supposed to become integrated. Currently, interviewees experience high demand for
such initiatives from organizations in some domains attempting to create “a single version
of truth” of their complex operations in likewise complex organizational structures, which
are not manageable by intuition anymore and require data-driven decisions and control.
The created insight embodied in reports, key performance indicators and dashboards is
usually post-operational and provides transparency and visibility of the status of the daily
business, mismatches of results to expectations, weak spots, benchmarks for different
decisions, and needs for actions – not necessarily which actions. It was credited as “good
entry level Analytics approach” by interviewees but creates meaningful insight,
nonetheless. The second characteristic, or rather approach, is predictive Analytics, which
is currently broadly requested across domains, while some domains took time to catch
on. Famous due to demand forecasting, predictive Analytics provides use cases for most
domains, while it is deployed in higher or lower analytical complexity. Third, prescriptive
Analytics mostly consists of the application of optimization methods. While more
complex optimization use cases are concentrated to few domains, the methods are
generally used in most domains. Further, the applied methods are used sometimes applied
to simpler repetitive problems and as such provided as features to software tools without
further individualization leaving potential for improvement.
Regarding the lifecycle actions, the identified characteristics concern the benefits of
analytics initiatives in the short and long term and issues in these characteristics can
eradicate any productive activities in the previous steps of the initiative. First, a currently
major issue in many domains is the operationalization, the so-called deployment, of
Analytics solutions. There is a shift towards providing more Analytics solutions directly
into operational processes to improve decision-making at the operational level instead of
the managerial level only. The insights are used faster and the users at that level work
65
naturally with insights since it is based on their tasks and decisions. Further, they are
incentivized to collect and insert data more carefully because they get better insights or
better processes in return. However, this phase is prone to be underestimated in planning
of the initiative, and challenges, overlooked user requirements and the heavy resource
consumption can result in abandoned pilots. Second and similar, the subsequent
maintenance of developed Analytics solutions, such as algorithms and models, is
supposed to ensure correctness, adaption to the process, persistence of accuracy or
adjustment to new patterns in newer data. As scholars indicated, this requires a continuous
monitoring and evaluation of even proven useful analytics solution (Leventhal, 2015).
However, while users are familiar with updates for software, maintenance of Analytics
solutions is in some domains alien to them that lack maturity in Analytics.
3.4.1.6 (Aimed) Consequences
Finally, consequences are the outcome of actions and as such the outcome of the
investigated Analytics initiatives. Corresponding to the research method, the
consequences below refer to intentions and aims.
The first and foremost aimed consequence is the characteristic of aspiring the financial
objective, whereby short-term costs savings and revenue increase must be distinguished.
Analytics tends to provide direct benefits (improving processes, increasing revenue),
which induce indirect monetary payoffs as cost savings. An initiative must be cost
effective in this indirect way, since it displays an investment that is supposed to create an
output higher valued than its input like any other investment. The financial objective,
which is pursued in some domains, stands outside of this cost-effectiveness and refers to
direct cost savings and increase revenue. However, interviewees usually addressed non-
monetary objectives. Second, one non-monetary objective is the accuracy objective
referring to the need for high accuracy of Analytics solutions due to criticality of business
processes. Criticality can result from domain-specifics such as possible harm (e.g.,
pharma, aeronautics), adherence to laws (e.g., taxes), or costs of inaccurate decisions
(e.g., consumption of low margins in retail). Consequentially, users must communicate
reasonable requirements on the accuracy, since it influences the dimensions of Analytics
initiatives. Third, another non-monetary objective is the efficiency objective regarding
processes by identifying and eradicating inefficiencies. This may concern the
identification of sources of lost time, insufficient quality, or waste and creation of
monitoring solutions that support control of these inefficiencies.
66
3.4.2 Specifics of the LSCM domain
LSCM shows several differences in the mapped characteristics in all components except
context conditions, which are discussed below. This implies benefits from domain-
specific research with extensive domain knowledge on the issues. However, the majority
of characteristics, not discussed below, represent characteristics of Analytics initiatives
that allow cross-domain research for improved approaches or to create measures to
overcome barriers.
3.4.2.1 Specifics in causal conditions
Interviewees attested a certain scarcity of pain points in LSCM leading to low perceived
external pressured to use Analytics as compared to other domains. Organizations in
LSCM are usually driven by the internal needs to handle and control the daily business
and operations motivating the use of Analytics if this control is perceived as
unsatisfactory. Customers may create an indirect stimulus by demanding more efficient
services, but only few customer requirements specifically demand Analytics and,
especially, few were reported to demand Analytics solutions beyond market available
solutions that necessitate Analytics maturity.
Considering regulations in particular, LSCM was also reported to have fewer and less
complex regulations, but still has to report things like journey times of drivers or
compliance to customs, taxation or customer requirements. Environmental regulations
were speculated to potentially increase the use of Analytics in LSCM but the current
influence of regulations on the state-of-adoption of Analytics in LSCM is low compared
to other domains.
Interviewees reported to perceive LSCM as more directed towards an intuition-driven
culture as opposed to a data-driven culture, which was, however, described in aspects to
comparable to a lock-in effect to solutions. LSCM is an early user of analytical methods
in certain processes and these solutions are trusted with hesitance to use other, allegedly
more advanced, methods. Thus, the culture is less data-driven relative to newer Analytics
approaches and the issue is one of change management.
Respondents experienced the people in LSCM, relative to other domains, as less
imaginative in the use of data, having a lower degree of experience in working with data
in comparison, and a higher need for explanation – having less prior knowledge.
Considering the range of activities in LSCM, the domain has an apparent demand for
67
workforce without the requirement for a formal education in statistics or higher
mathematics, while members of this workforce, on the condition of showing a satisfactory
performance and due to their “floor experience” (Rivera et al., 2016), can rise to
management positions. However, people in LSCM are perceived as interested (and proud)
in improving their processes and finding solutions for their problems leading to the
flexibility to test several solutions with a hands-on mentality. Thus, interviewees
observed two outcomes of this: if a solution has been found to which people have become
accustomed to, they are harder to convince to change course. otherwise, they are open to
new solution attempts including Analytics, but the problem to be solved is resultingly
intense.
Regarding the state of progression, LSCM is perceived to occupy a stable midfield
position. In contrast, other domains are perceived as more volatile – sometimes leading,
sometimes trailing. Respondents report to execute Analytics initiatives now in LSCM,
they have executed decades ago in domains like banking and telecommunications. This
current state was reflected to be caused by missing data and technology which is now
available and can give LSCM a momentous potential to catch up with some organizations
already exploiting the potential. However, this potential requires interest or pain points to
become exploited.
3.4.2.2 Specifics in intervening conditions
In accordance with the foundational idea of LSCM of creating a conjunction between
different actors to transform raw material and distribute resulting products to consumers,
LSCM organizations have a substantial number of links to customers, suppliers, service
providers, other business units and other partners. Thus, LSCM constantly crosses
internal and external functional boundaries on physical processes and would greatly
benefit from doing so an Analytics initiatives in a more natural way as compared to other
domains (e.g., new business models between wearable technology providers and
insurance organizations). However, issues arise from data collection or distribution of
Analytics Solutions crossing functional boundaries. First, due to global distribution of
partners and organizational distance, a different need for collecting or exchanging data is
perceived or resulting transparency is feared as loss of power and influence, even in the
same organization. Second, cultures differ in attitudes towards collecting and exchanging
data. Third, technological infrastructure and systems differ complicating data exchange.
The organizational distance increases further with requests for data exchange cascading
68
to organizations with indirect business relationships (partners of partners). In reverse,
insights from Analytics solutions might be necessary for partners leading to deployment
across functional boundaries. This increases scalability and adaptability requirements of
the solution, which increase development time and reduce the interest of solution
sponsors unwilling to pay for benefits outside their area of responsibility. Lastly, due to
limited contract duration, exchange of partners and changing customer preferences, the
Supply Chain network is in constant motion such that cross functional Analytics may
have a short durability.
In contrast, interviewees did not observe demanding requirements in terms of data
security in LSCM, since for most use cases organizational assets and processes are
analyzed as opposed to individuals. Of course, customer preferences analyzed for demand
prediction entail privacy concerns, but such concerns are far more regular in other
domains.
This study further specifically inquired data quality issues, since scholars indicated the
considerable impact of human data collection errors (Wang et al., 2014). This has been
confirmed by some interviewees but was evaluated as minor component of the data
quality issue and its effect comparable to any domains. Further, data collection is
increasingly becoming automated such that this impact is erased in the long run.
In conformance to the crossing of organizational boundaries, the heterogeneity of data is
natural to LSCM as well, coming from diverse business functions and partners. In LSCM,
this binds resources for creating interfaces such that interfaces are created to partners with
reasonable importance and longer expected partnership lifetime. Put differently, the effort
is not invested for every partner hindering potentially interesting initiatives.
Finally, LSCM is a favorable candidate to use mobile sensor data and has an affinity for
using it from mobile assets (e.g., ships, trucks, airplanes, trains, elevators, manufacturing
machines) and shipments (e.g., containers, packages, work-in-process). This innovative
technology represents a paradigm shift in LSCM from collecting event-based data at
stationary points to a constant monitoring, which provides value by reduced reaction time
on incidents. The integration of IoT data is complex and creates large effort in wide scale
implementations but is already technologically manageable. Hence, organizations are still
pioneering with the technology such as a few LSCM organizations that start to monitor
and control their, ideally, permanently moving goods and assets such as in real-time status
visualization. However, organizations struggle with initiatives to extract higher forms of
69
insights and few attempt more complex use cases like ETA-Prognosis, (dynamic) route
optimization, and incident-based product allocation or product reordering. Other domains
certainly have use cases for this technology, which are, however, less apparent.
3.4.2.3 Specifics in actions
Since it is strongly related to the use cases, LSCM shows clear domain-specifics in the
differentiating characteristics. Regarding descriptive Analytics, LSCM shows an above-
average demand for aggregated data from widely dispersed data sources, including IoT,
in real-time such that operational processes can be fine-tuned and adjusted based on the
most appropriate decision to even complex issues, if necessary. LSCM operations have
been streamlined and usually include few buffers, which demand precise real-time data
to react to short term incidents and changes. Resultingly, current Descriptive Analytics
problems in LSCM display high technical complexity, while some remain to have aspired
solutions but not achieved them.
Regarding Predictive Analytics, LSCM was indicated to trail behind other domains.
While scholars (Waller and Fawcett, 2013) have emphasized the potential of use cases
such as forecasting of demand, delivery time or customer behavior, interviewees barely
experienced these use cases from LSCM. They observed that these use cases are either
on the long-term agenda due to missing data or are inputs for Prescriptive Analytics,
whereby the development focus is on the Prescriptive part with acceptance for standard
solutions for the Predictive part (e.g., predictive maintenance of assets focused on
resource efficient repairs scheduled into operations).
For the Prescriptive Analytics part, interviewees perceive an extraordinarily position of
LSCM, since there is a natural association between Prescriptive Analytics methods and
LSCM optimization problems, which “are so beautifully tangible”. LSCM has complex
planning problems of goods and assets to be allocated or moved through the network
against its capacities. However, it was also observed that these problems are solved with
standard features of some software, which are not further individualized and leave high
potentials for improvement. Interviewees described further aspects of complexity. First,
LSCM is eager to exploit Prescriptive Analytics solutions for identification of alternatives
and impact of what-if scenarios to develop superior reactions in beforehand, including
dynamic adjustments of operations, which were already initiated according to the
previously optimal solutions, to situational changes with as little effort as possible.
Second, LSCM problems tend to be more complex due to characteristics of problems and
70
numerous restrictions, which additionally change along the supply chain. As scholars
noted, the idea of holistically optimized efficient networks leads to optimization problems
in LSCM getting very large very fast (Blackburn et al., 2015).
Considering the maintenance of Analytics solutions, some domains experience an
extensive need for adjustments and verification due to fast degrading model quality or
high impact of small degradation. In contrast, domains like LSCM with high efforts for
data collection or deployment of updates tend to maintain solutions less frequently.
LSCM was perceived by interviewees to have low need for maintenance, favoring the
complete replacement of solutions in the long run.
3.4.2.4 Specifics in consequences
Interviewees indicated less demands regarding accuracy from LSCM. They have
observed that certain decision-making processes are often well-supported by tendencies.
LSCM was observed to focus particularly on the efficiency objective, what overlaps with
the extensive development of tools to increase efficiency (e.g., lean, continuous
improvement). Respondents emphasized that results from Analytics solution in LSCM
usually lead to decisions on physical operations, of which the resource consumptions is
supposed to be minimized.
3.5 Conclusion and directions for further Research
Research on Analytics is often limited to one domain, while it is a transferable tool that
can benefit from cross-domain development efforts. To identify promising aspects of
Analytics to cooperate research on, characteristics to set domain-specific and independent
issues apart are necessary but have not yet been provided by research. This study has
investigated these characteristics and identified specifications of the LSCM domain based
on Grounded Theory. The derived map displays a theoretical model of characteristics
potentially differentiating domains principally, contemporary or have in the past. This
map displays antecedents influencing procedure and success of Analytics initiatives and
can guide Analysts and managers for prioritization of issues.
3.5.1 Theoretical Implications
Relating to the purpose of this research, the main contribution are the characteristics of
Analytics initiatives, their connection – their mapping – and their use to differentiate
LSCM from other domains executing Analytics initiatives. The map provided by this
research distinguishes the characteristics in different conditions, actions and

71
consequences. The mapping of characteristics provides explanatory value on differences
of Analytics initiatives’ success and performance far beyond the Analytics method and
approaches itself.
This research adds to the limited literature on the effect of the domain on Analytics
initiatives and provides an extensive overview on effects contributing to procedure,
success, and users attitude towards it, and therefore characterize an initiative. These
characteristics can be used for further quantitative research on issues of Analytics.
Concerning the LSCM literature, the theoretical model emerging from this research
provides antecedents of Supply Chain Analytics. It emphasizes the potential of the LSCM
domain to advance in Analytics due to recent technological progress enabling further use
cases which should be supported and monitored by research efforts. In particular, research
is needed on the exploitation of IoT data and the individualization of prescriptive
Analytics solutions. For both, research is required to simplify the adoption of the results
for organizations. Further research is required to facilitate change management towards
more advanced analytical methods and presentation of benefits from Analytics.
This research also highlights organizations coping with issues far off from the
consideration of research. Easily said recommendations to advance in Analytics, such as
standardization and investments in IT, pose major challenges for organizations with
implications and issues unconsidered by research. Thus, by highlighting the complexity
of Analytics with this research embodied in the variety of mapped characteristics,
research shall be cautioned not to bypass the practitioners needs.
Concluding, this study provides a novel approach to understand the execution and success
of Analytics initiatives and provides a multitude of new areas demanding deeper
investigation and further research. Thus, this research makes a valuable contribution to
the LSCM and Analytics literature.
3.5.2 Managerial Implications
This research accumulates a vast number of recommended actions and behavior for
managers executing Analytics initiatives. Before starting an initiative, managers should
identify technical and organizational challenges and prerequisites on the map of
characteristics to avoid later issues. Managers should further avoid hype-triggered
initiatives but rather create well-thought initiatives comprised of a valuable problem to
be solved, a potential user meaningfully contributing to the solution’s development, a
72
sense for the user story of the solution providing implications for the deployment, and
maintenance needs for long-term performance persistence. To gain the users help, trust
and willingness to use the solution, managers must create visibility of the initiative’s
value. Users must make sure to state their needed degree of accuracy or quality of
solutions in order to induce the right effort. Based on the map of characteristics provided
by this research, managers can grasp the big picture of an initiative and understand
success factors, potential hazards, and key areas to monitor such that corrective actions
can be taken.
While these implications are verbalized towards the manager executing the initiative,
there are characteristics which are hard for him to reach and get information about. Thus,
any member of an initiative’s project team is encouraged for awareness of characteristics
on the map and to point out potential fallacies. This emphasizes the necessity of domain
knowledge in Analytics initiatives and the immediacy to assure knowledge exchange
between Analytics and domain experts.
In addition, this research raises attention to the complexity of Analytics, which cannot be
mastered by “hiring some data scientists”. Further, while Analytics initiatives require
short organizational distance between Analytics experts and application domains of
solutions, they may not require collecting all data from partners if Analytics solutions can
be collected instead. Collaboration of this kind, and the sharing of own Analytics results
with partners might induce benefits such as the partners recognizing the value of sharing
such information.
Finally, challenges and issues reappear across domains since many organizations are
currently working on similar topics. Managers might consider innovation collaborations
and mutual assistance on Analytics across domains with non-competing organizations,
which can also induce new use cases. In particular, LSCM managers should explore
collaborative use cases beyond operational efficiency, which could facilitate new
business models and new sources of revenue.
3.5.3 Future research and Limitations
This research provides potential for future research to validate the model – the map of
characteristics – with quantitative methods to get more accurate insights on the domains’
conditions. In accordance to that, other domains could be investigated for their
specifications of the characteristics.
73
Further research demands arise from the specific characteristics. For example, the need
for accuracy in Analytics models and algorithms and factors influencing this need could
be studied further for break-even points of investment versus utility. This research could
help managers to make better decisions by avoiding too high accuracy without utility
from it but immense resource consumption or, in reverse, too little accuracy with serious
consequences. Further, if hype and pain points release budget in larger organizations,
research is needed on how to support organizations with limited budget such as small and
medium sized organizations. If these organizations perish due to their limited investment
potential, competition is sustainably altered. Additional research potential lies in
overcoming the barriers such as changing to a data-driven culture, non-integrated IT
landscape, or unwillingness for data exchange between partners.
Further, this research has limitations. The deployed method of semi-structured interviews
results in the theoretical model being subject to the individual experience of the
interviewees and the initiatives they individually conducted and took part in. While this
study has been limited to the perception of saturation and its results should thus be
generalizable, a larger sample size could allow stronger conclusions. The diversity of
interviewees could further be increased in two manners. First, the study included
interviewees from Germany and the USA. While the characteristics are expected to be
similar globally, interviewees from more countries could become involved. Second, this
study intentionally covers an informed outside view on several domains by inquiring Data
Analytics Companies but thus excludes the domain insight view, which experts avoid to
share due to inability to compare their domain to others.

74
Accepted version. Published as: Herden, T.T., Bunzel, S. (2018). Archetypes of Supply Chain Analytics
Initiatives—An Exploratory Study. Logistics, 2(2), 10. https://doi.org/10.3390/logistics2020010
(published by MDPI, CC BY 4.0)
75
4 Archetypes of Supply Chain Analytics Initiatives – an exploratory study
While Big Data and Analytics are arguably rising stars of competitive advantage, their
application is often presented and investigated as an overall approach. A plethora of
methods and technologies combined with a variety of objectives creates a barrier for
managers to decide how to act, while researchers investigating the impact of Analytics
oftentimes neglect this complexity when generalizing their results. Based on a cluster
analysis applied to 46 case studies of Supply Chain Analytics (SCA) we propose 6
archetypes of Initiatives in SCA to provide orientation for managers as means to
overcome barriers and build competitive advantage. Further, the derived archetypes
present a distinction of SCA for researchers seeking to investigate the effects of SCA on
organizational performance.
4.1 Introduction
Even before data got their mainstream reputation of being the “new oil” of the 21st century
predestined to shape the digital economy (Keen, 2012), the potential competitive
advantages through data analytics had already been recognized (Davenport and Harris,
2007). To remain with this analogy, data analytics represents the refinery process turning
raw data into competitive strength. Analytics in itself is not a leading-edge invention, but
increased attention was recently triggered by developments in information technology
(IT) providing new access to data, organizations’ need for better and faster decision-
making and recent big data and machine learning tools enabling new levels of insight for
decision makers (Cao et al., 2015). The field of Logistics and Supply Chain Management
(LSCM), has been identified as one early adopter and a long-term user of Analytics
(Davenport, 2009). LSCM has been employing operations research approaches for
decades und uses purpose-specific analytics tools for very particular problems. As it is
concerned with effectively integrating suppliers, manufacturers, warehouses, and stores,
such that merchandise will be produced and distributed to the customer with a satisfying
service level and with minimal costs in the right manner concerning time, location and
quantity (Simchi-Levi et al., 2003), the necessity for analytical approaches to achieve
these efficiency goals is inevitable. A recent industry report underlines the long-term data
affinity of the LSCM sector from a practical point of view and the potential of logistics
operations generating the amounts of data needed to create value by using Analytics
76
(Jeske et al., 2013). However, the report emphasizes untapped potential in improving
operational efficiency, customer experience or creating new business models in the
sector. The fit of LSCM and Analytics is favorable since the satisfaction of customer
needs and requirements is a leading theme in LSCM (Christopher, 2011, p. 12) and the
meaningful insight provided by Analytics is used to ensure rules and workflows
strengthening satisfaction of needs and requirements (Bose, 2009).
Scholars and practitioners alike have provided evidence that advantages to performance
can be achieved from the domain specific use of Analytics, which was termed “Supply
Chain Analytics” (Holsapple et al., 2014; Souza, 2014). In research, several authors have
investigated the effects of Supply Chain Analytics. Information system supported
Analytics capabilities have been indicated to improve LSCM performance (2010) and
Analytics tends to have a positive impact on LSCM performance with high dependency
on the fit of Analytics investment and LSCM process maturity (2012). The positive effect
of Analytics on LSCM was further suggested as context contingent, especially on
planning processes (2014). Schoenherr and Speier-Pero (2015) provide a wide variety of
perceived benefits including improved supply chain efficiency and decreased supply
chain costs. Furthermore, several scholars call for more research on the topic (Waller and
Fawcett, 2013; Wang et al., 2016).
On the practitioners’ side, industry reports have shown high expectations towards
Analytics in LSCM, especially for reducing inventory, risk and improving batch sizes.
Among others, better customer service, higher efficiency and faster reaction to supply
chain issues based on investments in Analytics have been reported (Pearson et al., 2014).
Furthermore, the development of more customer-oriented value chains with lower
logistics costs due to the rise of data and Analytics has been suggested (Opher et al.,
2016). However, investments are somewhat reluctant (Schmidt et al., 2015) and industry
reports show that only a few firms achieve excellent performance in Analytics concerning
LSCM (Marchese and Dollar, 2015). The majority of firms are lagging or struggling with
Analytics in LSCM (Thieullent et al., 2016) with managers reporting missing experience
and lack of knowledge on how to apply Analytics (Ransbotham et al., 2016).
In the studies summarized above, Analytics is customarily considered as one overall
concept while making conclusions on it or deriving potential value and utility although
single examples with individual issues and diverse analytical techniques are considered.
Especially single examples are used to highlight Analytics providing benefits (Trkman et
77
al., 2010) or savings (Thieullent et al., 2016) thereby projecting the exemplary benefits
to Analytics as a general concept or overall approach. What remains unknown are the
different outcomes of different approaches in relation to their intentions and execution.
Analytics is usually not subdivided further although it presents a wide field with different
objectives, orientations, and perspectives without a unified definition (Holsapple et al.,
2014). In our view, it is too wide of a field to assume that all reported effects can equally
be applied on different Supply Chain Analytics Initiatives, all Initiatives having the same
potential of providing value for an organization or all barriers appearing could be
overcome in a single manner. The sole attempt to subdivide Supply Chain Analytics in
extant research can be found in the framework for Analytics applications in LSCM (Hahn
and Packowski, 2015), which focuses on off-the-shelf IT Systems and therefore ignores
important aspects of Analytics as well as Initiatives which are not system-specific. To
derive more sophisticated and reliable research conclusions on the effects of Analytics on
LSCM, a distinction of Supply Chain Analytics approaches is needed. We propose a
distinction of how organizations apply Supply Chain Analytics, by using clustering on 46
case studies on Supply Chain Analytics Initiatives considering intended problem to be
solved, execution, techniques, and the resulting Analytics Solution. Thus, this research
investigates patterns in the activities of organizations applying Analytics to business
problems in LSCM and explores their endeavors and motivation to form archetypes of
Initiatives with exclusive characteristics. The outcome of the Initiatives as well as
alignment of outcome and intention is out of scope for research. Regarding MacInnis
Framework of conceptual contributions, the goal of this study is differentiation
(MacInnis, 2011). Thus, we will indicate how the identified archetypes are different, why
this differentiation matters, and how they can be used further. The study is based on
publications about manufacturing firms, retailers and logistics service providers applying
Analytics in LSCM. The research questions therefore states: How can Supply Chain
Analytics Initiatives be distinguished?
The obtained archetypes can provide guidance to managers for their individual issues,
and points of references of other organizations’ previous activities, and thus, reduces
barriers to adopt Supply Chain Analytics in their own organization. The archetypes
represent types that are designed to be most different from each other to support learning
of managers and students about Supply Chain Analytics. However, the combination of
characteristics of different archetypes in the creation phase of a new Initiative in an
78
organization is not relegated but rather encouraged with an individual and specific goal
and approach to be designed by the executing manager. For researchers, the archetypes
form a framework to investigate the different effects of varying approaches.
The remainder of the article is structured as follows: Section 2 provides a theoretical
background with the objective to explain the characteristics chosen to form the
archetypes. Section 3 presents the methodology on how archetypes are formed using
cluster analysis. Section 4 explains the suggested archetypes and discusses their impact.
Section 5 concludes the article and section 6 provides final remarks.
4.2 Theoretical Background
In this section, we will summarize Analytics, Supply Chain Analytics and characteristics
of Supply Chain Analytics Initiatives.
4.2.1 Analytics
Due to its novelty and evolving nature, a wide variety of definitions of Analytics exists.
Holsapple et al. (2014, p. 134) reviewed many of them to develop a collective definition
stating that Analytics is “concerned with evidence-based problem recognition and solving
that happen within the context of business situations”. This definition highlights two
specific aspects of Analytics. The first aspect, problem recognition, indicates the
experimental part of Analytics to achieve a goal which is uncertain and unclear in the
beginning requiring further exploration (Viaene and Bunder, 2011), and thus identifying
what the actual problem is. The second aspect, problem solving, indicates that the value
of Analytics is solely provided if a model or application is deployed and used (Viaene
and Bunder, 2011). This aspect of Analytics is emphasized prominently in the literature,
often specified as making decisions and taking actions (e.g., Barton and Court, 2012;
Bose, 2009; Chen et al., 2012; Davenport and Harris, 2007). Both aspects establish a clear
distinction from data aggregation Initiatives like dashboards and reports.
Davenport and Harris (2007) presented the benefits of applying Analytics to improve
internal processes or an organization’s competitive position. They illustrated that
achieving success with Analytics is not based on deploying software but rather on three
categories of factors: organizational, human and technological capabilities.
Organizational capabilities consider analytical objectives and processes, human
capabilities consider skills, sponsorship and culture, and technological capabilities
consider data availability and Analytics architecture. While the models and software are
79
often in the focus of research in Analytics due to apparent presentation of insight into the
specific opportunities of Analytics, scholars highlight all three stated capabilities as
critical to develop and successfully use models and software (Bose, 2009; Sanders, 2014).
The models and software used in Analytics are commonly distinguished as being
descriptive, predictive or prescriptive (e.g., Das, 2014; Hahn and Packowski, 2015;
Holsapple et al., 2014). The meaning of descriptive analytics is twofold. On the one hand,
it presents the summary of data to report and monitor (Hahn and Packowski, 2015). On
the other hand, it describes root cause analysis used to gain insights about the underlying
phenomenon or process (Provost and Fawcett, 2013; Spiess et al., 2014). Predictive
analytics estimates unknown values based on known examples. Prescriptive analytics
determines and, in some cases, subsequently automates actions or decisions to achieve an
objective given current and projected data, requirements and constraints.
Due to recent technological advances, Analytics gained additional interest as “Big Data
Analytics”, referring to Analytics performed with Big Data, which has been reported to
have a positive impact on firm performance (Akter et al., 2016). Big Data originates in
data management issues with technology in the early 2000s due to high volume, velocity
or variety of data (Laney, 2001), which formed the original three “V’s” of Big Data. Big
Data is momentarily under frequent academic investigation including an increase of
“V’s” (e.g., Akter et al., 2016; Fosso Wamba et al., 2015; Sivarajah et al., 2017)
considering several issues with Big Data beyond the aspects of data management and
without the need for advanced technologies like distributed storage and processing, like
Variability, Veracity, Visualization or Value. However, three “V’s” is a leading theme
(Chen et al., 2012; Dutta and Bose, 2015; Sanders, 2014; Schoenherr and Speier-Pero,
2015; Spiess et al., 2014; Waller and Fawcett, 2013; Wang et al., 2016).
4.2.2 Supply Chain Analytics
Similar to Analytics, no unified definition of Supply Chain Analytics (SCA) exists, while
rarely one is proposed. Souza (Souza, 2014, p. 595) describes it as “focus[ing] on the use
of information and analytical tools to make better decisions regarding material flows in
the supply chain”. Waller and Fawcett (Waller and Fawcett, 2013, p. 79) propose a
definition while describing the field as [L]SCM data science: “[…] is the application of
quantitative and qualitative methods from a variety of disciplines in combination with
[L]SCM theory to solve relevant [L]SCM problems and predict outcomes, taking into
account data quality and availability issues.” Incorporating aspects of both descriptions
80
and the definition of Analytics (Holsapple et al., 2014), we propose to define SCA as
follows: SCA is concerned with evidence-based problem recognition and solving within
the context of logistics and supply chain management situations.
Consequentially, SCA is neither a single and clear step-by-step approach to solve supply
chain problems nor limited to certain tasks and processes in LSCM. Souza (2014)
systemizes and distinguishes several techniques by the type of Analytics and the SCOR
processes affected. The origin of the list of techniques is not explained and it is not
exhaustive. Furthermore, another attempt on systemization results for an investigation on
in-memory technology used in LSCM by grouping in-memory software applications for
LSCM and designing a framework for analytical applications (2015). By considering the
type of Analytics applied, whether the concept is data driven or model driven and
methodological requirements, off-the-shelf software applications with analytical
capabilities used for LSCM functionalities were grouped into monitor-and-navigate,
sense-and-respond, predict-and-act, and plan-and-optimize. However, this categorization
ignores objectives, organizational aspects and human aspects. Finally, examples of
potential applications of Analytics in LSCM were summarized from the perspectives of
the user and the tasks (2013). In summary, scholars have stretched a wide range of
applications of SCA with various use cases for different functionalities and users,
providing evidence that SCA is too complex to evaluate its impact as a general concept.
The generalization has further impact on managers by creating barriers, which wewant to
address with this study. Thus, this research focuses on barriers related to a missing
understanding of how to apply SCA on individual problems of an organization and
substantiate relevant SCA Initiatives. Sanders (2014) provides an extensive overview on
barriers of Analytics in the context of LSCM and presents several barriers of which the
following are related to the interest of this research. First, managers, especially in
leadership positions, may not see the value provided by Analytics resulting in missing
vision, understanding of the full capacity and how to change the organization to apply
Analytics successfully. Second, so called analysis paralysis hinders organizations from
applying Analytics because they cannot handle the overwhelming opportunities, the
speed of technological change what results in the inability to define a starting point.
Organizations may thus try to randomly analyze data for some eventual causation, some
business units may optimize their sub processes with little global effect or organizations
try to measure everything at once without understanding what to focus on. Third, instead
81
of experiencing a lack of data, many organizations drown in data. Besides technological
issues to handle these amounts of data, organizations do not know how to leverage the
existing data capability and how to base decisions on it.
4.2.3 Dismantling Supply Chain Analytics Initiatives
This subsection describes the characteristics used to analyze SCA Initiatives to form
archetypes. We identified 34 characteristics in an extensive review of Analytics literature
which are presented in six categories. The characteristics and categories are presented in
Figure 12. Drawing on Chae et al. (2014), we consider SCA Initiatives as (one time)
projects aiming to achieve supply chain objectives using evidence-based problem solving
and recognition with a focus on inducing process redesign, tool development or long-term
process changes like automation or continuing decision support.
First, the reasoning behind any Initiative should be a shortcoming in a supply chain
objective (SCO). Either because there is a deficiency in comparison to the theoretic
potential or because higher performance is aspired. In the literature, several frameworks
of performance dimensions indicating supply chain objectives are proposed (Ambe, 2013;
Bowersox et al., 2007; Chan, 2003; Gunasekaran et al., 2004) without one being
unanimously accepted. Several operational metrics reappear in most frameworks we
investigated, but the categorization differs tremendously. The following objectives have
been elaborated based on a review of these frameworks: cost (SCO1), quality (SCO2),
time (SCO3), flexibility (SCO4), sustainability (SCO5), innovativeness (SCO6), customer
relationship (SCO7) and supplier reliability (SCO8).
Second, we return to the concept of core capabilities of an analytics competitor:
organization, humans, and technology. The organizational aspects can be represented by
the analytics objective (AO) of an analytics Initiative. In accordance with Manyinka et al.
(2011) and Holsapple et al. (2014) we identified six analytics objectives. Based on
evidence-based approaches these include the creation of transparency by democratizing
data (AO1), the identification of root causes by experimentation (AO2), the evaluation
of business performance and environment (e.g., efficiency or risk assessment) (AO3), the
segmentation of populations (including products and services) (AO4), the support and
replacement of human decision-making (AO5), and the development and innovation of
new sources of revenues (e.g., business models, products or services) (AO6). In a given
Initiative, the fulfilment of one objective can be necessary to pursue a consecutive
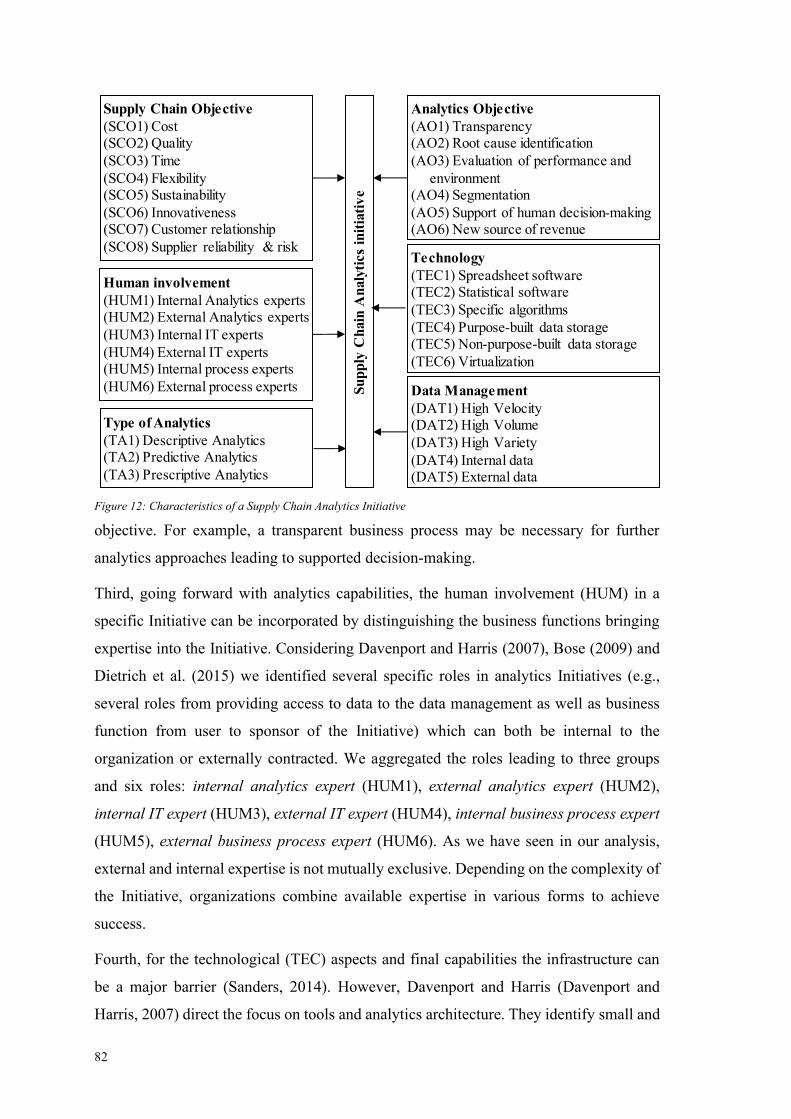
82
objective. For example, a transparent business process may be necessary for further
analytics approaches leading to supported decision-making.
Third, going forward with analytics capabilities, the human involvement (HUM) in a
specific Initiative can be incorporated by distinguishing the business functions bringing
expertise into the Initiative. Considering Davenport and Harris (2007), Bose (2009) and
Dietrich et al. (2015) we identified several specific roles in analytics Initiatives (e.g.,
several roles from providing access to data to the data management as well as business
function from user to sponsor of the Initiative) which can both be internal to the
organization or externally contracted. We aggregated the roles leading to three groups
and six roles: internal analytics expert (HUM1), external analytics expert (HUM2),
internal IT expert (HUM3), external IT expert (HUM4), internal business process expert
(HUM5), external business process expert (HUM6). As we have seen in our analysis,
external and internal expertise is not mutually exclusive. Depending on the complexity of
the Initiative, organizations combine available expertise in various forms to achieve
success.
Fourth, for the technological (TEC) aspects and final capabilities the infrastructure can
be a major barrier (Sanders, 2014). However, Davenport and Harris (Davenport and
Harris, 2007) direct the focus on tools and analytics architecture. They identify small and
Supply Chain Objective
(SCO1) Cost(SCO2) Quality
(SCO3) Time
(SCO4) Flexibility(SCO5) Sustainability
(SCO6) Innovativeness(SCO7) Customer relationship
(SCO8) Supplier reliability & risk
Analytics Objective
(AO1) Transparency(AO2) Root cause identification
(AO3) Evaluation of performance and
environment(AO4) Segmentation
(AO5) Support of human decision-making(AO6) New source of revenue
Human involvement
(HUM1) Internal Analytics experts(HUM2) External Analytics experts
(HUM3) Internal IT experts
(HUM4) External IT experts(HUM5) Internal process experts
(HUM6) External process experts
Technology
(TEC1) Spreadsheet software(TEC2) Statistical software
(TEC3) Specific algorithms
(TEC4) Purpose-built data storage(TEC5) Non-purpose-built data storage
(TEC6) Virtualization
Type of Analytics
(TA1) Descriptive Analytics(TA2) Predictive Analytics
(TA3) Prescriptive Analytics
Data Management
(DAT1) High Velocity(DAT2) High Volume
(DAT3) High Variety
(DAT4) Internal data(DAT5) External data
Su
pp
ly C
hain
An
aly
tics in
itia
tiv
e
Figure 12: Characteristics of a Supply Chain Analytics Initiative
83
short Initiatives done with spreadsheet software (TEC1) which can be applied by
analytical amateurs. Analytical professionals however will either use statistical software
(TEC2) for experimental purpose or define and refine specific analytical algorithms
(TEC3) building new and often purpose-specific tools. We distinguish the last two, since
this algorithm might be bought from a third-party vendor. On the other hand, Davenport
and Harris (2007) discuss the importance of data storage and access. However, since their
initial work, the field has seen significant developments. Opposed to statistical software
models gathering data from existing systems or sending it to a third-party to execute the
analytics methods, the classical mode is a newly purpose-built data storage (TEC4).
Recently, the concept of a non-purpose-built data store to gather data from (TEC5) is
emerging following the idea of creating a single storage for analytical purposes to be
defined later. This concept is often called “Data Lake” (Fang, 2015). Finally, the concept
of virtualization, as prominently known due to cloud computing, allows access to
analytical methods and results disconnected from the actual data infrastructure (TEC6),
e.g., with mobile devices (Kambatla et al., 2014).
Fifth, data management (DAT) for analytical purposes can face serious challenges
demanding supplementary effort (Laney, 2001). As explained above, the big data concept
represents serious data management challenges, which we have thus incorporated into the
evaluation. This includes a high velocity of data (DAT1) being analyzed or collected, a
high volume of data (DAT2) to be included in Analytics and a variety of data sources,
data structures and data semantics (DAT3). Further, besides internal data (DAT4),
managers are supposed to be creative about the inclusion of external data (DAT5) sources
(Barton and Court, 2012).
Sixth, reconsidering the works of Hahn and Packowski (2015), and Holsapple et al.
(2014), the type of analytics (TA) can be descriptive (TA1), predictive (TA2),
prescriptive (TA3) or several of them at once due to chaining or combination.
As mentioned in the introduction, the Initiative’s outcome has been neglected in the
analysis process. The outcome, which is presented in a percentage or absolute value for
savings or improvements in a monetary value, time or quantity is highly dependent on the
individual case, organization and industry. Thus, it was not considered meaningful for the
derivation of archetypes. Additionally, this research aims to recognize what organizations
aspire, the intention and the consequential execution in a qualitative manner. Quantitative
outcomes do not fit this aim. We further omitted firm size and organizational form, since
84
our interest is in the Initiatives presented by single projects, which can be a relative small
size compared to the size of the organization due to the intention to solve a small problem.
No characteristic described above is mutually exclusive and some will correlate since the
presence of one characteristic may likely demand the presence of another.
4.3 Methodology
To identify SCA Initiative archetypes, we used the machine learning method of
clustering. Clustering is a descriptive or explorative data analysis technique which relies
on interpretation by the analyst based on insight into the original data (Kaufman and
Rousseeuw, 2005). This fits MacInnis (MacInnis, 2011) requirement to use analytical
reasoning for facilitating the aspired differentiation. Below, we present the data
collection, analysis, and evaluation process.
4.3.1 Data Collection
Since this research considers case studies from organizations, research databases did not
provide a sufficient source. Based on the insight we gained from the publications
presented above we used key words and synonyms of Analytics1 as well as Analytics
Objective (see section 4.2.3) in combination with LSCM2 to conduct an extensive search
via the google search engine (with customized search results deactivated). Besides case
studies from organizations, we identified several third-party websites, software and
solution vendors and organizations applying Analytics, as well as news websites, expert
websites and blogs which we further used for snowball sampling. Finally, we approached
organizations for cases. In total, we identified a shortlist of 49 Initiatives with promising
information richness to evaluate their characteristics.
4.3.2 Data Analysis
To identify archetypes, we looked at previous research similar to our intent. [L]SCM
archetypes aimed at providing managers with understanding about organizational
adaptation and performance evaluation have been identified by non-hierarchical
clustering on supply chain IT and organizational structure variables (2008). The variables
were collected via a survey including variables such as B2B e-commerce supply chain
integration, ERP applications, operational centralization as well as market and financial
1 (“Data Science”, “Business Intelligence”, “Big Data” or “Data Mining”)
2 (“transport*”, “operation management”, “deliver*”, “value chain”, “warehous*”, “supplier”, “resource
planning”, “inventory”, “material flow”, “product handling”, “distribut*”, “shipping”)
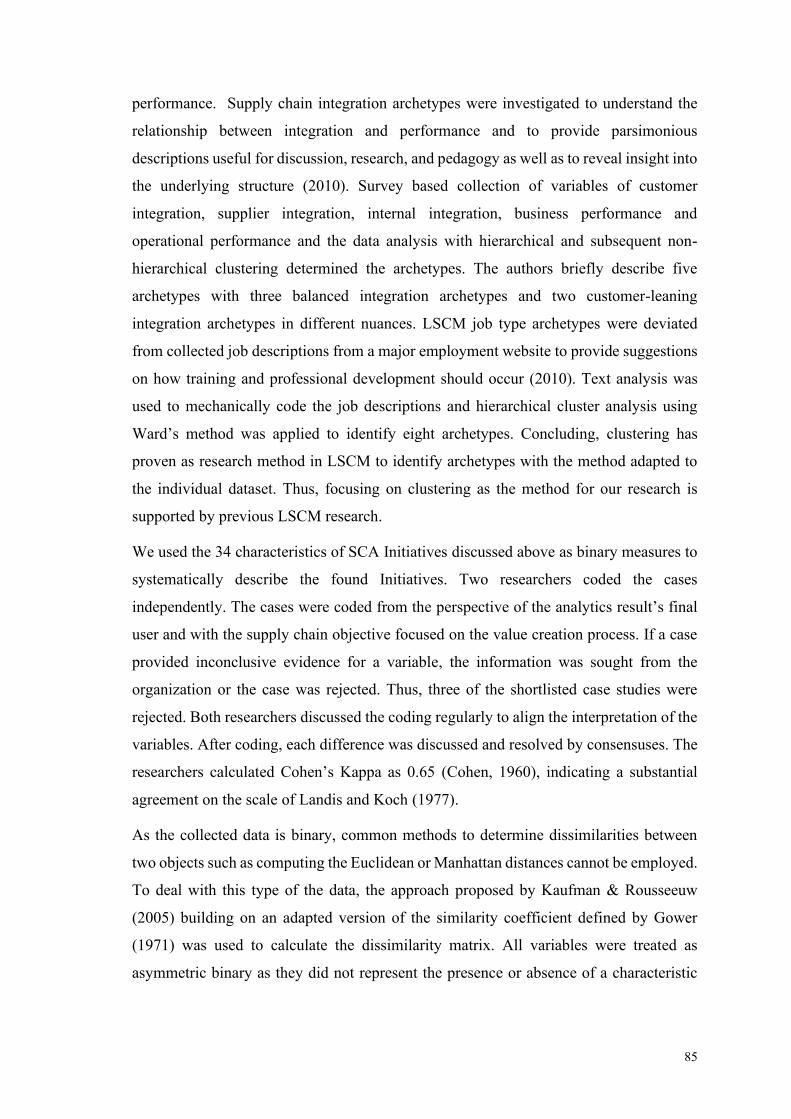
85
performance. Supply chain integration archetypes were investigated to understand the
relationship between integration and performance and to provide parsimonious
descriptions useful for discussion, research, and pedagogy as well as to reveal insight into
the underlying structure (2010). Survey based collection of variables of customer
integration, supplier integration, internal integration, business performance and
operational performance and the data analysis with hierarchical and subsequent non-
hierarchical clustering determined the archetypes. The authors briefly describe five
archetypes with three balanced integration archetypes and two customer-leaning
integration archetypes in different nuances. LSCM job type archetypes were deviated
from collected job descriptions from a major employment website to provide suggestions
on how training and professional development should occur (2010). Text analysis was
used to mechanically code the job descriptions and hierarchical cluster analysis using
Ward’s method was applied to identify eight archetypes. Concluding, clustering has
proven as research method in LSCM to identify archetypes with the method adapted to
the individual dataset. Thus, focusing on clustering as the method for our research is
supported by previous LSCM research.
We used the 34 characteristics of SCA Initiatives discussed above as binary measures to
systematically describe the found Initiatives. Two researchers coded the cases
independently. The cases were coded from the perspective of the analytics result’s final
user and with the supply chain objective focused on the value creation process. If a case
provided inconclusive evidence for a variable, the information was sought from the
organization or the case was rejected. Thus, three of the shortlisted case studies were
rejected. Both researchers discussed the coding regularly to align the interpretation of the
variables. After coding, each difference was discussed and resolved by consensuses. The
researchers calculated Cohen’s Kappa as 0.65 (Cohen, 1960), indicating a substantial
agreement on the scale of Landis and Koch (1977).
As the collected data is binary, common methods to determine dissimilarities between
two objects such as computing the Euclidean or Manhattan distances cannot be employed.
To deal with this type of the data, the approach proposed by Kaufman & Rousseeuw
(2005) building on an adapted version of the similarity coefficient defined by Gower
(1971) was used to calculate the dissimilarity matrix. All variables were treated as
asymmetric binary as they did not represent the presence or absence of a characteristic
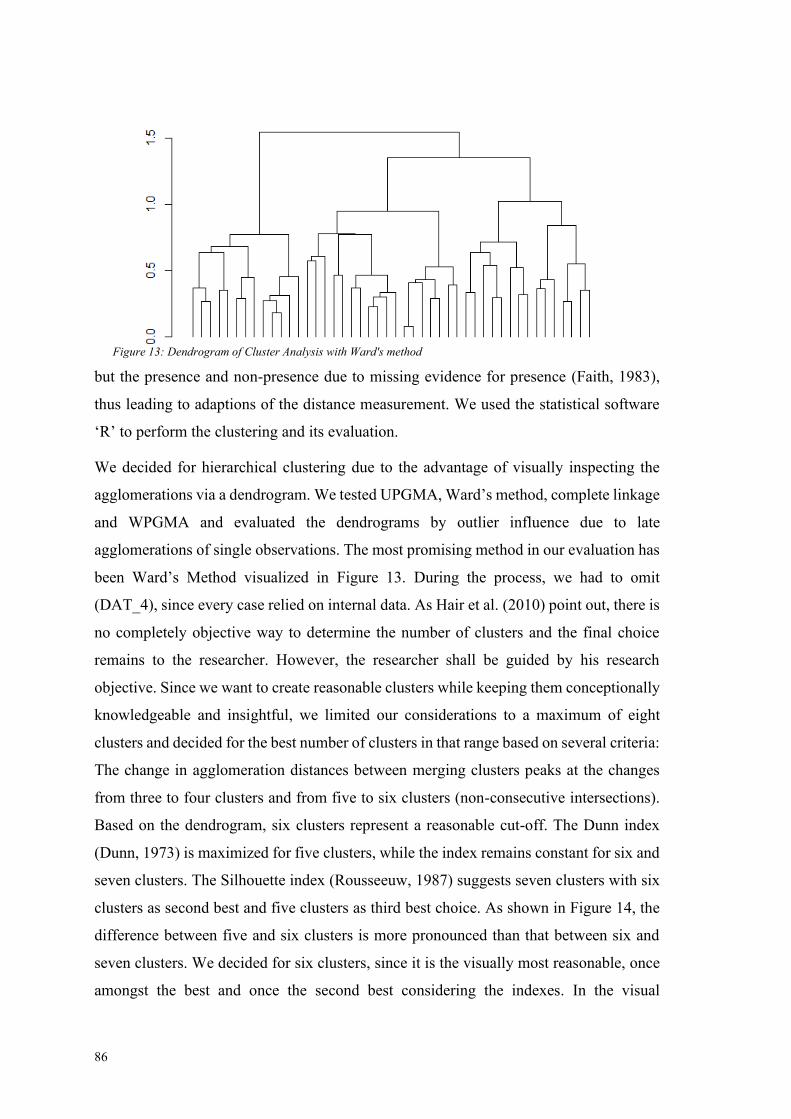
86
but the presence and non-presence due to missing evidence for presence (Faith, 1983),
thus leading to adaptions of the distance measurement. We used the statistical software
‘R’ to perform the clustering and its evaluation.
We decided for hierarchical clustering due to the advantage of visually inspecting the
agglomerations via a dendrogram. We tested UPGMA, Ward’s method, complete linkage
and WPGMA and evaluated the dendrograms by outlier influence due to late
agglomerations of single observations. The most promising method in our evaluation has
been Ward’s Method visualized in Figure 13. During the process, we had to omit
(DAT_4), since every case relied on internal data. As Hair et al. (2010) point out, there is
no completely objective way to determine the number of clusters and the final choice
remains to the researcher. However, the researcher shall be guided by his research
objective. Since we want to create reasonable clusters while keeping them conceptionally
knowledgeable and insightful, we limited our considerations to a maximum of eight
clusters and decided for the best number of clusters in that range based on several criteria:
The change in agglomeration distances between merging clusters peaks at the changes
from three to four clusters and from five to six clusters (non-consecutive intersections).
Based on the dendrogram, six clusters represent a reasonable cut-off. The Dunn index
(Dunn, 1973) is maximized for five clusters, while the index remains constant for six and
seven clusters. The Silhouette index (Rousseeuw, 1987) suggests seven clusters with six
clusters as second best and five clusters as third best choice. As shown in Figure 14, the
difference between five and six clusters is more pronounced than that between six and
seven clusters. We decided for six clusters, since it is the visually most reasonable, once
amongst the best and once the second best considering the indexes. In the visual
Figure 13: Dendrogram of Cluster Analysis with Ward's method
87
evaluation, we took into account the changes in distance from five to six cluster or six to
seven not being consecutive intersections. The resulting six clusters were interpreted by
considering the Initiatives in each cluster and by comparing the averages of variables
amongst clusters.
4.4 Results and Discussion
In this section, we describe the six found clusters by highlighting characteristics and
combinations of characteristics of the Initiatives in each cluster in comparison with the
Initiatives in the others. The findings therefore present the researchers’ interpretation. All
Initiatives within a cluster were then analyzed together to extract commonalities. Clusters
have been named to underline their major traits. The results are visualized in Figure 15
with key points for every characteristics category in the order presented in section 4.2.3.
4.4.1 Cluster 1 – Educating
The Initiatives in the Educating cluster focus on gathering data (sources) new to the
organization and process, that are used as more advanced input in the decision-making of
the LSCM process to improve output but will not lead to process redesign. This cluster
contains mainly forecasting Initiatives with the specific goal of providing the right
amount of goods without storing excess inventory or having stock-outs such that the
consumer of goods is served best (e.g., the use of data on weather, income, historical sales
or regional marketing campaigns to determine inventory allocation to individual stores).
Thus, the objective is to improve process quality and customer relationship. The tools
used in these Initiatives are dominantly predictive and aim to produce more precise inputs
for decision-making in consecutive processes of inventory allocation. In some Initiatives,
no evidence on how the consecutive processes are further affected by the tool can be
Figure 14: Cluster Evaluation (best evaluated in grey)

88
found. The report on one Initiative specifically states that this is intended, since
employees shall use the output of the model – the prediction – and not question it. The
focal organization usually buys a custom- built or customized advanced tool or system
extension developed by external Analytics experts, which includes external data sources
new to the forecasting organization and combines it with internal data from existing
systems to integrate it with these systems.
Educating the LSCM process by
including new data (sources) as process input for improved process output...
SCO to improve quality of process output
and subsequent customer relationshipAO by improving human decision support
HUM with external Analytics experts and
mixed IT and process teams, whoTEC implement models or specific
algorithms in existing systems (existingin the unchanged process), and
DAT introducing (new) external data
TA using predictive techniques
SCO to (insightfully) improve quality of the
process and its costsAO by identifying (data-based) causes of
quality deficiencies and providing
evaluation means based on causesHUM with mixed teams of experts, who
TEC use statistical tools to create purpose-built tools (attached to existing systems
or stand-alone), by
DAT analyzing internal data with high volume and variety
TA using predictive techniques
Observing of LSCM process conditions
indicating causes for process deficiencies based on newly gained process insight…
SCO to improve various objectives
AO by providing (knowledge-based) means of (automatic) evaluation, triggering
decision support on alert
HUM with mixed teams of experts, whoTEC create purpose-built tools (attached to
existing systems or stand-alone), forDAT high velocity data analysis
TA using descriptive and predictive
techniques
Alerting LSCM process owner
automatically on indicators of pre-defined critical conditions and events…
SCO to change and thus improve the process,
and its quality and create innovationsAO by providing (data-availability-based)
transparency and causes to enable
(formerly unavailable) evaluation and decisions
HUM with (mostly) internal experts, whoTEC create (stand-alone) purpose-built tools
connected to data storages without
predefined purpose (“data lakes”), byDAT analyzing data with high velocity,
volume and varietyTA using descriptive techniques
Advancing the LSCM process and/or
business model based on newly gained process data availability and insight…
SCO to improve costs and reduce time of
actions based on process innovationsAO by providing human decision support
HUM with mixed teams of experts but strong
internal expertise, whoTEC create purpose-built tools combined
with new storage systems, forDAT analyzing data with high velocity and
volume
TA using prescriptive techniques
Refining LSCM process by faster,
broader, and more frequent guidance for workers or decision makers to act on…
SCO to improve costs and quality of
processes and assetsAO by identifying causes
HUM with mixed teams but strong external
Analytics expertise, whoTEC apply statistical tools, for
DAT analyzing internal dataTA using descriptive techniques
Investigating LSCM process and asset
deficiencies to identify causes and enable creativity and engineering design
based solution search…
SCO – Supply Chain Objective
AO – Analytics Objective
HUM – Human involvement
TEC – Technology
DAT – Data Management
TA – Type of Analytics
Figure 15: Proposed Supply Chain Analytics archetypes (no chronology or sequence intended)
89
4.4.2 Cluster 2 – Observing
The Initiatives in the Observing cluster concentrate heavily on predicting LSCM process
deficiencies in the short-term or medium-term future with a newly developed tool
observing and monitoring the processes gain reaction time to either prevent the
deficiencies or enable counteraction. The prediction is based on process conditions
indicating the definitely identified in the Initiative. Thus, observing indicates watching
with knowing what to pay attention to. The supply chain objectives are mixed but tend to
focus on cost reduction and quality improvement. The process is sought to be improved
by observing and avoiding identified causes of quality deficiencies but not essentially by
changing or redesigning the process. The Initiatives in Cluster 2 describe a variety of data
experiments to improve process accuracy and quality (e.g., identifying production quality
indicators that have to be monitored, estimation of product weight based to package
weights to sequentially use package weight as quality indicator for correct items, identify
influencing factors on punctuality of arrival to adjust plans when factors are present). In
a distinct proportion of Initiatives, the maintenance process of an asset, machine or
vehicle, was under investigation. The actors in the analytics team are mixed from internal
and external experts for Analytics and IT. Process experts are usually in house. The
software used includes spreadsheets – the cluster contains the only Initiative the authors
could identify using spreadsheet software (in combination with statistical software) – and
statistical software but no specifically designed algorithm. The techniques used are
primarily predictive and analytically aimed at anticipating the behavior and evaluating
the performance of a process as well as understanding the causes of the process behavior.
Thus, they usually exploit patterns in the data opposed to process knowledge as in
Alerting Initiatives. Data is either stored in purpose-built data storages or gathered from
existing systems. In addition, cloud computing was used in some Initiatives to provide
access to the automatically evaluated processes to facilitate monitoring. External data is
barely used, but internal data comes in high volumes and variety to create sophisticated
process insight tools.
4.4.3 Cluster 3 – Alerting
The Initiatives in Cluster 3 use similar approaches as the Initiatives of Cluster 2. However,
the product of the Initiative diverges with Cluster 3 Initiatives aiming to produce a support
system for process owners. These are supposed to call for attention or alert in certain,
especially critical, process conditions or events, which are mostly predefined rather than

90
identified. Critical refers to negative process effects or possible loss of revenue. The on-
demand attention contributes to meet various supply chain objectives including cost
reduction, quality improvement, flexibility increase or customer relationship
improvement. The LSCM process is usually untouched, as opposed to Advancing or
Refining Initiatives, while the monitoring task of the process is reduced from active
checking to passively getting alerted on actions required (e.g., by providing alerts when
delivery vehicles do not progress on route as has been estimated which demands
modification of routes, informing receivers or parallel deliveries with faster delivery
time). To achieve this, the Initiatives repeatedly describe teams of internal process experts
teaming up with mixed experts in analytics and IT. The need for external assistance in
these Initiatives may be attributed to the desired output, which is to develop a dedicated
software tool in all Initiatives in Cluster 3. These tools perform monitoring tasks of a
specific process and recommend actions for improvements (e.g., to lower energy
consumption, to increase flexibility, to reduce cost, to improve utilization of capacity) as
well as request needed actions (e.g., change routes, change active supplier, maintain
machines, to adjust prices). Thus, high velocity of data analysis is in focus. The
organizations in some cases used the tool to offer new services to their customers. The
tools usually need their own purpose-built data storage with virtualization technologies
commonly used for improved access. Further, they are likely to include external data
sources necessary for risk assessments of suppliers, sources of delays on routes or
condition evaluation supported by additional manufacturer provided data. As opposed to
Observing Initiatives, these Initiatives are commonly driven by process knowledge of
critical conditions and therefore focus on finding data-driven ways to automate what
process owners were actively monitoring before. The Initiatives use and combine
descriptive and predictive techniques to summarize data for monitoring and extrapolating
future conditions.
4.4.4 Cluster 4 – Advancing
The Initiatives in Cluster 4 focus on advancing a process, or even the organization by
developing new business models. Thus, as opposed to Observing Initiatives, which
optimize reacting on process conditions potentially leading to process quality deprivation,
or to Alerting Initiatives, in which known conditions require actions, these Initiatives
usually introduce process changes in the form of adjusted process steps that were
identified based on process data made available to create this transparency – the large
91
scale data availability is often seen as major progress and benefit with resulting tool
focused process execution. This cluster unites Initiatives of organizations with a certain
maturity in Analytics. These usually bring internal expertise into the Initiative from all
relevant areas and only occasionally require external expertise. In particular, the
Initiatives aim to achieve data availability and transparency and subsequently understand
the focal process (e.g., by equipping assets with a variety with sensors and mobile devices,
collecting data, and analyzing data from similar assets together to determine the life cycle
process of a machine and its components or routines of transport vehicles performing
deliveries and consequentially creating a new form of predictive maintenance contract
with customers). In this context, “understanding” not only refers to the continuous
evaluation of processes, but also to the use of descriptive techniques for causal analysis
to identify process parameter settings and combinations causing losses in process quality,
and to provide a decision support to counteract these losses. The Initiatives integrate data
with high velocity, high volume and high variety. To achieve this, purpose-built software
tools are developed. The results of the analysis lead to tools for process monitoring
combined with decision support systems. These Initiatives further emphasize the
collection of data without predefined purpose, with prospective use of these centralized
data in future analyses. The tools and select data are regularly made available to customers
to create a competitive advantage for their own products.
4.4.5 Cluster 5 – Refining
The Initiatives in cluster 5 aim to squeeze the last bit of untapped efficiency out of a
system by refining processes with assisting or rather guidance functions for human
operatives to reduce costs and save time. Additionally, these Initiatives have a strong
focus on creating an innovative advantage over competition. To achieve this, prescriptive
techniques are used to determine the best course of action – redesigning the process with
manifold interactions with the system to guide decision-making by human operatives.
This includes the transfer of routing algorithms to pickers and the stops of their carts in
distribution centers, augmenting delivery vehicle drivers with routing algorithms
dynamically using real-time traffic conditions to re-optimize while the vehicle is already
on the road or extending manufacturing processes with real-time quality evaluation to
change the production sequence. Thus, as opposed to the archetypes above, the focus
diverges from understanding and monitoring a process to continuously adjust (or refine)
it. To achieve the aspired goal, a high volume of high velocity data must be analyzed by
92
purpose-built tools. The highly customized tools as well as the systems developed to
execute these tools are developed in-house with a combination of internal and external
expertise.
4.4.6 Cluster 6 – Investigating
The Initiatives in cluster 6 are united by the investigation of causes of deficiencies or
rather major process flaws. Thus, the objective of these Initiatives is to increase process
quality and reduce costs by identifying and mitigating the root causes of process flaws or
finding proxies to enable monitoring them (e.g., identify shelf replenishment flaws by
monitoring check-out patterns in super markets to identify patterns of lost sales or
identifying critical sensor signals presenting factors causing quality issues in production
processes). The important aspect to distinguish this cluster from the others is the
consequences taken when a root cause is found. Handling the root causes in the Initiatives
could not be done by automating decision-making or more sophisticated monitoring.
Rather, the cause of process reliability or deficiency has to be handled by changes in new
product development, major process redesign or changes in materials demanding
creativity and engineering design. These Initiatives usually combine external Analytics
with mixed external and internal IT and processes expertise. Identifying causalities is
supposed to start a solution search instead of automating evaluation or continuous
decision support, as compared to Observing, and Alerting or Refining Initiatives. The
results of the Initiatives are based on statistical software with a focus on internally
available data. Purpose-built data storage systems are created.
4.4.7 Discussion on Archetypes
The clusters presented above present archetypical Initiatives of Analytics in LSCM. The
identification and interpretation of core characteristics of clusters was conducted to
highlight the uniqueness of each archetype and present archetype diversity in intended
problem to be solved, execution, techniques, and product. Single Initiatives forming the
clusters and therefore determining the archetypes differ in some characteristics from the
archetype. Thus, new Initiatives may be created with differences in single features but
with a clearer understanding of archetypical feature combination. In addition, while there
is some (expected) overlap of clusters, we consider it as new insight that e.g., the same
Analytical objective may be used to pursue different Supply Chain objectives.
Considering the identified archetypes, as well as the characteristics forming the clusters,
we observed that the type of Analytics did not dominate. While the Refining archetype
93
consists solely of optimization Initiatives, optimization techniques could be found in the
Educating and Advising archetypes as well. Predictive techniques can be found in all
archetypes, including the Refining archetype, since techniques were usually combined in
more sophisticated Analytics Initiatives. This holds true for descriptive Initiatives as well.
While the type of Analytics has been our greatest concern, we additionally conducted an
analysis for dominating characteristics by evaluating all characteristics across all
archetypes in search for characteristics present in all Initiatives forming an archetype but
not present in any other archetype. However, we could not find any characteristic
fulfilling this condition of dominance. To extend our analysis of critical characteristics,
we considered whether the supermajority (two-thirds) of Initiatives possessing a certain
characteristic are given in any archetype. This condition was defined as weak dominance
for this research. This condition was fulfilled by the features SCO8, TEC1 and TEC5.
However, these features have two, one, and three observed Initiatives possessing the
characteristic, respectively. Therefore, we did not consider these features as critical.
Concluding, we are confident in our results not being dominated by one single
characteristic.
When presenting these results to scholars, a major point of controversy has been, whether
the archetypes present levels of Analytics maturity of an organization which we reject
after careful consideration due to the following aspects: First, considering the given data,
one Initiative does not reflect the whole organization but a business unit executing the
Initiative. This is consistent with research indicating Analytics should follow process
maturity (Oliveira et al., 2012) or rather additional Analytics Maturity should fit process
maturity (Trkman et al., 2010) which is therefore not necessarily leveled across the
organization. Second, organizations could execute Initiatives of lower maturity since it
may still provide benefits and Initiatives of higher maturity using external support. Thus,
an Initiative is not a distinct confirmation of an organizations capabilities. Third, in the
Initiatives considered, two organizations have been observed twice and one organization
three times. The Initiatives thus spread across archetypes with the seemingly more mature
Initiatives either in the same year or earlier. Fourth, research has pointed out, that the
objective of an Analytics Initiative is often set without the consideration of the complexity
of the Analytics required (Viaene and Bunder, 2011). While the objective guides the
Initiative, the necessary Analytics maturity may be determined during the execution and
94
not before and thus not influence the Initiative. However, we acknowledge that the level
of internal expertise involved may indicate the business criticality.
Concerning an Initiative perspective, this actually opposes maturity models setting
standards for organization-wide implementation for highest maturity (Wu et al., 2016) or
considering strategic Initiatives for highest maturity (Wang et al., 2016). These levels of
maturity address the analytics culture of the organization (Davenport and Harris, 2007)
which may influence the spread of Initiatives but not dictate the choice of Initiatives.
Finally, we learned that, in order to achieve value with SCA, the solution does not have
to be an organization-wide expensive third-party tool. Small models build with R or SPSS
and visualized with Tableau can provide significant value already.
4.4.8 Discussion on overcoming barriers with archetypes
This research aspires to provide means to overcome barriers of applying Analytics to
LSCM related to a missing understanding. Considering Sanders (2014), we chose and
summarized several barriers relevant for this research in section 4.2.2.
Lack of leadership is indicated to be caused by lack of vision, lack of understanding of
the capability, and the lack of understanding how to lead change. The latter, also described
as creating a data-oriented culture (Kiron et al., 2012) or data-driven culture (McAfee and
Brynjolfsson, 2012), is considered a key competency for managers to transform
organizations to sophisticated Analytics capabilities and beyond the scope of this
research. The lack of vision is addressed by the core concepts of each archetype since
they are supposed to guide vision by providing points of reference to individualize, adapt
and combine. The lack to understand the capabilities required to apply Analytics is
addressed by the characteristics of Analytics Initiatives emphasizing structure of and
resources needed for executing an Initiative. However, it has been suggested that the
existence of these capabilities in an organization doesn’t guarantee the ability to bring it
to full use (2014).
The barriers of lacking objectives are addressed by the generic objectives presented by
the two objective characteristics categories, and by the specific objectives provided in the
archetype descriptions. This highlights to managers the necessity of defining an objective
as compared to the “poking” for correlation as described by the notion of analysis
paralysis. Defining an objective which Analytics should answer is a valuable starting
point (Lavalle et al., 2011). The archetypes further emphasize that Analytics Initiatives
95
should not bedriven by the latest and most innovative technology but by technology fitting
the purpose of the identified objectives.
Further, as evident from the discussion above, with an orientation on objective-driven
SCA with subsequent choice of data, managers should not drown in data. The archetypes
further present the opportunity of relying on external guidance for choosing the necessary
data. In addition, it is indicated that using non-Big Data can still achieve benefits. This is
further underlined by process models for Analytics Initiatives recommending data
collection to be a later step in the project (e.g., Dutta and Bose, 2015; Provost and Fawcett,
2013). Even while drowning in data, having the right data to successfully execute the
Analytics Initiative is not guaranteed.
4.5 Conclusion
In our research, we investigated how SCA Initiatives can be distinguished. Literature
suggests reluctance of LSCM to invest in Analytics Initiatives caused amongst other
reasons by managers missing ideas in how to approach SCA. With our research, we
address this shortage by providing a distinction of Initiatives providing knowledge to
managers about typical approaches to use SCA to gain business value. Based on the
patterns emerging form a cluster analysis of 46 SCA Initiatives we propose six archetypes
that show considerable differences in how organizations deploy SCA. In the analysis, the
problem to be solved, execution, techniques, and resulting Analytics Solution of the
Initiative have been considered. In detail, we examined characteristics necessary to
execute an SCA Initiative and therefore display areas that have to be taken into account
by managers designing new Initiatives. The characteristics are aggregated into the
following groups:
• Supply chain objective that shall be addressed which represents the
problem or deficiency in the LSCM process;
• Analytics objective, which is addressing how data and Analytics are
supposed to support, effect or change the LSCM process;
• Human expertise in areas relevant to the Initiative as Analytics, IT and the
LSCM process (and how it is sourced);
• Applied software and hardware for analytical tasks and deployment of
developed solutions and tools;
• Data sources and characteristics;
96
• Applicated types of Analytics (and subsequently analytical methods)
Regarding the groups of characteristics above, our findings support considerable
differences in Initiative archetypes. The patterns identified allow us to answer the research
question: SCA Initiatives can be distinguished in the six clusters which are described in
regard to the characteristics in subsection 4.4 as well as LSCM process centric as follows:
(1) Educating: The LSCM process remains as existing but will be enhanced with new
data (sources) information as process input to improve decisions to be made during the
process resulting in enhanced LSCM process output quality and customer orientation.
This typically emerges as improved tool used in the process like a new forecasting model
in a product allocation process or new forecast model for a risk evaluation process.
(2) Observing: The LSCM process is extensively investigated for conditions that indicate
process deficiencies or issues in the short-term or medium-term future with a resulting
tool to monitor the process based on the newly gained insight. The knowledge about the
conditions improves process quality and costs due to earlier reaction. Examples include
detection of engine vibration patterns enabling maintenance planning of vehicles such
that a repair shop is the final stop of a route on a suitable point in time instead of random
breakdown far away from access to maintenance, or detection of weather patterns
resulting in traffic and road conditions demanding changing of routes. However,
identified conditions are indications and leave room for human decision-making.
(3) Alerting: LSCM process owners are provided with alerts on critical conditions and
events that immediately demand reactions. The conditions are usually known by process
owners without the need of analytical identification and certain in their negative impact
on the process demanding actions. Alerting Initiatives’ central task is making the
necessary data available to automate the alert as opposed to repeated human check-up
actions. Examples include alerts on closed roades for vehicle routing or automated
recommendations of price changes and acceptance of shipments for cargo airlines in close
to departure time-windows. Here again, the LSCM process is typically supported but not
altered.
(4) Advancing: The LSCM processes and business models will be advanced by enabling
changes due to insight made available with intense data collection and analysis. Large
scale data collection is central to the Initiative, using sensors and mobile devices to create
data-availability-based transparency and evaluation of LSCM process steps. The insight
97
is used to improve process quality by changing process steps under incorporation of the
insight and creating analytics driven innovations replacing process steps as well as
making insight available to interested third parties as business model innovation.
Examples are machine profiles allowing determination of accurate predictive
maintenance processes which can be sold by the machine manufacturer to the machine
user, or driver profiles to create new monitoring steps to reduce idle time. These
Initiatives differ from observing and alerting by extensiveness of data collection and
analysis typically demanding big data technologies, and range of the resulting tool, which
changes the process to become tool and thus data focused as opposed to a minor process
support.
(5) Refining: The LSCM processes are changed to incorporating faster, broader, and more
frequent guidance on actions and decision support. Instead of optimized plans that are
executed, the objective of these Initiatives is to optimize plans during execution
dynamically based on data about current events and conditions. Examples are dynamic
changes of routes of vehicles already on the road, or dynamic changes of picker routes in
distribution centers already picking. The LSCM process is changed due to extensive focus
on guidance tools guidance during process execution.
(6) Investigating: The LSCM process (and asset) deficiencies and issues are investigated
for their causes to enable the solution search for design changes to the process. These
changes are supposed to create new processes with improved costs and quality over the
process under investigation. As opposed to issues described in advancing or refining,
process changes like automation or data-driven tools for guidance will not create control
over the process issues addressed in these Initiatives. Thus, creativity and engineering
design is required. Examples include the investigation of occurrence of empty shelf space
in retail stores to redesign replenishment processes of products or the investigation of
process environment factors in production lines leading to quality issues that have to be
avoided.
4.5.1 Theoretical Contribution
Our research contributes to LSCM research with a focus on SCA and the practical
application of SCA, an area that has been demanded to be investigated by several
researchers in LSCM (Sanders, 2014; Schoenherr and Speier-Pero, 2015; Waller and
Fawcett, 2013). The identified archetypes provide an empirically developed taxonomy.
Further, they give insight into the underlying structure of Analytics Initiatives used in
98
LSCM – why and how they are applied. The research decomposes SCA Initiatives in
important distinct parts, which can structure future research. Thereby, this research
specifically addresses characteristics influencing Analytics Initiative and is not limited to
distinction by software (Hahn and Packowski, 2015) or LSCM process (Souza, 2014).
The proposed archetypes seek to guide discussions, research and training of students
becoming managers enabled to use SCA. The discussion aspired by the authors should
address how to enable organizations to create Initiatives beyond the presented
contemporary archetypes with more sophisticated supply chain and Analytics objectives,
rather than conducting single case studies or literature reviews on the competitive impact
without empirical evidence. Our research provides a framework supporting the
investigation of the effects of different types of Analytics Initiatives and helps researchers
working with data models and quantitative case studies to orientate themselves in the
bigger picture of their research. This framework further allows to investigate the
implications of various kinds of SCA Initiatives on performance, barriers as well as the
efficiency of the Initiatives based on the archetype of the Initiative. Finally, this research
gives a two-dimensional picture to introduce students to this field and ease the process of
understanding important factors and possibilities by the proposed first dimension of
archetypes to understand what companies do and the second dimension of characteristics
of SCA Initiatives to understand what aspects to consider when constructing an Initiative.
Thus, it enables researchers and students to introduce their LSCM knowledge into
Analytics Initiatives and provide considerable value that is required for successful
Initiatives (Schoenherr and Speier-Pero, 2015; Waller and Fawcett, 2013).
This research further addresses the gap between theory and organizational activities
highlighted by several scholars, especially in management science (Banks et al., 2016;
Suddaby, 2010). Our archetypes map the activities of organizations and provide templates
for organizations and scholars in the field to understand what drives organizations to their
activities.
4.5.2 Managerial Contribution
This research copes with the managerial barriers related to missing insight into the
application of SCA. By describing archetypes of this application, we give managers
directions for future SCA Initiatives based on their initial business situation, available
means and objectives. Presenting the results to experts in Analytics, the archetypes were
well received with the remark that managers may lack creativity of how to address
99
business problems with Analytics which could be supported with the results of this
research. In this regard, managers may combine archetypical approaches to create new
Initiatives or explore Initiatives with supply chain or analytical objectives rarely
observed.
Considering the barriers discussed in section 4.4.8, our research presents how the
application of SCA creates value for an organization and how decisions are made based
on SCA. Managers should be enabled to decide which of the overwhelming opportunities
provided by SCA to take and which to postpone or reject with the primary objective of
providing value to the organization. Naturally, this requires the creativity to design new
Initiatives.
The research further provides a framework for managers to understand the key
components to build an SCA Initiative. First and foremost, an Initiative has to address
existing problems – meaning any disparity between objective state and actual state – for
the LSCM Part as well as they require an analytical objective to address the LSCM
problem. Further characteristics display fields that have to be developed and improved
over time to design more complex Initiatives, even in the same archetype. For the Human
category, that includes building skills supporting the execution of Initiative as hard skills
in Analytics as well as communication skills to transfer thoughts, ideas and experience
between the different experts. In the technology category, this include investments in
easier data exchange, faster analysis and calculation as well as more-powerful analytical
tools. In the data category, this includes broader data collection and higher standards for
data quality.
Our research further develops a vocabulary to communicate managers’ objectives and
vision while highlighting small but crucial differences. The archetypes are imagined as a
menu of options a manager may use to choose specific or combined items. We intend the
archetypes to guide his Initiative design process, as opposed to having an infinity of
options that quickly becomes overwhelming. Therefore, besides providing directions, the
archetypes also serve as validation of the fit of characteristics of the Initiative and thus,
it’s practicality. This enables managers to pinpoint what they aspire and communicate it
directly and properly.
The other way around, the archetypes can be stimulation for two additional types of
managers keen to use Analytics in LSCM. First, Managers that achieved some routine in
Initiatives of a specific archetype may get stuck in that archetype and repeat it for ever
100
new use cases which eventually leads to decreasing marginal value from that kind of
Initiatives. Second, managers the are supposed to “make more from their data” – a type
that is not very rare from our personal experience. Both types of managers could, using
the archetypes, identify promising problems to address and subsequently search for
interested users or rather “problem owners”. The first type obviously benefits over the
second from knowing eventual problem owners from her previous projects she could
address again with another beneficial Initiative.
4.6 Final remarks
4.6.1 Limitations
Due to the various sources of the Initiatives considered, their descriptions are provided in
various levels of detail regarding the characteristics used to evaluate them. With 46 cases,
the amount of considered cases is low. Additionally, the observed cases only represent
successes since these are more likely to be published in any form. Unsuccessful cases to
use Analytics in LSCM could not be identified. Further, the cases have been collected in
a procedure which is hard to recreate. This is due to the lack of a public database for such
case studies, especially considering the amount of studies needed to conduct a meaningful
cluster analysis. Since databases for research (e.g., Scopus, Web of Science or EBSCO)
did not yield relevant results, we were reliant on an open search platform. The search was
suspended when a reasonable amount of time (16h / two workdays) for searching cases
did not yield any new results. However, the possibilities to collect the data for this
research were rather limited.
Furthermore, considering the data analysis, the decision about the number of clusters and
thus the number and structure of the identified archetypes depends on several vague
factors and cannot be made objectively. The clusters are created based on the researchers’
interpretations and judgement. We presented the results to researchers in LSCM and
experts in Analytics, which assessed the clusters as reasonable.
4.6.2 Future Research
This study takes a step towards understanding the inner structure of a growing field of
research, which should not be investigated as a single entity to generalize use, effects and
benefits anymore. Thus, future research may investigate the effects of SCA Initiatives
distinguished by archetype to create more sophisticated insight. The archetypes may also
be correlated to Analytics maturity or the growth-share matrix to identify easy-to-start
archetypical Initiatives for organizations with low maturity and identify factors of

101
successful Initiatives with the potential to create competitive advantage. Additionally,
since we consider this research to be contemporary, we encourage to repeat this research
in five to ten years.

102
Submitted version. Published as: Herden, T. T. (2019). Explaining the competitive advantage generated
from Analytics with the knowledge-based view: the example of Logistics and Supply Chain Management.
Business Research, 1-52. https://doi.org/10.1007/s40685-019-00104-x (published by Springer, CC BY
4.0)
103
5 Explaining the Competitive Advantage Generated from Analytics with the
Knowledge-based View – The Example of Logistics and Supply Chain
Management
The purpose of this paper is to provide a theory-based explanation for the generation of
competitive advantage from Analytics and to examine this explanation with evidence
from confirmatory case studies. A theoretical argumentation for achieving sustainable
competitive advantage from knowledge unfolding in the knowledge-based view forms
the foundation for this explanation. Literature about the process of Analytics initiatives,
surrounding factors and conditions, and benefits from Analytics are mapped onto the
knowledge-based view to derive propositions. Eight confirmatory case studies of
organizations mature in Analytics are collected, focused on Logistics and Supply Chain
Management. A theoretical framework explaining the creation of competitive advantage
from Analytics is derived and presented with an extensive description and rationale. This
highlights various aspects outside of analytical methods, including cross-functional
teams, iterative problem solving with user feedback, solution consumability, and
innovative culture. Further, this study presents a practical manifestation of the
knowledge-based view.
5.1 Introduction
The use of Analytics is increasing across industries. It is fueled by trending concepts like
big data and data science, innovative technologies such as distributed computing and in-
memory databases, as well as the rapid increase of data available for processing. A recent
survey showed a constant increase of organizations perceiving the role of Analytics as
critical, a closing maturity and capability gap between digital natives and traditional
companies in applying analytics, and its strategic role, as embodied in appointments of
C-level executives for Analytics (Alles and Burshek, 2016). A large proportion of
surveyed organizations believe that they can gain competitive advantages from Analytics.
Another study goes as far as to suggest that data-empowered organizations may threaten
the market survival of companies not using these approaches (FreshMinds, 2015).
However, organizations also struggle with adopting Analytics successfully (Viaene and
Bunder, 2011), with one difficulty being the ongoing discussion about what defines
Analytics. Holsapple et al. (2014) investigated a plethora of definitions of Analytics,
104
including the definition by Davenport and Harris (2007), who initiated the broader
recognition of Analytics with their famous book. Holsapple et al. (2014) identified at least
six definitional perspectives on Analytics just in the literature they reviewed, highlighting
the diverse comprehension of the topic. Based on the core characteristics of Analytics, it
has been described as recognizing and solving business problems based on evidence such
as data, facts, but also well-reasoned estimations. Further, Analytics initiatives are diverse
and have to fit with people, processes, and tasks to enable their benefits (Ghasemaghaei
et al., 2017), demanding investigation of which practices and conditions lead to
generation of competitive advantage from Analytics.
Competitive advantage is frequently discussed in the strategic management literature. The
resource-based view argues for competitive advantage based on the resources of firms,
including assets, capabilities, processes, attributes, and knowledge – if these are rare,
imperfectly imitable, and non-substitutable (Barney, 1991). The capability-based view
emphasizes these resources as the capabilities of firms that cannot be purchased on the
market and require strategic vision to develop over time through the strategic decisions
of bounded rational managers facing uncertainty, complexity, and conflict (Amit and
Schoemaker, 1993). The relational view argues that firms’ resources are of limited value
in providing competitive advantage, and instead credit it to the combined resources of a
network of firms (Dyer and Singh, 1998). Finally, the knowledge-based view narrows
down the resource required to provide competitive advantage to firms to just one item,
which satisfies all the necessary characteristics – the knowledge held by the individuals
of the firm (Grant, 1996a). Managers are responsible for integrating and applying that
knowledge. As the integration and application process of knowledge fits the definition of
Analytics as problem recognition and solving, the knowledge-based view provides a
reasonable theoretical grounding to investigate the generation of competitive advantage
from Analytics.
One discipline increasingly adopting Analytics is Logistics and Supply Chain
Management (LSCM). Scholars expect Analytics to change how supply chains operate
(Schoenherr and Speier-Pero, 2015). In practice, executives assess Analytics as playing a
pivotal role in driving profit and creating competitive advantage in LSCM (Thieullent et
al., 2016). Due to the vast number of applications areas and the assumed potential, a sub-
discipline of Analytics used in LSCM has formed, labeled SCM Data Science (Waller
and Fawcett, 2013) or Supply Chain Analytics (Chae, Olson, et al., 2014; Souza, 2014).
105
LSCM is considered an early adopter of analytical methods, using Operations Research
to optimize inventories, locations, and transportation costs (Davenport 2009). Holsapple
et al. (2014) even cite an article on production control and automation while exhibiting
the origins of Analytics. In recent research, the use of Analytics has shown a positive
impact on LSCM performance (Chavez et al., 2017; Sanders, 2016; Trkman et al., 2010)
and researchers have called for further research on Analytics in LSCM (Schoenherr and
Speier-Pero, 2015; Waller and Fawcett, 2013). However, research has also shown that a
major proportion of organizations remain reluctant to use Analytics or are not even
familiar with it, due to, amongst other factors, lack of ideas about how to achieve
advantage from it (Sanders, 2016; Schoenherr and Speier-Pero, 2015).
To investigate Analytics’ impact on organizations’ competitive advantage, narrowing the
focus is necessary. This article’s investigation focuses on the example of LSCM for
several reasons in addition to the field being an early adopter and achieving considerable
value from employing Analytics. From its core characteristics, LSCM is driven by
efficiency and cost-effectiveness (Simchi-Levi et al., 2003), which demands sophisticated
decision-making – as supported by Analytics. Therefore, it is not surprising that LSCM
has a long history of emphasizing data-driven decision-making (Souza, 2014; Waller and
Fawcett, 2013). LSCM is usually a complex task, managing information, products,
services, and financial and knowledge flows across internal units such as procurement
and manufacturing, as well as between globally dispersed organizations including
suppliers, retailers, or manufacturers (Bowersox et al., 2007). Consequently,
collaborative approaches to Analytics are needed, presenting a unique challenge for
Analytics, since data comes from several different organizations and results are deployed
across them (Davenport, 2009). In addition, LSCM is a human-centered process with a
variety of decision makers acting on the basis of their personal experience, resulting in
unexpected events, human errors, and consequential dynamic effects in the processes
(Wang et al., 2014). Wang et al. (2014) further highlighted the diversity of processes and
the resulting heterogeneity of process knowledge. In summary, LSCM is chosen as a
focus due to the field’s experience with data-driven solutions, the constant demand for
further improvement, and the challenges associated with adopting Analytics given the
complex, diverse, dispersed, and error-prone processes distributed across several business
units, organizations, and decision makers.
106
Considering the impact of Analytics, the objective of this research is to investigate how
organizations can generate competitive advantage from Analytics. For this purpose,
Analytics’ dependency as inputs not only on data, but also domain knowledge, is
acknowledged (Provost and Fawcett, 2013), consequently leading to activities in a
specific domain like LSCM being more similar to each other as compared to activities in
a different domain. In research, this results in domain-isolated chains of references, since
scholars tend to reference scholars from the same domain (Holsapple et al., 2014). Thus,
in order to create coherence of research and to narrow the focus, empirical evidence will
be collected from organizations maturely employing Analytics in a LSCM context. This
leads to the following research question: How is competitive advantage generated from
Analytics in context of Logistics and Supply Chain Management?
The remainder of this article is structured as follows. Section 2 reviews the knowledge-
based view and literature on Analytics to establish a link between them, as embodied in
the propositions formulated for this research. Section 3 documents the research design,
for which confirmatory case studies have been chosen. Section 4 discusses the results,
with a focus on the proposition of creating an extensive explanation of how Analytics
generates competitive advantage. The research will be concluded in Section 5, which
provides implications, limitations, and indications for future research.
5.2 Theoretical Background
In this section, Analytics activities are mapped onto the argumentation for competitive
advantage from the knowledge-based view (KBV) to present their congruence. The
connecting points are summarized in ten propositions.
5.2.1 Knowledge-based view
The KBV explains the generation of sustainable competitive advantage from knowledge,
summarized in the following section. Regarding knowledge, its creation, transfer, and
integration are distinguished as follows: Creation refers to development of new
knowledge. Transfer indicates sharing of knowledge without implying that the receiver
gains the ability to apply it. In contrast, knowledge integration describes the sharing of
knowledge such that receivers can apply it, but without necessarily possessing it.
5.2.1.1 The source of knowledge-based competitive advantage
An organization (“firm”) cannot use the open market as a source of sustainable
competitive advantage (Barney, 1986, 1991). Instead, according to the resource-based
107
view, it must create such advantage from its resources, which need to be rare, imperfectly
imitable, and non-substitutable.
Developing from the resource-based view, scholars have created several other
argumentations. These include the KBV, which establishes the knowledge possessed by
organizations as their most essential resource for competitive advantage (Conner and
Prahalad, 1996; Grant, 1996a, 1996b). It is based on an emphasis of the strategical value
of knowledge in organizations (Kogut and Zander, 1992; Teece, 1981; Winter, 1987) and
differentiating the performance of organizations using asymmetries in knowledge
(Conner and Prahalad, 1996). In the KBV, the role of individuals is underlined.
Organizational members carry, generate, and preserve the knowledge, while integration
of knowledge for its application is governed by managers of organizations. Neither
holding knowledge without integration nor the attempt to integrate non-existing
knowledge can be a source of competitive advantage (Grant, 1996b). Thus, the KBV also
deals with issues of organizational coordination and structure (Grant, 1996a).
The aspect most essential for the knowledge integration and application is the degree of
its transferability (Grant, 1996a), which depends on its form: explicit or tacit (Grant,
1996a; Kogut and Zander, 1992; Teece, 1998; Winter, 1987). Perfectly explicit
knowledge is easy to articulate and communicate, transmittable without loss of integrity,
and observable, consumable, learnable, and usable with insignificant marginal costs
(Grant, 1996a; Kogut and Zander, 1992; Winter, 1987). In contrast, perfectly tacit
knowledge is difficult to articulate; not completely transferable in substance and meaning;
and costly to transfer since it is tied to skills and experience-based intuition, revealed by
application and acquired through practice (“know-how”) (Grant, 1996b; Kogut and
Zander, 1992; Nonaka and von Krogh, 2009; Teece, 1998). These forms exist on a
continuum indicating some degree of tacitness in almost all knowledge (Spender, 1996).
For organizations, this distinction implies the need for different actions to exploit the
knowledge (Teece, 1998).
Tacitness of knowledge is substantial in the argumentation for generating competitive
advantage from knowledge unfolded by Grant (1996b, 1996a), Spender (1996) and Teece
(1998) and was followed repeatedly (Alavi and Leidner, 2001; Purvis et al., 2001; Vachon
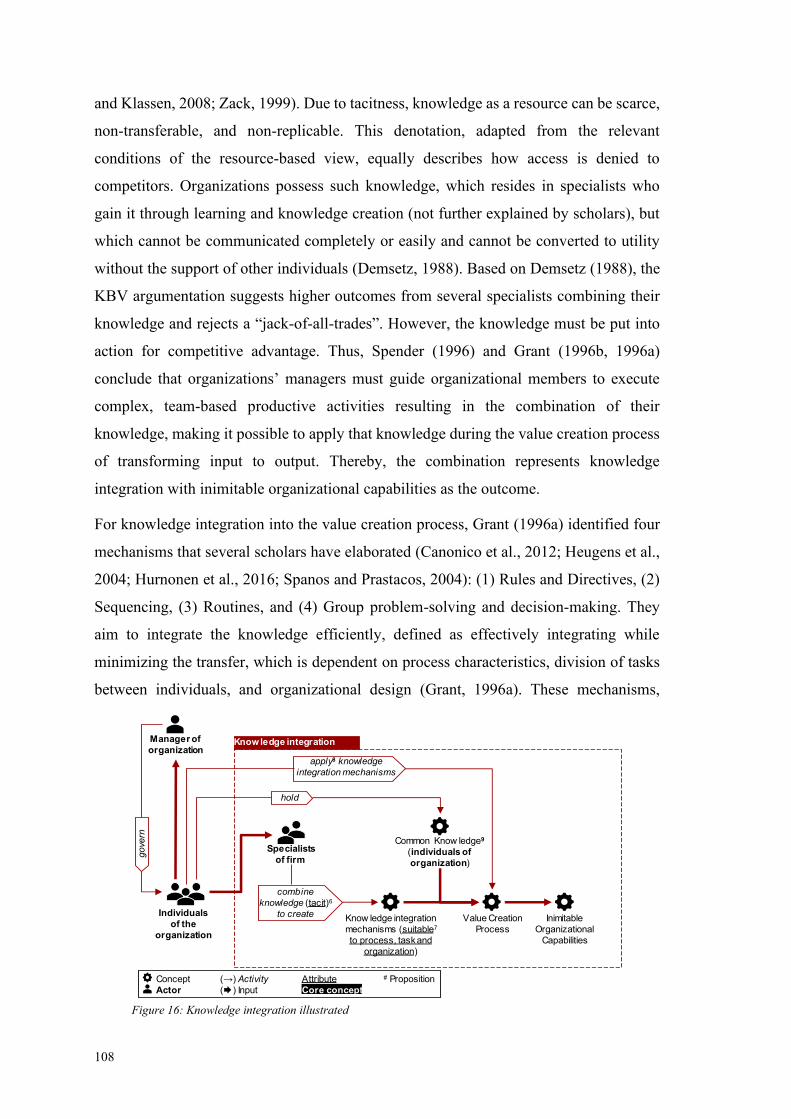
108
and Klassen, 2008; Zack, 1999). Due to tacitness, knowledge as a resource can be scarce,
non-transferable, and non-replicable. This denotation, adapted from the relevant
conditions of the resource-based view, equally describes how access is denied to
competitors. Organizations possess such knowledge, which resides in specialists who
gain it through learning and knowledge creation (not further explained by scholars), but
which cannot be communicated completely or easily and cannot be converted to utility
without the support of other individuals (Demsetz, 1988). Based on Demsetz (1988), the
KBV argumentation suggests higher outcomes from several specialists combining their
knowledge and rejects a “jack-of-all-trades”. However, the knowledge must be put into
action for competitive advantage. Thus, Spender (1996) and Grant (1996b, 1996a)
conclude that organizations’ managers must guide organizational members to execute
complex, team-based productive activities resulting in the combination of their
knowledge, making it possible to apply that knowledge during the value creation process
of transforming input to output. Thereby, the combination represents knowledge
integration with inimitable organizational capabilities as the outcome.
For knowledge integration into the value creation process, Grant (1996a) identified four
mechanisms that several scholars have elaborated (Canonico et al., 2012; Heugens et al.,
2004; Hurnonen et al., 2016; Spanos and Prastacos, 2004): (1) Rules and Directives, (2)
Sequencing, (3) Routines, and (4) Group problem-solving and decision-making. They
aim to integrate the knowledge efficiently, defined as effectively integrating while
minimizing the transfer, which is dependent on process characteristics, division of tasks
between individuals, and organizational design (Grant, 1996a). These mechanisms,
Knowledge integration
gove
rn
Manager of
organization
Individuals
of the
organization
Value Creation
Process
Inimitable
Organizational
Capabilities
apply8 knowledge
integration mechanisms
Specialists
of firm
combine
knowledge (tacit)6
to create
Common Know ledge9
(individuals of
organization)
hold
Know ledge integration
mechanisms (suitable7
to process, task and
organization)
Concept (→) Activity Attribute # Proposition
Actor ( ) Input Core concept
Figure 16: Knowledge integration illustrated
109
especially the first three, can be rather impersonal, communication minimizing, and
knowledge transfer economizing (“automating” or “programming”) (Alavi and Leidner,
2001; Grant, 1996a; Hurnonen et al., 2016; Spanos and Prastacos, 2004; Van De Ven et
al., 1976). In contrast, lateral relationships that are personal, less straightforward, and
interaction-dependent can be deployed, as in the fourth mechanism (Canonico et al., 2012;
Galbraith, 1973; Grant, 1996a). In accordance with dependence on different process and
organizational characteristics, mechanisms must be suitable for varying complexity,
uncertainty, or importance of tasks (Grant, 1996a; Hurnonen et al., 2016; Spanos and
Prastacos, 2004). Knowledge integration is illustrated in Figure 16, with numbers
referring to the propositions introduced later in this chapter.
The outcome of knowledge integration depends on the knowledge all individuals of an
organization share due to their affiliation to the organization, since knowledge integration
is catalyzed by this common knowledge (Grant, 1996b, 1996a; Spender, 1996). An
organization’s internal knowledge, combining specialized and common knowledge with
knowledge integration mechanisms, cannot be accessed by competitors. Thus, they are
not able to use the same organizational capabilities and, hence, cannot achieve the same
value created by tangible resources in the value creation process of transforming input to
output. Provided these organizational capabilities are advantageous over competitors’
capabilities, the competitive advantage depends on the efficiency of knowledge
integration. The efficiency relies on (1) the level of common knowledge, (2) the frequency
and variability of integration of common and specialized knowledge, and (3) structures
that economize the communication needed for knowledge integration.
Grant (1996b, 1996a) further discusses the conditions leading to sustainable competitive
advantage. Its sustainability requires continuous renewal of organizational capabilities,
accomplished by two actions: (1) extension of existing capabilities to include new types
of knowledge, and (2) use of existing knowledge in new capabilities. Solely executing
either one of the actions may not be sufficient. As a result, the sustainability of the
competitive advantage is dependent on increasing the scope of knowledge integration
continuously. The conditions for sustainable competitive advantage are illustrated in
Figure 17.
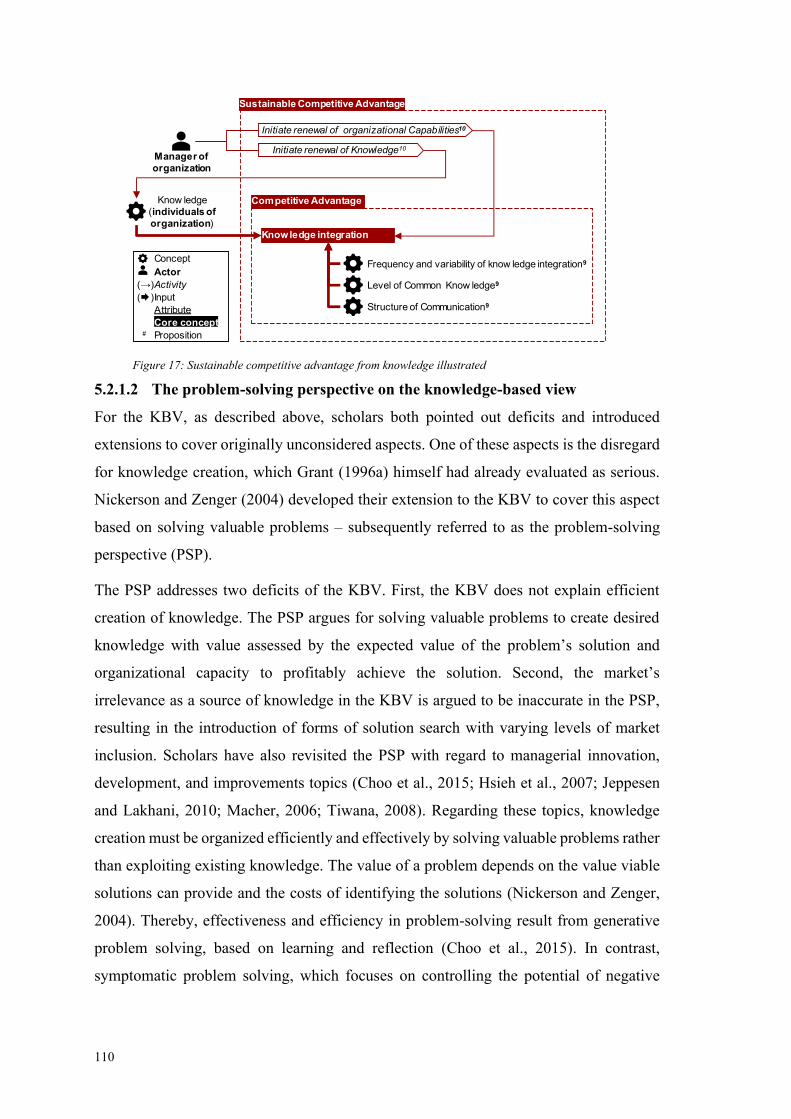
110
5.2.1.2 The problem-solving perspective on the knowledge-based view
For the KBV, as described above, scholars both pointed out deficits and introduced
extensions to cover originally unconsidered aspects. One of these aspects is the disregard
for knowledge creation, which Grant (1996a) himself had already evaluated as serious.
Nickerson and Zenger (2004) developed their extension to the KBV to cover this aspect
based on solving valuable problems – subsequently referred to as the problem-solving
perspective (PSP).
The PSP addresses two deficits of the KBV. First, the KBV does not explain efficient
creation of knowledge. The PSP argues for solving valuable problems to create desired
knowledge with value assessed by the expected value of the problem’s solution and
organizational capacity to profitably achieve the solution. Second, the market’s
irrelevance as a source of knowledge in the KBV is argued to be inaccurate in the PSP,
resulting in the introduction of forms of solution search with varying levels of market
inclusion. Scholars have also revisited the PSP with regard to managerial innovation,
development, and improvements topics (Choo et al., 2015; Hsieh et al., 2007; Jeppesen
and Lakhani, 2010; Macher, 2006; Tiwana, 2008). Regarding these topics, knowledge
creation must be organized efficiently and effectively by solving valuable problems rather
than exploiting existing knowledge. The value of a problem depends on the value viable
solutions can provide and the costs of identifying the solutions (Nickerson and Zenger,
2004). Thereby, effectiveness and efficiency in problem-solving result from generative
problem solving, based on learning and reflection (Choo et al., 2015). In contrast,
symptomatic problem solving, which focuses on controlling the potential of negative
Initiate renewal of Knowledge10
Level of Common Know ledge9
Frequency and variability of know ledge integration9
Structure of Communication9
Competitive Advantage
Sustainable Competitive Advantage
Manager of
organization
Initiate renewal of organizational Capabilities10
Know ledge
(individuals of
organization)Knowledge integration
Concept
Actor
(→)Activity
( )Input
Attribute
Core concept# Proposition
Figure 17: Sustainable competitive advantage from knowledge illustrated
111
outcomes – “fixing” a problem – does not contribute to knowledge creation and may
affect existing knowledge negatively.
The value of problems and their solutions in the PSP builds on Simon’s (1962, 1973)
study of complex systems. He argues for a problem’s generic concept being a goal state
that is produced from an initial state (Simon, 1962) and solving being a sequence of
processes that must be discovered to get from initial state to goal state. The complexity
of problems increases with increasing number of parts – knowledge sets needed for the
solution (Jeppesen and Lakhani, 2010) – that interact in a non-simple way. Complex
problems possess characteristics providing potentially valuable solutions and are
resultingly valuable (Nickerson and Zenger, 2004). Further, problems vary by the
definition of their structure. This definition represents an abstract degree of how well the
nature, substance or patterns of a problem are understood and known (Simon, 1962). The
definition of a problem locates it on a continuum between an ill-structured and well-
structured state (Simon, 1973). A problem is well structured if practical effort for solution
search is allowed by the existence of a problem space in which goal state, current states,
attainable state changes, and acquirable knowledge about the problem including a
reflection of external links can be represented with complete accuracy. Existence implies
access to relevant knowledge sets on the structure due to knowledge possession or
transfer, although this may be limited by the knowledge’s tacitness. The development of
a problem definition – discovering the various parts of the problem space – is argued to
be the solution search (Simon, 1973). Once the definition applicable to a problem is
complete, it can be used for other occurrences of the same problem, because unknown
knowledge set interactions are revealed and mastered such that the ill-structured problem
has changed to a well-structured one. How to solve it is now understood (Jeppesen and
Lakhani, 2010; Macher and Boerner, 2012).
The solution search consists of selective trials which uniquely combine chosen
knowledge and which are distinguished by their directional nature and heuristics
(Nickerson and Zenger, 2004; Simon, 1962). Directional search uses prior experience
about positive and negative outcomes and reinforces the search in the direction leading to
positive outcomes – “trial-and-error” – which is more suited for low knowledge set
interactions since it is prone to remain enclosed in a local solution area (Gavetti and
Levinthal, 2000; Hsieh et al., 2007; Nickerson and Zenger, 2004). In contrast, heuristics
are premised on beliefs about linkages between choices and actions, resulting in fewer
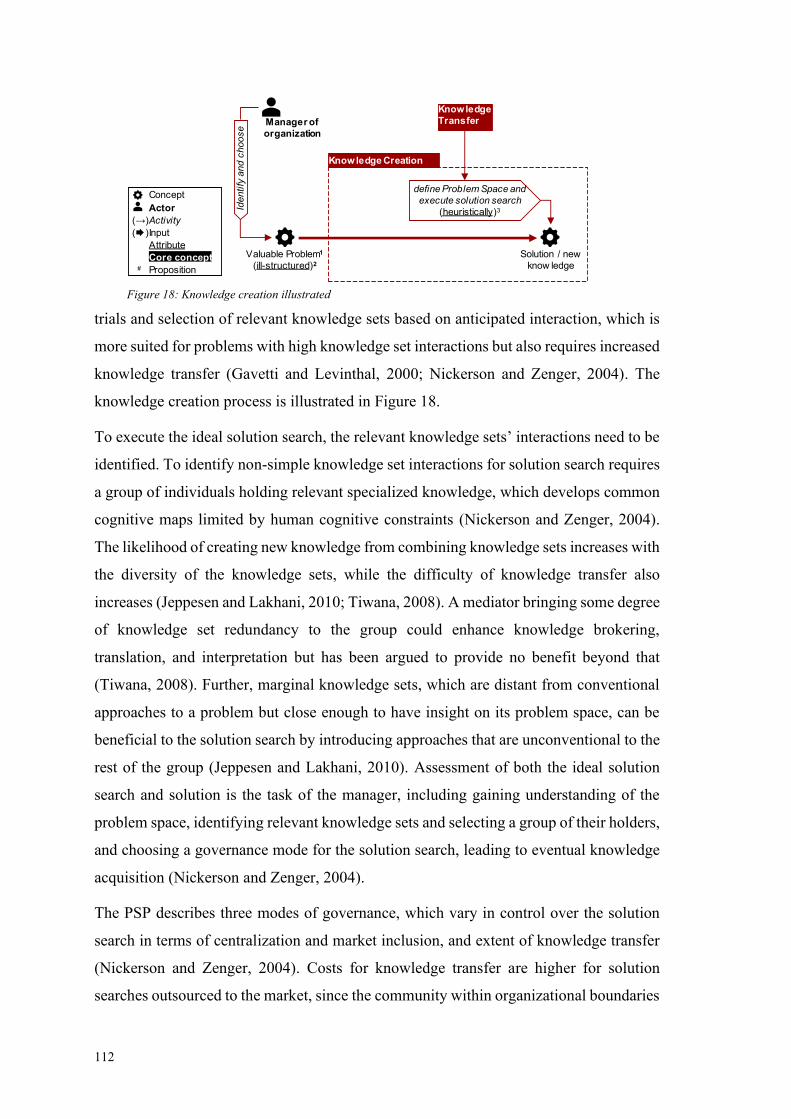
112
trials and selection of relevant knowledge sets based on anticipated interaction, which is
more suited for problems with high knowledge set interactions but also requires increased
knowledge transfer (Gavetti and Levinthal, 2000; Nickerson and Zenger, 2004). The
knowledge creation process is illustrated in Figure 18.
To execute the ideal solution search, the relevant knowledge sets’ interactions need to be
identified. To identify non-simple knowledge set interactions for solution search requires
a group of individuals holding relevant specialized knowledge, which develops common
cognitive maps limited by human cognitive constraints (Nickerson and Zenger, 2004).
The likelihood of creating new knowledge from combining knowledge sets increases with
the diversity of the knowledge sets, while the difficulty of knowledge transfer also
increases (Jeppesen and Lakhani, 2010; Tiwana, 2008). A mediator bringing some degree
of knowledge set redundancy to the group could enhance knowledge brokering,
translation, and interpretation but has been argued to provide no benefit beyond that
(Tiwana, 2008). Further, marginal knowledge sets, which are distant from conventional
approaches to a problem but close enough to have insight on its problem space, can be
beneficial to the solution search by introducing approaches that are unconventional to the
rest of the group (Jeppesen and Lakhani, 2010). Assessment of both the ideal solution
search and solution is the task of the manager, including gaining understanding of the
problem space, identifying relevant knowledge sets and selecting a group of their holders,
and choosing a governance mode for the solution search, leading to eventual knowledge
acquisition (Nickerson and Zenger, 2004).
The PSP describes three modes of governance, which vary in control over the solution
search in terms of centralization and market inclusion, and extent of knowledge transfer
(Nickerson and Zenger, 2004). Costs for knowledge transfer are higher for solution
searches outsourced to the market, since the community within organizational boundaries
Valuable Problem1
(ill-structured)2
Solution / new
know ledge
Knowledge Creation
Identify
and c
hoose
define Problem Space and
execute solution search
(heuristically)3
Knowledge
TransferManager of
organization
Concept
Actor
(→)Activity
( )Input
Attribute
Core concept# Proposition
Figure 18: Knowledge creation illustrated
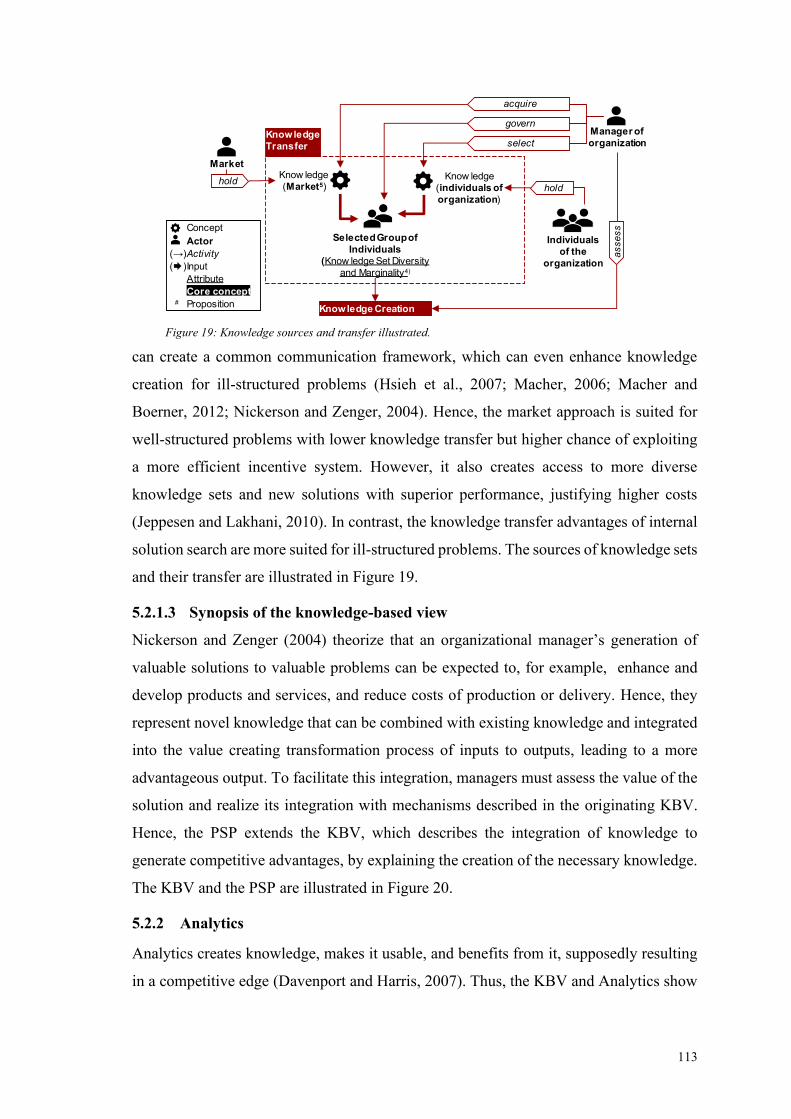
113
can create a common communication framework, which can even enhance knowledge
creation for ill-structured problems (Hsieh et al., 2007; Macher, 2006; Macher and
Boerner, 2012; Nickerson and Zenger, 2004). Hence, the market approach is suited for
well-structured problems with lower knowledge transfer but higher chance of exploiting
a more efficient incentive system. However, it also creates access to more diverse
knowledge sets and new solutions with superior performance, justifying higher costs
(Jeppesen and Lakhani, 2010). In contrast, the knowledge transfer advantages of internal
solution search are more suited for ill-structured problems. The sources of knowledge sets
and their transfer are illustrated in Figure 19.
5.2.1.3 Synopsis of the knowledge-based view
Nickerson and Zenger (2004) theorize that an organizational manager’s generation of
valuable solutions to valuable problems can be expected to, for example, enhance and
develop products and services, and reduce costs of production or delivery. Hence, they
represent novel knowledge that can be combined with existing knowledge and integrated
into the value creating transformation process of inputs to outputs, leading to a more
advantageous output. To facilitate this integration, managers must assess the value of the
solution and realize its integration with mechanisms described in the originating KBV.
Hence, the PSP extends the KBV, which describes the integration of knowledge to
generate competitive advantages, by explaining the creation of the necessary knowledge.
The KBV and the PSP are illustrated in Figure 20.
5.2.2 Analytics
Analytics creates knowledge, makes it usable, and benefits from it, supposedly resulting
in a competitive edge (Davenport and Harris, 2007). Thus, the KBV and Analytics show
Know ledge
(Market5)
Selected Group of
Individuals
(Know ledge Set Diversity
and Marginality4)
Knowledge
Transfer
Market
Know ledge
(individuals of
organization)
Individuals
of the
organization
Manager of
organization
acquire
govern
assess
select
holdhold
Knowledge Creation
Concept
Actor
(→)Activity
( )Input
Attribute
Core concept# Proposition
Figure 19: Knowledge sources and transfer illustrated.
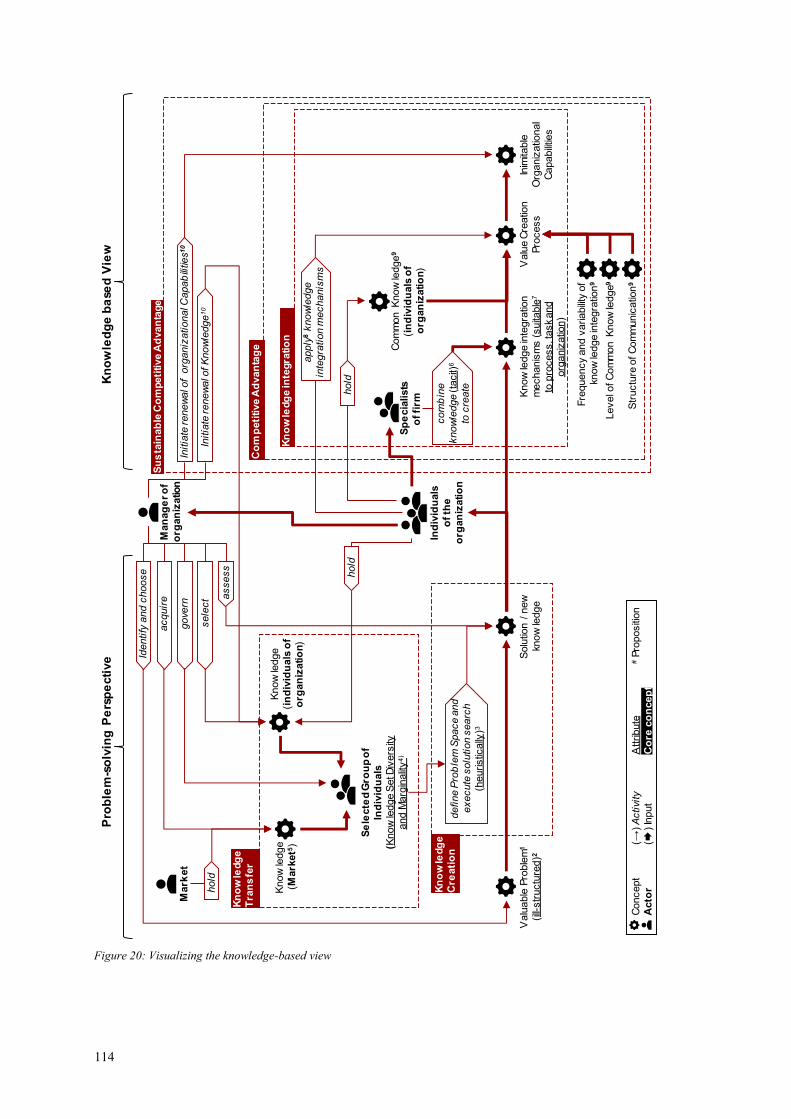
114
Valu
able
Pro
ble
m1
(ill-
str
uctu
red)2
Solu
tion /
new
know
ledge
Initia
te renew
al o
f K
now
ledge
10
Valu
e C
reatio
n
Pro
cess
Inim
itable
Org
aniz
atio
nal
Capabilitie
s
apply
8know
ledge
inte
gra
tion m
echanis
ms
Kn
ow
ledg
e in
tegra
tio
n
Level o
f C
om
mon K
now
ledge
9
Fre
quency a
nd v
ariability
of
know
ledge in
tegra
tion
9
Str
uctu
re o
f C
om
munic
atio
n9
Co
mp
eti
tive A
dvan
tag
e
Su
sta
inab
le C
om
peti
tive A
dvan
tage
Kn
ow
ledg
e
Cre
ati
on
Know
ledge
(Mark
et5
)
Identify
and c
hoose
define P
rob
lem
Space a
nd
execute
solu
tion s
earc
h
(heuristic
ally
)3
Se
lecte
d G
rou
p o
f
Ind
ivid
uals
(Know
ledge S
et D
ivers
ity
and M
arg
inalit
y4
)
Kn
ow
ledg
e
Tra
ns
fer
Pro
ble
m-s
olv
ing
Pe
rsp
ecti
ve
Kn
ow
led
ge
ba
sed
Vie
w
Mark
et
Know
ledge
(in
div
idu
als
of
org
an
izatio
n)
Ind
ivid
uals
of th
e
org
an
izatio
n
Sp
ecia
lists
of fi
rm
com
bin
e
know
ledge (ta
cit)
6
to c
reate
Com
mon K
now
ledge
9
(in
div
idu
als
of
org
an
izatio
n)
Man
ag
er o
f
org
an
izatio
n
acquir
e
gove
rn
assess
sele
ct
hold
hold
Initia
te renew
al o
f o
rganiz
ational C
apab
ilitie
s10
hold
Know
ledge in
tegra
tion
mechanis
ms (
suita
ble
7
to p
rocess, t
ask
and
org
aniz
atio
n)
Concept
(→) A
ctivi
tyA
ttribute
#Pro
positi
on
Acto
r(
) In
put
Co
re c
on
cep
t
Figure 20: Visualizing the knowledge-based view
115
a high degree of agreement at the macro level. The following section explores aspects on
which the KBV and Analytics agree on a more granular level.
While the concept of Analytics is still subject to debate, similar to Larson and Chang
(2016) and Holsapple et al. (2014), this study acknowledges related concepts such as
business intelligence, big data, and data science as intertwined with Analytics. A vague
distinction is of Analytics being focused on decision support in business processes,
business intelligence being either an overarching term or the provision of information,
big data being a technological advancement, and data science being advanced models and
algorithms, but this distinction cannot be applied consistently and each concept draws
from or depends on the others. With the decision support focus, which demands the
integration of analytical insight into a process, Analytics displays the most relevant and
leading concept for this research.
5.2.2.1 The process of Analytics initiatives
Holsapple et al. (2014, p. 134) provide a meta-definition for Analytics, which is
“concerned with evidence-based problem recognition and solving that happen within the
context of business situations”. Hence, solving a problem is at the core of Analytics
initiatives and should be the starting point of an Analytics initiative, since it is a
requirement for creating usable and valuable solutions, and it is a manager’s task to
identify this problem (Barton and Court, 2012; Bose, 2009; Marchand and Peppard,
2013). More specifically, “problem” can also be labeled business objective (Seddon et
al., 2017; Viaene and Bunder, 2011), business question (Bose, 2009; Larson and Chang,
2016), or an opportunity to exploit (Barton and Court, 2012). Absence of this predefined
purpose is indicated to result in a waste of resources, creating skepticism towards
Analytics rather than data-driven improvement (Lavalle et al., 2011).
Thus, Analytics is endorsed for a focus on handling modern complexity such as dynamic
interrelationships and increasing complexity of market and organizational activities, and
for challenging established business practices, with extraordinary requirements for
precision, accuracy, and speed (Holsapple et al., 2014; Kiron et al., 2012, 2014; Marchand
and Peppard, 2013). Further, complexity originates from extensive information and data
flows (Beer, 2018; Bose, 2009) or uncertainty (Viaene and Bunder, 2011). This requires
technically complicated analytical methods with uncertain suitability to the problem and
the involvement of various, interacting specialists (Carillo, 2017; Davenport and Harris,
2007; Viaene and Bunder, 2011).
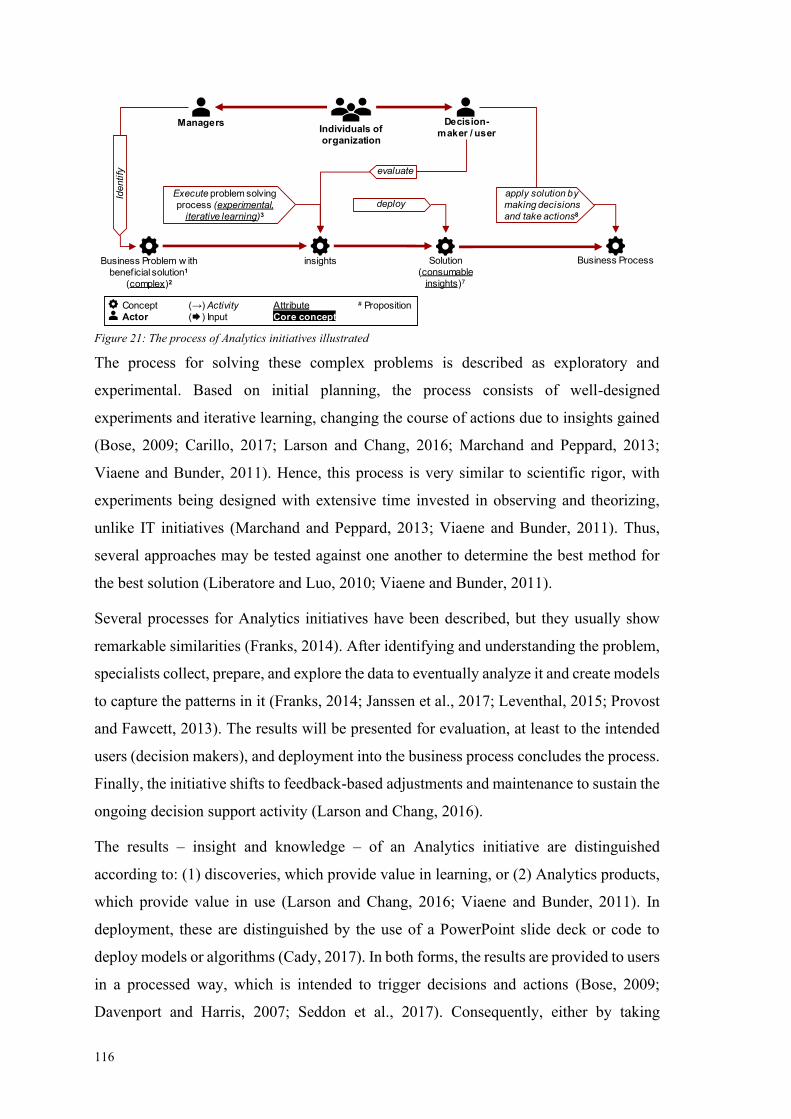
116
The process for solving these complex problems is described as exploratory and
experimental. Based on initial planning, the process consists of well-designed
experiments and iterative learning, changing the course of actions due to insights gained
(Bose, 2009; Carillo, 2017; Larson and Chang, 2016; Marchand and Peppard, 2013;
Viaene and Bunder, 2011). Hence, this process is very similar to scientific rigor, with
experiments being designed with extensive time invested in observing and theorizing,
unlike IT initiatives (Marchand and Peppard, 2013; Viaene and Bunder, 2011). Thus,
several approaches may be tested against one another to determine the best method for
the best solution (Liberatore and Luo, 2010; Viaene and Bunder, 2011).
Several processes for Analytics initiatives have been described, but they usually show
remarkable similarities (Franks, 2014). After identifying and understanding the problem,
specialists collect, prepare, and explore the data to eventually analyze it and create models
to capture the patterns in it (Franks, 2014; Janssen et al., 2017; Leventhal, 2015; Provost
and Fawcett, 2013). The results will be presented for evaluation, at least to the intended
users (decision makers), and deployment into the business process concludes the process.
Finally, the initiative shifts to feedback-based adjustments and maintenance to sustain the
ongoing decision support activity (Larson and Chang, 2016).
The results – insight and knowledge – of an Analytics initiative are distinguished
according to: (1) discoveries, which provide value in learning, or (2) Analytics products,
which provide value in use (Larson and Chang, 2016; Viaene and Bunder, 2011). In
deployment, these are distinguished by the use of a PowerPoint slide deck or code to
deploy models or algorithms (Cady, 2017). In both forms, the results are provided to users
in a processed way, which is intended to trigger decisions and actions (Bose, 2009;
Davenport and Harris, 2007; Seddon et al., 2017). Consequently, either by taking
Business Problem w ith
beneficial solution1
(complex)2
insights
Execute problem solving
process (experimental,
iterative learning)3
Individuals of
organization
Solution
(consumable
insights)7
deploy
Decision-
maker / user
apply solution by
making decisions
and take actions8
ManagersId
entify evaluate
Business Process
Concept (→) Activity Attribute # Proposition
Actor ( ) Input Core concept
Figure 21: The process of Analytics initiatives illustrated
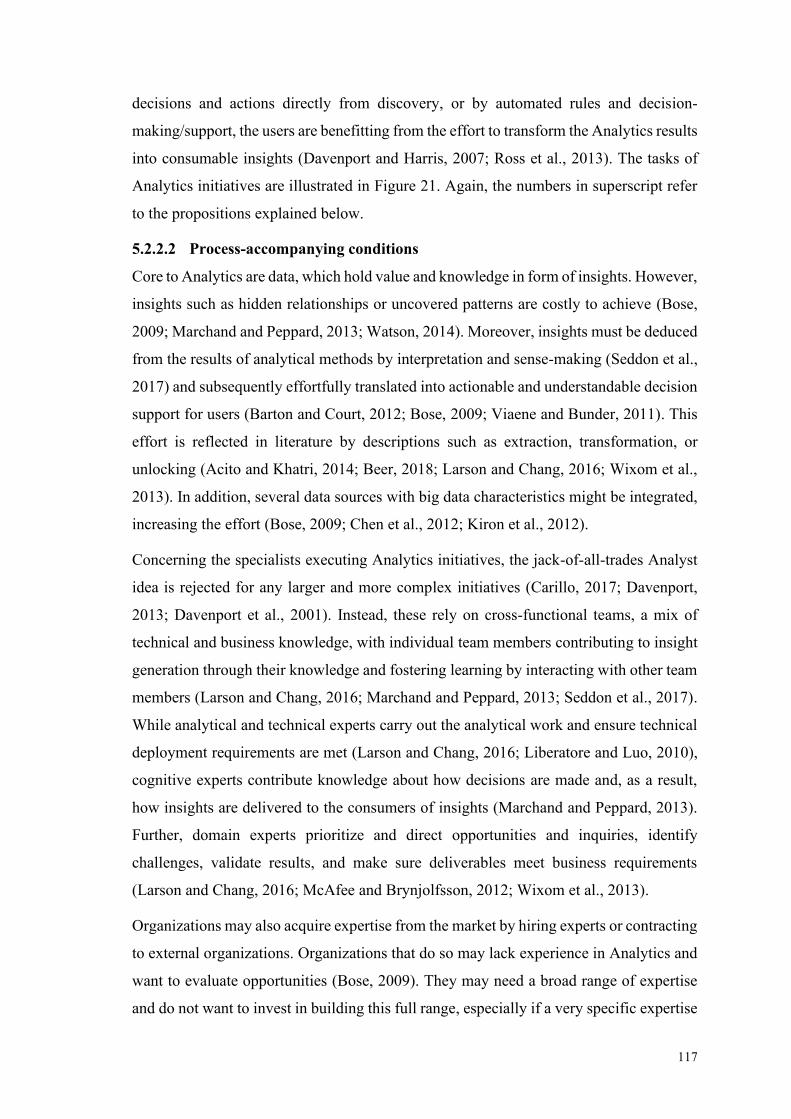
117
decisions and actions directly from discovery, or by automated rules and decision-
making/support, the users are benefitting from the effort to transform the Analytics results
into consumable insights (Davenport and Harris, 2007; Ross et al., 2013). The tasks of
Analytics initiatives are illustrated in Figure 21. Again, the numbers in superscript refer
to the propositions explained below.
5.2.2.2 Process-accompanying conditions
Core to Analytics are data, which hold value and knowledge in form of insights. However,
insights such as hidden relationships or uncovered patterns are costly to achieve (Bose,
2009; Marchand and Peppard, 2013; Watson, 2014). Moreover, insights must be deduced
from the results of analytical methods by interpretation and sense-making (Seddon et al.,
2017) and subsequently effortfully translated into actionable and understandable decision
support for users (Barton and Court, 2012; Bose, 2009; Viaene and Bunder, 2011). This
effort is reflected in literature by descriptions such as extraction, transformation, or
unlocking (Acito and Khatri, 2014; Beer, 2018; Larson and Chang, 2016; Wixom et al.,
2013). In addition, several data sources with big data characteristics might be integrated,
increasing the effort (Bose, 2009; Chen et al., 2012; Kiron et al., 2012).
Concerning the specialists executing Analytics initiatives, the jack-of-all-trades Analyst
idea is rejected for any larger and more complex initiatives (Carillo, 2017; Davenport,
2013; Davenport et al., 2001). Instead, these rely on cross-functional teams, a mix of
technical and business knowledge, with individual team members contributing to insight
generation through their knowledge and fostering learning by interacting with other team
members (Larson and Chang, 2016; Marchand and Peppard, 2013; Seddon et al., 2017).
While analytical and technical experts carry out the analytical work and ensure technical
deployment requirements are met (Larson and Chang, 2016; Liberatore and Luo, 2010),
cognitive experts contribute knowledge about how decisions are made and, as a result,
how insights are delivered to the consumers of insights (Marchand and Peppard, 2013).
Further, domain experts prioritize and direct opportunities and inquiries, identify
challenges, validate results, and make sure deliverables meet business requirements
(Larson and Chang, 2016; McAfee and Brynjolfsson, 2012; Wixom et al., 2013).
Organizations may also acquire expertise from the market by hiring experts or contracting
to external organizations. Organizations that do so may lack experience in Analytics and
want to evaluate opportunities (Bose, 2009). They may need a broad range of expertise
and do not want to invest in building this full range, especially if a very specific expertise
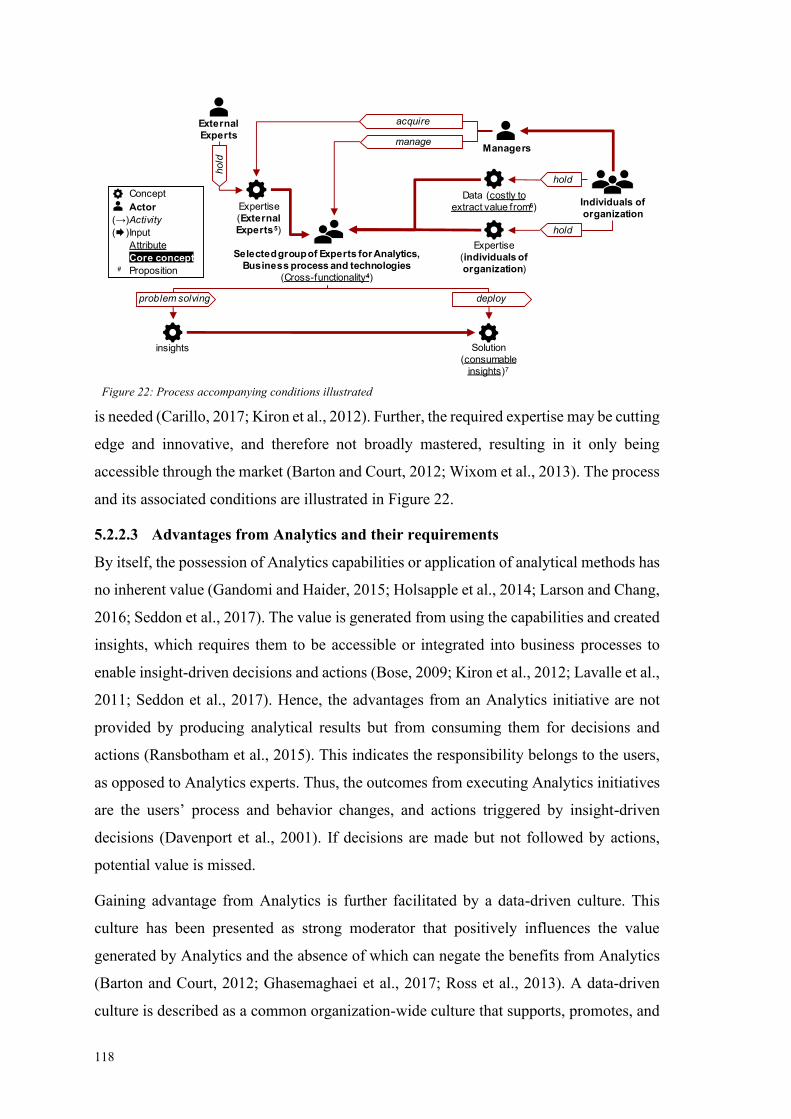
118
is needed (Carillo, 2017; Kiron et al., 2012). Further, the required expertise may be cutting
edge and innovative, and therefore not broadly mastered, resulting in it only being
accessible through the market (Barton and Court, 2012; Wixom et al., 2013). The process
and its associated conditions are illustrated in Figure 22.
5.2.2.3 Advantages from Analytics and their requirements
By itself, the possession of Analytics capabilities or application of analytical methods has
no inherent value (Gandomi and Haider, 2015; Holsapple et al., 2014; Larson and Chang,
2016; Seddon et al., 2017). The value is generated from using the capabilities and created
insights, which requires them to be accessible or integrated into business processes to
enable insight-driven decisions and actions (Bose, 2009; Kiron et al., 2012; Lavalle et al.,
2011; Seddon et al., 2017). Hence, the advantages from an Analytics initiative are not
provided by producing analytical results but from consuming them for decisions and
actions (Ransbotham et al., 2015). This indicates the responsibility belongs to the users,
as opposed to Analytics experts. Thus, the outcomes from executing Analytics initiatives
are the users’ process and behavior changes, and actions triggered by insight-driven
decisions (Davenport et al., 2001). If decisions are made but not followed by actions,
potential value is missed.
Gaining advantage from Analytics is further facilitated by a data-driven culture. This
culture has been presented as strong moderator that positively influences the value
generated by Analytics and the absence of which can negate the benefits from Analytics
(Barton and Court, 2012; Ghasemaghaei et al., 2017; Ross et al., 2013). A data-driven
culture is described as a common organization-wide culture that supports, promotes, and
insights
problem solving
Individuals of
organization
Solution
(consumable
insights)7
deploy
Selected group of Experts for Analytics,
Business process and technologies
(Cross-functionality4)
External
Experts
Data (costly to
extract value from6)
hold
acquire
manage
Expertise
(individuals of
organization)
hold
Expertise
(External
Experts5)hold
Managers
Concept
Actor
(→)Activity
( )Input
Attribute
Core concept# Proposition
Figure 22: Process accompanying conditions illustrated
119
embeds shared analytics-driven ways of thinking, decision-making, and acting, and
accepts data and information as critical for success (Barton and Court, 2012; Holsapple
et al., 2014; Kiron et al., 2012). A data-driven culture supports a high degree of use of
analytical tools to derive insights organization-wide, and demands decision-making and
even challenging of prior beliefs based on the insight, which requires analytical skills and
literacy (Barton and Court, 2012; Kiron et al., 2012; Marchand and Peppard, 2013).
Insights are proposed to be generated and used at high frequency, such as by using
insights in daily operations, making insights easy accessible on mobile devices, and
continuously coaching staff to shift to data-driven decision-making (Barton and Court,
2012; Kiron et al., 2012; Ross et al., 2013; Wixom et al., 2013). To achieve the aspired-
to degree and frequency, organizational structures are established in the form of
strategies, policies, processes, and standards (especially for data) supporting the use of
analytical tools, communication of analytical needs, and the use of the generated insight
(Cao et al., 2015; Davenport et al., 2001; Ross et al., 2013).
The value gained from solutions resulting from Analytics initiatives is not durable. To
ensure long-term value, Analytics solutions must be maintained and newly created. For
maintenance, user feedback and business outcome have to be analyzed and evaluated to
stabilize, adjust, and improve the solution (Larson and Chang, 2016; Lavalle et al., 2011;
Liberatore and Luo, 2010). Further, the solutions can become outdated or misaligned,
especially due to changes in data or the deployment environment, demanding realignment
and adjustment to changes (Larson and Chang, 2016; Ross et al., 2013). Eventually, new
forms of data can become available and can be integrated (Beer, 2018). In contrast,
Solution
maintenance10
Data Driven Culture9
(individuals of firm)
Solution
(consumable
insights)7
Decision-
maker / user apply solution by
making decisions
and take actions8
Long-term
organizational value
hold
Frequency of applying Analytics solutions9
Degree of applying Analytics solutions9
Organizational structure of supporting the application
of Analytics solutions9
give feedback
Managers evaluate business outcome
Business Process
initiate integration of new data
create new initiatives
Concept
Actor
(→)Activity
( )Input
Attribute
Core concept# Proposition
Figure 23: Enabling advantages from Analytics illustrated
120
creating new initiatives may include the introduction of completely new solutions or of
already beneficial solutions to new organizational functions (Seddon et al., 2017). The
former is necessary due to the limited lifespan of solutions in the absence of further
adaptations or adjustments (Ghasemaghaei et al., 2017; Larson and Chang, 2016). The
latter is necessary to broaden the range of functionalities supported by Analytics based
on new needs and the intent to distribute the value from Analytics broadly across the
organization (Beer, 2018; Davenport and Harris, 2007; Lavalle et al., 2011). These
requirements to sustain the advantages from Analytics are illustrated in Figure 23.
Finally, direct attribution of value and benefits from Analytics is usually challenging
(Larson and Chang, 2016). Direct effects are more effective, more informed, and faster
decisions (Bose, 2009; Cao et al., 2015; Ghasemaghaei et al., 2017), which result in
indirect effects, which are hard to attribute, such as improved decision outcomes,
improved performance, production of knowledge, differentiation from competitors,
individualization of goods and services, increased productivity, and increased
profitability, while outperforming less analytics-driven competitors (Barton and Court,
2012; Bose, 2009; Holsapple et al., 2014; Kiron et al., 2012; Lavalle et al., 2011;
Marchand and Peppard, 2013). The process of Analytics initiatives creating advantages
for organizations is illustrated in Figure 24.
5.2.3 Parallelism of knowledge-based view and Analytics
The discussion above has presented KBV’s theoretical argumentation for competitive
advantage generated from integrating and applying knowledge and the practical Analytics
processes for generating advantages from analyzing data and applying the results. Both
demonstrate immense similarity, assuming data to represent one of several portions of an
organization’s knowledge. To answer the research question, Analytics is now examined
for the rationale behind the practices. This rationale is compared for its resemblance to
the argumentation of the KBV. In this research, confirming this resemblance is argued to
provide support for an explanation of the competitive advantage generated from
Analytics. If the empirical evidence does not show resemblance, either between the
practices or the rationale for those practices, the explanation of generating competitive
advantage from Analytics based on the KBV is not supported.
Consequently, components of the KBV have been selected and inquiries for empirical
evidence have been made for practices in Analytics with respect to those components,
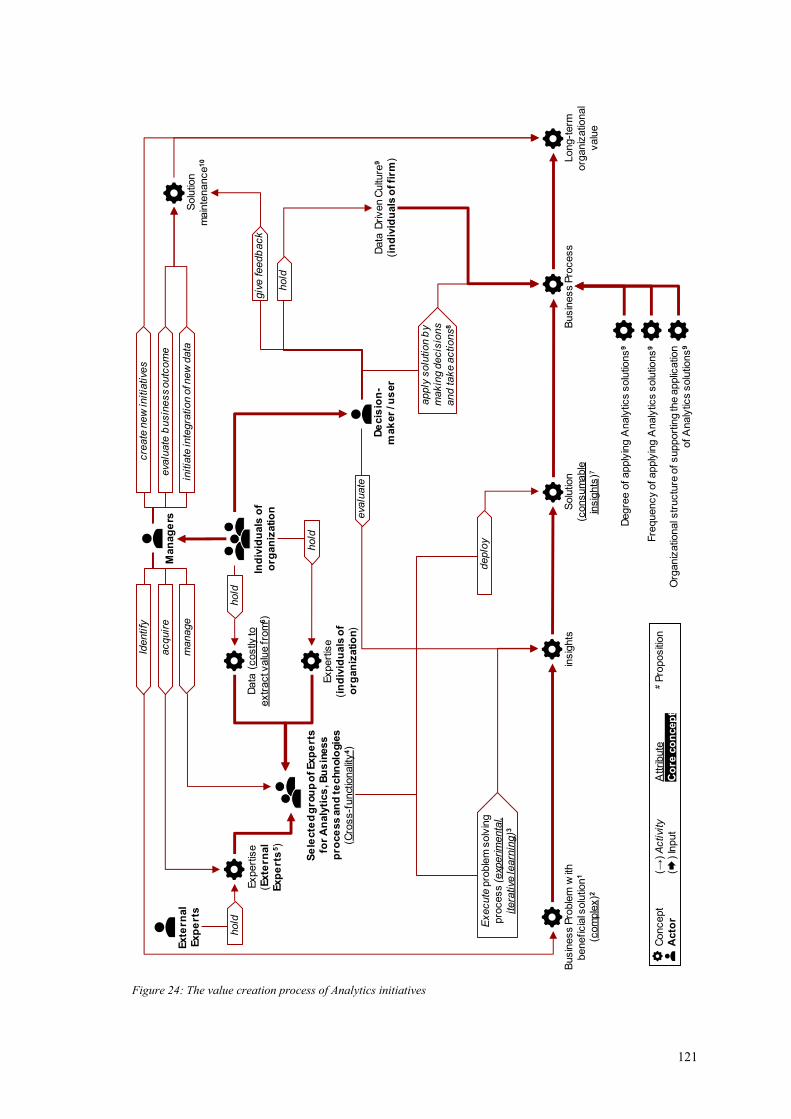
121
Busin
ess P
roble
m w
ith
beneficia
l solu
tion
1
(com
ple
x)2
insig
hts
Se
lecte
d g
rou
p o
f Exp
ert
s
for
An
aly
tics
, Bu
sin
ess
pro
ce
ss a
nd
te
chn
olo
gie
s
(Cro
ss-f
unct
ionalit
y4)
Execute
pro
ble
m s
olv
ing
pro
cess
(exp
erim
enta
l,
itera
tive
learn
ing
)3
Exte
rnal
Exp
ert
sS
olu
tion
main
tenance
10
Data
Driven C
ultu
re9
(in
div
idu
als
of fi
rm)
Data
(costly
to
extr
act v
alu
e fro
m6)
Ind
ivid
uals
of
org
an
izatio
n
hold
Solu
tion
(consum
able
insig
hts
)7
deplo
y
De
cis
ion
-
mak
er
/ us
er
apply
solu
tion b
y
makin
g d
ecis
ions
and take a
ctions
8
Long-t
erm
org
aniz
atio
nal
valu
e
hold
Fre
quency o
f apply
ing A
naly
tics s
olu
tions
9
Degre
e o
f apply
ing A
naly
tics s
olu
tions
9
Org
aniz
atio
nal s
tructu
re o
f support
ing th
e a
pplic
atio
n
of A
naly
tics s
olu
tions
9
giv
e feedb
ack
Man
ag
ers
Identify
eva
luate
busin
ess
outc
om
e
Busin
ess P
rocess
eva
luate
acquir
e
manage
initia
te in
tegra
tion o
f new
data
cre
ate
new
initia
tive
s
Expert
ise
(in
div
idu
als
of
org
an
izatio
n)
hold
Expert
ise
(Exte
rnal
Exp
ert
s5)
hold
Concept
(→) A
ctivi
tyA
ttribute
#Pro
positi
on
Acto
r(
) In
put
Co
re c
on
cep
t
Figure 24: The value creation process of Analytics initiatives

122
including their rationale. The selected components represent key points of the
argumentation for generating competitive advantage, which can provide proposed
explanations – propositions – for practices in Analytics due to the resemblance between
Analytics and the KBV. While the theoretical background presents practices in Analytics
to provide evidence for their noticeable resemblance to the KBV and to formulate
propositions, they will be treated as unknowns in the data collection. Data collection will
also include collecting empirical evidence to explain different practices based on different
intentions to disconfirm the KBV–Analytics resemblance, if in fact it does not exist.
The first selected component is the starting position, which consists of valuable problems
to solve for knowledge creation in the KBV. These resemble the Analytics starting point
of business problems to solve:
(1) Proposition 1: The most promising start for an Analytics initiative is supposed to
be a problem (business question, business problem, opportunity to exploit,
business target).
Second, the proposed foci of Analytics initiatives are complex issues with unprecedented
requirements, which resemble potentially valuable ill-structured problems with high
knowledge set interaction. Unprecedented expresses the characteristic of being unsolved
for ill-structured problems:
(2) Proposition 2: Analytics initiatives intended to create highly valuable solutions
are focused on complex issues with unprecedented requirements.
Third, the KBV suggests the heuristics solution search approach for ill-structured
problems, resembling the scientific approach of iterative learning in Analytics:
(3) Proposition 3: The problem-solving process is an iterative learning process with
experiments/tests of solutions giving direction for the next solution iteration.
The fourth component is the knowledge set diversity endorsed in the KBV, which
expands the range of solutions, enabled by diverse individuals holding knowledge and
taking different roles or specializations. It resembles the cross-functionality of teams
contributing to data analysis:
(4) Proposition 4: Diverse roles in an initiative are relevant and covered by a selected
cross-functional team with various different perspectives, expertise, and
knowledge.
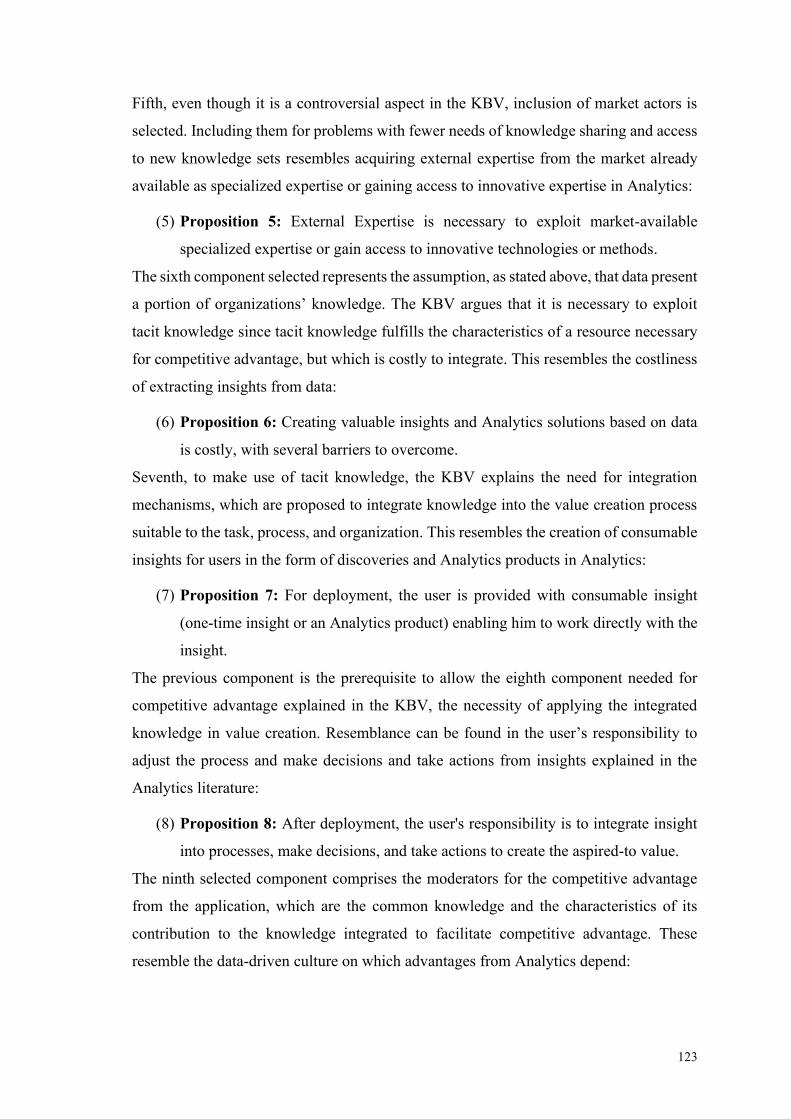
123
Fifth, even though it is a controversial aspect in the KBV, inclusion of market actors is
selected. Including them for problems with fewer needs of knowledge sharing and access
to new knowledge sets resembles acquiring external expertise from the market already
available as specialized expertise or gaining access to innovative expertise in Analytics:
(5) Proposition 5: External Expertise is necessary to exploit market-available
specialized expertise or gain access to innovative technologies or methods.
The sixth component selected represents the assumption, as stated above, that data present
a portion of organizations’ knowledge. The KBV argues that it is necessary to exploit
tacit knowledge since tacit knowledge fulfills the characteristics of a resource necessary
for competitive advantage, but which is costly to integrate. This resembles the costliness
of extracting insights from data:
(6) Proposition 6: Creating valuable insights and Analytics solutions based on data
is costly, with several barriers to overcome.
Seventh, to make use of tacit knowledge, the KBV explains the need for integration
mechanisms, which are proposed to integrate knowledge into the value creation process
suitable to the task, process, and organization. This resembles the creation of consumable
insights for users in the form of discoveries and Analytics products in Analytics:
(7) Proposition 7: For deployment, the user is provided with consumable insight
(one-time insight or an Analytics product) enabling him to work directly with the
insight.
The previous component is the prerequisite to allow the eighth component needed for
competitive advantage explained in the KBV, the necessity of applying the integrated
knowledge in value creation. Resemblance can be found in the user’s responsibility to
adjust the process and make decisions and take actions from insights explained in the
Analytics literature:
(8) Proposition 8: After deployment, the user's responsibility is to integrate insight
into processes, make decisions, and take actions to create the aspired-to value.
The ninth selected component comprises the moderators for the competitive advantage
from the application, which are the common knowledge and the characteristics of its
contribution to the knowledge integrated to facilitate competitive advantage. These
resemble the data-driven culture on which advantages from Analytics depend:

124
(9) Proposition 9: To enhance the value from Analytics, a data-driven culture has to
be built, which is facilitated in Analytics' broad and frequent use, and supporting
organizational structures.
Tenth and finally, to make the competitive advantage sustainable, the organizational
capabilities from knowledge integration, including knowledge concerning existing
capabilities, need constant renewal, which resembles the maintenance of Analytics
solutions and their renewed creation to ensure long-term advantages from Analytics:
(10) Proposition 10: To maintain value generated by insights and solutions in the
long-term, maintenance processes based on added data, evaluation of business
outcomes, and user feedback are necessary.
The proposed resemblance has two implications. First, if a process to exploit
organizational resources exists that leads to advantages and benefits, is employed by
organizations, and markedly resembles the knowledge-based view, it would contribute to
the validation of the knowledge-based view. Second, if this remarkable resemblance is
confirmed and as a result the Analytics process fits the KBV, the advantage from the
process would be competitive advantage.
5.3 Methodology
This research aspires to explain how competitive advantage is generated from Analytics.
The foundation for that explanation was laid in the theoretical background and the
resulting propositions are subsequently tested using empirical evidence. For “How?”
questions, the methodology of case studies is appropriate (Yin, 2014). Case study
research has been used to confirm the link between scientific theories and phenomena by
scholars in information technology and strategic management. For example, business
practices and investments have been linked to the resource-based view and the extended
resource-based view to argue for competitive advantage as a benefit of these models
(Lewis et al., 2010). A combination of contingency theory, dynamic capabilities theory,
and task/technology-fit was used to provide a theoretical basis for the field of Business
Process Management (Trkman, 2010), and the resource-based view and the related
concept of resource orchestration has been used to explore how manufacturers adopt e-
commerce (Cui and Pan, 2015). Seuring (2008) has underlined the benefits and demand
for empirically based case study research to enhance understanding of supply chain
management.
125
5.3.1 Research Design
Case study research can be deployed in a way that is exploratory and/or explanatory (Yin,
2014), and this study aspires to the latter. Hence, prior to data collection, literature was
studied to develop a conceptional framework and testable propositions (Miles et al., 2014;
Voss et al., 2002; Yin, 2014). The conceptional frameworks are presented in Figure 20
and Figure 24. The propositions are presented in Section 5.2.3. The first framework
comprises key components of the KBV, which provide a theoretical explanation for
sustainable competitive advantage generated from knowledge. The second framework
comprises recommended practices for Analytics initiatives that the literature has
established as relevant for generating benefits and value, but with limited rationale for
their relevance. Using the first framework as reference, case study research is employed
to provide empirical evidence to confirm the sustainable competitive advantage generated
by Analytics by explaining causal relationships thoroughly. This design fits the case study
research objective of providing a causal diagnostic pursued with a pathway strategy that
is expected to identify the mechanisms explaining the relationship under investigation
and show its plausibility (Gerring and Cojocaru, 2016).
For the causal diagnostic pathway strategy, a multiple-case study approach is
recommended, preferably with stable background factors (Gerring and Cojocaru, 2016).
This stable background is implemented by constraining the study to the field of LSCM.
This field is exceedingly familiar to the scholars conducting the research. Due to several
globally dispersed actors in the varying flows of materials, information, and funds, this
field experiences a high level of complexity and process heterogeneity (Bowersox et al.,
2007; Simchi-Levi et al., 2003; Wang et al., 2014), which entails potentially interesting
cases for Analytics solutions employed for controlling the flows. In accordance, LSCM
is considered as an early adopter of Analytics (Davenport, 2009) and is considered as a
data rich field with promising returns from Analytics (Jeske et al., 2013; Kiron et al.,
2012). Despite these circumstances, many organizations in LSCM show reluctance
towards Analytics adoption (Brinch et al., 2018; Kersten et al., 2017; Thieullent et al.,
2016), although this audience might develop greater interest based on research insights
into Analytics associated with their own field, and may eventually be persuaded regarding
the value and benefits.
Selecting cases from any field regarding Analytics initiatives brings foreseeable issues of
limited availability and willingness of experts to respond to research inquiries. Relevant
126
and identifiable experts for data collection are rare and in high demand. Further, with
Analytics expected to create advantages over the competition, it cannot be expected that
extensive internal documentation will be provided. In summary, it is foreseeable that
limited depth can be achieved per case. However, critical analysis of case study research
has demonstrated acceptance for limited depth in multi-case research, since multiple cases
supporting the results increase the confidence and robustness of results, and provide more
sophisticated descriptions and more powerful explanations (Miles et al., 2014; Voss et
al., 2002; Yin, 2014). As a result, a multiple case study was seen as appropriate to counter
accessibility issues while adhering to constraints of time and resources. Further, to
increase accessibility, the cultural and language distance to this study was kept short by
limiting the sample to organizations operating in Germany. A final number of eight cases
was achieved. These cases were theoretically sampled such that they were chosen
explicitly – not randomly – to achieve greater insights (Eisenhardt, 1989).
5.3.2 Data Collection
Following established instructions (Voss et al., 2002; Yin, 2014), a case protocol was
created, including research design, case selection criteria, relevant sources of evidence,
and interview questions. The protocol was reviewed by two scholars and adapted
accordingly. The sources of evidence to be collected included semi-structured interviews,
relevant presentations by interviewees and case organizations, relevant publicly available
documents from case organizations on LinkedIn, Xing, organizations’ websites, as well
as blog entries, videos, and white papers, in addition to third party reports and articles
about the case organizations on relevant topics. These sources of evidence were chosen
for triangulation (Yin, 2014). The questions were designed to openly ask about aspects of
Analytics initiatives, with implied unknowingness, to encourage interviewees to provide
detailed explanations and reasoning (Yin, 2014). Further, inspired by descriptions on rival
explanations/alternative theories (Voss et al., 2002; Yin, 2014), rival explanations about
the generation of value from Analytics were developed prior to the data collection and
reviewed by scholars, showing a high degree of disjunction among the propositions. The
data collection was expanded to include these rival theories. Thus, after answering the
open questions about the process aspects in the semi-structured interviews, the
interviewees were asked about other explanations (rivals or propositions, depending on
the open answer) to obtain their comments on all explanations. Typically, interviewees
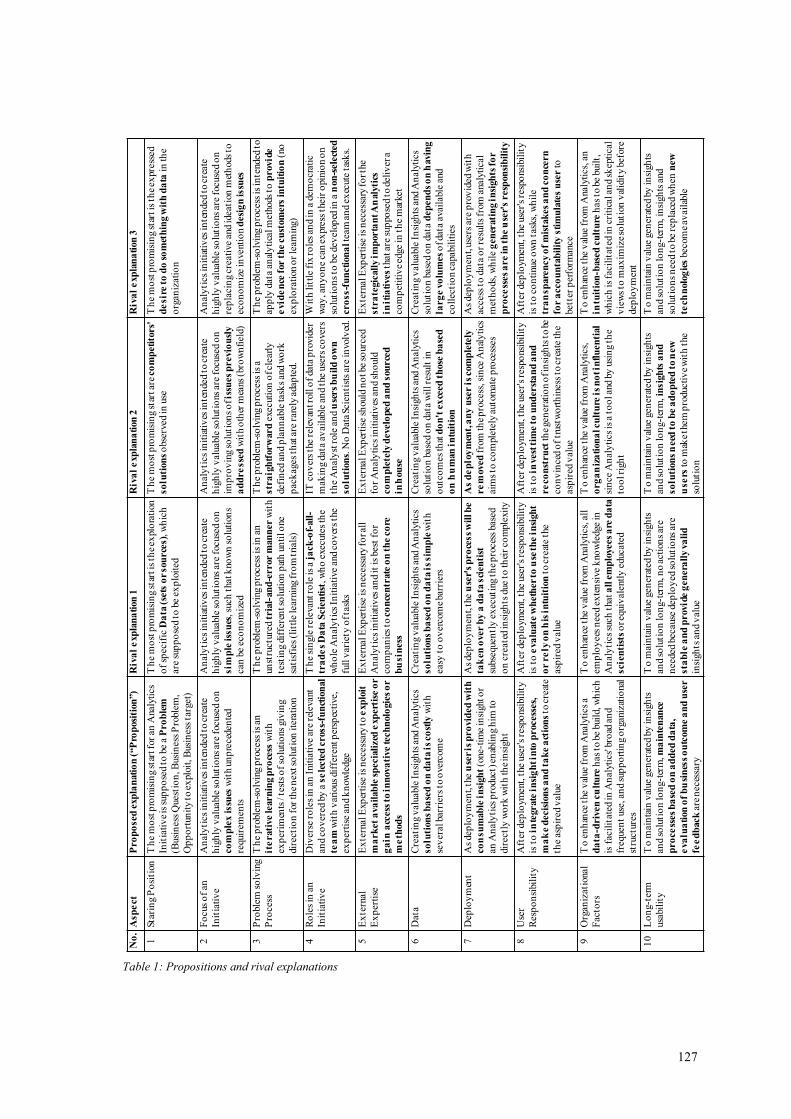
127
No
.A
sp
ect
Pro
po
sed
exp
lan
ati
on
(“P
rop
osi
tion
”)
Riv
al
exp
lan
ati
on
1R
iva
l e
xp
lan
ati
on
2R
iva
l e
xp
lan
ati
on
3
1St
arin
g P
osi
tion
Th
e m
ost
pro
mis
ing
star
t for
an
Ana
lyti
cs
Init
iati
ve
is s
up
po
sed t
o b
e a
Pro
ble
m
(Busi
nes
s Q
ues
tio
n, B
usi
nes
s P
roble
m,
Op
po
rtun
ity
to e
xpl
oit,
Bus
ines
s ta
rget
)
Th
e m
ost
pro
mis
ing
star
t is
the
expl
ora
tion
of
spec
ific
Da
ta (
sets
or
sou
rce
s),
wh
ich
are
sup
po
sed t
o b
e ex
plo
ited
Th
e m
ost
pro
mis
ing
star
t are
co
mp
eti
tors'
so
luti
on
so
bse
rved
in
use
Th
e m
ost
pro
mis
ing
star
t is
the
expr
esse
d
de
sir
e t
o d
o s
om
eth
ing w
ith
da
tain
th
e
org
aniz
atio
n
2F
ocu
s o
f an
Init
iati
ve
An
aly
tics
in
itia
tiv
es in
ten
ded
to c
reat
e
hig
hly
val
uabl
e so
luti
ons
are
foc
used
on
co
mp
lex
issu
es w
ith u
np
rece
den
ted
requir
emen
ts
An
aly
tics
in
itia
tiv
es in
ten
ded
to c
reat
e
hig
hly
val
uabl
e so
luti
ons
are
foc
used
on
sim
ple
iss
ues
, such
that
kno
wn
so
luti
on
s
can
be
eco
no
miz
ed
An
aly
tics
in
itia
tiv
es in
ten
ded
to c
reat
e
hig
hly
val
uabl
e so
luti
ons
are
foc
used
on
imp
rov
ing s
olu
tion
s o
f is
sues
previo
usl
y
ad
dre
sse
dw
ith o
ther
mea
ns
(bro
wn
fiel
d)
An
aly
tics
in
itia
tiv
es in
ten
ded
to c
reat
e
hig
hly
val
uabl
e so
luti
ons
are
foc
used
on
rep
laci
ng c
reat
ive
and idea
tion
met
hods
to
eco
no
miz
e in
ven
tio
nd
esi
gn
issu
es
3P
robl
em s
olv
ing
Pro
cess
Th
e p
robl
em-s
olv
ing
pro
cess
is a
n
ite
rati
ve learn
ing p
ro
cess
wit
h
exp
erim
ents
/ te
sts
of
solu
tio
ns g
ivin
g
dire
ctio
n f
or th
e n
ext s
olu
tion
iter
atio
n
Th
e p
robl
em-s
olv
ing
pro
cess
is in
an
un
stru
cture
d t
ria
l-an
d-e
rror m
an
ner
wit
h
test
ing
diff
eren
t so
luti
on p
ath
un
til o
ne
sati
sfie
s (l
ittl
e le
arni
ng f
rom
tri
als)
Th
e p
robl
em-s
olv
ing
pro
cess
is a
str
aig
htf
orw
ard
exec
uti
on
of cl
earl
y
defi
ned
an
d p
lan
nab
le ta
sks
and
wo
rk
pac
kag
es t
hat
are
rar
ely
adap
ted.
Th
e p
robl
em-s
olv
ing
pro
cess
is in
tend
ed t
o
app
ly d
ata
anal
yti
cal m
ethods
to p
rovid
e
evid
en
ce f
or t
he c
ust
om
ers
in
tuit
ion
(no
exp
lora
tion
or
lear
nin
g)
4R
ole
s in
an
Init
iati
ve
Div
erse
ro
les
in a
n I
nit
iati
ve
are
rele
van
t
and
cov
ered
by
a s
ele
cte
d c
ross-
fun
ctio
nal
tea
m w
ith
var
ious
dif
fere
ntp
ersp
ecti
ve,
exp
erti
se a
nd k
now
ledge
Th
e si
ngle
rel
evan
t ro
le is
a ja
ck
-of-
all
-
tra
de
s D
ata
Scie
nti
st, w
ho
exe
cute
s th
e
wh
ole
An
aly
tics
In
itia
tive
and c
ov
ers
the
full
var
iety
of ta
sks
IT c
ov
ers
the
rele
van
t ro
ll o
f dat
a p
rovid
er
mak
ing
data
av
aila
ble
and
the
user
s co
vers
the
An
aly
st r
ole
an
d u
sers
bu
ild
ow
n
so
luti
on
s. N
o D
ata
Scie
nti
sts
are
in
volv
ed.
Wit
h lit
tle
fix r
ole
s an
d in
a d
emo
crat
ic
way
, an
yo
ne
can
expr
ess
thei
r o
pini
on
on
solu
tio
ns
to b
e dev
elop
ed in
a n
on
-sele
cted
cro
ss-f
un
cti
on
al te
am a
nd e
xec
ute
tas
ks.
5E
xte
rnal
Ex
per
tise
Ex
tern
al E
xper
tise
is n
eces
sary
to
exp
loit
ma
rk
et
ava
ilab
le s
pecia
lized
exp
ert
ise o
r
ga
in a
ccess
to i
nn
ova
tive tech
nolo
gie
s o
r
me
thod
s
Ex
tern
al E
xper
tise
is n
eces
sary
fo
r all
An
aly
tics
in
itia
tiv
es a
nd it
is b
est
for
com
pan
ies
to c
on
cen
trate
on
th
e c
ore
bu
sin
ess
Ex
tern
al E
xper
tise
sh
ould
no
t be
sour
ced
for
An
aly
tics
in
itia
tiv
es a
nd s
ho
uld
co
mp
lete
ly d
evelo
ped
an
d s
ou
rce
d
inh
ou
se
Ex
tern
al E
xper
tise
is n
eces
sary
fo
r the
str
ate
gic
all
y i
mp
orta
nt A
naly
tics
init
iati
ves
that
are
sup
pose
d to
del
iver
a
com
pet
itiv
e ed
ge
in t
he
mar
ket
6D
ata
Cre
atin
g v
aluab
le I
nsi
gh
ts a
nd A
nal
yti
cs
so
luti
on
s b
ase
d o
n d
ata
is
co
stly
wit
h
sev
eral
bar
rier
s to
over
com
e
Cre
atin
g v
aluab
le I
nsi
gh
ts a
nd A
nal
yti
cs
so
luti
on
s b
ase
d o
n d
ata
is
sim
ple
wit
h
easy
to
ov
erco
me
bar
rier
s
Cre
atin
g v
aluab
le I
nsi
gh
ts a
nd A
nal
yti
cs
solu
tio
n b
ased
on
dat
a w
ill r
esul
t in
outc
om
es th
at d
on
't e
xce
ed
th
ose
ba
sed
on
hu
man
in
tuit
ion
Cre
atin
g v
aluab
le I
nsi
gh
ts a
nd A
nal
yti
cs
solu
tio
n b
ased
on
dat
a d
ep
en
ds
on
havin
g
larg
e v
olu
mes
of dat
a av
aila
ble
and
coll
ecti
on
capa
bili
ties
7D
eplo
ym
ent
As
dep
loy
men
t, th
e u
ser
is p
ro
vid
ed
wit
h
co
nsu
mab
le i
nsi
gh
t (o
ne-t
ime
insi
ght o
r
an A
nal
yti
cs p
rodu
ct) e
nab
lin
g h
im to
dir
ectl
y w
ork
wit
h th
e in
sigh
t
As
dep
loy
men
t, th
e u
ser'
s p
ro
cess
wil
l b
e
tak
en
over b
y a
da
ta s
cien
tist
subs
eque
ntl
y e
xec
utin
g th
e p
roce
ss b
ased
on
cre
ated
in
sigh
ts d
ue
to th
eir
com
ple
xit
y
As d
ep
loy
men
t, a
ny
use
r i
s com
ple
tely
re
moved
fro
m th
e p
roce
ss, s
ince
An
aly
tics
aim
s to
co
mpl
etel
y au
tom
ate
pro
cess
es
As
dep
loy
men
t, us
ers
are
pro
vid
ed w
ith
acce
ss t
o d
ata
or
resu
lts
from
anal
yti
cal
met
ho
ds, w
hil
e g
en
erati
ng i
nsi
gh
ts f
or
pro
ce
sses
are in
th
e u
ser'
s r
esp
on
sib
ilit
y
8U
ser
Res
po
nsi
bili
ty
Aft
er d
eplo
ymen
t, t
he u
ser'
s re
spo
nsib
ilit
y
is t
o i
nte
grate
in
sig
ht in
to p
rocess
es,
ma
ke d
ecis
ion
s a
nd
ta
ke a
ctio
ns
to c
reat
e
the
asp
ired
val
ue
Aft
er d
eplo
ymen
t, t
he u
ser'
s re
spo
nsib
ilit
y
is t
o e
va
luate
wh
eth
er
to u
se t
he i
nsi
gh
t
or r
ely
on
his
in
tuit
ion
to c
reat
e th
e
asp
ired
val
ue
Aft
er d
eplo
ymen
t, t
he u
ser'
s re
spo
nsib
ilit
y
is t
o i
nvest
tim
e t
o u
nd
erst
an
d a
nd
re
co
nst
ru
ct th
e gen
erat
ion
of in
sigh
ts t
o b
e
con
vin
ced
of
trus
two
rth
ines
s to
cre
ate
the
asp
ired
val
ue
Aft
er d
eplo
ymen
t, t
he u
ser'
s re
spo
nsib
ilit
y
is t
o c
on
tinu
e o
wn
tas
ks, w
hil
e
tra
nsp
are
ncy o
f m
ista
kes
an
d c
on
cern
for a
cco
un
tab
ilit
y s
tim
ula
tes u
ser to
bet
ter
per
form
ance
9O
rgan
izat
ional
Fac
tors
To
en
han
ce t
he
val
ue
from
Anal
yti
cs a
da
ta-d
riv
en
cu
ltu
reh
as t
obe
bui
ld, w
hic
h
is f
acil
itat
ed in
An
alyti
cs' b
road
an
d
freq
uen
t us
e, a
nd
sup
po
rtin
g o
rgan
izat
iona
l
stru
ctur
es
To
en
han
ce t
he
val
ue
from
Anal
yti
cs, a
ll
emp
loy
ees
nee
d ex
ten
sive
kno
wle
dge
in
An
aly
tics
such
that
all
em
plo
yees
are
da
ta
scie
nti
sts
or e
quiv
ale
ntl
y e
ducate
d
To
en
han
ce t
he
val
ue
from
Anal
yti
cs,
org
an
iza
tion
al cu
ltu
re i
s n
ot in
flu
en
tial
sin
ce A
nal
yti
cs is
a to
ol an
d b
y u
sin
g t
he
too
l rig
ht
To
en
han
ce t
he
val
ue
from
Anal
yti
cs, a
n
intu
itio
n-b
ase
d c
ult
ure
has
to
be b
uilt
,
wh
ich
is
faci
lita
ted in
cri
tica
l an
d s
kep
tica
l
vie
ws
to m
axim
ize
solu
tion
val
idit
y be
fore
dep
loy
men
t
10
Lo
ng-t
erm
usab
ilit
y
To
mai
nta
in v
alue
gen
erat
ed b
y in
sigh
ts
and
solu
tio
n lo
ng-t
erm
, ma
inte
nan
ce
pro
ce
sses
ba
sed
on
ad
ded
da
ta,
eva
lua
tion
of
bu
sin
ess
ou
tcom
e a
nd
use
r
fee
db
ack
are
nec
essa
ry
To
mai
nta
in v
alue
gen
erat
ed b
y in
sigh
ts
and
solu
tio
n lo
ng-t
erm
, no
acti
ons
are
nee
ded
beca
use
dep
loy
ed s
olu
tio
ns a
re
sta
ble
an
d p
rovid
e g
en
era
lly v
ali
d
insi
ghts
an
d v
alue
To
mai
nta
in v
alue
gen
erat
ed b
y in
sigh
ts
and
solu
tio
n lo
ng-t
erm
, in
sig
hts
an
d
so
luti
on
s n
eed
to
be a
do
pte
d t
o n
ew
use
rsto
mak
e th
em p
roduct
ive
wit
h t
he
solu
tio
n
To
mai
nta
in v
alue
gen
erat
ed b
y in
sigh
ts
and
solu
tio
n lo
ng-t
erm
, in
sigh
ts a
nd
solu
tio
ns
nee
d to
be
rep
lace
d w
hen
new
tech
nolo
gie
sbec
om
e av
aila
ble
Table 1: Propositions and rival explanations
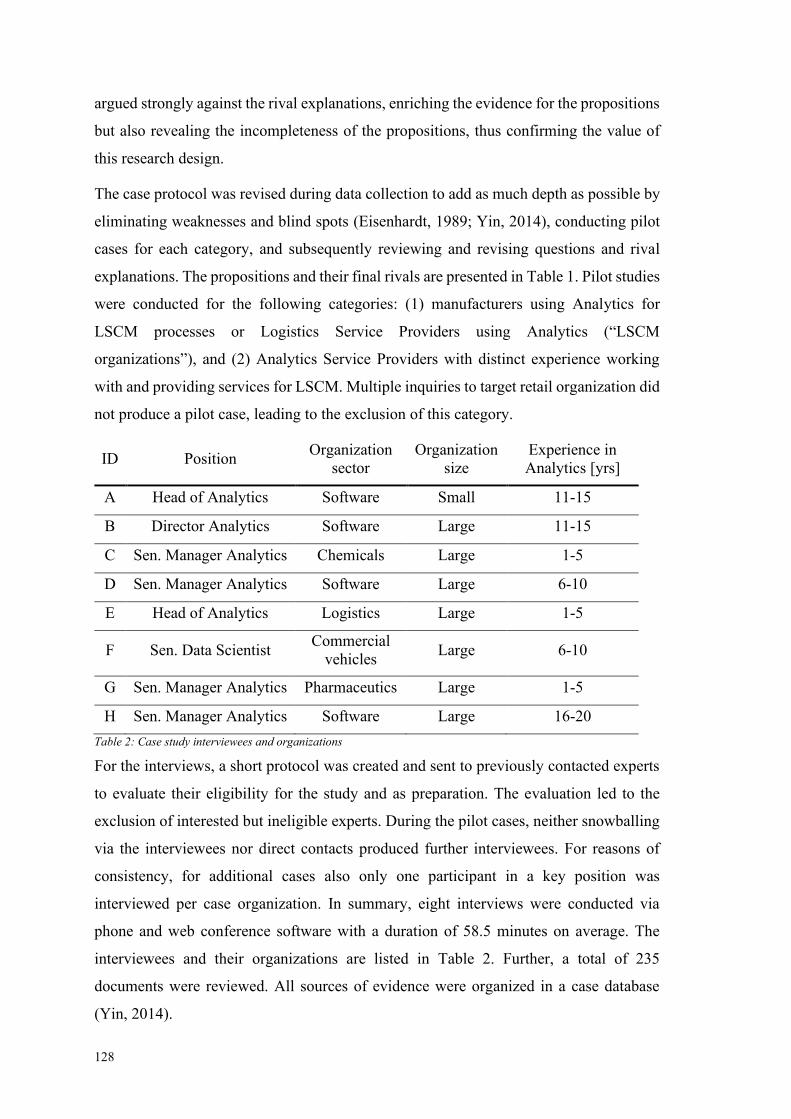
128
argued strongly against the rival explanations, enriching the evidence for the propositions
but also revealing the incompleteness of the propositions, thus confirming the value of
this research design.
The case protocol was revised during data collection to add as much depth as possible by
eliminating weaknesses and blind spots (Eisenhardt, 1989; Yin, 2014), conducting pilot
cases for each category, and subsequently reviewing and revising questions and rival
explanations. The propositions and their final rivals are presented in Table 1. Pilot studies
were conducted for the following categories: (1) manufacturers using Analytics for
LSCM processes or Logistics Service Providers using Analytics (“LSCM
organizations”), and (2) Analytics Service Providers with distinct experience working
with and providing services for LSCM. Multiple inquiries to target retail organization did
not produce a pilot case, leading to the exclusion of this category.
ID Position Organization
sector
Organization
size
Experience in
Analytics [yrs]
A Head of Analytics Software Small 11-15
B Director Analytics Software Large 11-15
C Sen. Manager Analytics Chemicals Large 1-5
D Sen. Manager Analytics Software Large 6-10
E Head of Analytics Logistics Large 1-5
F Sen. Data Scientist Commercial
vehicles Large 6-10
G Sen. Manager Analytics Pharmaceutics Large 1-5
H Sen. Manager Analytics Software Large 16-20
Table 2: Case study interviewees and organizations
For the interviews, a short protocol was created and sent to previously contacted experts
to evaluate their eligibility for the study and as preparation. The evaluation led to the
exclusion of interested but ineligible experts. During the pilot cases, neither snowballing
via the interviewees nor direct contacts produced further interviewees. For reasons of
consistency, for additional cases also only one participant in a key position was
interviewed per case organization. In summary, eight interviews were conducted via
phone and web conference software with a duration of 58.5 minutes on average. The
interviewees and their organizations are listed in Table 2. Further, a total of 235
documents were reviewed. All sources of evidence were organized in a case database
(Yin, 2014).
129
5.3.3 Data Analysis
For data analysis, each case is considered as single experiment that is replicated to
strengthen confidence in the propositions or provide disconfirming results to shape the
theory (Eisenhardt, 1989). This was applied to all explanations, propositions, and rival
propositions. Thus, as opposed to Grounded Theory (Strauss and Corbin, 1998), the
investigation did not synthesize the results from multiple cases, but every case was
investigated individually for conformance to the explanations by comparing the evidence
to the explanations (Miles et al., 2014; Voss et al., 2002; Yin, 2014). Disregarding the
rare occasions of no evidence collected for an explanation, which occurred for few rival
explanations, the conformance of single explanations over all cases was determined by
considering the individual results of each case for a single explanation together.
In detail, interviews and documents were analyzed using hypothesis coding (Miles et al.,
2014) based on propositions and rivals, since a comparison of theoretical explanations (or
predictions) to the collected evidence is recommended (Rosenbaum, 2002; Yin, 2014).
Further, for within-case analysis, the coded evidence for specific explanations was
analyzed for each individual case and a synthetized description collected in a matrix case
display (Eisenhardt, 1989; Miles et al., 2014; Voss et al., 2002). After concluding the
within-case analysis for all cases, cross-case analysis was performed explanation by
explanation (Eisenhardt, 1989; Voss et al., 2002). Cross-case analysis took place in two
steps. First, explanations (propositions and rivals) of each case category (LSCM
organizations and providers) were compared within the categories and a description
coherent for the categories for each explanation was developed. Second, the descriptions
of the categories were compared to determine differences between the groups and to
develop a coherent description for each explanation, valid according to the collected
evidence.
5.3.4 Trustworthiness
For trustworthiness, the quality criteria of Yin (2014) were considered. For reliability, a
case study protocol was developed and discussed with scholars. Further, a case study
database was established ordering collected data by case, systemizing individual
documents in the associated cases, and recording metadata. Internal validity was ensured
during preparation of the research design by documenting and displaying explanation
building for the proposition (Section 2). During data collection and analysis, internal
validity was ensured by explicitly designing rival explanations, which were discussed
130
with scholars, included in data collection, and compared to the propositions in the data
analysis (Section 4). For external validity, literal replication logic was strengthened by
selecting eight case organizations executing Analytics initiatives in LSCM. Construct
validity was addressed by using multiple sources of evidence including interviews and a
variety of documents, as well as by providing the results of this research to the
interviewees with a request for comments.
5.4 Results and Discussion
This section presents and discusses the results of the case studies regarding support,
rejection, and supplementation of propositions. Eight out of ten propositions were
supported with consistent results from the case studies, but were supplemented by
adjustments and exceptions. The advantage of the research design is to understand how
these adjustments and exceptions help to shape the theory that formed the initial
propositions. Rival explanations contributed to improved understanding.
In the following, “user” describes the employee in a business process intended to use the
results of an Analytics initiative continuously in the form of an Analytics product or an
accessible static discovery. “User” further describes an eventual customer of an
organization using the results, or an employee whose individual task is automated.
5.4.1 Starting position for Analytics initiatives
According to the evidence, the most promising starting position of an Analytics initiative
is a business problem or business question – preferably defined by business users.
Interviewees were confident in identifying problems by talking to users in business
processes and, if a problem was not formulated by the users, interviewees stressed to
identify users and get them involved. Such a business problem allows specification of the
proposed solutions. In this way, it becomes more likely that the initiative will develop
solutions that users are willing to use, that fit to users’ and business processes’ needs and
requirements, and that typically show better performance. These solutions become more
likely to be operationalized and realize their expected value. Their benefits become
tangible, and the solutions’ impact and value assessible. Hence, initiatives can be
prioritized and, since benefits are easier to communicate and explain, create buy-in from
sponsors in the form of resources, funding, personnel, and power to overcome barriers.
Activities increase in solution-orientation and enhance the process (e.g., reduced planning
effort; clearer selection of solution-progressing tasks and increased focus of tasks; easier
identification of needed resources, data and relevant stakeholders; less delays,
131
determinability of sufficient solution performance levels and test criteria; increased
agreement between and more solution-oriented ideas from team members). In conclusion,
this approach directs Analytics efforts to create value effectively and efficiently, by
considering the value of solutions and costs of developing solutions, while enhancing
value realization and reducing overall costs. This resembles the approach of solving
valuable problems within the KBV and supports Proposition 1.
However, Proposition 1 is supported with modifications. First, data must be catalogued
and inventoried to understand availability, conditions, and developable solutions. Second,
Analytics must be the most promising way to address the problem as compared to other
techniques.
Rival Explanation 1 to Proposition 1 – starting from data – was rejected. This approach
was suggested in some cases as a starting position that is sometimes taken or considered
as an option, but was explained to take longer, be likely to result in unusable or irrelevant
solutions, and not to motivate sponsors. However, data exploration was declared to be an
essential step after problems are understood to create understanding about the data
(formats; granularity; timeliness; quality; ability to integrate; what data describes; what
data is, is not, and should be collected). Moreover, exploration for taking inventory and
cataloguing data and data sources is necessary before Analytics initiatives are executed
to enable the selection of the most promising Analytics initiatives. This is important, since
these first initiatives can either build momentum or “burn” the topic, and deficits in the
condition of the data foundation soon become apparent. Overcoming these deficits is a
time and resource consuming endeavor, which neither provides gleaming benefits nor
convinces sponsors, but it is an important enabler for executing initiatives.
Starting from a solution seen at competitors, Rival Explanation 2, was rejected as starting
point for a competitive advantage. Copying competitors’ solutions can be a good start for
non-critical solutions. This approach can further be inspiring for organizations reluctant
with Analytics. This corresponds to findings indicating an increase of adoption of
Analytics if competitors are using it (Lai et al., 2018). However, such solutions are
unlikely to have similar impact at the focal organization. The context dependency and
need for adaptation of Analytics solutions is very high. Further, this approach does not
put organizations in a position of competitive leadership. For a competitive edge, the
observed solution must be made better – an endeavor which is resultingly a business
problem.
132
As it is does not indicate any clear path of action, the desire of doing something with data
as advertised in conferences or promoted in press releases, which is the third rival
explanation for the most promising start, was also rejected. Any Analytics initiative
starting with such a lack of focus leads to discussions about what to do, likely delays any
solution, and likely creates no valuable solution. However, outside of Analytics
initiatives, this desire, formulated and communicated by top management, can push
investment decisions, get users to think about business problems that could be addressed
with Analytics, and create visibility for Analytics in organizations. Investments are
needed for technology, analytical tools, and for developing data collection, storage,
structure, quality, and standards. Getting users thinking about long unsolved problems
and having their curiosity stimulated is a substantial driver for tackling problems with
Analytics. Further, the visibility disseminates benefits and ensures interest in Analytics is
sustained.
Regarding LSCM, the case organizations have exploited the proposed starting position to
promote the use of Analytics. LSCM users have various problems of transparency and
visibility at hand, for example, regarding processes, markets, and competitors. Solutions
to these problems provide them with tangible value, including identification of
weaknesses, improved planning, reduced cost, faster response times, and reduced
firefighting. Addressing these problems created a more supportive approach to
introducing Analytics to LSCM.
In summary, Proposition 1 is supported and all rival explanations to it are rejected.
5.4.2 Focus of Analytics initiatives
To gain valuable solutions from Analytics typically means addressing business problems
that are complex because either a lack of appropriate means omitted to solve them so far,
or because previously addressed problems remain business critical and enhanced solution
performance is desired. Characteristics of complexity are numerous, including time
criticality of solutions reaction, need for a high level of transparency across organizations
or supply chains, or the amount of data and information to be combined (often exceeding
human cognitive capacity). Concerning this amount of data, complexity further results
from internal or included external factors, actors, object behaviors, and contextual
specifics (rules, local characteristics, constraints), which can be interrelated or interacting.
Controlling this diversity of input, processed with novel requirements on speed and
accuracy, is a salient ability of Analytics and allows organizations to approach completely
133
new problems. The resulting faster decisions and improved decision outputs provide high
returns and savings. Further, through maturing in Analytics by executing initiatives,
organizations build abilities to address more complex problems. This focus on complex
problems for high value and the maturing from solutions resembles the focus on complex
ill-structured problems displayed in the KBV. This supports Proposition 2.
Nonetheless, relatively simple problems with high returns – quick wins – represent
exceptions to Proposition 2. Further, the use of Analytics must be reasonable for the
problems and should not be excessive, demanding solutions via other means if more
appropriate. It was emphasized that initiatives need to be net beneficial.
Rival 1 for Proposition 2, which opposes Proposition 2, was rejected since simple
problems, as a focus of Analytics, usually do not provide high returns. In exceptional
cases, simple problems may result in valuable insights, and solving complex problems
may not provide valuable insights. In this regard, interviewees referred to simple in
relative terms, associated with more established methods and tasks, but which still require
well-trained experts. Nevertheless, this focus is beneficial in early organizational maturity
with Analytics, during which complex problems induce a higher probability of failure and
could give Analytics a bad reputation in an organization. Simple problems, in the sense
of controllable problems, were described as the foci of initiatives intended to automate
decision-making with well understood decision options and whose impact could be
comprehensively identified and approved. It was repeatedly explained that even small
positive returns are still positive returns, suggesting a cost-benefit perspective as an
important paradigm for Analytics.
Rival Explanation 2, of solving previously addressed problems as a focus of Analytics
initiatives, was supported as a supplement to Proposition 2. Considering the aspired-to
enhanced level of performance for identifying solutions to business problems through the
presentation of an ill-structured problem with unrevealed and unmastered knowledge set
interactions, this rival explanation resembles the KBV. Implemented solutions to business
problems are usually justified by their business criticality. If this criticality remains with
a need for enhanced solution performance and Analytics is likely to deliver it, an
Analytics initiative consequentially creates high value comparable to completely new
problems, as specified in Proposition 2. This value can result from higher performance,
higher efficiency, more relevant insights, standardization of solutions for increased
usability and accessibility (e.g., standardizing spreadsheet solutions), or new approaches
134
(e.g., from reactive to proactive). Such initiatives support maturing in Analytics, since
many aspects of the problem are well understood, benefitting the solution development.
Again, it was argued that benefits exceeding the costs and proper priority are deciding
factors for executing initiatives.
The third rival explanation was rejected, since Analytics is not focused on replacing
ideation and creative methods. It is rather a supportive input to ideation and guides
innovations into the right direction to exploit opportunities. In contrast, creativity is vital
to identify the right business problems to address. Analytics can support the development
or even be part of new value-added features, services, products, contract formats, and
business models, while creativity and ideas are needed to design their monetization.
However, the case studies presented a tendency to address internal process improvements
with higher priority compared to building customer facing solutions.
According to Proposition 2, the complex issues currently the focus of Analytics initiatives
in LSCM are manifold. LSCM organizations want to understand customers (what they do
and need), assess process quality in real-time, and predict critical conditions of systems
and assets such that countermeasures are resource and cost efficient. Asset fleet utilization
is expected to be increased beyond non-Analytics limits and needs to gain capabilities for
same day and same hour delivery under pressure on margins. Finally, more individualized
services are anticipated to be provided due to Analytics, which is a paradigm shift from
economies of scale and scope.
In summary, Proposition 2 is supported with acknowledge exceptions and Rival 2 is
supported, which supplements the proposition. Rivals 2 and 3 are rejected.
5.4.3 Problem-solving process
Case studies presented the problem-solving process of Analytics initiatives to be iterative,
with future iterations being guided by and extensively dependent on learnings from
previous iterations. Further, the solutions of iterations are not put into trial in processes
to see whether they fail or not. They are rather considered as intermediate states (proof-
of-concept, pilot, prototype), which are the basis for discussions between solution
developers and users, joint interpretation of results, validation of results, and making use
of users’ knowledge to guide the problem-solving process. According to interviewees,
such iterations simplify the integration of several perspectives. Iterations are further
supported by establishing the objective of initiatives at an early point to reduce ambiguity
135
(e.g., memorandum of understanding, letter of content), and by agile sprints, as
recommended by Larson (2016), in which tasks are focused on the next agreed
intermediate state. As a result, this approach ensures knowledge transfer in iterations, in
the form of user feedback, to ensure the selection of the relevant knowledge of the users
(addressing intermediate solutions’ deficiencies and gaps to expectations, domain
knowledge guides solutions’ improvement) as well as from the solution developers
(methods to implement users’ feedback). Thus, intermediate states are used for
anticipated necessary interaction between users and developers. This resembles the
heuristic solution search presented in the KBV and supports Proposition 3, although
constrained by certain adjustments.
Adjustments emerge from the rival explanations. First, while the problem-solving process
is iterative, initiatives follow a certain, structured approach, such as the repeatedly
mentioned CRISP-DM model. One interviewee explained: “These projects are deeply
unstructured, but you can approach them very structured”. Second, Analytics products
are also deployed with the intent to advance the solution based on user feedback, which
at first glance resembles trial-and-error. However, this requires a quite advanced solution
that is improved from feedback instead of radically changed.
Rival Explanation 1 to Proposition 3 was rejected because creating a valuable Analytics
solution that users like to use requires continuous feedback during solution development.
A trial-and-error style approach based only on past experience with positive and negative
outcomes in developing solutions, neglecting necessary user and context adjustments and
attempting to deploy without prior user feedback, is likely to produce inappropriate
solutions that are not accepted by users.
As explained above, problem-solving is not straightforward, and Rival 2 is rejected. But
structures for initiatives exist that guide users through various well-developed phases
(e.g., CRISP-DM phases) that enfold the problem-solving iterations. Iterations and agile
sprints do not facilitate chaos or lack of control. They need rules, structures, and
documentation requirements such that the organization can repeat, recreate, and learn
from initiatives. In this regard, it has been emphasized in the case studies that Analytics
is not “just algorithms”, it is the whole process around the algorithm that intends to
generate value for organizations. Still, the process may be disrupted by stakeholders
changing opinions, unclear decision structures nullifying previous decisions, or
136
unanticipated data and technology issues setting the initiative back. Increasing maturity
with problems, technologies, and Analytics reduces these disruptions.
While the problem-solving is guided by users’ knowledge and intuition – a distinction
that will be discussed below – it is not intended to use Analytics to confirm users’ intuition
or expectations to “play politics”. Thus, Rival Explanation 3 is rejected. If the intuition
were correct, the generated benefit is more certainty in actions providing limited value. If
it is wrong, results that provide some confirmation could be fabricated, but this does not
provide value, would not lead to actions in the best interest of the organization, and would
be malpractice. However, interviewees also explained they had not observed this
behavior. The strength of Analytics is seen in overturning existing business thinking and
practices if a better outcome can be achieved differently.
It was emphasized that the iterative approach is specifically needed in LSCM to
understand the perspective on a problem. Regarding forecasting of demand and capacity
or the assessment of quality and performance, there are various perspectives in LSCM
that require different aggregation of timescales, entities, and processes for the seemingly
same problem. Iterations are essential to filter the correct perspective and informational
needs.
In summary, Proposition 3 is supported, with all rivals being rejected.
5.4.4 Roles in Analytics initiatives
The evidence shows that Analytics initiatives are based on constantly interacting cross-
functional teams with members filling different roles to perform different tasks. In
particular, the inclusion of users, permanently or accessible at short notice, was
highlighted. Users’ inclusion enables solutions’ dedication to users’ needs, their
operationalization, and their impact on business processes, since users have deep
knowledge about the process (understand data and contextual meaning, understand
required solution performance, know local specifics of decision-making, special business
rules, and requirements, and factors impacting the outcome). They help to identify
difficult to reach data sources, as one interviewee explained: “Excel spreadsheets are very
popular, again and again”. Apart from users, diversity of team members provides diverse
skills and specialized knowledge, and diverse talents, perspectives, experience, and
interests (a vital motivational factor). This mix enables more, better, and unconventional
innovative ideas in Analytics initiatives, provides synergies, and accelerates the problem-
137
solving process. Tasks can be distributed across the team to gain efficiency from
specialization and manage the high workload. This resembles the KBV’s argument for a
group of specialized individuals required for knowledge creation from combining diverse
knowledge sets and supports Proposition 4. Members were also explained to speak
different “languages” due to their different cognitive concepts requiring a “translator”
who has enough knowledge about the different roles to understand and connect the team
members, comparable to the argument in the KBV. This role was explained to be even
rarer than great data scientists.
Again, an exception applies to Proposition 4, since different roles may be filled by the
same team member depending on the size and complexity of the initiative. Not all
Analytics initiatives are intended to place an organization ahead of the competition,
change the business model, or master the most complex business problems. Thus,
unconventional and innovative ideas, synergies, or management of high workloads are
not required for all initiatives.
However, uniting several roles has a limit and as a result the jack-of-all-trades data
scientist specified in Rival 1 was rejected. Interviewees explained that their organizations’
data scientists usually have a strong mathematical background (mathematics, physics,
statistics), often with a PhD, since their tasks and core expertise are to make the most of
data (analyzing, modeling, creating algorithms). They agreed that it is easier to learn new
data tools with this background than the other way around. However, jack-of-all-trades
data scientists were sought to find, but in the rare instances of finding one, they were
extensively more expensive than a diverse team, thus eradicating their benefits. Data
scientists are generally expensive and should focus on the data analytical tasks they are
best trained for, as a matter of resource efficiency. They might do small initiatives on
their own, but other initiatives would be physically challenging due to the workload – “It
doesn’t scale”. This data scientist would rather be a single source of failure and interrupt
the entire initiative in case of illness. Moreover, an idea of omnipotent data scientists
contradicts the value of business experts and users, who have effortfully acquired
knowledge and experience handling complex tasks. This idea disrespects them and their
contribution, which can result in losing their eventually needed collaboration.
Rival Explanation 2 of users executing the initiatives was rejected since users usually lack
knowledge and experience needed for Analytics initiatives or are occupied with their
business processes, on which they are expected to work. Further, data literacy and
138
knowledge on technologies may also be missing, and training would be extensive and
require their affinity for the topic. With so called "self-serving analytics", users are
increasingly getting involved with analytical tools, but these are often specifically
developed or adjusted for users’ empowerment (e.g., supporting workflow, providing
relevant options as selectable) and require prior Analytics initiatives for their
development. Thus, established methods are democratized instead of users working on
leading edge problems. However, this reduces the workload of data scientists, who can
then work on complex problems and accelerate gaining value from those.
Case studies indicated that the involvement of employees only weakly related to the
business problem can be helpful in certain situations that require creativity and additional
perspectives. Marchand and Peppard (2013) recommended such action as a strategy to
introduce new ways to solve problems and overcome myopic views on data initiatives.
However, this could also lead to revisiting already dismissed ideas and more discussions.
Any strong voice intentionally or unintentionally putting their own needs first could divert
the configuration of the intended solution away from users’ needs. Further, input not
relevant to the solution can disrupt and delay progress, which creates inertia in initiatives.
Thus, Rival Explanation 3 was rejected.
In LSCM, putting the proposed cross-functional teams into practice comes naturally.
LSCM as business function or business model usually interacts with many cross-
functional actors and must fulfill the role of integrator. In LSCM organizations with an
end-to-end vision of their supply chain, this is scaled to cross-organizational teamwork.
Thus, working in cross-functional teams is the status quo for LSCM and nothing new due
to Analytics.
Summarizing the above, Proposition 4 is supported, and all rivals have been rejected.
5.4.5 Including external expertise
Externals such as providers with high Analytics maturity are included in Analytics
initiatives to develop better and cheaper solutions, because they are familiar with the
problem and their expertise is an efficiently purchasable commodity. Including externals
was further reported as beneficial for gaining access to specialized, innovative, and niche
analytical methods and technologies. In accordance with Proposition 5, they are included
when organizations have no interest in building expertise in rarely needed methods and
technologies. However, organizations also include externals to build expertise and
139
develop self-sufficiency, which goes beyond the proposition. Evidence clearly displays
the adoption of Analytics as an effortful maturation, whether initially or for adopting
Analytics innovations in mature organizations. This maturation is accelerated and
reduced in stress and cost by appropriately knowledgeable externals with the intention of
supporting maturation by executing co-creative Analytics initiatives. During maturation,
externals can generate "buy-in" from sponsors by showcasing completed initiatives and
value from Analytics and their experience reduces the risk of failure and "burning" the
topic inhouse. However, the goal must be to develop internal expertise and self-
sufficiency, since this is vital for the organization to develop inherent ideas for initiatives
and trust from users. Thus, these co-creations are successful if externals eliminate the
need for their expertise (not necessarily for their technologies), while this success
provides a basis for new collaborations on different or more advanced topics. This partly
resembles the inclusion of market actors for problems with fewer requirements and access
to more diverse knowledge as explained in the KBV, but Proposition 5 must be rejected
since it does not represent the full situation and misses an essential part of the inclusion
of externals into Analytics initiatives.
More diverse but regular modes of cooperating with externals were reported, also not
covered by Proposition 5. These include using externals as an “extended workbench” to
gain flexibility, or for critical and urgent problems, regardless of the Analytics maturity
of the organization. Further, externals may have access that cannot be substituted in other
ways, such as solution providers that include data from other customers into a solution to
enhance it. A minority of organizations always include externals to gain more diverse
perspectives. Also less regular and outside the narrow focus of using externals for
knowledge sourcing is the sharing of knowledge and resources to develop a collaborative
solution for the market in a strategic partnership.
Rival Explanation 1 of companies focusing on their core competencies and leaving
Analytics initiatives to externals was rejected in consideration of competitive advantage.
While uncritical business problems with mature solutions exist, saving time and costs,
building organizational self-sufficiency in Analytics was emphasized as essential for
creating a competitive edge from it. Analytics is anticipated as one core component of
future competitiveness as part of product and business models, and solely relying on
externals limits an organization’s capacity to build maturity for this anticipated
competitive environment. Further risks mentioned include the lack of the ability to create
140
Analytics enabled business ideas or loss of these ideas, loss of data and control over data
usage, and loss of control over solution quality. Certain Analytics initiatives must be done
internally, due to privacy, confidentiality, and data security concerns, or because
regulations prohibit data sharing. Thus, scholars’ recommendations (Lai et al., 2018;
Sanders, 2016) to remain in the “comfort zone” of core competencies should be subject
to critical consideration and careful assessment.
Since it displays an extreme position intended to broaden the insight generated from case
studies, similar to the previous rival explanation, Rival 2 of Proposition 5 was rejected.
Completely developing and sourcing Analytics internally limits the organization.
Externals can be cost effective providers for solutions with high maturity for uncritical
business problems. Regarding competitive advantage, their support can accelerate the
process, reduce costs, reduce risk of failure, and introduce new ideas on problem-solving.
As a critical side note from interviewees, not all externals can necessarily contribute these
benefits, but market leading providers should. Organizations have different core
businesses and competencies, and they should not disregard the development of
innovative Analytics concepts and technologies happening outside their own
organization.
Organizations should have full control over strategic initiatives and customer facing
services, Analytics or other, but externals, if bound to confidentiality, can have an
important impact on strategic initiatives by introducing additional ideas and information.
Thus, Rival Explanation 3 is inconclusive. There was no consensus to be found in the
case studies. Some strongly rejected the explanation, arguing for the vital importance of
strategic initiatives, the risk of losing new revenue streams to co-creators, and different
understanding of customer needs. However, other cases appreciated the use of externals
for the innovative solutions that could be created in partnerships and acceleration of
implementing strategic initiatives leading to first mover advantage.
While the case organizations represent leaders with relevant insight on this research, only
a few LSCM organizations build internal Analytics expertise. Many intentionally take
follower positions and, thus, source Analytics expertise completely externally. This does
not contradict Propositions 5 since it has not been experienced that such organizations
gain competitive advantage from their Analytics initiatives. Further, case organizations
have even started to push competitors to use Analytics since they perceive this reluctance
as a risk to the field
141
In summary, the proposition is rejected, since the proposition only covers parts of the
rationale in the data. Rivals 1 and 2 are rejected and Rival 3 is inconclusive.
5.4.6 Data as a resource
Data as a resource was a controversial topic in the case studies. It is the core of Analytics,
holding the insights that enable valuable opportunities, but it is also a source of challenges
and frustration. Interviewees expressed their frustrations vibrantly: “because every
customer says: ‘the data is there, it's great, it's no problem at all.’ It's not like that, it's
never like that.” Data issues can impede its use for Analytics, including: (1) integration
of data (different formats, timeliness, frequency, granularity, or data definition of
business objects, missing context or technical accessibility), (2) data quality (missing
annotation, incomplete data, uncertain correctness, errors from sensor failures), or (3)
data management (ensuring data security, missing overview over data, unclear
responsibilities for data quality and security). Further organizational issues can result in
denied access to the resource, including: (4) protectionism (unwillingness to share data,
missing trust between supply chain partners) and (5) infrastructure (evolved data silos,
differing decision rules for similar data). These issues reduce the usability of the resource
and the value of solutions, considering the repeatedly mentioned “garbage in, garbage
out” principle. However, they concern handling and care of the resource and become less
relevant with increasing maturity in Analytics due to standardization and improvement
efforts driven by needs inside and outside of Analytics initiatives. The relevant issues
arise from the insights held in the data resource. To generate insights from data to solve
a business problem, two steps are necessary. First, data must be analyzed with quantitative
methods and algorithms, which may not be able to uncover comprehensive insights about
the entity the data was collected about. Second, the results from these methods must be
interpreted for their relevance and impact on the business problem, which demands
additional knowledge on context and domain that cannot simply be substituted. Thus, the
full insight covered in the data might not be transferred to the business problem of an
Analytics initiative. Further, data might not be collected for technological reasons, data
security reasons, prohibition by law, and due to missing installations of sensors. Hence,
insights may not be transferable completely with data as the carrier. Additionally,
resulting from this and previously discussed evidence, all these activities of collecting,
managing, and analyzing data and interpreting results are usually time, resource, and
cognition intense, making the transfer of insights to solve a problem with data as carrier
142
costly. This resembles the characteristics of tacit knowledge as explained in the KBV,
and supports Proposition 6, again with supplementation.
An emphasized adjustment to Proposition 6 is the progress in methods and technologies,
which results in decreasing costliness of extracting insights from the data. Further, in
exceptions, costly Analytics cannot promise to extract insights that are valuable, and in
other initiatives the extraction of insights is not costly, but the insights are valuable.
The extraction of insights from data being simple, as specified in Rival Explanation 1 of
Proposition 6, was rejected. Analytics initiatives with simple to extract valuable insights
for problems or organizations become fewer with increasing maturity of organizations in
Analytics. Moreover, the process of insight extraction from data was explained to be
cognitively effortful and time and resource consuming.
Evidence concerning Rival Explanation 2, which proposes that insight extraction from
data does not lead to greater value than insight from human intuition, is inconclusive. The
inconclusiveness centers around the ambiguity of the term “intuition”, which describes
some “gut feeling” or guesswork but also human knowledge, experience, and access to
information not represented in analyzable data. The latter consists of cases in which
Analytics insights cannot exceed human knowledge, problems cannot be modeled,
discoveries are irrelevant, analytical methods miss patterns, or data from different sources
are inconsistent, leading to suboptimal decision support. However, there are also cases in
which Analytics solutions exceed human knowledge and experience. After all, human
knowledge and experience are often necessary to create valuable Analytics solutions in
the first place due to understanding of interrelationships, sensemaking of data, or
feedback guiding the problem-solving process. Combining human knowledge and
experience with Analytics was reported to achieve the best business outcome, making
Analytics dependent on humans’ abilities but not declaring human intuition as superior
to Analytics.
The dependency on large volumes of data for valuable insights, stated in Rival 3, is also
inconclusive. While small data can also create valuable insights, the data volume can be
substantial for enhanced insight creation under certain conditions. The additional data
volume must explain more aspects of the business problem, either from a greater variety
that allows the explanation of more effects, or from more equivalent data but with higher
diversity of observations. Resultingly, more precise solutions must be creatable, or new
questions answerable. Further. the volume must be exploitable (technically manageable,
143
with provision of results before the value of the insights degrades) and have good quality.
Most importantly, and sometimes missing form Big Data discussions, the larger volumes
of data only provide value if they fit with the problem. In contrast, if there are privacy or
security concerns with the data, more data can result in higher risks.
Regarding LSCM, a complexity in analyzing data arises from LSCM being process
focused resulting in according data creation, while classical IT systems are oriented to the
structure of the organizations. Hence, analyzing the process can be challenging. Further,
LSCM operates in dispersed locations. Thus, different markets of operations bring
different business rules applied to the same data and generate differing insights. In
established and grown organizations, the dispersed locations (manufacturing, storage,
fulfillment), globally and locally, have been set up with heterogeneous and now outdated
systems, which either prohibit data access or provide data that cannot be integrated,
making the knowledge technically tacit.
In summary, Proposition 6 is supported, Rival 1 rejected and Rivals 2 and 3 inconclusive.
5.4.7 Deploying Analytics solutions
Evidence emphasizes a deployment of Analytics insight such that decision-making is
supported in a consumable form, which accelerates the business process, is more relevant
and appropriate to the decision, or enables users to consider a wider variety of business
questions. The value from Analytics is eventually measured by the resulting business or
process performance, since Analytics is supposed to result in better or faster decision-
making. However, the desired value can be missed if deployment of insights is delayed
or leads to wrong decisions because of missing consumability. A lack of consumability
prevents users from accepting and using the solution or reduces productivity.
Consumability is influenced by a variety of characteristics. The solutions should fit to the
process and users by being intuitive for users and intuitive in regard of the process,
available when needed, attracting attention for relevant situations (alerts, visualizations),
reflecting business logic, and, if needed, allowing the use of preferred devices including
mobile technologies. Complex decision-making becomes more consumable by reducing
the steps to the decision, reducing decision-making effort especially under pressure, and
making insights usable without deep analytical knowledge. For uncertain decision-
making, consumability includes access to additional insights on demand and to the
expected consequences of the recommended decision. In summary, solutions must be
timely and appropriate to the business impact of supported decisions. Insights on the same
144
problem for different user groups (e.g., maintenance vs. new product development) are
consumed differently and require different deployments, underlining the need for
involving users in the problem-solving process. This consumability is established by a
deployment that is fitted to the process and users to ensure beneficial usage, reflecting the
suitability of the knowledge integration mechanisms to the process and organizational
characteristics for efficient knowledge integration. This supports Proposition 7, with
subsequent adjustments.
Necessary clarifications must be made to adjust Proposition 7. First, consumability does
not exclude training. Second, consumability is not the uniquely important aspect, since
the deployed solution must also fulfill technical and legal requirements (scalable, secure,
legally correct, licenses are paid).
Rival Explanation 1 for Proposition 7 describes the migration of decision-making
supported by Analytics solutions into the responsibility of data scientists. This is rejected.
The cases emphasized users must remain in the process and be enabled and empowered
by appropriate solutions. The users have the necessary experience and knowledge for the
processes, can interpret and identify the most appropriate decisions and actions given the
insights, and should remain responsible for decisions and actions. Analytics solutions
cannot cover the full decision-making process and tasks of users, which require
understanding of the business environment, strong process related skills for which users
are educated, and ideas to improve processes with methods outside the realm of Analytics,
which data scientists cannot substitute.
Analytics products are intended to reduce user effort, including the automation of certain
repetitive and less complex tasks. However, replacing the users completely, as stated in
Rival Explanation 2, is neither desired nor technically possible, leading to rejection of the
explanation. The intention is to reduce users’ tasks that are time intensive but do not
provide much benefit to users or organizations (e.g., manual data collection, manual data
integration), while this study did not investigate whether this is in the interest of the user.
The automation of decision-making requires a proven and established solution with
consistently superior performance for the user and a backdoor process for eventual
changes. In complex decision-making processes, such automation is often technically not
possible but instead requires users’ abilities such as ingenuity, creativity, and ability to
interpret and understand the impact on the process, and to evaluate the best course of
action. As also noted by Roßmann et al. (2018), human skills will remain necessary for
145
decision-making. Automation cannot transform a business in the way a knowledgeable
design decision by a human can do. However, certain jobs are becoming less attractive or
require actions beyond human abilities, such that it becomes necessary to develop
automated solutions. Further, Analytics solutions may lead to centralized decision-
making or the ability to scale tasks and replace users in that way. Ironically, interviewees
reported the increasing automation of analytical tasks.
As discussed above, users are increasingly enabled through self-service Analytics. This
depends on Analytics products developed in Analytics initiatives to create solutions that
provide access to relevant data – data democratization – and analytical tools fitted to the
user. As Guerra and Borne (2016) describe, democratization of data implies easy access
based on standardized metadata, access protocols, and discovery mechanisms. It is not
practical to leave the generation of insight and solution deployment solely in the hands of
the users, who receive the results from some analytical method, rejecting Rival
Explanation 3. Self-service or self-sufficient Analytics (for the users) depends on the
users’ affinity for Analytics, their willingness to learn, and the complexity of the problem.
Certain insight generation, self-sufficiently executed by users, contributes to building
trust into Analytics solutions such as customization (change reports, build own apps) or
further data exploration. This basically efficiently exploits users’ knowledge on needed
data, understanding of processes, and ability to interpret data and insights in context.
The field of LSCM displays an interesting occurrence regarding this proposition, because
automation is a major aspiration, but not to cut jobs, as feared by automation opponents.
The intent to automate is stimulated by the lean mindset, a central mindset of physical
process optimization in LSCM, which focuses on reducing non-value-adding activities.
Thus, automation intends to free employees from these, often repetitive, activities and
provide more time for value-adding activities and innovating based on their expertise.
The value of LSCM experts was strongly emphasized in the case studies and the
irreplaceability of the experts’ knowledge by automation was expressed repeatedly.
In summary, Proposition 7 is supported, and all rivals are rejected.
5.4.8 The responsibilities of the user
Insights from Analytics solutions must be integrated into business processes to result in
decisions and accordingly taken actions. Similarly, discoveries must be operationalized
by supporting decisions and (corrective) actions users are responsible for taking to
146
improve business processes or eliminate inefficiencies. This seems rational, but is not
always how users act. These decisions and actions from Analytics solutions are necessary
to generate return on the investment. Unused solutions may result in additional
investments, since the business problems appears to be unsolved. As one interviewee
described: “if your weather forecast says rain, but you don't take an umbrella and get wet,
you can't blame the weather forecast nor the umbrella manufacturer”. The purpose of
Analytics is not analyzing data – as already indicated in the literature (Chae, Yang, et al.,
2014). The purpose of Analytics is to improve decision-making and business processes
through integrated, Analytics-enabled support or automation, provided Analytics is the
tool in an organization’s toolbox that achieves the desired solution with superior
performance or cost efficiency. Further, integration includes process changes by allowing
users to collect feedback on the solution’s performance, such that transparency of results
and long-term improvements are enabled. Since this underlines the importance of
applying the insights from Analytics solutions during the value creation process of
transforming input to output, Proposition 8 is supported with subsequent adjustments.
As clarifying adjustments, the method of integration and the level of change of the
business process strongly depend on the insights, such that discoveries in presentations
and reports with longer periods of validity are integrated differently as compared to alert
systems. Further, the solution must be created such that integration into the business
process is possible, and, in accordance with the results of Srinivasan and Swink (2018),
the business processes may have to be stabilized first such that integration is possible. It
should not be implied that all new insights are dominant over previous decision-making.
The solution from an Analytics initiative may just provide additional insights for
decision-making in the process.
If a deployed solution is established and feedback returned, users should not evaluate
whether to use or to ignore the decision support recommendation or assistance because,
for example, it does not fit their intuition. Thus, Rival Explanation 1 to Proposition 8 is
rejected. However, such an evaluation would be part of the solution’s refinement and
validation during deployment, which benefits from users’ knowledge and experience.
Further, decisions themselves are evaluation processes, which are supported by Analytics
solutions and usually include further sources of information. For making the decision,
users should not blindly follow the actions recommended by Analytics solutions, since
these could also include distortions (e.g., failing sensors). But risk is no excuse for
147
generally or conveniently ignoring. Again, critical business information might not be
covered by available data and models and thus the Analytics solution may be overruled.
The critical information available to the user must be sound. Further, there might be
additional decision options that are severe and purposefully unavailable in the Analytics
solution. However, this argument applies only in certain situations.
Interviewees clearly emphasized that users should not recalculate the results provided by
Analytics solutions. Thus, Rival Explanation 2 is rejected. Solutions should usually be
consumable, reducing the needed mathematical skills of the users. The effort required to
recalculate the results would likely eradicate the intended time benefits and would be
scarcely manageable by the user, especially with complex calculations connecting several
models. However, change aversion results from lack of understanding. Hence, to build
trust, how the solution works and generates the insight should be explained to users. This
might include recalculation in some form.
While transparency can reveal mistakes, it should be used as a chance to learn instead of
building pressure. Handled as an opportunity for learning and supporting users, Analytics
is perceived as beneficial and builds demand. Used to apply pressure, solutions will not
be accepted and applied, and data will not be shared willingly. Thus, Rival Explanation 3
is rejected. Transparency should be created while remaining ethically sound and ensuring
users’ privacy with established data security. Organizational authorities should monitor
this, while also clarifying and creating consensus about ethics and privacy, setting up
rules to follow and enforcing them ("data governance"), and providing users with
understanding about data collected related to them, the reasons for collection, and how to
take control of their own data. A rising need for governance was foreseen by Carillo
(2017) and his demand for research attention is supported by this research. Increased
transparency should be beneficial for organizations and users, and benefits must be
communicated to users. Otherwise transparency could become a source of fear (blaming,
loss of power, job automation). However, limitations should be reasonable and not
overprotective or generally refuse transparency. Transparency can be achieved without
any relation to users, and data on users can be separated from data regarding the subject
of analysis. Making organizations transparent is needed for business success, safety, and
risk management, and to identify intentional wrongdoing.
In LSCM, the responsibilities described in Proposition 8 result directly from the business
problems tackled. The aspired transparency on changing conditions does not affect the
148
situation for the organization. The situation is changed when users take decisions and
actions accordingly, such as redistributing resources, rescheduling, or reordering. Faster
response and broader insights on the changed conditions with their consequences should
increase available decision options with resultingly better outcome for the organization.
However, evaluating the options, taking decisions, and triggering actions is the user's
responsibility.
In summary, Proposition 8 is supported, and all rivals are rejected.
5.4.9 Organizational factors of Analytics initiatives
Several organizational factors are identified in the evidence, which enhance the value
generated from Analytics. However, while these are related to a culture of open and
positive interaction with data, this culture was neither explained to be exclusively driven
by data nor was it named a data-driven culture. Further, factors derived from the Analytics
literature incompletely cover the organizational factors essential to enhance value from
Analytics. Thus, Proposition 9 is rejected. However, the collected organizational factors
strongly resemble the enhancing factors of knowledge integration of the KBV. First,
common knowledge resembles organizational factors such as knowledge about available
data to solve business problems ("data literacy"), understanding of the results and risks of
analytical methods, and understanding (and appreciation) of the work behind Analytics.
Second. frequent and varying knowledge integration resembles two differing groups of
organizational factors in the evidence. Frequency occurs through willingness to share
data, willingness to use Analytics, emphasizing ("evangelizing") achieved and potential
value from Analytics, and providing time to work with Analytics or on ideas for
initiatives. The variability of knowledge integration occurs through value enhancing
organizational factors of openness to ideas, creativity, curiosity, and openness to consider
its own actions being possible sources of mistakes. However, the value of Analytics is
enhanced by further organizational factors outside the scope of Analytics or the KBV’s
knowledge integration, such as willingness to cooperate, embracing change, holistic
thinking, or a mindset fitting to the customer. These do not fit the proposition. Third,
supporting structures resemble organizational structures for data sharing, structured
processes of Analytics, infrastructure for Analytics, and alignment of Analytics with
business goals. Interviewees recognized that not all factors can be present in an
organization, but setting them as goals will lead an organization in a direction in which
the value from Analytics is enhanced.
149
Rival Explanation 1 of Proposition 9 – of all users needing to be data scientists or being
comparably educated – was rejected as a doubtful future scenario, as already stated by
Roßmann et al. (2018). Users need certain knowledge about Analytics to avoid fallacies,
understand the work behind and implications of Analytics, and to create more rich ideas
for business problems to tackle. However, this level is far from the abilities of data
scientists. Interviewees anticipate an imminent rise of the need for users in business
processes who are better educated on Analytics, but only to allow easier interaction with
data scientists and for using Analytics solutions as part of their empowerment. The need
for users to embrace innovation is far greater, which involves accepting data scientists as
vital team members for collaboration along with other vital members.
The second rival explanation was rejected as well, since case studies clearly emphasized
Analytics’ value to be enhanced by the organizational culture. However, contrary to
expectations, a culture is required that embraces collaborative thinking and acting,
embraces innovation, and is open to change. An innovation culture was specifically and
repeatedly mentioned, supplemented by an agile mindset, entrepreneurial mindset, rapid
testing of ideas, and involvement of users and customers in design processes.
Appropriate critical reviews of Analytics solutions are considered beneficial, and for
some solutions, critical feedback from observing them in process provides improvement
potential that is hard to achieve before deployment. As discussed above, engineering
knowledge, a practiced way of thinking and doing business, or informed decision-making
based on older and simpler (analytical) methods can provide appropriate criticism and
suggestions that should not be disregarded. However, an intuition-based culture should
be avoided that ignores Analytics results, treats Analytics with disregard, and mistrust or
rejects any form of change. Thus, Rival Explanation 3 is rejected. Mistrust or demand for
unrealistic certainty levels of solutions will delay the use of solutions and result in missed
opportunities.
In accordance with Proposition 5, an organizational factor in a large share of LSCM
organizations is a missing appreciation for resources outside the physical “bread and
butter” processes. Behind the leaders such as the case study organizations, there is a field
of followers that treat IT as “hygiene factor”, and which cannot build Analytics
capabilities on that attitude.
In summary, all explanations, propositions and rivals have been rejected.
150
5.4.10 The long-term usability of solution in Analytics initiatives
An Analytics product meant for continuous use is not finished after deployment. It must
be maintained and shows constant need for adjustments because of newly available data
and data sources, needs and feedback from users, degradation of solution performance
over time, and evaluation of achieved business outcome. As part of deployment and as
described above, there is usually an adjustment phase of the solution to the business
process. Maintenance comes after this adjustment and is necessary to assure performance
through monitoring and quality control ("Analytics on Analytics"), and adjustments to
changes in the technological ecosystem (e.g., the solution hosting system or systems the
solution is interacting with). Further, maintenance involves extending existing solutions
by including changes present in more recent data like new patterns, new anomalies, or
different behavior of processes and customers triggered by the Analytics solution or
market and societal changes, which shift optimal points and priorities of recommended
actions. Solutions are likely transferred or scaled with smaller changes to new user groups
with similar business problems. Further, solutions will be overhauled or replaced if new
ideas or newly tested analytical methods on solving problems migrate from more recent
initiatives to the focal solution or if the promoted and visible value and benefits from a
solution induce demand for additional features or ideas for improvement. Interviewees
observed a surge of new ideas for Analytics initiatives once users had been exposed to
helpful Analytics solutions and emphasized the ongoing opportunities for improvements
in organizations, which can be supported by Analytics. This resembles the continuous
renewal of capabilities to sustain competitive advantage specified in the KBV of
extending the capabilities to include new knowledge and using existing knowledge in new
capabilities. This provides support for Proposition 10. However, discoveries usually
experience little to no maintenance.
Rival Explanation 1 of Proposition 10, which states that Analytics solutions are stable
and, thus, represents the opposite of Proposition 10, is rejected. As discussed above,
Analytics solutions need regular adjustments to internal and external developments along
the solutions’ lifecycles. A multitude of aspects of solutions can change including input,
functionality, or the business and technological environments of the solutions, which will
influence their performance.
Analytics solutions will not be adapted to individual users. Solutions are developed for
certain roles, and if roles do not change in objective criteria or tasks, resulting in a change
151
of users’ behaviors, there is no need for user-based adjustments. Thus, Rival Explanation
2 is rejected. If new users are introduced to an Analytics solution, because the solution is
newly developed or the users newly hired, they will usually be trained. Too much
individualization creates chaos but there should be room for personalization for
consumability. However, users’ requests will be considered for solution improvement and
building the trust of users. But these considerations include prioritization and removal of
features that turned out bad.
Finally, Rival Explanation 3 of solution replacement by newly available technologies is
rejected. New technologies will not automatically trigger adjustments. The choice of
technologies is driven by the business problems and a change of technologies for solving
a business problem requires justification by improved performance or fit to requirements,
exceeding the cost of migrating to the technology. Migrating solutions to new and
appropriate technologies is likely if existing technologies present a bottleneck. In
addition, a technology’s cost benefit evaluation changes as the technology matures,
becoming less costly or addressing more needs. Cost evaluation should additionally be
done for the long-term and with anticipation of future requirements to stay on track with
the competition.
Regarding the decentralization of LSCM functions due to globally operating supply
chains, interviewees emphasized the need to have a vision about scaling a solution in
development to similar supply chain functions in other locations after it has been tested
and validated. This should avoid these functions having redundant development efforts
or creating isolated solutions.
In summary, Proposition 10 is supported, and all rivals are rejected.
5.5 Conclusion
This research has developed an explanation of how Analytics generates competitive
advantage for organizations based on the knowledge-based view and using the example
of Logistics and Supply Chain Management, as illustrated in Figure 25. In short,
managers need to identify business problems with tangibly beneficial solutions that are
complex or business critical. They select expertise, creativity, and data from internal
experts and acquire it from experts from the market, and manage the experts to find the
solution. Within the bounds of a structured initiative, this team of cross-functional experts
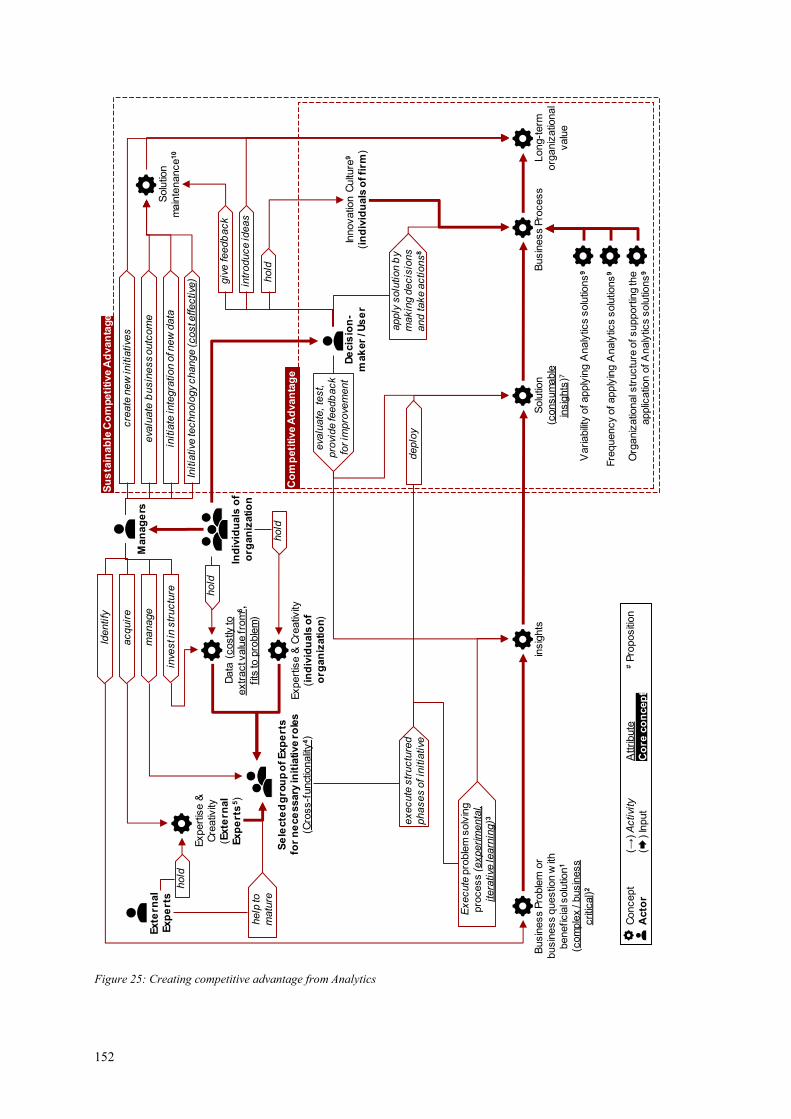
152
Busin
ess P
roble
m o
r
busin
ess q
uestio
n w
ith
beneficia
l solu
tion
1
(com
ple
x /
busin
ess
critic
al)
2
insig
hts
Execute
pro
ble
m s
olv
ing
pro
cess (
experim
enta
l,
itera
tive
learn
ing)3
Solu
tion
main
tenance
10
Innovatio
n C
ultu
re9
(in
div
idu
als
of fi
rm)
Data
(costly
to
extr
act v
alu
e fro
m6,
fits
to p
roble
m)
hold
Solu
tion
(consum
able
insig
hts
)7
deplo
y
De
cis
ion
-
mak
er
/ Us
er
apply
solu
tion b
y
makin
g d
ecis
ions
and take a
ctions
8
Long-t
erm
org
aniz
atio
nal
valu
e
hold
Fre
quency o
f apply
ing A
naly
tics s
olu
tions
9
Variability
of apply
ing A
naly
tics s
olu
tions
9
Org
aniz
atio
nal s
tructu
re o
f support
ing th
e
applic
atio
n o
f A
naly
tics s
olu
tions
9
giv
e feedb
ack
Man
ag
ers
Identify
eva
luate
busin
ess
outc
om
e
Busin
ess P
rocess
eva
luate
, te
st,
pro
vide fe
edb
ack
for im
pro
vem
ent
acquir
e
manage
initia
te in
tegra
tion o
f new
data
cre
ate
new
initia
tive
s
execute
str
uctu
red
phases o
f in
itia
tive
Se
lecte
d g
rou
p o
f Exp
ert
s
for
ne
ce
ssary
init
iative r
ole
s
(Cro
ss-f
unct
ionalit
y4)
Exte
rnal
Exp
ert
s
Expert
ise &
Cre
ativ
ity
(in
div
idu
als
of
org
an
izatio
n)
hold
Expert
ise &
Cre
ativ
ity
(Exte
rnal
Exp
ert
s5)
hold
Ind
ivid
uals
of
org
an
izatio
nhelp
to
matu
re
Initia
tive
technolo
gy
change (
cost e
ffective
)
Co
mp
eti
tive A
dvan
tag
e
Su
sta
inab
le C
om
peti
tive A
dvan
tage
inve
st i
n s
tructu
re
intr
oduce id
eas
Concept
(→) A
ctivi
tyA
ttribute
#Pro
positi
on
Acto
r(
) In
put
Co
re c
on
cep
t
Figure 25: Creating competitive advantage from Analytics
153
solves the problem experimentally and iteratively by presenting intermediate insights
extracted from data to users for evaluation and directions. If the intermediate insights
fulfill the performance criteria of the users, a consumable solution is developed that is
appropriate to the decision-making of users and the process requirements for decision-
making. The users must integrate the solution into their decision-making process during
value creation in the business process and make decisions and take actions accordingly.
The impact of integrating Analytics into the value creation process is enhanced by the
variability of applying Analytics solutions, the frequency of their use, and supporting
organizational structures, as well as a culture fostering innovation and welcomes change.
Analytics solutions, which are created to solve complex and business critical problems
that are ahead of the problems the competition has solved and are applied frequently and
amongst a variety of such solutions in the value creation process, provide value that has
the potential to generate competitive advantage to an organization. To sustain such
competitive advantage, users need to provide feedback on deployed Analytics solutions
and introduce further ideas for new solutions. Based on the feedback, evaluation of
business outcomes, and collection of new data, managers must initiate maintenance and
advancement of deployed solutions. Further, they must create new Analytics initiatives
from the ideas.
Hence, Analytics presents a manifestation of knowledge-based generation of competitive
advantage. This research emphasizes it as supplement to the organizations’ toolboxes that
is suitable for problems with relevant knowledge held in data or for which data can be
collected – which are becoming more and more common. It does not present a single
standing way of generating competitive advantage for most organizations. As with any
tool, the value generated from it depends on the right use and, further, it does not
guarantee competitive advantage.
This explanation was concluded from eight confirmatory case studies, which provided
evidence to support or reject propositions based on the resemblance of the KBV with the
Analytics literature and rival explanations to these propositions. The extensive data
collection and analysis resulted in eight propositions being supported, one proposition
being rejected because of an incomplete explanation, and another proposition being
rejected. However, due to the research design, the collected evidence allowed to derive
an explanation of how competitive advantage can be generated from Analytics. The rival
154
explanations, mostly rejected, nevertheless supported adjustments and demonstrations of
exceptions to shape the explanation.
5.5.1 Theoretical implications
This research contributes to two research streams. It provides supporting evidence for the
validity of the research stream of the knowledge-based view due to its manifestation as
the lifecycle of Analytics initiatives. The necessity of not just holding resources but using
them in the right way in the value creation process is strongly supported by the evidence.
Thus, any technology and concept must be evaluated on the use cases it provides and the
problems it can solve in organizations. It should not be hyped for a potential value that
cannot migrate into the processes of organizations. The importance of the effort of
integrating knowledge into the value creation process, the role of individuals in the
organization, and of the integration process as formulated in the KBV are strongly
supported by the evidence. The moderating factors are prone to be overlooked in
consideration of the necessary characteristics of the resources.
The role of the market as knowledge source was discovered to be broader than described
in either the KBV or Analytics literature and should be investigated further. Research
must take a deeper look at the changing role of the market in this digital economy.
Valuable knowledge can be converted ever faster into micro-products and services and,
thus, be sold to organizations, which can integrate the knowledge into their processes.
Competitive advantage could be generated from a meaningful combination of market
sourced micro-products and services to generate a unique and advantageous value
creation process.
For the research streams of Analytics, a theoretical foundation for the effectiveness of
best practices has been provided. This foundation provides explanations for the
superiority of certain practices, which are experienced as working better than others.
Further, an emphasis on cost-effectiveness was introduced, presenting Analytics in the
context of restrictions of mindful application and prioritization – to make data-driven
decisions about the methods used for data-driven decision-making. In addition, for this
data focused field that appears to be very technical, the reliance on creativity and ideas
has been discussed and should receive further research attention regarding how to identify
and support the right creative talent in organizations.
155
Regarding cross-functional problem-solving with Analytics, the role of a mediator should
be investigated further. While the role of translation between different experts has been
declared as the mediator’s limit, this interpretation might be under-valued. Further, this
mediator might be specialized in methods to stimulate the generation of ideas and induce
additional ideas from experts who hold specialized knowledge but are not using it at a
full capacity on a problem.
Research should further evaluate the use of agile methods for the research process. Short
but frequent iterations with the audience the research wants to address might provide more
impactful research to this audience. However, this is not intended as an argument for
discarding scientific rigor, but a paradigm shift from thinking about how to address the
audience, to a process of frequent exchange with the audience.
Regarding LSCM, this paper identifies the need for further research on the impact of
digital and Analytics-based business models on LSCM. This paper has perceived a
disregard of LSCM organizations for the risk from such business models, while they
could eventually eat up profitable business and margins from LSCM organizations and
force these organizations’ services to a commodity status. This potential development
should be studied further.
Finally, further research is necessary on the beneficial integration of visibility into LSCM
processes and the changing decision landscape. While the visibility is increased, it may
not be beneficial without the ability to exploit it and opportunities to act on it. To gain
this ability, extensive change of the supply chain might be necessary.
5.5.2 Managerial Implications
This research provides guidance for the execution of Analytics initiatives derived from
the domain of LSCM, embodied in the subfield of Supply Chain Analytics. Managers are
directed to base their pursuit for advantages, including competitive advantages, not just
on analytical methods, but also on the problems chosen on which to use the analytical
methods. To find these problems, managers must foster curiosity and the generation of
ideas among employees. To ensure obtaining value from the solutions, they must build
the trust of the intended users in the solutions and establish a culture that embraces
change.
In this regard, this study advises not to glorify data scientists. While the role is new,
scarce, and has potential to be impactful on organizations, it is strongly dependent on the
156
other experts of the organization. An image of the data scientist as jack-of-all-trades who
naturally supersedes the process experts by building data driven solutions devalues these
experts and negates their willingness to cooperate. Indeed, the cost benefit ratio of such a
jack-of-all-trades is a fallacy, because this quite expensive multi-talented individual has
a finite workload capacity in which tasks outside mathematical and analytical
specialization would have to be accommodated.
This study demonstrates that Analytics does not just comprise the analytical. Managers
interested in using Analytics must be aware of iterative ways to build the solutions with
cross-functional teams, especially including the intended users, to overcome the difficulty
of extracting insights from the data and to ensure the deployment and use of the solution.
They may contract providers to help them build maturity in Analytics but also for the
purpose of getting access to knowledge they only need in rare instances and as an
“extended workbench”. Deployed solutions should be maintained to ensure performance
and technical functionality and for improvements based on constant feedback and
inspired by other initiatives.
There is a causality dilemma, since a good data infrastructure is required to identify
beneficial use cases, but beneficial use cases are required to motivate investments into
data infrastructure. Evidence suggests managers should make courageous investments in
infrastructure to set a basis for valuable Analytics initiatives and to substantiate the desire
to increase the use of Analytics in their organizations. Presenting and substantiating this
desire is important to spark ideas for use cases and problems to tackle. As observed by
the interviewees, asking the people in the processes and encouraging them to generate
ideas will almost certainly result in Analytics initiatives that can create value in the
organization and is the way to mature in Analytics and tackle more complex Analytics
with a competitive edge.
Regarding LSCM, organizations which are already conducting projects in cross-
functional teams that bring all relevant functions to the table and work towards an end-
to-end supply chain vision should consider exploiting this cross-functionality further.
This study has highlighted the value of marginal knowledge, which can be
operationalized by introducing additional experts into such cross-functional teams to
generate new ideas and approaches.
This study emphasizes building a culture that supplements the strong pride in the physical
process management and optimization skills with an appreciation of supporting functions
157
such as IT and Analytics. This is certainly not routinely the case with market leaders, but
the LSCM field is composed of a broad range of small and medium organizations, which
can benefit from these supporting functions as well as need to be open to them.
5.5.3 Future research and limitations
Considering the evidence collected in this research, some aspects present a strong demand
for future research. First, it is necessary to create guidance for data governance,
investigate appropriate analytical actions that harm neither ethics nor privacy, systematize
practices to ensure privacy while enabling analysis of organizational activities, and
provide reflected discussions on ethical Analytics. Second, willingness to change is a
long-lasting issue, which requires means for managers to investigate and overcome
resistance to change in order for initiatives to be effective. Third, while the estimated
percentage of today’s jobs likely to be automatable is very large, this research indicates
that this ability might not be used, and control may be kept in the hands of users. Research
is necessary to understand which decisions managers will not give out of hand and for
what reason, to provide a better projection of the future of automation and allow a
longitudinal observation to reveal whether these reasons are sustained or change over
time.
There are limitations that apply to this research. This research was conducted on the
example of LSCM and, consequently, provides a generalization within the bounds of the
LSCM domain in Germany. This research should be recreated for other domains, with an
emphasis on the factors that distinguish each domain in the use of Analytics. There has
been limited access to interviewees, which has been compensated with an extensive
review of documents. The number of experts available for this investigation was limited
due to the novelty of Analytics to a broader range of domains and organizations. Further,
these experts are busy and work on topics for which disclosure is undesired. In addition,
the number of case studies could have been increased for increased validity. Finally, while
confirmatory case studies are rarely observed in the scientific literature as opposed to
survey research for collecting confirmatory evidence, the approach was chosen to gain
the opportunity to shape the explanation in focus. Thus, further quantitative confirmatory
methods might be employed to validate the results.

158
Submitted version. Herden, T. T., Nitsche, B., & Gerlach, B. (2020). Overcoming Barriers in Supply
Chain Analytics—Investigating Measures in LSCM Organizations. Logistics, 4(1), 5.
https://doi.org/10.3390/logistics4010005 (published by MDPI, CC BY 4.0)
159
6 Overcoming Barriers in Supply Chain Analytics – Investigating measures in
LSCM organizations
While Supply Chain Analytics shows promise regarding value, benefits, and increase in
performance for Logistics and Supply Chain Management (LSCM) organizations, those
organizations are often either reluctant to invest or unable to achieve the returns they
aspire to. This article systematically explores the barriers LSCM organizations experience
in employing Supply Chain Analytics that contribute to such reluctance and unachieved
returns, as well as measures to overcome these barriers. By using Grounded Theory
through 12 in-depth interviews and Q-Methodology to synthesize the results, the article
derives core categories for the barriers and measures, and their impacts and relationships
are mapped based on empirical evidence from various actors along the Supply Chain.
Resultingly, the article presents the core categories of barriers and measures, including
their effect on different phases of the Analytics solutions life cycle; the explanation of
these effects; and accompanying examples. Finally, the article provides recommendations
for overcoming the identified barriers in organizations.
6.1 Introduction
The business of Logistics and Supply Chain Management (LSCM) is changing rapidly
based on new technologies and consumer trends that demand new and broad digital
capabilities (Monahan et al., 2017). The phenomenon that is taking hold of this business,
transforming it, and that demands action from the organizations in the market, is
digitalization (Chung et al., 2018). One of the inherent effects of digitalization is the
constant growth of data, describing all sorts of aspects of the world and, thus, possessing
potential insights about it and opportunities to act on those. This growth is not expected
to halt or decelerate but to accelerate exponentially – a recent study estimates a growth of
the global datasphere from 33 zettabytes in the year 2018 to 175 zettabytes in the year
2025 (Reinsel et al., 2018).
To leverage the growth of data and the opportunities of digitalization, the studies
mentioned above emphasize the use of Analytics. Analytics is the use of various
quantitative, explanatory, and statistical methods on extensive amounts of data
(Davenport and Harris, 2017). When focused on the context of Logistics and Supply
Chain Management, it is specified as Supply Chain Analytics (SCA) (Souza, 2014).
160
Scholars have established that SCA helps to improve organizational and supply chain
performance, increase efficiency, reduce supply chain costs, and contribute to
competitive advantage (Chae, Yang, et al., 2014; Dutta and Bose, 2015; Sanders, 2016;
Trkman, 2010; Wang et al., 2016).
The implementation and application of SCA is, however, an immense challenge for
organizations. Scholars and organizational reports alike have demonstrated a variety of
barriers organizations face and the resulting effect of low implementation rates. Scholars
have presented barriers ranging from management failures and lack of analytical
knowledge to unwillingness to commit IT resources (Dutta and Bose, 2015; Kache and
Seuring, 2017; Lai et al., 2018; Richey et al., 2016; Sanders, 2016; Schoenherr and
Speier-Pero, 2015). Organizational reports highlight the barriers of cost, insufficient data,
and not achieving the benefits aspired to (APICS, 2015; Pearson et al., 2014; Thieullent
et al., 2016).
However, these studies did not explicitly intend to explore such barriers but identified
them in addition to their research objectives. And, despite these studies clearly
implicating the existence of various barriers, scholars in the field of LSCM have rarely
addressed the topic of measures to overcome these barriers. An exception is the study of
Schoenherr and Speier-Pero (2015), who provide some insight on factors contributing to
the successful implementation of Analytics in LSCM. However, research on practices and
measures has concentrated on the research field of Analytics in general. As a result, there
has been no investigation of whether LSCM employs specific measures, which measures
are most relevant for LSCM managers, and what impact they have. Thus, this study
intends to take a specific look at barriers occurring in the field of LSCM and identify
which measures and practices are being applied to overcome these barriers. This research
is intended to support Logistics and Supply Chain managers concerning directions in
which to go forward with SCA in a successful and impactful manner and support the
transformation of their supply chains into the digital age.
In particular, this study seeks to contribute to the following research objectives:
RO1: Depict the organizational barriers that appear when companies initiate, perform,
or deploy SCA initiatives within the organization.
RO2: Derive organizational measures that seek to cope with the depicted barriers.
161
In pursuit of these objectives, 12 in-depth interviews were conducted with different actors
along the supply chain including suppliers, OEMs, retailers, and Logistics Service
Providers, as well as additional Analytics providers with strong experience in LSCM.
From the exploratory and extensive interviews, the study identified the barriers to
initiating SCA initiatives, applying SCA, and deploying SCA solutions and derived and
the organizations’ measures for coping with such barriers. The collected data was
analyzed using the Grounded Theory approach (Strauss and Corbin, 1998). This approach
was supplemented by the Q-Methodology (Brown, 2004; Valenta and Wigger, 1997) to
derive a theoretical framework of measures and barriers in SCA, mapping barriers and
measures of SCA initiatives and their relationships. This contribution, in terms of
systemizing barriers and measures, extracting core categories, and identifying proposed
relationships, provides an important basis for further deductive research.
The remainder of the article is structured as follows. Section 2 provides an overview of
the relevant theoretical background to this study. Section 3 presents and details the
methodology. Section 4 contains the results and their discussion. The conclusion,
including implications, further research directions, and limitations, is presented in Section
5.
6.2 Theoretical Background
To overcome barriers that prevent the successful use of SCA solutions, this section
introduces SCA and its previously documented barriers. Further, this section presents the
recommended practices discussed in non-domain-specific Analytics literature as a
preliminary analysis of available measures.
6.2.1 Supply chain Analytics
SCA is understood as the domain-specific application of Business Analytics (or
Analytics), which is “concerned with evidence-based problem recognition and solving
that happen within the context of business situations” (Holsapple et al., 2014, p. 134). In
organizations, it is applied by analysts (“Data Scientists”) using the most advanced and
complex tools and methods (Davenport and Harris, 2017) or by process experts in the
form of self-service Analytics exploiting the accessibility of Analytics in respective
software for self-service (Beer, 2018). Analytics is an essential component of generating
value from Big Data (Gandomi and Haider, 2015). Analytics has been reported to increase
decision-making effectiveness, can generate organizational agility (given a fit between
162
analytics tools, data, people and tasks), and can contribute to providing competitive
advantage (Cao et al., 2015; Ghasemaghaei et al., 2017; Ransbotham et al., 2015).
SCA is specific to the domain of LSCM. LSCM is concerned with efficiently integrating
the actors of the supply chain (suppliers, manufacturers, logistics service providers such
as warehouses and transportation, retail) such that products are manufactured and
distributed to the customer in the right amount, at the right time, at the right quality, and
with system-wide minimal cost (Simchi-Levi et al., 2003). As a pivotal perspective to the
definition based on actors and objectives, the definition of Christopher (2011) introduces
the various activities and managed entities of LSCM. These include management of
procurement and movement and storage of products in the different stages of their life
cycles as materials, parts, and finished inventory. While the multi-objective trade-off
under the influence of various actors, tasks, and entities already indicates the need for
advanced methods to support decision-making, further aspects increase this need.
Dynamic vertical, horizontal, and diagonal interactions among actors create hard to
control complexity (Dittfeld et al., 2018), complexity increases the occurrence of
disruptive events and, thus, operational and financial risks (Bode and Wagner, 2015), and
due to the focus on the customer, common methods for managing disruptive risks from
other domains are potentially a poor fit to LSCM (Heckmann et al., 2015). Further,
besides disruptive events, volatility results in further mismatch of supply and demand
(Nitsche and Durach, 2018), adding to the need for advanced methods to support decision-
making.
SCA caters to the various decision-support needs of LSCM as it exploits the variety of
Analytics methods for the multitude of issues (Souza, 2014). Thus, it is concerned with
applying quantitative and qualitative analytical methods to recognize and solve problems
evidence-based in the context of LSCM (Herden and Bunzel, 2018; Souza, 2014; Waller
and Fawcett, 2013). In this regard, SCA helps to measure and monitor performance,
understand and control poor performance, and improve performance (Chae, Yang, et al.,
2014; Trkman, 2010; Wang et al., 2016). However, with the variety of tasks requiring
support come a variety of applications that are hyper-specialized and also provide a
challenge for organizations in LSCM (Sanders, 2016). Further, adoption of SCA in
organizations in LSCM is slow, unwillingness to share data with supply chain partners is
widespread, and organizations experience barriers (Brinch et al., 2018; Kache and
Seuring, 2017; Schoenherr and Speier-Pero, 2015).

163
6.2.2 Barriers of Supply Chain Analytics
In this section, barriers to adopting and employing Analytics are reviewed. Several studies
have discussed individual barriers in the domain of LSCM. However, these barriers are
widely spread across studies with no study systemizing them or exploring barriers
explicitly to create a comprehensive catalog. The presented literature overview is
intended as a basis for the data collection. This literature overview is limited to the field
of LSCM.
Following the cycle of an adoption process, an early barrier to adopting Analytics is the
approachability of Analytics. Efforts to adopt and employ Analytics may be slowed down
by a lack of consensus regarding the terms surrounding the concept of Analytics and the
subsequent confusion (Kache and Seuring, 2017; Richey et al., 2016) as well as the
perception of complexity and the difficulty of its management (Lai et al., 2018;
Schoenherr and Speier-Pero, 2015). This is accompanied by a constant change of
technologies and methods, which organizations would need to be able to keep up with
(Sanders, 2016; Wang et al., 2016). Further, managers see the lack of LSCM specific
solutions as a barrier (Schoenherr and Speier-Pero, 2015). Sanders (2016) describes this
inability to adopt analytics due to overwhelming complexity as “Analysis Paralysis.”
When approaching Analytics despite the perceived complexity, organizations in LSCM
encounter a lack of experience of employees in Analytics and utilizing data (Sanders,
2016; Schoenherr and Speier-Pero, 2015). As opposed to the paralyzing complexity
described above, the missing literacy concerning data and Analytics is expressed in
missing knowledge and creativity. The lack of knowledge about how to approach and
utilize data has been repeatedly stressed in the literature (Brinch et al., 2018; Kache and
Seuring, 2017; Oliveira et al., 2012; Richey et al., 2016; Sanders, 2016; Schoenherr and
Speier-Pero, 2015). This includes the identification of data most suitable for Analytics,
understanding which data is useful and which is useless, experience with relevant
technologies, ideas about what to do with the available data, knowledge on how to
transform data into information for decision-making, and how to drive the supply chain
with data. Oliveira et al. (2012) emphasize organizations’ lack of roadmaps on using data
and information even after systems for data collection have been set up. A further
hindrance in this context is the inability to clearly point out how value in terms of the
business objectives is generated from Analytics, and thus to sell Analytics initiatives to
key stakeholders (Kache and Seuring, 2017).

164
To adopt and employ Analytics, resources are needed. Labor resources comprise the first
form of resource identified in the literature as creating challenges for organizations in
LSCM. One study reports time constraints as a primary barrier (Schoenherr and Speier-
Pero, 2015), indicating the lack of time to get familiar with Analytics and relevant
technologies as well as to execute initiatives in addition to daily business. Zhu et al.
(2018) emphasize the time-consuming effort of getting Analytics solutions into
production (meaning implemented and used in the value creating process), which might
consume time from a variety of employees and hinder parallel initiatives. In addition,
some labor requirements for Analytics present a challenge for LSCM organizations in
themselves. The literature emphasizes a lack of employees in LSCM organizations to
handle and understand data, Analytics software, and IT systems, as well as being able to
interpret the Analytics results (Ramanathan et al., 2017). However, Kache and Seuring
(2017) report that LSCM managers lack an understanding of what skills the required
employees need to possess, leading to problems in recruiting these employees.
The second form of resources needed is monetary investment. The cost of solutions
available on the market, the cost of getting the necessary raw data, and systems integration
(of the focal organization and its partners) are named as barriers to adopting Analytics
(Richey et al., 2016; Sanders, 2016; Schoenherr and Speier-Pero, 2015; Srinivasan and
Swink, 2018). In addition, the returns from the investments and the benefits are hard to
predict and unclear in advance. Thus, it is hard to estimate the breakeven point (Oliveira
et al., 2012; Richey et al., 2016; Sanders, 2016). Furthermore, scholars highlight the
problem of attribution of any performance increase to the investment in Analytics. They
present issues of quantifying benefits, attributing benefits to Analytics or process
changes, and time lags between implementation and identifiable performance increase
(ramp-up) (Oliveira et al., 2012; Ramanathan et al., 2017; Trkman et al., 2010). In this
regard, scholars have referenced the “IT productivity paradox,” as discussed by
Brynjolfsson (1993), which presents the paradoxical situation of researchers not being
able to measure a productivity increase from IT while organizations were increasingly
investing in it (e.g., because performance increase is not measurable with their usual
performance measurement or because of time lags).
To employ Analytics, usually several data sources have to be combined to solve complex
business question (continuously). However, the issue of integrating systems in a diverse
and incompatible IT landscape impedes the integration of data sources. LSCM managers
165
reported a lack of integration of existing systems to scholars, due to evolved (rather than
designed) environments with specialized systems for the various business units or due to
legacy systems not intended for data exchange (Kache and Seuring, 2017; Ramanathan
et al., 2017; Richey et al., 2016; Schoenherr and Speier-Pero, 2015). Scholars have
emphasized that the issue is particularly present when Supply Chain partners with
unaligned systems (fragmented systems with varying maturity) are expected to combine
data sources (Kache and Seuring, 2017). Mistakes in this integration of systems can lead
to inaccurate results and wrong decisions (Oliveira et al., 2012).
The supply of data is another major barrier to the adoption and employment of Analytics
in LSCM. First of all, a lack of data or a lack of timeliness in providing the data has been
reported as hindering (Hazen et al., 2014; Sanders, 2016; Schoenherr and Speier-Pero,
2015). Hazen et al.(2014) have particularly stressed the issue of insufficient data quality
in general, which other scholars have confirmed, expanding the issue to having different
quality levels controlled by different employees (Chae, Yang, et al., 2014; Richey et al.,
2016; Srinivasan and Swink, 2018). Hazen et al. (2014) further stressed lack of means for
measuring data quality, controlling data quality, and the persistence of bad quality data
as input to Analytics until they are actively removed (since they are not consumed as
opposed to other inputs). Further scholars added inexperience in assuring data quality to
the list (Roßmann et al., 2018).
Having access to data comes with the issue of responsibility for that data, which can limit
its usability for Analytics. Handling customer data alongside the organization’s own data
brings the responsibility for organizations in LSCM to ensure data privacy and data
security (Kache and Seuring, 2017). Moreover, access does not equal ownership. Data
ownership and the associated rights to data can be missing or unclear (Ramanathan et al.,
2017; Richey et al., 2016).
To gain access to relevant data from supply chain partners or the right to use the data from
partners for Analytics, their collaboration on data and Analytics is needed. However,
several scholars present the issue of unwillingness of supply chain partners to participate
in data sharing or its dependency on the provision of incentives and security (Kache and
Seuring, 2017; Roßmann et al., 2018). Partners may want to, and should, keep certain
data confidential (e.g., for legal reasons), but they also keep their data to themselves
because of lack of trust and fear of losing control over their data (Kache and Seuring,
2017; Richey et al., 2016).
166
If all the barriers above are somehow overcome, the use and subsequent benefits of
Analytics solutions in LSCM organizations are not assured. Scholars report issue with the
mindset of employees regarding Analytics solutions. The employees may not want to use
new, Analytics based systems, do not show openness towards them, and are not eager to
change their culture (Dutta and Bose, 2015; Ramanathan et al., 2017; Schoenherr and
Speier-Pero, 2015). Richey et al. (2016) specifically discuss how employees in LSCM
value relationships and trust-based business generation, which they do not want to
sacrifice for data driven solutions.
Another barrier to the adoption and employment of Analytics in LSCM can be the
physical process assumed to be supported by the Analytics solution. Scholars discuss the
reduced impact of Analytics if the process has a low level of uncertainty (or volatility)
(Srinivasan and Swink, 2018; Zhu et al., 2018). While this takes only a certain range of
application areas into account and ignores benefits for complex information inputs or
benefits for faster decision-making, it presents the potential flaw of employing Analytics
to processes that may offer little value in terms of return on the investment. Reversing the
perspective, Oliveira et al. (2012) emphasize the need for a certain level of process
maturity before employing Analytics and gaining value from it, and Srinivasan and Swink
(2018) present the need for flexibility in the physical process such that reactions to
analytical results can be applied. If there is no flexibility, the opportunities to gain value
from Analytics are foregone since they cannot be executed. As a result, the value and
benefits from Analytics depend on the status of the physical process, whose weaknesses
can become barriers to utilizing the full potential of Analytics.
Assuming that all the above barriers are overcome, nevertheless the absence of
governance of Analytics can hinder organizations from gaining the expected value from
Analytics. A lack of top management commitment and understanding of advantages from
Analytics will of course hinder the adoption of Analytics in the first place (Lai et al.,
2018). When employing Analytics, the lack of governance can result in a lack of focus
and missing relevance of the results produced (“measurement minutiae”), reducing the
effect of Analytics (Sanders, 2016). However, scholars have stressed that the result of the
absence of strategically and managerially controlled Analytics is isolated and fragmented
Analytics efforts, resulting in only small benefits (even in disadvantages for other
functions) and unaligned Analytics maturity along business functions (Ramanathan et al.,
2017; Sanders, 2016). To conclude, Analytics efforts need to be guided by an
167
organizational understanding of the purpose of Analytics and it should be incorporated
into the business strategy. Otherwise, gaining the hoped for value and benefits can be
impeded (Kache and Seuring, 2017).
6.2.3 Measures to fully utilize the benefits of Analytics
As opposed to barriers, measures are rarely addressed in the LSCM literature. Even in the
field of Analytics, countering barriers is usually a side note. In particular, no study could
be found systemizing measures, deriving core categories, or identifying effects and
relationships. In this section, practices and measures are explored considering literature
on Analytics in general and the few studies from the LSCM domain.
Schoenherr and Speier-Pero (2015) investigated several contemporary aspects related to
the adoption level of Analytics in LSCM organizations and created a list of circumstances
that lead to a higher motivation for organizations to adopt Analytics. Their list does not
intend to show how organizations created the circumstances intentionally or
unintentionally but explores the status quo in these organizations. Thus, the list does not
represent executable practices. The motivators include the existence of aspects the
absence of which was noted, in the discussion above, as forming a barrier, such as senior
leadership promoting Analytics and displaying commitment. Further, the use of Analytics
is encouraged by competitors and colleagues, and to a lesser degree by customers as well.
The strongest motivator for using Analytics has been reported as the user’s conviction
about the value of Analytics, implying the need to experience the value from Analytics,
probably in support of the user’s own processes.
Scholars have presented several practices to make the use of Analytics more appealing,
which could lead to increased conviction concerning the value of Analytics and motivate
its continued use. This includes visually appealing software interfaces, which would also
contribute to make the results easier to understand and comprehend, mobile availability
via tablet computers and smartphones, which have been observed to increase the
frequency of using Analytics, as well as user-engaging approaches that strive to stimulate
interaction, like gamification or self-service (Wixom et al., 2013). Further, showing the
outcome of decisions on individual scorecards or assessments after (minor) decisions is
supposed to build trust in Analytics and show its value, while scholars report this
application in a supportive way as opposed to a blaming or judging way (Ransbotham et
al., 2015; Ross et al., 2013). Additionally, for stakeholders, who are needed to provide
168
funding, Analytics can be made more appealing by articulating relevant business cases
(Davenport and Harris, 2007).
In contrast, scholars have also reported more instructive practices. Recommended
supportive change management efforts include promotional activities, training courses,
and coaching concerning Analytics and its goals and benefits (Ross et al., 2013; Seddon
et al., 2017; Watson, 2014). Further practices include underlining the necessity to
discontinue non-data driven methods, the demand for data-based explanations in
decision-making, and incentives for data-driven decision-making (McAfee and
Brynjolfsson, 2012; Watson, 2014). One recommendation even suggests managers
allowing themselves be overruled by Analytics to promote their trust in it (McAfee and
Brynjolfsson, 2012). However, the replacement of employees who are unwilling to
change has also been suggested (Watson, 2014).
For advancing Analytics in the organization, several practices have been presented. To
create more relevant business cases requires managers to build a certain understanding of
Analytics – not for application, but for understanding execution and requirements
(Ransbotham et al., 2015). Another recommendation for managers is to ask second order
questions, which are, roughly described, questions not about how to improve the solution
to a problem, but questions around finding another solution to the problem (Marchand
and Peppard, 2013). However, efforts are also suggested from the analysts’ side, either
by getting “translators” to explain Analytics in business terms or requiring Analytics
experts to build business understanding (Bose, 2009; Davenport and Harris, 2007;
Ransbotham et al., 2015). Overall, the LSCM-specific and general Analytics literature
suggests an incremental and evolving approach, potentially starting in high impact areas
(Bose, 2009; Sanders, 2016).
One relatively specific practice, as compared to the other practices presented above, is
the collaborative approach between Analytics experts and business experts, which helps
to build Analytics expertise on the business side, and vice versa, and supposedly results
in better use cases and outcomes. This has been suggested by several scholars, named a
“field and forum” approach, “shadowing,” or simply described as the Analytics expert
joining the business expert in his real-work value creation and decision-making processes,
including the related data usage, to learn and discuss opportunities for improvements
afterwards (Barton and Court, 2012; Marchand and Peppard, 2013; Wixom et al., 2013).
Another related practice is the use of “data labs”, in which experts from the different areas
169
are co-located to work collaboratively free from the distractions of daily business
(Marchand and Peppard, 2013; Wixom et al., 2013). These practices are complemented
by agile development methods, in which the progress of shorter periods (“sprints”) is
discussed, e.g., by assessing prototypes (Wixom et al., 2013).
In contrast to these practices oriented towards individuals, some practices to align and
integrate the Analytics efforts of an organization are suggested. Scholars suggest setting
up an enterprise-wide information agenda and strategic directions for data and Analytics
(Lavalle et al., 2011; Watson, 2014). A cross-functional integration of several business
units and collaboration in the organization, e.g., in a newly created center of excellence
for Analytics, and with key partners has been suggested specifically for LSCM, since
Analytics initiatives quickly influence partners (Kache and Seuring, 2017; Sanders, 2016;
Watson, 2014). Additionally, researchers have suggested creating a “single-source-of-
truth”, which demands data exchange between all business units, as an organizational
measure (Ross et al., 2013), although this also touches on technological issues.
Concerning technological aspects, one issue addressed in the literature is data. Scholars
have recommended creating data standards and automating data onboarding, integration,
and quality processes as much as possible to accelerate the creation of insight from data
(Wixom et al., 2013). It has further been observed that analytically mature organizations
employ centralized groups responsible for ensuring data quality and availability
(Davenport and Harris, 2007). In the context of LSCM, the structuring of data in a manner
described as “scrubbing” has been recommended as a first step in maturing in Analytics
(Sanders, 2016). The highlighted importance here is that the errors which would occur
during data generation are eradicated such that data is already clean, structured, and
organized for insight creation.
Another technological aspect comprises the IT systems. By analyzing the challenges and
opportunities of Analytics in LSCM, scholars stress the status of existing IT systems and
their role in making the use of Analytics challenging (Kache and Seuring, 2017). Thus,
they recommend the prioritization of continuous IT investments. Concerning data
integration issues in and between organizations (e.g., with supply chain partners),
researchers have presented the example of digital platforms, which act as a hub-and-spoke
system with interfaces to several partners and customers, instead of creating a point-to-
point connection (Sanders, 2016). Such a platform would level different formats and
standards.
170
6.3 Methodology
For this study, a mixed-methods approach has been chosen. The approach is set out in the
following sections. Data collection and data analysis are explained. This section
concludes with reliability considerations.
6.3.1 Research Design
A mixed-methods approach has been chosen, combining grounded theory (Strauss and
Corbin, 1998) and the Q-methodology (Brown, 2004; Ellingsen et al., 2010; Valenta and
Wigger, 1997) to exploit synergies between them. Explicitly, after open coding in which
phenomena are identified, grounded theory intends the scholars to use axial coding to
relate the identified phenomena to each other and selective coding to extract core
categories (Strauss and Corbin, 1998). This search for core categories is executed via the
Q-methodology, which intends to perform a perception based sorting, creating
categorizations and additionally unveiling patterns of perceptions forming the
categorizations and providing insights on them (Brown, 2004; Valenta and Wigger,
1997). This mixed-methods approach provides a more robust framework for the
relationships compared to either individual approach. Each of the methods has been used
in the context of LSCM to identify barriers and measures.
Researchers use Grounded Theory with the intention of creating deeper knowledge on a
research phenomenon, and have repeatedly done so to identify barriers and measures in
LSCM. For example, studies have identified and categorized barriers and coping
mechanisms on implementing sustainable practices in LSCM (Rauer and Kaufmann,
2015), the implementation of supply chain technologies in emerging markets (Saldanha
et al., 2015), and the transition towards a supply chain orientation (Omar et al., 2012).
These studies investigated barriers to transition to a rationally more beneficial position,
usually strongly influenced by human behavior, and the systematization of measures and
their effects. They emphasize the capability of Grounded Theory to aggregate knowledge
and build a consensus (Strauss and Corbin, 1998).
Specifically focusing on extracting consistent aggregation and groups of concepts, the Q-
methodology has been used as the method of choice in LSCM research. The method has
been used to form a mutually exclusive and exhaustive taxonomy of biased behavior in
supplier selection (Kaufmann et al., 2010), conceptualization of moderators and sources
of Supply Chain Volatility (Nitsche and Durach, 2018), and to aggregate attitudes and
levels of acceptance towards different innovations and practices in low-input food supply
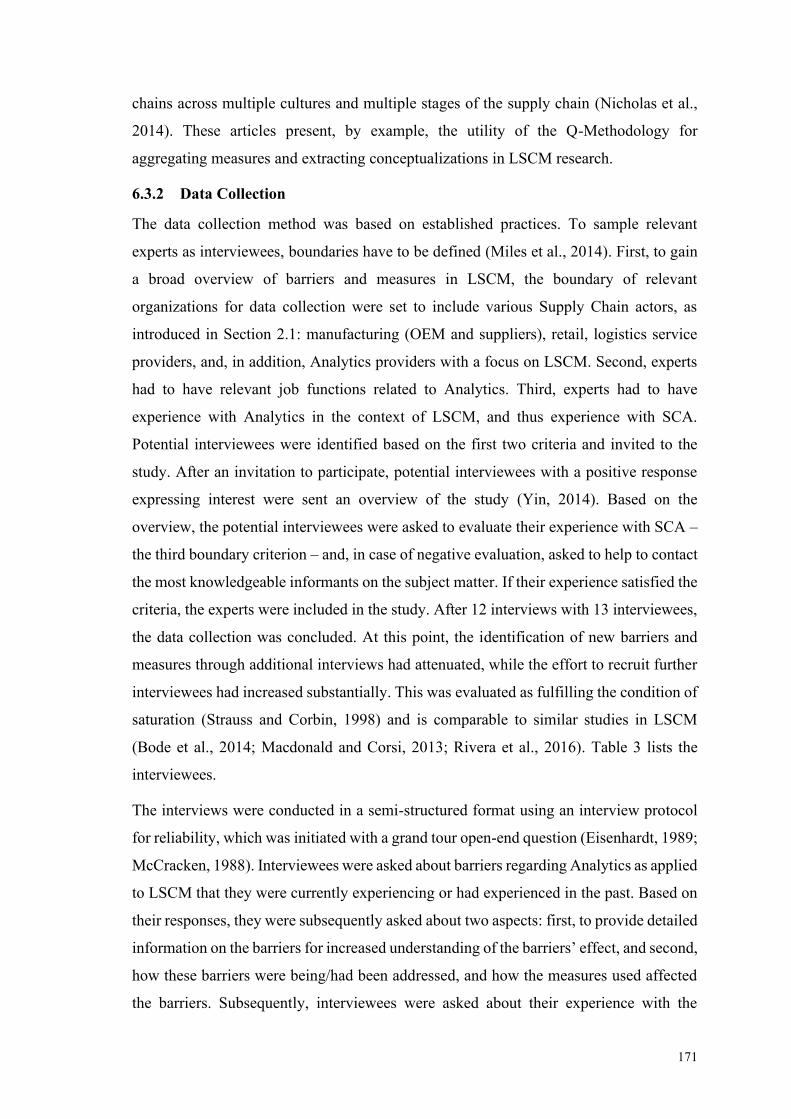
171
chains across multiple cultures and multiple stages of the supply chain (Nicholas et al.,
2014). These articles present, by example, the utility of the Q-Methodology for
aggregating measures and extracting conceptualizations in LSCM research.
6.3.2 Data Collection
The data collection method was based on established practices. To sample relevant
experts as interviewees, boundaries have to be defined (Miles et al., 2014). First, to gain
a broad overview of barriers and measures in LSCM, the boundary of relevant
organizations for data collection were set to include various Supply Chain actors, as
introduced in Section 2.1: manufacturing (OEM and suppliers), retail, logistics service
providers, and, in addition, Analytics providers with a focus on LSCM. Second, experts
had to have relevant job functions related to Analytics. Third, experts had to have
experience with Analytics in the context of LSCM, and thus experience with SCA.
Potential interviewees were identified based on the first two criteria and invited to the
study. After an invitation to participate, potential interviewees with a positive response
expressing interest were sent an overview of the study (Yin, 2014). Based on the
overview, the potential interviewees were asked to evaluate their experience with SCA –
the third boundary criterion – and, in case of negative evaluation, asked to help to contact
the most knowledgeable informants on the subject matter. If their experience satisfied the
criteria, the experts were included in the study. After 12 interviews with 13 interviewees,
the data collection was concluded. At this point, the identification of new barriers and
measures through additional interviews had attenuated, while the effort to recruit further
interviewees had increased substantially. This was evaluated as fulfilling the condition of
saturation (Strauss and Corbin, 1998) and is comparable to similar studies in LSCM
(Bode et al., 2014; Macdonald and Corsi, 2013; Rivera et al., 2016). Table 3 lists the
interviewees.
The interviews were conducted in a semi-structured format using an interview protocol
for reliability, which was initiated with a grand tour open-end question (Eisenhardt, 1989;
McCracken, 1988). Interviewees were asked about barriers regarding Analytics as applied
to LSCM that they were currently experiencing or had experienced in the past. Based on
their responses, they were subsequently asked about two aspects: first, to provide detailed
information on the barriers for increased understanding of the barriers’ effect, and second,
how these barriers were being/had been addressed, and how the measures used affected
the barriers. Subsequently, interviewees were asked about their experience with the
172
barriers presented in section 2.2 and, depending on the response, asked about measures
taken to overcome these barriers. The second part of the interview on measures was again
initiated with a grand tour open-end question on best practices used to increase the success
rate of Analytics initiatives and interviewees were asked to give justifications for their
use. These justifications were requested interrogated to understand whether these
practices were used to solve or overcome particular problems, and whether these practices
qualify as measures. The interviews were concluded with questions on the use of the
measures presented in section 2.3 and, depending on the response, the justification for
their use.
Participant Position (anonymized) Actor Analytics exp.
[yrs]
A Manager (functional) Analytics OEM 8
B Data Scientist LSP 12
C Data Scientist Supplier 3
D Head of Analytics OEM 19
E Manager Analytics Retail 3
F Director Analytics OEM 8
G Manager Analytics Supplier 2
H Head of (functional) Analytics LSP 6
I Manager Analytics Retail 14
J Sen. Data Scientist LSP 4
K Data Scientist Analytics Provider 3
L Data Scientist Analytics Provider 3
M Head of Analytics LSP 3
Table 3: Interview Participants
Since none of the interviewees was located near the researchers, most interviews were
conducted by phone. Previous studies have used telephone interviews for interview
research in LSCM as a measure to overcome the restrictions from different locations
without any reported bias (Bode et al., 2014; Gligor and Autry, 2012; de Leeuw et al.,
2016; Macdonald and Corsi, 2013; Manuj and Sahin, 2011; Rivera et al., 2016). Subject
to the approval of the interviewees, the interviews were audio-recorded and transcribed
verbatim, providing the qualitative data for analysis. The interviews lasted between 45
and 105 minutes, with an average of 65 minutes. Interviewers took handwritten notes
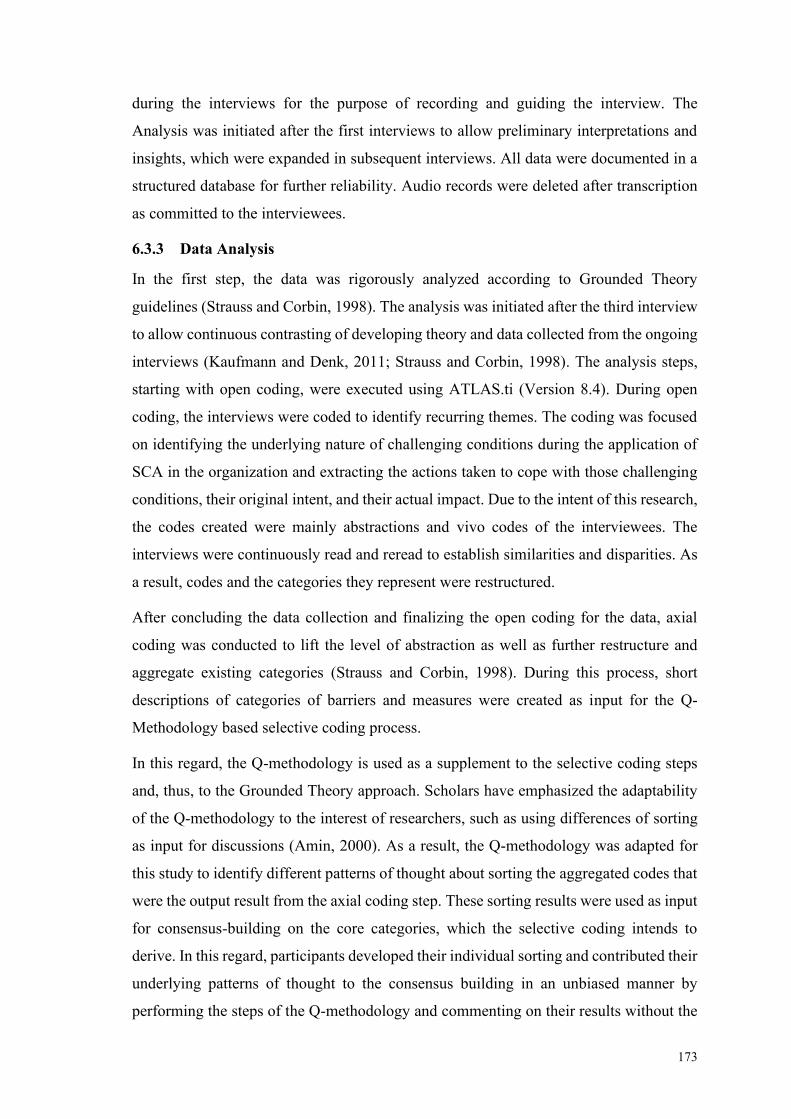
173
during the interviews for the purpose of recording and guiding the interview. The
Analysis was initiated after the first interviews to allow preliminary interpretations and
insights, which were expanded in subsequent interviews. All data were documented in a
structured database for further reliability. Audio records were deleted after transcription
as committed to the interviewees.
6.3.3 Data Analysis
In the first step, the data was rigorously analyzed according to Grounded Theory
guidelines (Strauss and Corbin, 1998). The analysis was initiated after the third interview
to allow continuous contrasting of developing theory and data collected from the ongoing
interviews (Kaufmann and Denk, 2011; Strauss and Corbin, 1998). The analysis steps,
starting with open coding, were executed using ATLAS.ti (Version 8.4). During open
coding, the interviews were coded to identify recurring themes. The coding was focused
on identifying the underlying nature of challenging conditions during the application of
SCA in the organization and extracting the actions taken to cope with those challenging
conditions, their original intent, and their actual impact. Due to the intent of this research,
the codes created were mainly abstractions and vivo codes of the interviewees. The
interviews were continuously read and reread to establish similarities and disparities. As
a result, codes and the categories they represent were restructured.
After concluding the data collection and finalizing the open coding for the data, axial
coding was conducted to lift the level of abstraction as well as further restructure and
aggregate existing categories (Strauss and Corbin, 1998). During this process, short
descriptions of categories of barriers and measures were created as input for the Q-
Methodology based selective coding process.
In this regard, the Q-methodology is used as a supplement to the selective coding steps
and, thus, to the Grounded Theory approach. Scholars have emphasized the adaptability
of the Q-methodology to the interest of researchers, such as using differences of sorting
as input for discussions (Amin, 2000). As a result, the Q-methodology was adapted for
this study to identify different patterns of thought about sorting the aggregated codes that
were the output result from the axial coding step. These sorting results were used as input
for consensus-building on the core categories, which the selective coding intends to
derive. In this regard, participants developed their individual sorting and contributed their
underlying patterns of thought to the consensus building in an unbiased manner by
performing the steps of the Q-methodology and commenting on their results without the
174
other participants criticizing the sorting. The value of the participants’ comments on their
sorting process has been highlighted by Ellingsen et al. (2010).
In detail, the Q-methodology starts with two steps that set up the sorting process. First, a
concourse is created, which is the collection of statements pertaining to a research area of
interest derived from empirical and secondary data sources (Brown, 2004; Valenta and
Wigger, 1997). This step is equivalent to the open coding step that identified 154 codes –
in this case on barriers in applying SCA and measures to overcome them – from the semi-
structured interviews. The subsequent step is the creation of a Q-sample, which represents
a comprehensive, balanced, and representative subset from the concourse (Brown, 2004;
Valenta and Wigger, 1997). This step is intended to limit the number of statements by
grouping similar statements and refining statements that are too specific or too general
(Ellingsen et al., 2010; Valenta and Wigger, 1997). This step is equivalent to the axial
coding step that related similar codes in the data, 30 barriers and 59 measures.
The sorting procedure, named Q-sort, is performed on the Q-sample as a third step
(Ellingsen et al., 2010). As participants, three researchers with high expertise on LSCM
with different viewpoints on Analytics have been chosen. In accordance to Ellingsen et
al. (2010), the participants received a sorting instruction, were reminded about the non-
existence of a “right” sorting, and were given the task to perform the Q-sample freely.
The sorting instruction was explained as to sort the items based on the participant’s
perception of similarity. The free mode of the Q-sort was chosen such that the participants
had to create their own groups. This approach intended to promote the strength of the Q-
methodology, as repeatedly emphasized, of uncovering different patterns of thought,
perception, and opinions, which can be used to asses areas of consensus and friction
(Amin, 2000; Brown, 2004; Valenta and Wigger, 1997). Here, consensus on the core
categories of barriers to SCA and measures to overcome these barriers was assessed.
6.3.4 Reliability
The reliability of this study was judged based on criteria regularly used by scholars
evaluating the reliability of similar studies (Flint et al., 2002; Omar et al., 2012; Rauer
and Kaufmann, 2015; Thornton et al., 2013). The criteria of credibility, transferability,
dependability, confirmability, and integrity in these studies emerged from the
recommendations of Hirschmann (1986) as well as Lincoln and Guba (1985). The criteria
of fit, understanding, generality, and control emerged from Strauss and Corbin (1998).
175
Credibility describes the extent to which the results are acceptable representations of the
data. It was addressed by the timeframe of four months in which the interviews were
conducted, the review of the research summary by the interviewees, and the Q-
methodology that led to a review of the codes by three researchers (Flint et al., 2002;
Omar et al., 2012; Thornton et al., 2013).
The extent to which the findings can be applied from one context to another is covered in
the criterion of transferability. This was addressed by the theoretical sampling, which led
to a diverse set of organizations, business sizes, and roles in the supply chain (Flint et al.,
2002; Omar et al., 2012; Thornton et al., 2013).
The criterion of dependability refers to the dependence of the results on time and place,
and as a result the extent of the results’ stability and consistency. To ensure dependability,
interviewees were asked to reflect on the decisions, actions, and changes over time that
were related to the phenomenon and, thus, their past and present experience (Flint et al.,
2002; Omar et al., 2012; Thornton et al., 2013).
Confirmability measures the extent to which interpretations are the result of interviewees’
experience as opposed to researcher bias. To create confirmability, the research protocol
was used before and during the interviews to ensure that interviewees could prepare and
answer without researcher bias (Eisenhardt, 1989; Yin, 2014) as well as by providing the
results to the interviewees for review (Flint et al., 2002; Omar et al., 2012; Thornton et
al., 2013).
Integrity of this study, representing the extent of influence by misinformation and evasion
by participants, was ensured by conducting non-threatening, professional, and
confidential interviews (Flint et al., 2002; Omar et al., 2012).
The extent to which the findings were a fit to the area under investigation, inherent in the
criteria of fit, was addressed by the credibility, dependability, and confirmability criteria
(Flint et al., 2002; Omar et al., 2012).
The results’ reflection of the “own world of the interviewees, which is covered in the
criterion of understanding, was addressed by providing the results to the interviewees
with a request for comment and review (Flint et al., 2002; Rauer and Kaufmann, 2015;
Strauss and Corbin, 1998).
Generality describes the extent to which the findings discover multiple aspects of the
phenomenon under investigation. It was addressed by applying the Q-methodology to
176
integrate different patterns of thought into the study (Valenta and Wigger, 1997) and by
conducting interviews of a sufficient length (45–105 min), with extensive openness by
the interviewees, strongly focused on the area under investigation and covering multiple
facets related to that area (Flint et al., 2002; Omar et al., 2012; Rauer and Kaufmann,
2015; Strauss and Corbin, 1998).
Finally, control describes the extent to which organizations can influence aspects of the
emerging theory. By focusing on measures, the study strongly focuses on aspects over
which organizations have control, which was discussed with the interviewees during the
study to establish the existence of control (Flint et al., 2002; Rauer and Kaufmann, 2015;
Strauss and Corbin, 1998).
6.4 Results and Discussion
Resulting from the analysis of the data, one framework regarding the impact of barriers
on SCA initiatives and another framework regarding the measures to counter these
barriers have been derived. Due to the analysis, core categories have been extracted and
abstracted, which assemble the frameworks. This section presents and explains the
derived frameworks.
A major inference made from the analysis of the collected evidence has been that barriers
and measures affect different steps along the cycle of applying Analytics to a LSCM
organization. During the Q-Methodology, the researchers built consensus on
distinguishing four phases:
(1) “Orientation about Analytics” describes actions, circumstances, and events before
specific Analytics initiatives are planned. During the orientation, the necessary
conditions for applying Analytics are created and employees are motivated to
invent Analytics initiatives to be executed.
(2) “Planning of Analytics initiative” describes actions, circumstances, and events
during the set-up of a specific Analytics initiative, in which the addressed business
problem/ business case is specified, the approach designed, resources and budget
committed, and relevant people are invited to participate.
(3) “Execution of Analytics initiative” describes actions, circumstances, and events
during the development and creation of Analytics solutions in specific Analytics
initiatives. For example, this includes interactions with data, applications of
177
analytical methods, the use of technology, and interaction of analysts with
business experts.
(4) “Use of Analytics solution” refers to actions, circumstances, and events after the
solution development, which include the deployment of the Analytics solution to
users and their interaction with the solution in the short and long term.
Allocating the effects to project models such as CRISP-DM was rejected as unsuitable.
Several barriers and measures occur outside the usual scope of such models. Further,
barriers and measures show similar effects in most solution development phases, which
are differentiated in too much detail in these project models.
In addition, as extracted from the evidence, a distinction in the impact of barriers and
measures is made into capabilities and culture. Capabilities refers to the capabilities of
the organizations, the organizations’ processual and technological infrastructure and
standards, as well as the knowledge and skills of organizational members. On the other
hand, culture in the context of this study refers to the attitudes and behaviors of single
individuals or groups of individuals in the organization, such as their motivation, solution-
orientation, feelings, openness, and willingness, as well as their critical reflection on their
attitude and behavior. In this sense, culture does not have to reflect the general culture of
the organization, but only groups of individuals of the organization.
6.4.1 Barriers
Barriers that occur while applying SCA can be allocated with high confidence to either
capability issues or cultural issues. Ambiguous cases, which researchers had to discuss
extensively, were solely found in actors who omitted critical reflection on their decisions,
creating problems in subsequent process steps. Eventually, a consensus was reached
about such behavior corresponding to the attitudes of the actors and has, thus, been
allocated to the cultural side. Below, the identified categories of barriers and their impacts
are described, with examples. The framework of barriers on applying Analytics to LSCM
is presented in Figure 26.
From an aggregated point of view, the evidence shows that cultural barriers occur more
frequently during the phase of orientation and use, whereas capability barriers are more
frequent during the phases of planning and execution of Analytics initiatives. This result
is not surprising, since the phases of orientation and use demand the engagement and
motivation of, as well as interactions among, individuals who have their primary focus

178
Figure 26: Barriers of Supply Chain Analytics
Orie
nta
tion
abou
t
An
aly
tics
Pla
nn
ing
of
An
aly
tics
Init
iati
ve
Execu
tion
of
An
aly
tics
Init
iati
ve
Use o
f A
naly
tics
solu
tion
Capabil
itie
s
Cu
ltu
re
Mis
sin
g K
no
wle
dg
e
•E
mp
loy
ees m
iss u
nd
ers
tan
din
g o
f fu
ncti
on
ality
an
d
lim
its o
f A
naly
tics
•U
sers
in
exp
ed
ien
t re
qu
irem
en
ts o
n s
olu
tio
ns
•U
sers
mis
-tra
nsla
te b
usin
ess n
eed
to
an
aly
tical
need
•M
an
ag
em
en
t is
relu
cta
nt
to in
vest in
un
cert
ain
ben
efi
ts f
rom
An
aly
tics
Un
willin
gn
ess
•IT
dep
art
men
t d
oesn
’t s
up
po
rt
an
aly
tical
too
ls
•U
sers
are
un
willin
g t
he s
hare
data
fo
r so
luti
on
Un
willin
gn
ess
•IT
dep
art
men
t h
esit
ate
s to
cre
ate
fo
un
dati
on
fo
r A
naly
tics
•E
mp
loy
ees a
re c
om
mit
ted
to
esta
blish
ed
no
n-A
naly
tics
pra
cti
ces
•M
an
ag
em
en
t is
no
t co
mm
itte
d t
o A
naly
tics
Un
fitt
ing
co
nd
itio
ns
•A
naly
sts
(ta
len
t) n
ot
att
racte
d b
y o
rgan
izati
on
Mis
sin
g c
riti
cal
thin
kin
g
•E
mp
loy
ees a
ccep
t sh
ad
ow
IT
as s
ub
sti
tute
fo
r fo
rmal
An
aly
tics
•M
an
ag
em
en
t m
isd
irects
in
vestm
en
ts in
hy
ped
tech
no
log
ies
Mis
sin
g c
riti
cal
thin
kin
g
•M
an
ag
em
en
t m
isd
irects
inv
estm
en
ts in
un
fitt
ing
An
aly
tics in
itia
tiv
es
Mis
sin
g resp
on
sib
ilit
y
•U
nd
efi
ned
data
ow
ners
hip
lead
s t
o
mis
sin
g a
pp
recia
tio
n o
f
data
Mis
sin
g resp
on
sib
ilit
y
•U
nd
efi
ned
data
ow
ners
hip
lead
s t
o
mis
sin
g a
ware
ness o
f
imp
act
of
data
ch
an
ges
Un
fitt
ing
co
nd
itio
ns
•P
riv
acy
an
d c
on
fid
en
tiality
measu
res c
om
plicate
un
rela
ted
data
use
•T
arg
et
pro
cess h
as li
mit
s
an
d r
estr
icti
on
s
•T
arg
et
pro
cess is
no
t
sta
nd
ard
ized
or
sta
ble
Un
fitt
ing
reso
urc
es
•S
ho
rtag
e o
f d
ata
•In
co
rrectn
ess o
f d
ata
•H
ete
rog
en
eit
y o
f sy
ste
ms
•B
usin
ess ru
les n
ot p
resen
t
in r
aw
data
•T
ech
nic
al
issu
es o
mit
data
sh
ari
ng
wit
h S
C P
art
ners
Em
oti
on
•E
mp
loy
ees f
ear
to lo
se jo
bs a
nd
tasks
•S
C P
art
ners
mis
believ
e
in b
en
efi
ts o
r fe
ar
rep
erc
ussio
ns
fro
m d
ata
sh
ari
ng
Mis
sin
g K
no
wle
dg
e
•E
mp
loy
ees d
on
’t
un
ders
tan
d v
alu
e a
nd
po
ssib
le u
se c
ases
Un
fitt
ing
co
nd
itio
ns
•M
issin
g b
ud
get fo
r fo
un
dati
on
fo
r A
naly
tics o
mit
s
Init
iati
ves
Un
willin
gn
ess
•U
sers
are
un
willin
g t
o u
se
An
aly
tics s
olu
tio
n
Mis
sin
g K
no
wle
dg
e
•U
sers
are
un
ab
le t
o u
se
An
aly
tics s
olu
tio
ns
Mis
sin
g resp
on
sib
ilit
y
•M
issin
g o
vers
igh
t o
n a
cti
vit
ies c
reate
s u
nalig
ned
an
d r
ed
un
dan
t in
itia
tiv
es
Mis
sin
g K
no
wle
dg
e
•E
mp
loy
ees a
re u
nab
le t
o
ap
ply
An
aly
tics
•U
sers
mis
s u
nd
ers
tan
din
g
of
no
n-f
un
cti
on
ality
based
perf
orm
an
ce c
rite
ria
Em
oti
on
•U
sers
mis
tru
st
so
luti
on
to
cap
ture
all d
om
ain
part
icu
lari
ties
Mis
sin
g c
riti
cal
thin
kin
g
•A
naly
sts
cre
ate
wo
rkaro
un
ds
du
rin
g d
ev
elo
pm
en
t th
at
are
no
t d
ep
loy
ab
le
Mis
sin
g resp
on
sib
ilit
y
•U
nd
efi
ned
data
ow
ners
hip
co
mp
licate
s
data
access
179
on tasks and activities unrelated to Analytics. Unfamiliarity with and distance from the
topic create a different attitude and behavior towards Analytics as opposed to that of
analysts. Interviewees repeatedly emphasized that this unfamiliarity and distance must be
overcome by clearly showing these individuals the benefits of Analytics in their specific
areas of work. Capability barriers in these phases can either not be determined
specifically, since the specific problem for an Analytics initiative is not determined in the
orientation phase, or the potential capability barriers were addressed in the solution
development prior to use. The other way around, in planning and execution individuals
familiar with and close to Analytics are necessary, resulting in reduced barriers of attitude
or behavior in terms of unwillingness. However, discrepancies between needed and
available skills, technology, and data are impactful since they hinder the tasks and
activities necessary for solution development.
6.4.1.1 Capability Barriers due to unfitting conditions
Barriers due to unfitting conditions refer to circumstances in the organization’s processes,
infrastructure, environment, or reputation that strongly impede or prevent the execution
or completion of the development of an Analytics solution. The results show that such
barriers have been observed in all phases except for the use phase. An early obstacle for
organizations is absence of the talent needed for Analytics initiatives. Such talent does
not perceive LSCM as an attractive or challenging domain, as opposed to technology
organizations at the methodological forefront. In the planning of initiatives, efforts can
be halted due to various missing tools, technologies, or data needed for the initiative.
These foundational conditions can be missing since organizations – especially smaller
organizations – lack the budget for continuous investment. Further, such conditions can
become apparent during the execution of the initiative, when activities have already
begun. An example is the realization that the target process cannot be supported by
Analytics as intended, either because it is not standardized and stable enough to create a
beneficial solution or because it has process limits and restrictions that prohibit creating
improved solutions compared to those that exist. Such conditions usually demand
fundamental changes in the organization outside the realm of Analytics.
6.4.1.2 Capability Barriers due to missing responsibility
Barriers due to missing responsibility occur along all phases and usually result in extra
effort, avoidable with clearly assigned responsibilities. Missing responsibility on
ownership of data sources and the necessary actions and requirements connected to these
180
responsibilities leads to situations in which knowledge about existing data sources and
their location is unevenly distributed and the data and their flow are not well documented.
Thus, individuals in the organization lack the understanding of data and their importance
– an important component for the invention of potential initiatives. In specific initiatives,
this complicates execution due to unnecessary effort to access data owners and their data,
effortful coordination between several owners, and missing traceability of data usage
through the organization. Imprecise responsibilities on data may result in changes to data
by employees unaware of their relevance to Analytics solutions in use, compromising the
solution without any communication of changes. In addition, missing oversight of
Analytics leads to the development of heterogenous tools, methods, and solution
approaches, likely to produce redundant solutions for similar problems.
6.4.1.3 Capability Barriers due to missing knowledge
Missing knowledge on Analytics is a substantial barrier to using Analytics and can affect
the application of Analytics in LSCM organizations in a variety of ways. Without
individuals in business processes who understand Analytics and have experienced how
Analytics can create value, the search for potential initiatives in an orientation phase is
less likely to result in meaningful initiatives for these business processes. Since the value
is usually generated indirectly from actions taken due to the Analytics solution, this
barrier is inherent regarding Analytics. During the planning phase, this indirect value
generation and also the inherent uncertainty of the generated benefits, which are highly
dependent on the data and context, can lead to underestimation of the resulting value and
reluctance towards investments. The other way around, missing knowledge can result in
high and unworkable expectations, impractical or absurd demands on solutions abilities,
and ignorance of the limitations of Analytics. Combining this with a missing ability to
translate the business need into an analytical need due to missing knowledge, these
Barriers will result in initiatives that have no way of achieving the unrealistic or mis-
communicated objectives. In the execution, missing knowledge on functionality of
Analytics can result in the inability to let the business experts participate in the solution
process, or missing understanding of performance evaluation in Analytics can result in
the inability to gain acceptance for progress. Lastly, missing knowledge can result in the
users’ inability to use the developed Analytics solutions in their business processes,
denying the actual gain from the solution’s value.
181
6.4.1.4 Capability Barriers due to unfitting resources
Unfitting resources (data and systems) are barriers that become present during the
planning or execution of Analytics initiatives, but usually affect the execution. Unfitting
resources can prolong the development of the solutions, yield subpar success, or even halt
the solution. These issues are usually technical, such as the relevant data is missing,
especially for machine learning or time series methods; the data is incorrect, requiring
intensive cleaning and feedback for correct values from the process experts; or the
accessible data does not fully reflect the business rules, requiring additional preparation.
While solving these issues is foremost time intensive but solvable upon identification, the
identification of incorrectness or lack of fit to business rules might occur at a late stage,
such that the effort is doubled, or the solution developed from the data does not gain
acknowledgement from the users. Further, technical issues related to heterogeneity of
systems and the resulting incompatibility of the data with the systems prevent data access
or the integration of the data for more comprehensive analysis, which can either be
overcome with additional time and effort, or development of the solution may ultimately
be abandoned.
6.4.1.5 Culture Barriers due to unwillingness
As mentioned above, the reference to culture considered in this article does not have to
reflect the culture of the general organization, but can apply to small groups of
individuals. In this case, small groups that behave unwillingly in their areas of
responsibility can seriously impact the success of Analytics in an organization, including
specific initiatives or the ability to perform Analytics at all. Considering the barriers of
unwillingness, they become relevant when individuals motivated for Analytics become
dependent on the input and cooperation of others. During orientation, the dependency on
IT departments to create the foundation for Analytics in data and analytical software can
block the efforts of motivated individuals, when the IT department is unwilling.
Interdependent with this, employees unwilling to commit to Analytics will suppress
management’s motivation for Analytics, while missing commitment from management
can suppress employees’ motivation (and necessary resources such as budget) for it.
During the planning phase, when ideas are expressed, the motivated individuals bring
together their ideas and business problems but are less dependent on third parties,
assuming this phase is entered after management expressed support. In the subsequent
phases, in particular the unwillingness of potential users to provide their data or to use the
182
solution can have a strong negative effect on the benefits realized with deployment of the
Analytics initiative. This unwillingness can be traced to an unwillingness to change any
business customs that are already established, because of the effort to change (or rather
the ease to remain with the familiar) and the implication of changes, such as different
responsibilities (including reduced control), modified behavior, and altered processes.
This is often accompanied by an expressed disbelief in the potential and value of anything
that is not the habit.
6.4.1.6 Culture Barriers due to emotion
Emotions, especially of fear and perceived unfair treatment, are strong barriers to
employees accepting the organization’s pursuit of Analytics or use of solutions. In the
data, they have been primarily observed as a reaction to information asymmetries of
individuals not actively working on Analytics or not involved in solution processes, who
fill the asymmetries with assumptions. Involving employees such as potential users or
supply chain partners in the planning and collaborating with them in the execution can
create some level of transparency, such that emotion is a lesser barrier in these phases.
However, in the phase of orientation, during which employees and supply chain partners
might be left without well communicated intentions of the usefulness of Analytics or
might not fully believe the communicated intentions due to events in the past (e.g.,
something that builds general mistrust unrelated to the individuals eager to use Analytics),
they might react emotionally to the information asymmetries. In detail, employees fear
losing their jobs and supply chain partners fear repercussions from sharing data, building
resistance against Analytics initiatives. Similarly, developing solutions such that the
solution process is not transparent to the potential user can lead to mistrust and skepticism
towards the solution by the users. This emotion of mistrust is a reaction to the information
asymmetries between requirements and the adherence to the requirements by the
developed solution. This is particularly nurtured by analysts who over-sell their solutions.
6.4.1.7 Culture Barriers due to missing critical thinking
Missing critical thinking in the context of this paper refers to decisions made without the
necessary reflection of these decisions. While this could be a result of missing knowledge
and, thus, be a capability barrier, it can also result from not taking enough time and effort
for consideration, or enthusiasm about a critical problem finally being solved, which is
not to be impaired by critical considerations. This can occur as bandwagon behavior from
management directing the budget towards some hyped technology or some hyped use
183
cases unfitting to the business need, while the budget would be needed for foundational
technologies or uses cases that are boring, but beneficial. The missing business impact of
hyped but failed initiatives can generate mistrust of employees in new technologies, as
discussed above. On a user level, the continued use of business owned tools/shadow IT,
which usually lack adherence to standards, documentation, or may even have errors, is
often not critically reflected on regarding the impact of the creator leaving the
organization, compatibility with other systems, or fit with business strategy and rules.
Thus, the development of a standardized and adhering substitute in an Analytics initiative
is usually not triggered, while being highly necessary. During solution development, one
recurring issue is the creation of workarounds – technical debt – by analysts without
reflection on the impact on later development stages. The issues usually surface later and
create additional effort or can even prevent the success of the Analytics solution and its
benefits.
6.4.2 Measures
Overall, an allocation of measures that are directly assigned to specific barriers could not
be derived from the data, since interviewees expressed that some measures address
several barriers, and vice versa, by intention or not. Further, interviewees explained that
measures are adjusted and advanced over time as a reaction to the specific needs and
capabilities of the of organization and employees. Thus, measures on barriers are path
and context dependent. While several measures are presented in the following section, it
must be emphasized that the presentation is reduced to core categories as derived from
the grounded theory process. Examples are presented to improve comprehensibility and
to further illustrate the core categories. It cannot be generalized that certain, specific
measures will help all organizations to overcome certain, specific barriers, especially in
their vanilla form.
Reduced to the core categories, measures generally address capability barriers but
contribute to overcoming cultural barriers at the same time. Acceptance is gained by
building knowledge and creating processes for more transparent development and
information exchange – information asymmetries are reduced. Thus, the cause is
addressed (missing capabilities), but not the symptoms (unwillingness). Comparably to
the barriers, the identified measures affect the different stages of the Analytics initiative
lifecycle differently. While demystification is essential to aid the orientation phase, the
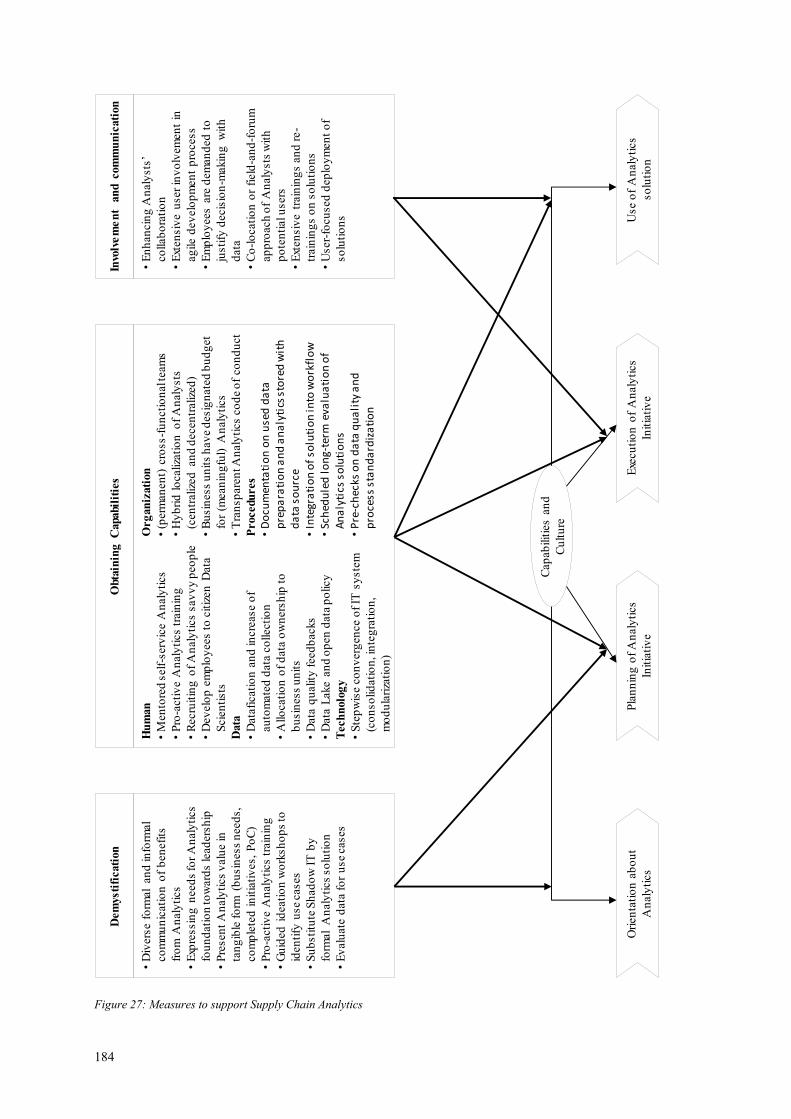
184
Figure 27: Measures to support Supply Chain Analytics
Ori
en
tati
on
ab
ou
t
An
aly
tics
Pla
nn
ing
of
An
aly
tics
Init
iati
ve
Exe
cu
tio
n o
f A
naly
tics
Init
iati
ve
Use o
f A
naly
tics
so
luti
on
Cap
ab
ilit
ies a
nd
Cu
ltu
re
Dem
ysti
ficati
on
Obta
inin
g C
apabil
itie
sIn
volv
em
en
t an
d com
mu
nic
ati
on
Hu
man
•M
en
tore
d s
elf
-serv
ice A
naly
tics
•P
ro-a
cti
ve A
naly
tics t
rain
ing
•R
ecru
itin
g o
f A
naly
tics s
av
vy
peo
ple
•D
ev
elo
p e
mp
loy
ees t
o c
itiz
en
Data
Scie
nti
sts
Data
•D
ata
ficati
on
an
d in
cre
ase o
f
au
tom
ate
d d
ata
co
llecti
on
•A
llo
cati
on
of
data
ow
ners
hip
to
bu
sin
ess u
nit
s
•D
ata
qu
ality
feed
backs
•D
ata
Lake a
nd
op
en
data
po
licy
Tech
nolo
gy
•S
tep
wis
e c
on
verg
en
ce o
f IT
sy
ste
m
(co
nso
lid
ati
on
, in
teg
rati
on
,
mo
du
lari
zati
on
)
Org
an
izati
on
•(p
erm
an
en
t) c
ross-f
un
cti
on
al t
eam
s
•H
yb
rid
lo
caliza
tio
n o
f A
naly
sts
(cen
tralize
d an
d d
ecen
tralize
d)
•B
usin
ess u
nit
s h
av
e d
esig
nate
d b
ud
get
for
(mean
ing
ful)
A
naly
tics
•T
ran
sp
are
nt A
naly
tics c
od
e o
f co
nd
uct
Procedu
res
•D
ocu
men
tati
on
on
use
d d
ata
p
rep
ara
tio
n a
nd
an
aly
tics
sto
red
wit
h
da
ta s
ou
rce
•In
tegr
ati
on
of
solu
tio
n in
to w
ork
flo
w•
Sch
edu
led
lo
ng-
term
eva
lua
tio
n o
f A
na
lyti
cs s
olu
tio
ns
•P
re-c
hec
ks o
n d
ata
qu
ali
ty a
nd
p
roce
ss s
tan
da
rdiz
ati
on
•E
nh
an
cin
g A
naly
sts
’
co
llab
ora
tio
n
•E
xten
siv
e u
ser
inv
olv
em
en
t in
ag
ile d
ev
elo
pm
en
t p
rocess
•E
mp
loy
ees a
re d
em
an
ded
to
justi
fy d
ecis
ion
-makin
g w
ith
data
•C
o-l
ocati
on
or
field
-an
d-f
oru
m
ap
pro
ach
of
An
aly
sts
wit
h
po
ten
tial u
sers
•E
xten
siv
e t
rain
ing
s a
nd
re-
train
ing
s o
n s
olu
tio
ns
•U
ser-
focu
sed
dep
loy
men
t o
f
so
luti
on
s
•D
ivers
e f
orm
al
an
d in
form
al
co
mm
un
icati
on
of
ben
efi
ts
fro
m A
naly
tics
•E
xpre
ssin
g n
eed
s fo
r A
naly
tics
fou
nd
ati
on
to
ward
s lead
ers
hip
•P
resen
t A
naly
tics v
alu
e in
tan
gib
le f
orm
(b
usin
ess n
eed
s,
co
mp
lete
d i
nit
iati
ves,
Po
C)
•P
ro-a
cti
ve A
naly
tics t
rain
ing
•G
uid
ed
id
eati
on
wo
rksh
op
s to
iden
tify
use c
ases
•S
ub
sti
tute
Sh
ad
ow
IT
by
form
al
An
aly
tics s
olu
tio
n
•E
valu
ate
data
fo
r u
se c
ases

185
creation of specific capabilities affects the project development phases and
communication and involvement become vital for the actual analytical work in the
execution and use phases. The links are illustrated in Figure 27, with examples for
measures in the respective core categories.
6.4.2.1 Measures contributing to demystification
The measures contributing to demystification are intended to communicate the value and
benefits of Analytics, fitted to the intended receivers and their context. The most widely
used measures to reach the mass of employees are formal and informal communications
presenting achieved value and benefits, such as workshops, presentations, internal
conferences, or communication material. Showing achieved value, especially
accompanied by individuals who benefitted from the executed initiatives, was explained
by interviewees to be effectively convincing and to give the opportunity to address
questions and lack of clarity in live formats. However, critics may not attend and, thus,
may not be convinced. Successful initiatives are therefore to go on tour with roadshows
disseminating the evident benefits of Analytics across the organization. Similarly, pro-
active trainings on Analytics create an understanding of it and allow answering questions.
Even applied to employees less likely to use the methods, this resource intense approach
creates acceptance and a realistic expectation. Another form of demystification is the
creation of use cases combined with process experts for their respective domains (e.g.,
the different units involved in the LSCM activities). The created use cases represent a
more tangible and, thus, comprehensible form of value from Analytics. Similarly, this
approach is more likely to convince supply chain partners to cooperate. Use cases can be
identified by guided ideation workshops, evaluating existing data sources, as part of pro-
active training, or by offering to formalize business owned tools/shadow IT. To demystify
Analytics for top management, time for conferences and training events is rarely
available. Investments are motivated by the value from tangible and clear use cases, or a
consistently voiced need for investments harmonized across several business units.
While the value created by Analytics initiatives is mostly uncertain, different approaches
for a value estimation exist. Estimations based on comparable solutions (e.g., other
organizations or business units, previous initiatives) or based on the terminated
inefficiencies engaged in the Analytics initiative are preferable, but such tangibles are
frequently missing. Thus, the creation of proofs-of-concept or prototypes is needed,
which demands initial investment to allow a value estimation. If these initial investments
186
are too high (i.e., cost intense data collection), a rare approach is the use of hypothetical
prototypes, for which the data are simulated. However, this kind of prototype only tests
ideas and requires serious changes to develop a production-ready solution.
6.4.2.2 Measures contributing to obtaining capabilities – Human
Enabling humans by building their Analytics capabilities involves several forms of
training, dependent on whether they are expected to contribute to Analytics initiatives as
domain experts or expected to apply analytical methods. To enable their contribution,
either a training event for employees is carried out, or data savviness becomes a
recruitment criterion for business roles and top management. The approach of enabling
contribution accepts that not every employee needs to execute analytical methods.
However, this portion will decline, while not every employee can be upskilled. To
improve application capabilities, self-service Analytics and Citizen Data Scientists are
created. In self-service Analytics, employees are provided with role specific tools which
allow data-driven decision-making and dedicated analytical analysis for their roles. This
should be fed back by analysts regularly. The Citizen Data Science concept acknowledges
that certain employees are already practically in the role of an analyst for their respective
unit. These are identified, provided with additional training and the respective title to act
as analyst in the business while having strong domain knowledge, therefore providing the
first contact for analytical inquiries. Both concepts improve access to Analytics to allow
employees – potential users of Analytics solutions – easier interaction with Analytics.
To get access to analytical talent, organizations may alter their image to appeal to
potential candidates outside of the company. This includes the portrayal of analytically
complex and innovative initiatives and the active engagement of the talent in universities
and platforms relevant for that talent (conventions, internet forums). As talent is
understood to be a limited resource necessary for superior performance in competition,
organizations must take active steps to attract that talent.
6.4.2.3 Measures contributing to obtaining capabilities – Data
In regard to data being repeatedly expressed as an inevitable issue in any Analytics
initiative in the discussions on barriers, the multitude of described measures was not
surprising. However, these measures are often peripheral topics to other core categories.
Considering the measures solely dedicated to data, centralizing data and establishing open
data policies are supposed to create access to the data needed for individual analysis and
Analytics initiatives. Further, measures to design data collection processes such that the
187
eventual collection of sensitive personal data is factored in beforehand reduce side effects
on accessibility of related non-sensitive data. Emphasized for data quality and availability
are automation, such as automated data collection, validation rules for manual data
collection or the automated interpretation of free text with machine learning, as well as
increasing datafication of processes and products, in consultation with analysts. In
conclusion, the measures emphasize the design of data collection and storage under the
consideration of future use of the data for Analytics.
Measures peripheral to organizational measures include organizational measures to
improve data quality and availability. The core of the collected measures is to create
awareness on data quality at the point of data creation, which is the business unit. This
includes the allocation of data ownership and responsibility to the business units,
providing feedback and training on data quality, but also, in return, establishing data
quality business units as points of contact for issues and guidance. Peripheral measures
with technology will be discussed below.
6.4.2.4 Measures contributing to obtaining capabilities – Technology
The capability building measures for technology address the creation of an IT ecosystem
that supports Analytics. This means, on the one hand, creating accessibility and
consistency of data, and on the other, to enrich options for Analytics solutions and
enhance the deployment of solutions. The essence of technology capability measures
taken by organizations is to develop the IT ecosystem towards a single-source-of-truth.
However, this vision might not be achieved – or even aspired to – since it displays a level
of complexity that is hard to handle and might not be cost efficient. In particular, the idea
of leapfrogging to this vision was explained by interviewees to be unreasonable. Instead,
organizations move in the direction of this vision in different forms dependent on their
individual needs either by consolidating IT Systems in smaller numbers and integrating
obsolete systems into newer systems; by setting up IT platforms as integration layers,
which allow interchange between systems; or by replacing systems with more modular
systems to develop a plug-and-play style IT ecosystem. Thereby, the platform solution is
the preferred way to overcome technical integration issues with supply chain partners. In
conclusion, the measures taken that aimed to create IT ecosystems for Analytics need a
few years’ foresight to keep complexity controllable and investments reasonable.
188
6.4.2.5 Measures contributing to obtaining capabilities – Organization
To clarify, organizational capabilities address changes of the organizational structures
and processes, while procedural capabilities address changes of the analytical solution
development process. The organizational capabilities have several focus areas, including
structures that reduce the organizational distance between analysts and domains, as well
as creating a better understanding of each other’s tasks and issues. This includes the
localization of analysts in a hybrid format with centralized analysts in a center of
excellence and decentralized analysts in the business units to exploit the advantages of
both forms. Dependent on the existing structures, a recurring measure is to enhance
process improvement units with Analytics to make use of the existing closeness of these
established units and the business domains. Further, the initiatives are executed in cross-
functional teams. One organization advanced the latter to permanent cross-functional
Analytics teams with own backlog of projects.
Another focus area is the development of, and commitment to, rules and codes of conduct.
This can be employee focused to build acceptance and trust in Analytics, such as a code
of conduct on what restrictions exist on accessing and analyzing data as well as
committing to restrictions for automation solutions, which must benefit the employees
instead of replacing them. Transparency and communication of these commitments are
key. The rules can further be organization focused and shift control on Analytics related
decisions. Examples are the centralization of decisions on sharing data with partners or
even making data sharing part of contracts with partners, which is becoming more
frequent due to service level agreements and performance evaluations.
Finally, designated budgets for Analytics as an organizational change in the budgeting
process are used to stimulate Analytics Initiatives. However, the appropriateness of the
resulting initiatives needs to be checked (e.g., by consultation with analysts).
6.4.2.6 Measures contributing to obtaining capabilities – Procedures
The collected measures to enhance the development process of Analytics solutions are
most notable for presenting reactions to overcome issues. Some of these formalized
procedures address information and knowledge gaps, which are time- and resource-
consuming to close, while the measures are merely cost-efficient fixes. As described by
the interviewees, the solution for these gaps is to gain experience with Analytics, which
can be achieved by participating in Analytics initiatives where the fixes are used to ensure
avoiding these issues until the experience gained makes them obsolete. In this sense,
189
business experts’ inability to translate business needs to analytical needs can be fixed
through review and feedback with analysts. Analysts’ misinterpretation of users’
demands for Analytics solutions, which are as a result unneeded and unused, is fixed by
formal agreements establishing commitment and willingness. Business experts’
unwillingness to cooperate is fixed by analysts assuming responsibility for the focal
decision-making processes of the Analytics initiative. Other formalized measures
schedule activities early to avoid impairing issues in later stages. This can occur during
the stage of project execution, supported by pre-checks of available data, or process
stability and flexibility, and cloud-hosted containerization of the solution development.
This can also occur during the phase of using the solutions and facilitating their long-term
success using documentation, including incorporating solutions into standard operational
procedures and scheduling long-tern evaluations of the solutions as part of deployment.
As pointed out by one researcher during the data analysis phase of this article, some
measures listed under this core category are merely practices for successful project
management. However, humans might have difficulties in transferring practices from one
domain of application to another while still collecting experience with the new domain.
6.4.2.7 Measures contributing to involvement and communication
The final core category of measures identified represents measures contributing to the
creation of involvement and communication in order to improve each side’s
understanding of the other side’s actions and needs, to improve decision-making. These
measures can benefit an executed Analytics initiative both directly and indirectly. Direct
measures address a high level of involvement of the intended users in the development
process, such as early and constant inclusion in an agile solution development format with
regular sprint meetings, co-location of analysts and users, or a collaborative field and
forum approach with analysts directly observing and taking part in the activities and
decision-making of the users. Further, deployment processes can focus extensively on the
users’ experience with the solution by presenting the solution in a user-oriented form, by
gradually introducing the solution into the process, or by providing consumable and user-
oriented training events. Interviewees emphasized that the focus on the user during all
stages of development is vital for the initiative’s success. Besides the importance of user
involvement, it was further acknowledged that the user’s mindset is occupied with their
business responsibility, while their obligation to an Analytics initiative is the advocation
of business interests and not the understanding of analytical methods.
190
However, to advance in Analytics, the organization’s employees need to develop an
understanding of the interpretation of the results of Analytics solutions and their
implications, and become familiar with this. Thus, a repeatedly highlighted indirect
measure is constantly requesting justification for employees’ decisions in the form of
data-based results. Another indirect measure is to promote and support exchange of
analysts. These indirect measures create an environment that enhances collaboration in
potential upcoming Analytics initiatives.
6.4.3 Discussion on applying measures and handling barriers
As introduced above, the impact of measures on an organization could not be generalized
from the data and is highly dependent on the context of the organization. Due to this and
the dynamic nature of measures existing at different stages of development, allocating
measures to specific barriers was not supported by the collected data. Below, further
points regarding the core categories derived from the Grounded Theory methodology are
discussed.
Considering the capability barriers, the variety of requirements for more complex
Analytics initiatives are underlined. Scholars have highlighted the need for a technical
foundation (Lavalle et al., 2011) as well as the required talent (Sanders, 2016), the co-
dependency on technical capacity and skills (Kiron et al., 2014), the need for data quality
(Hazen et al., 2014), or the required knowledge of employees and managers (Manyika et
al., 2011). This study identified a multitude of requirements: analytical talent, the IT
systems landscape, the data to be analyzed, organizational structures, the knowledge of
the people expected to cooperate with analysts, and the condition of the unit of analysis.
Thereby, this study identified that data interacts with all other requirement, while
decreasing in quality and accessibility subject to these other requirements. In particular,
lack of responsibility affects data negatively, which indicates a missing understanding of
data as an organizational asset – a paradigm scholars have emphasized in the past (Kiron
et al., 2014). However, interviewees reported impactful results achieved with analysis on
a small scale – small enough to be run on personal laptops – demanding lower levels of
commitment.
Discussing cultural barriers, this study uses this label for the behaviors and beliefs of
individuals in the organization, which may not reflect the general culture of the
organization. The barriers allocated to this category highlight the cross-functional nature
of Analytics in LSCM, since they result from treating Analytics as an isolated technology
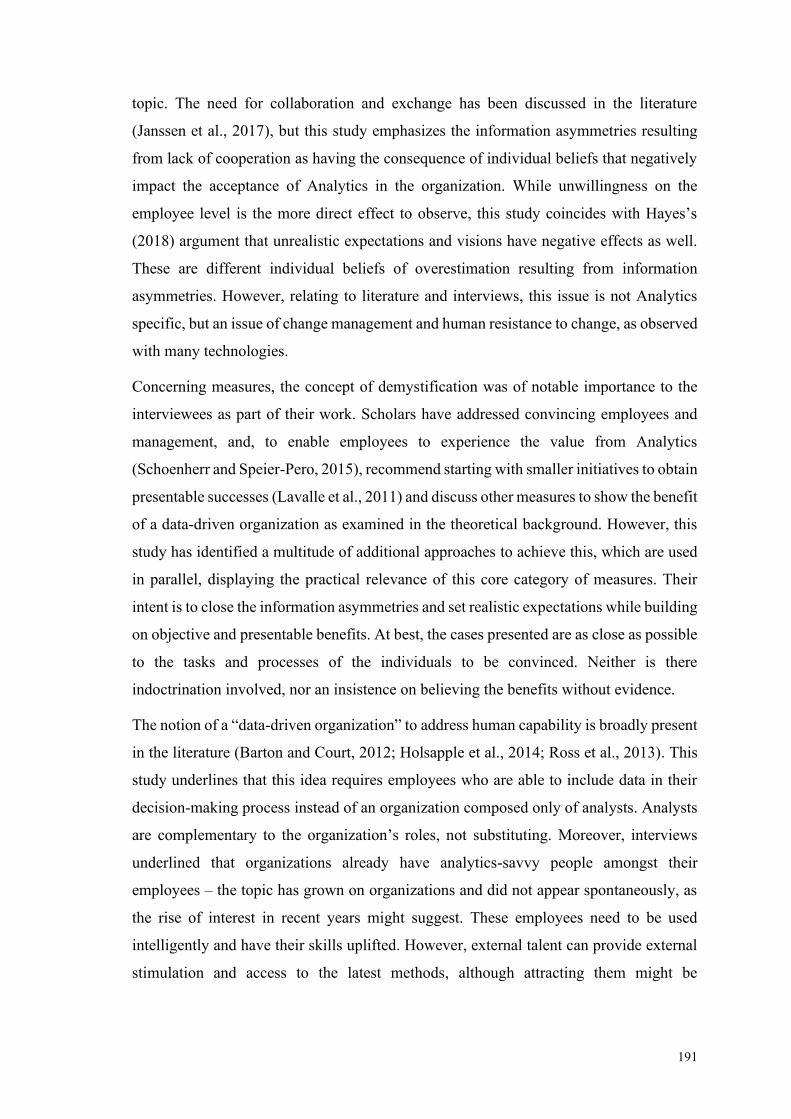
191
topic. The need for collaboration and exchange has been discussed in the literature
(Janssen et al., 2017), but this study emphasizes the information asymmetries resulting
from lack of cooperation as having the consequence of individual beliefs that negatively
impact the acceptance of Analytics in the organization. While unwillingness on the
employee level is the more direct effect to observe, this study coincides with Hayes’s
(2018) argument that unrealistic expectations and visions have negative effects as well.
These are different individual beliefs of overestimation resulting from information
asymmetries. However, relating to literature and interviews, this issue is not Analytics
specific, but an issue of change management and human resistance to change, as observed
with many technologies.
Concerning measures, the concept of demystification was of notable importance to the
interviewees as part of their work. Scholars have addressed convincing employees and
management, and, to enable employees to experience the value from Analytics
(Schoenherr and Speier-Pero, 2015), recommend starting with smaller initiatives to obtain
presentable successes (Lavalle et al., 2011) and discuss other measures to show the benefit
of a data-driven organization as examined in the theoretical background. However, this
study has identified a multitude of additional approaches to achieve this, which are used
in parallel, displaying the practical relevance of this core category of measures. Their
intent is to close the information asymmetries and set realistic expectations while building
on objective and presentable benefits. At best, the cases presented are as close as possible
to the tasks and processes of the individuals to be convinced. Neither is there
indoctrination involved, nor an insistence on believing the benefits without evidence.
The notion of a “data-driven organization” to address human capability is broadly present
in the literature (Barton and Court, 2012; Holsapple et al., 2014; Ross et al., 2013). This
study underlines that this idea requires employees who are able to include data in their
decision-making process instead of an organization composed only of analysts. Analysts
are complementary to the organization’s roles, not substituting. Moreover, interviews
underlined that organizations already have analytics-savvy people amongst their
employees – the topic has grown on organizations and did not appear spontaneously, as
the rise of interest in recent years might suggest. These employees need to be used
intelligently and have their skills uplifted. However, external talent can provide external
stimulation and access to the latest methods, although attracting them might be
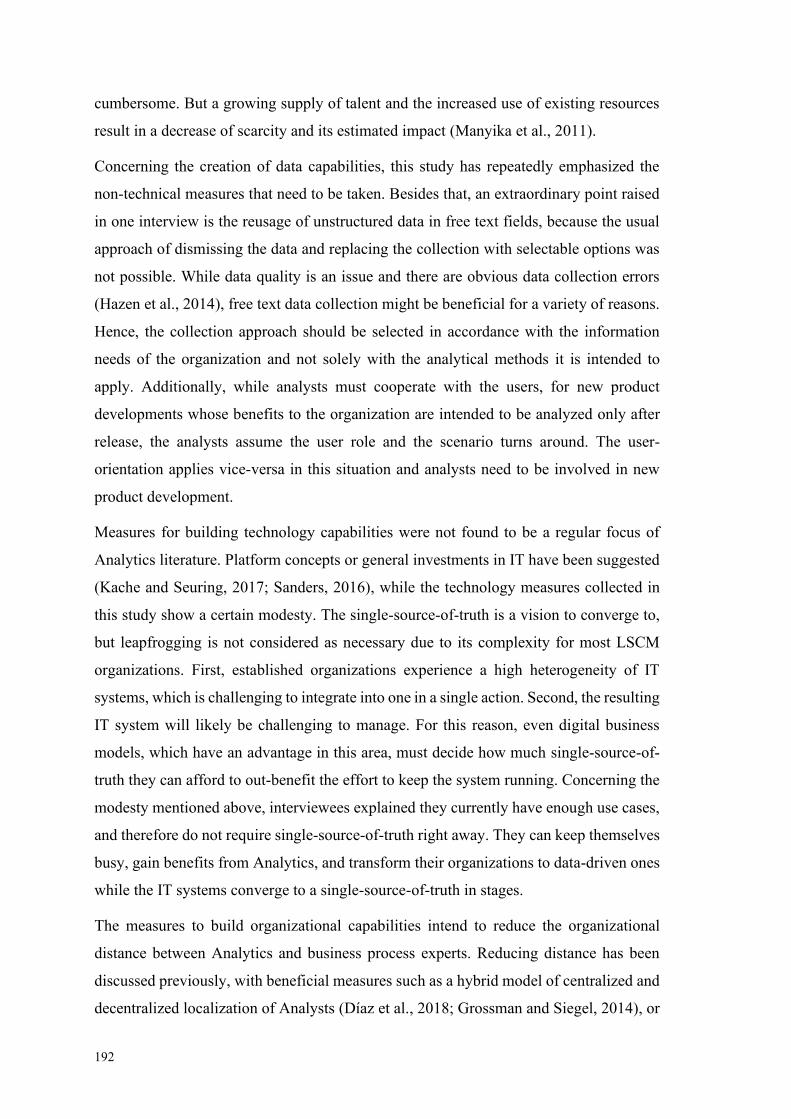
192
cumbersome. But a growing supply of talent and the increased use of existing resources
result in a decrease of scarcity and its estimated impact (Manyika et al., 2011).
Concerning the creation of data capabilities, this study has repeatedly emphasized the
non-technical measures that need to be taken. Besides that, an extraordinary point raised
in one interview is the reusage of unstructured data in free text fields, because the usual
approach of dismissing the data and replacing the collection with selectable options was
not possible. While data quality is an issue and there are obvious data collection errors
(Hazen et al., 2014), free text data collection might be beneficial for a variety of reasons.
Hence, the collection approach should be selected in accordance with the information
needs of the organization and not solely with the analytical methods it is intended to
apply. Additionally, while analysts must cooperate with the users, for new product
developments whose benefits to the organization are intended to be analyzed only after
release, the analysts assume the user role and the scenario turns around. The user-
orientation applies vice-versa in this situation and analysts need to be involved in new
product development.
Measures for building technology capabilities were not found to be a regular focus of
Analytics literature. Platform concepts or general investments in IT have been suggested
(Kache and Seuring, 2017; Sanders, 2016), while the technology measures collected in
this study show a certain modesty. The single-source-of-truth is a vision to converge to,
but leapfrogging is not considered as necessary due to its complexity for most LSCM
organizations. First, established organizations experience a high heterogeneity of IT
systems, which is challenging to integrate into one in a single action. Second, the resulting
IT system will likely be challenging to manage. For this reason, even digital business
models, which have an advantage in this area, must decide how much single-source-of-
truth they can afford to out-benefit the effort to keep the system running. Concerning the
modesty mentioned above, interviewees explained they currently have enough use cases,
and therefore do not require single-source-of-truth right away. They can keep themselves
busy, gain benefits from Analytics, and transform their organizations to data-driven ones
while the IT systems converge to a single-source-of-truth in stages.
The measures to build organizational capabilities intend to reduce the organizational
distance between Analytics and business process experts. Reducing distance has been
discussed previously, with beneficial measures such as a hybrid model of centralized and
decentralized localization of Analysts (Díaz et al., 2018; Grossman and Siegel, 2014), or
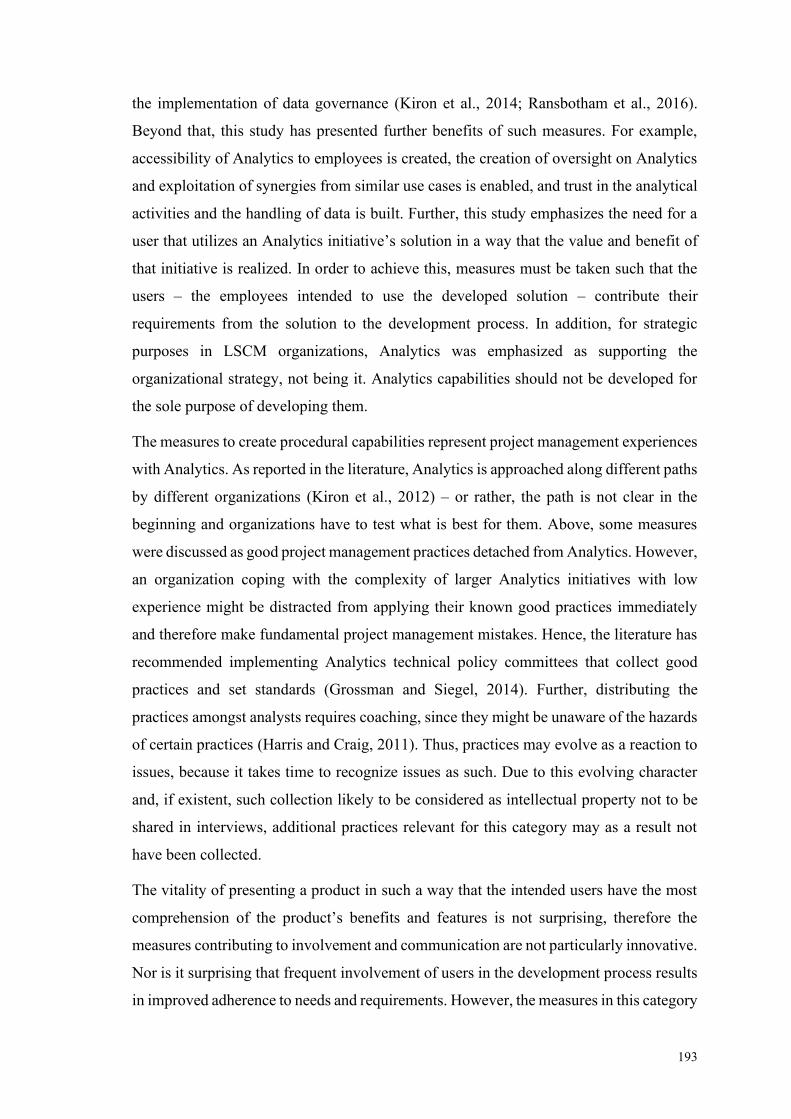
193
the implementation of data governance (Kiron et al., 2014; Ransbotham et al., 2016).
Beyond that, this study has presented further benefits of such measures. For example,
accessibility of Analytics to employees is created, the creation of oversight on Analytics
and exploitation of synergies from similar use cases is enabled, and trust in the analytical
activities and the handling of data is built. Further, this study emphasizes the need for a
user that utilizes an Analytics initiative’s solution in a way that the value and benefit of
that initiative is realized. In order to achieve this, measures must be taken such that the
users – the employees intended to use the developed solution – contribute their
requirements from the solution to the development process. In addition, for strategic
purposes in LSCM organizations, Analytics was emphasized as supporting the
organizational strategy, not being it. Analytics capabilities should not be developed for
the sole purpose of developing them.
The measures to create procedural capabilities represent project management experiences
with Analytics. As reported in the literature, Analytics is approached along different paths
by different organizations (Kiron et al., 2012) – or rather, the path is not clear in the
beginning and organizations have to test what is best for them. Above, some measures
were discussed as good project management practices detached from Analytics. However,
an organization coping with the complexity of larger Analytics initiatives with low
experience might be distracted from applying their known good practices immediately
and therefore make fundamental project management mistakes. Hence, the literature has
recommended implementing Analytics technical policy committees that collect good
practices and set standards (Grossman and Siegel, 2014). Further, distributing the
practices amongst analysts requires coaching, since they might be unaware of the hazards
of certain practices (Harris and Craig, 2011). Thus, practices may evolve as a reaction to
issues, because it takes time to recognize issues as such. Due to this evolving character
and, if existent, such collection likely to be considered as intellectual property not to be
shared in interviews, additional practices relevant for this category may as a result not
have been collected.
The vitality of presenting a product in such a way that the intended users have the most
comprehension of the product’s benefits and features is not surprising, therefore the
measures contributing to involvement and communication are not particularly innovative.
Nor is it surprising that frequent involvement of users in the development process results
in improved adherence to needs and requirements. However, the measures in this category
194
are mostly of such a type, but were explained as the results of gaining experience with
Analytics. The literature occasionally illustrates an outdated picture of “back office”
analysts with few user interactions (Davenport and Harris, 2007). For such analysts,
adopting collaborative approaches has been an effortful learning process. Transferring
these approaches to Analytics improves mutual understanding of users’ domain
requirements and analysts’ analytical requirements (Waller and Fawcett, 2013). Several
measures building on these approaches have been presented, including, but not limited
to, recommendations in the literature, such as visually appealing solutions and translation
of solutions into business terms (Bose, 2009; Wixom et al., 2013). In addition, indirect
measures of collaboration were presented, which are not part of the solution development
process and may at first appear annoying or distracting, but can provide benefits later on.
6.5 Conclusion
This study investigated barriers of implementing and successfully applying Analytics in
LSCM – Supply Chain Analytics – and measures to overcome barriers. The primary focus
was to identify measures to provide managers in LSCM organizations interested in using
Analytics with indications of barriers to pay attention to and avoid as well as to provide
them with measures to improve their actions and Analytics initiatives including the data-
driven decision-making nature of their employees. As a result, this study has pursued an
exploratory objective. The secondary focus of this study is the systematization and
extraction of core categories from the identified barriers and measures. In regard to the
systematization of conceptual contributions by MacInnis (2011), this research is
“delineating”, with the researchers taking the metaphorical role of cartographers,
mapping the entities and their relationships. To achieve this objective, this study used the
Grounded Theory approach supplemented with the Q-Methodology.
The results of this study in this regard are as follows. Barriers of SCA have been mapped
into two core categories: capabilities and culture, whereby culture addresses the behavior
and beliefs of single individuals and not the culture of the organization. In detail, the
barriers have been mapped to four subcategories in the capabilities category: unfitting
conditions, unfitting resources, missing responsibility, and missing knowledge. Similar
to this, subcategories of the culture category have been derived: unwillingness, emotion,
and missing critical thinking. The identified measures have been mapped to derive general
core categories of measures. However, the data collected did not allow generalization to
the impact of certain specific measures on specific barriers. Comparable to a metaphoric
195
ship sailing through mapped barriers blocking its journey across the sea, the specific
measures to overcome the barriers depend on a variety of contextual particularities – like
type of ship, skill of the crew, or the weather. However, general core categories of
measures to apply and adapt to the individual particularities can be provided to ease the
journey. These core categories of measures have been derived and the seven categories
have been mapped onto groups of barriers: demystification, building human capabilities,
building data capabilities, building technological capabilities, building organizational
capabilities, building procedural capabilities, and involvement and communication.
Condensed to these core categories, the measures have presented a pattern of addressing
capability barriers but have an indirect effect on cultural barriers. Addressing cultural
barriers directly has rarely been observed. In the general idea of Analytics seeking
objective evidence for decision-making, this fits the approach of creating convincing
evidence of benefits and building the skills to experience these benefits to influence the
beliefs about Analytics as opposed to addressing beliefs directly.
6.5.1 Managerial Implications
Managers in LSCM organizations can use the results of the study in a variety of ways.
The systematization of barriers can be used to investigate individual Analytics processes
and initiatives. The barriers might not be visible to them as they fail to realize benefits
and value from their initiatives. Considering the barriers identified, managers are able to
critically reflect on and analyze their initiatives and take action accordingly. In regard to
the discussion above, managers can use these results to gain awareness regarding their
Analytics initiatives.
In addition, measures can be derived to support applying Analytics initiatives for
individual organizations. While this study refrains from recommending specific measures
for certain barriers, managers can review the collected measures, evaluate the fit to the
individual context of their organization, and apply them with according adaptions. The
core categories of measures, which this study puts into focus while recommending
deriving individually adapted measures from them, can further provide starting points for
measures which can be used by managers to address barriers in their own organizations.
Managers should certainly become attentive to measures that can be used outside of
specific Analytics initiatives. Organizational measures of establishing codes of conduct,
allocating responsibilities, or organizing all affected business units to voice a harmonized
request for investment and budget allocation, directly impact the quality of the Analytics
196
initiative due to the existence of better resources. Furthermore, indirect measures such as
the creation of informal exchanges amongst analysts (or among analysts and non-
analytics employees) can lead to informal relationships and an overview of available
skills and knowledge. This overview of available skills and relationships to access them
can shorten reaction times or improve reaction quality if issues are encountered during
Analytics initiatives requiring skills outside of the project team. If managers combine this
with incentives to learn and test new approaches together, such as in communities of
interest, the available range of skills in the organization may also improve.
Finally, while analysts may frequently not have the personality traits to relish the
presentation of themselves and their results, this study emphasizes the importance of their
results being presented to other peer groups. Thus, managers may need to identify
presentable results and motivate analysts to present the achieved benefits, as well as
providing them with occasions to present them. However, these occasions are not
intended to “show off”, but to motivate the creation of more and new use cases for
Analytics that are beneficial and valuable to the organization.
6.5.2 Limitations and Further Research
As a limitation of this study, the low impact of the particularities of LSCM to the results
of this study must be considered. More detailed insights on the integration of several
business units along the flow of materials, the complexity of data collection of moving
assets, and the cooperation with supply chain partners had been expected beforehand.
Similarly, collaborations on use cases along the Supply Chain play a negligible role for
LSCM organizations. Further, no implications from use cases crossing internal
organizational lines have been observed. While this is regular in LSCM, it does not seem
to increase the complexity of Analytics initiatives, as long as effective stakeholder
management is in place. Expected technical issues, especially in data collection, are
bypassed with proxies and reasonable means already at hand.
Another limitation is the exploratory nature of this research, which aims at identifying a
wide range of effects and their relationships, but not their strength. The strength must be
tested in confirmatory research.
Further, the interviewees declined to compare their barriers and measures to other
domains, since they lack knowledge on other domains. As a result, this study can solely
present the state of LSCM, but has no data to create a comparison with other domains.

197
Further research is required to identify contextual factors that moderate the impact of
measures. Since organizations are currently limited in ideas, multi-actor use cases in
Supply Chain Analytics need to be identified and their value investigated. Concerning the
field of Analytics, further research into the single-source-of-truth is needed, including
investigating trade-offs between the availability of data and the speed of processing it, as
well as pathways to convergence of IT systems. In addition, the scarcity of analytical
talent needs to be reevaluated.

198
199
7 Enabling LSCM organizations to use Analytics
This thesis states the mission of providing guidance to enable organizations to use
Analytics by providing actionable insights. Thus, this chapter is providing guidance and
insights oriented on managers of LSCM organizations. Hence, this chapter presents
additional information and perspectives on collected data compared to the previous
chapters. First, information about the collected data are summarized to critically reflect
the scope of application and provide managers with means to assess, whether the results
are valid for them. Regarding the SEP (section 1.2), this section contributes to stage 5 of
evaluating the results for corrective adjustments. Following the leading theme of LSCM
research as presented in section 2.1, the second section discusses the impact of Analytics
on customer value. Third, a supplemented approach to manage SCA initiatives is
presented to guide managers in the use of SCA. Since the articles that form the body of
this thesis are oriented towards a scientific audience, these articles provide limited
guidance to managers. Thus, the second and third section of this chapter represent the
corrective adjustments to adhere to the mission of this thesis transferring the generated
scientific insights to guidance for LSCM managers intending to manage SCA.
7.1 Scope of application
Several constraints limit the scope of application of this thesis. A research focus has been
assumed to keep the research effort in manageable boundaries. Data collection was
dependent on availability of primary and secondary data, and accordingly to the openness
of organizations to research inquiries, which has been narrow since Analytics is perceived
as means to achieve a competitive edge. The resulting scope of application is presented
in this section to allow managers to assess, whether the results are relevant for them.
7.1.1 The focus of this thesis
The assumed research focus of this thesis is the management of Analytics in the context
of LSCM, which comprises four aspects. First, it includes organizational factors of the
execution of Analytics initiatives and surrounding initiatives, which can moderate the
success and value generated from initiatives, such as infrastructure, motivation,
collaboration, understanding of Analytics and the tasks involved. Second, the research
focus includes an overview about what kind – archetypes – of Analytics initiatives are
executed in context of LSCM. This creates understanding of opportunities, provides
inspiration to create initiatives and specifies competences and technologies needed for
Analytics. Third, the chosen managerial research focus includes practices most relevant
200
on the success of Analytics initiatives from data to creating organizational value such as
starting point, staffing, inclusion of externals, deployment actions, and performance
preservations. Forth and finally, organizational barriers of Analytics, which occur most
frequently in LSCM, are included in the managerial research focus on Analytics in
context of LSCM. In addition, organizational measures, which managers can implement
and apply, are complementing this. Concluding, the research focus understood as
‘management of Analytics initiatives’, assumed and investigated in this thesis, promotes
Analytics as flexible tool that must be adapted to a chosen and specific LSCM problem
and is influenced by a variety of factors and dependent in its success on the appropriate
application of practices.
Opposed to this, a research focus that could have been assumed alternatively is on
providing solution paths for specific problems in LSCM, paths for improving specific
logistics performance indicators or about which model or algorithm is providing the most
promising result for specific problems in LSCM. This research focus was rejected due to
several perceived downsides. First, such a research focus would have been limited in the
number of considered problems and their solutions paths due to ambiguity of the
boundaries of LSCM and resulting ambiguity of which problems belong to it, the limited
observability of unknown future LSCM problems, and limited resources. Second,
considering specific LSCM problems would limit managers to understand the potential
of Analytics as a flexible tool. The evidence collected emphasizes to approach problems
in Analytics initiatives with an open mind in regard to the local specifics and
individualities of a problem, to the hidden potential in the data, and to the requirements
and needs of the intended users of an Analytics solution. These factors influence the
analytical approach (data preparation, models, algorithms), the development of the
solution and its successful deployment. Certain formulated paths to solve specific LSCM
problems presumes certain data, technologies and process characteristics as well as
maturity with technologies and Analytics. Managers could be inclined to pursuit
Analytics initiatives in the narrow and comfortable choice of LSCM problems with
formulated paths and neglect problems with higher criticality, while the evidence
collected for this thesis presents Analytics with a paradigm of prioritization by criticality,
urgency and value. Third, such paths might be produced and established in an
organization over time but cannot be transferred without loss in validity to other
organizations. Fourth, the success of these paths would further be moderated by

201
contextual and situational factors of organizations, their IT ecosystems and their
workforces. The flexibility of Analytics and the moderating organizational factors, which
are argued in this thesis to be necessary for creating competitively superior solutions, are
not covered in such a research focus on specific LSCM problems and their solution paths.
A third relevant research focus, which could be argued as valid option for being assumed
in this thesis, is the development of an Analytics solution for a specific LSCM problem.
This would, however, be an operational focus as opposed to a managerial focus as
intended for this thesis. While such an approach is relevant and needed for several
problems in LSCM, managerial recommendations resulting from such a focus would be
limited to the data collected on the one LSCM problem considered, and would be
dependent on investigating the problem from definition to maintenance. It would omit to
understand Analytics for its flexibility and the impact of diverging from the practices
employed for the one problem.
7.1.2 The scope of data collection
The intended scope of application of this thesis are organizations with LSCM activities
as their core business model such as LSPs, and organizations with LSCM functions in
their organizations to fulfill their material and informational flows, such as manufacturers
and retailers. In this thesis, these organizations have been labeled as LSCM organizations.
As an important note for the scope of application, some LSCM organizations have created
spin-off organizations for their Analytics needs, since they have recognized the potential
to sell the services to other organizations. These spin-off organizations are recognized as
Analytics providers in this thesis. However, the accessibility of these organizations for
data collection is limited and differs for several reasons. First, Analytics is a novel topic
and the number of relevant LSCM organizations to collect data from is limited. Second,
Analytics may not be a designated function with recognizable job titles in these
organizations, what complicates the effort to identify relevant experts for primary data
collection. Third, these experts are quite demanded and busy with the topic and are
usually not able to spend their time for scientific inquires. Fourth and finally, a very
problematic factor for this thesis is the unwillingness to share information, since
organizations that are mature in Analytics also perceive it as important factor in
competition and their practices are held confidential – no matter whether anonymity is
assured, and the focus is not on specific Analytics Solutions or initiatives. Considering
the collected evidence, this level of desired confidentiality is amplified by the
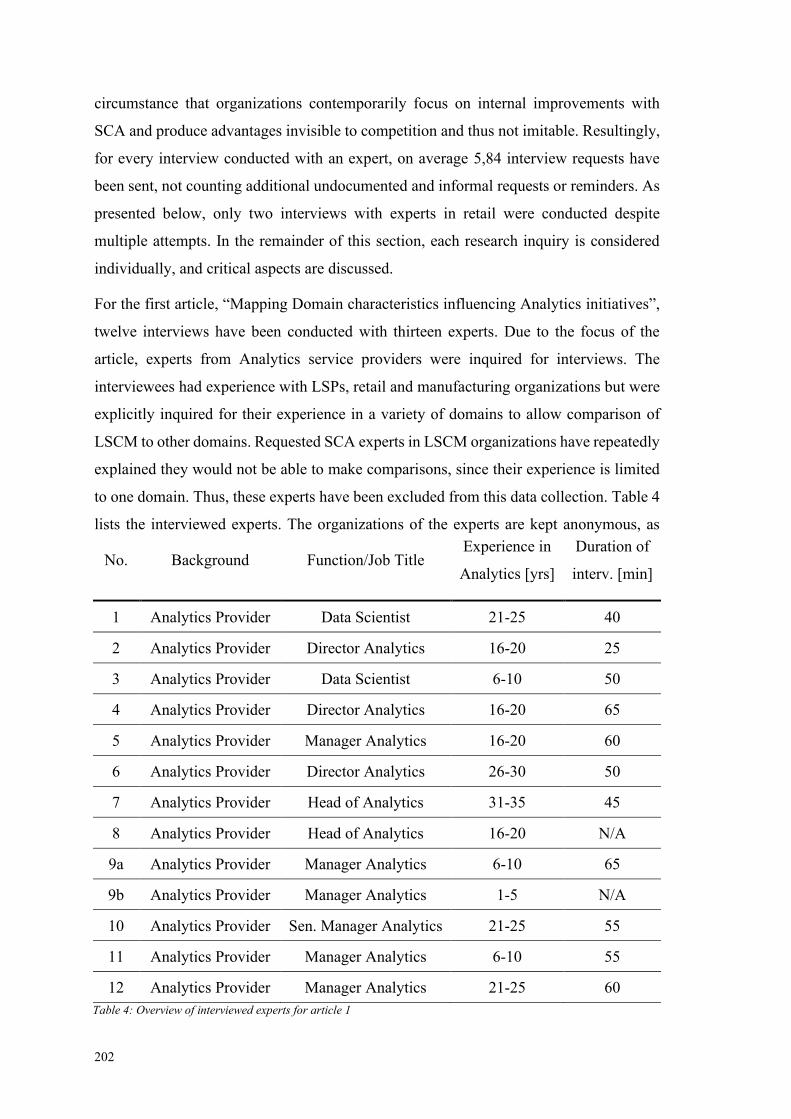
202
circumstance that organizations contemporarily focus on internal improvements with
SCA and produce advantages invisible to competition and thus not imitable. Resultingly,
for every interview conducted with an expert, on average 5,84 interview requests have
been sent, not counting additional undocumented and informal requests or reminders. As
presented below, only two interviews with experts in retail were conducted despite
multiple attempts. In the remainder of this section, each research inquiry is considered
individually, and critical aspects are discussed.
For the first article, “Mapping Domain characteristics influencing Analytics initiatives”,
twelve interviews have been conducted with thirteen experts. Due to the focus of the
article, experts from Analytics service providers were inquired for interviews. The
interviewees had experience with LSPs, retail and manufacturing organizations but were
explicitly inquired for their experience in a variety of domains to allow comparison of
LSCM to other domains. Requested SCA experts in LSCM organizations have repeatedly
explained they would not be able to make comparisons, since their experience is limited
to one domain. Thus, these experts have been excluded from this data collection. Table 4
lists the interviewed experts. The organizations of the experts are kept anonymous, as
No. Background Function/Job Title Experience in
Analytics [yrs]
Duration of
interv. [min]
1 Analytics Provider Data Scientist 21-25 40
2 Analytics Provider Director Analytics 16-20 25
3 Analytics Provider Data Scientist 6-10 50
4 Analytics Provider Director Analytics 16-20 65
5 Analytics Provider Manager Analytics 16-20 60
6 Analytics Provider Director Analytics 26-30 50
7 Analytics Provider Head of Analytics 31-35 45
8 Analytics Provider Head of Analytics 16-20 N/A
9a Analytics Provider Manager Analytics 6-10 65
9b Analytics Provider Manager Analytics 1-5 N/A
10 Analytics Provider Sen. Manager Analytics 21-25 55
11 Analytics Provider Manager Analytics 6-10 55
12 Analytics Provider Manager Analytics 21-25 60
Table 4: Overview of interviewed experts for article 1
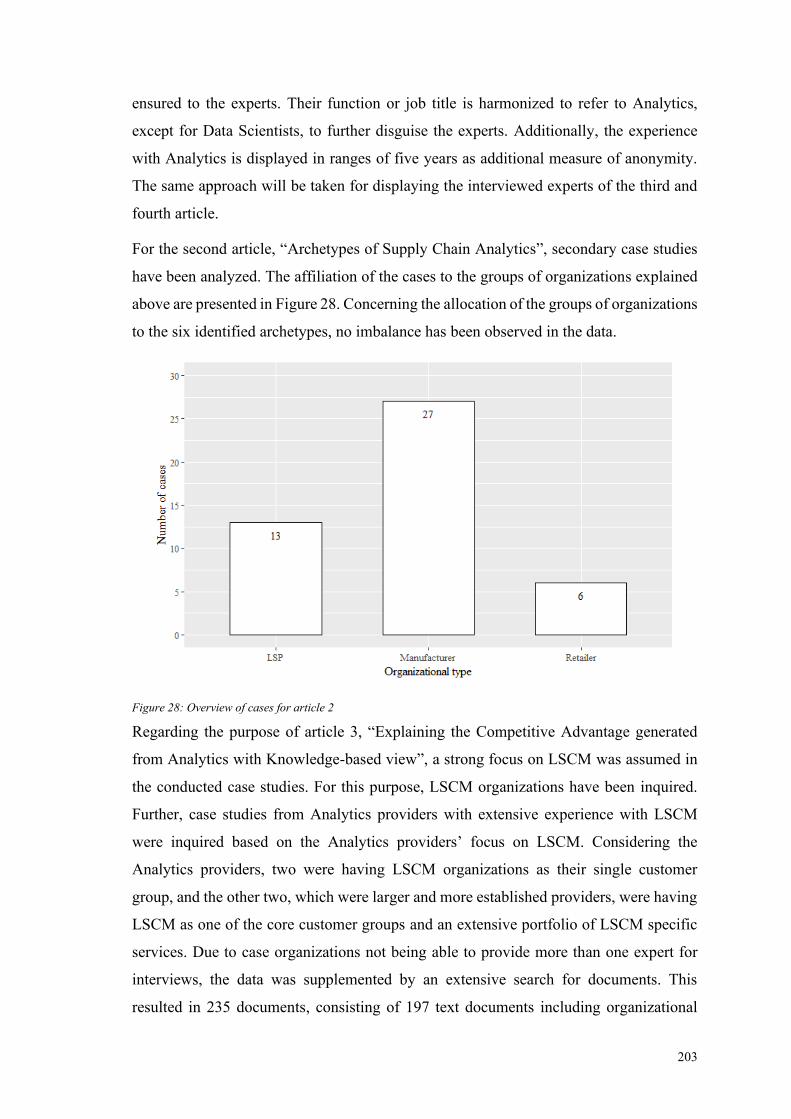
203
ensured to the experts. Their function or job title is harmonized to refer to Analytics,
except for Data Scientists, to further disguise the experts. Additionally, the experience
with Analytics is displayed in ranges of five years as additional measure of anonymity.
The same approach will be taken for displaying the interviewed experts of the third and
fourth article.
For the second article, “Archetypes of Supply Chain Analytics”, secondary case studies
have been analyzed. The affiliation of the cases to the groups of organizations explained
above are presented in Figure 28. Concerning the allocation of the groups of organizations
to the six identified archetypes, no imbalance has been observed in the data.
Figure 28: Overview of cases for article 2
Regarding the purpose of article 3, “Explaining the Competitive Advantage generated
from Analytics with Knowledge-based view”, a strong focus on LSCM was assumed in
the conducted case studies. For this purpose, LSCM organizations have been inquired.
Further, case studies from Analytics providers with extensive experience with LSCM
were inquired based on the Analytics providers’ focus on LSCM. Considering the
Analytics providers, two were having LSCM organizations as their single customer
group, and the other two, which were larger and more established providers, were having
LSCM as one of the core customer groups and an extensive portfolio of LSCM specific
services. Due to case organizations not being able to provide more than one expert for
interviews, the data was supplemented by an extensive search for documents. This
resulted in 235 documents, consisting of 197 text documents including organizational

204
reports, organizational presentations, organizational whitepapers, organizational articles,
organizational press releases, third-party reports and third-party articles as well as 38
videos including interviews, presentations and media material of about 14,3 hours. The
experts and case organizations are presented in Table 5.
The fourth article, “Overcoming Barriers in Supply Chain Analytics”, demanded a strong
focus on LSCM as well. Resultingly, recruitment efforts were strongly focused on experts
in SCA, which are active in LSCM organizations. Except for two experts, this focus has
been kept. As explained in the article, the group of interviewees represents a broad variety
of backgrounds regarding the Supply Chain including suppliers, OEM manufacturers,
transportation LSPs, storage LSPs and retailers. Table 6 provides anonymized details on
the interviewed experts. However, in view of the difficulties described above in recruiting
Analytics experts for interviews, it should be emphasized once again that the strong focus
on LSCM organizations has led to significantly lower response rates to interview requests
as opposed to the previous data collections.
A standing critique of this thesis on Analytics applied to LSCM is the extensive collection
of data from Analytics providers to the detriment of collecting data from LSCM
organizations. While the unwillingness of experts of these LSCM organizations has been
addressed twice already, two more aspects must be discussed to underline the relevance
of the interviewed experts of Analytics providers. First, amongst the selected
organizations are spin-offs of LSCM organization legally representing different
organizations, which focus on providing Analytics solutions to LSCM organizations. Per
No. Background Function/Job Title Experience in
Analytics [yrs]
Duration of
interv. [min]
1 Analytics Provider Head of Analytics 11-15 50
2 Analytics Provider Director Analytics 11-15 50
3 Manufacturer Sen. Manager Analytics 1-5 55
4 Analytics Provider Sen. Manager Analytics 6-10 60
5 LSP Head of Analytics 1-5 60
6 Manufacturer Sen. Data Scientist 6-10 50
7 Manufacturer Sen. Manager Analytics 1-5 65
8 Analytics Provider Sen. Manager Analytics 16-20 90
Table 5: Overview of interviewed experts for article 3
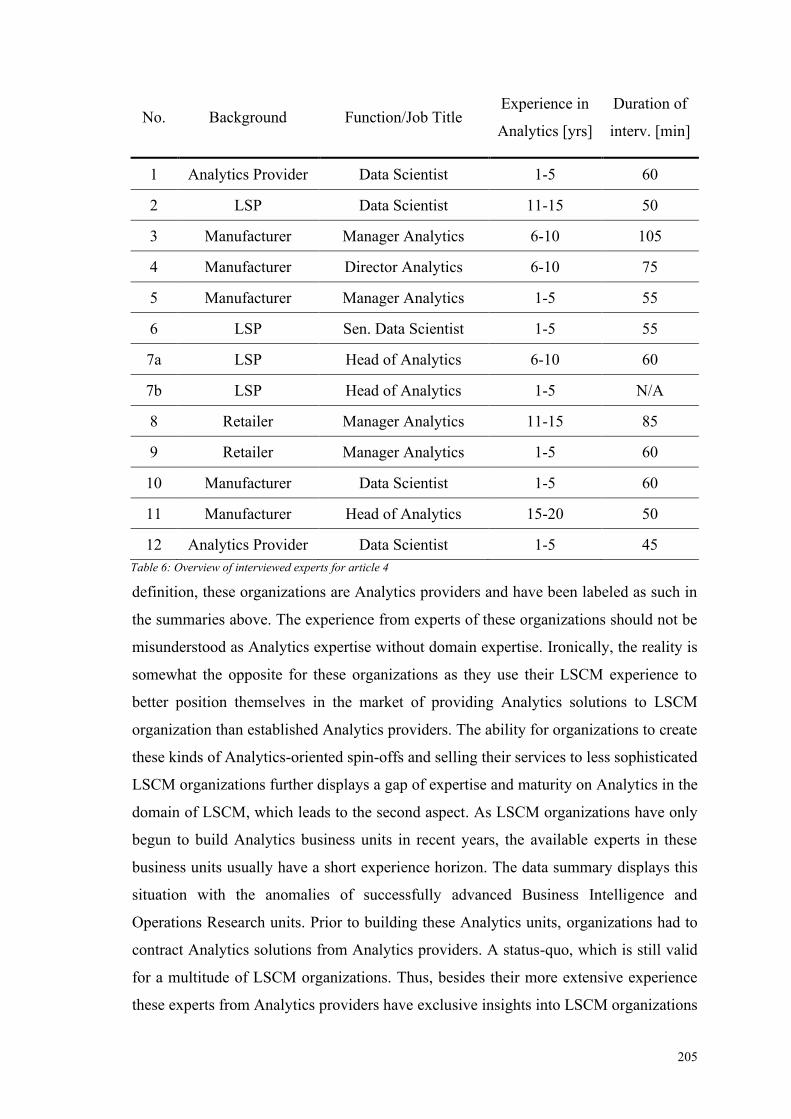
205
definition, these organizations are Analytics providers and have been labeled as such in
the summaries above. The experience from experts of these organizations should not be
misunderstood as Analytics expertise without domain expertise. Ironically, the reality is
somewhat the opposite for these organizations as they use their LSCM experience to
better position themselves in the market of providing Analytics solutions to LSCM
organization than established Analytics providers. The ability for organizations to create
these kinds of Analytics-oriented spin-offs and selling their services to less sophisticated
LSCM organizations further displays a gap of expertise and maturity on Analytics in the
domain of LSCM, which leads to the second aspect. As LSCM organizations have only
begun to build Analytics business units in recent years, the available experts in these
business units usually have a short experience horizon. The data summary displays this
situation with the anomalies of successfully advanced Business Intelligence and
Operations Research units. Prior to building these Analytics units, organizations had to
contract Analytics solutions from Analytics providers. A status-quo, which is still valid
for a multitude of LSCM organizations. Thus, besides their more extensive experience
these experts from Analytics providers have exclusive insights into LSCM organizations
No. Background Function/Job Title Experience in
Analytics [yrs]
Duration of
interv. [min]
1 Analytics Provider Data Scientist 1-5 60
2 LSP Data Scientist 11-15 50
3 Manufacturer Manager Analytics 6-10 105
4 Manufacturer Director Analytics 6-10 75
5 Manufacturer Manager Analytics 1-5 55
6 LSP Sen. Data Scientist 1-5 55
7a LSP Head of Analytics 6-10 60
7b LSP Head of Analytics 1-5 N/A
8 Retailer Manager Analytics 11-15 85
9 Retailer Manager Analytics 1-5 60
10 Manufacturer Data Scientist 1-5 60
11 Manufacturer Head of Analytics 15-20 50
12 Analytics Provider Data Scientist 1-5 45
Table 6: Overview of interviewed experts for article 4

206
without designated Analytics units and before such units were set up. This represents a
vital insight for understanding the maturation of LSCM organizations in Analytics and is
therefore crucial for this thesis.
Putting the sources of data into perspective, the results are noticeably stronger focused on
manufacturers and LSPs using Analytics for their LSCM activities. The amount of data
on retailers is low. Managers in retail intending to manage SCA should be aware of this.
However, putting the results of the research in comparison, there are only minor
differences between management recommendations between Analytics providers and the
LSCM organizations. Further, the characteristics, which are more relevant to LSCM
setting it apart from other domains in executing Analytics initiatives, have been identified
as the crossing of organizational borders in Analytics initiatives, a tendency for
heterogeneous data, the use of mobile sensors due to moving assets, a higher weight on
the efficiency objective, and a more frequent use of prescriptive and (real-time)
descriptive methods. These characteristics are firmly related to the material flow and
should be equally relevant for retailers. Apart from that, the domains show differences in
their specific use cases and how they must be solved methodologically. Thus, the results
of this thesis show high relevance for managers intending to apply Analytics for retail as
well.
7.2 The value for the customer
As explained in section 2.1, especially the literature stream of Logistics in the LSCM
literature strongly emphasizes that LSCM activities must be oriented on the customers’
needs and requirements. Evidently, the use of Analytics must result in improvements for
the organizations’ customers. Thus, this section discusses how SCA contributes value for
the customers, provided the management of SCA is appropriate. Below, customers may
refer to either end consumers or business customers. The presented discussion is not
exhaustive but intends to highlight the variety of forms customers can gain value from
organization applying Analytics to their LSCM processes.
7.2.1 Indirect value for the customers
Apparent from the evidence collected for this thesis, contemporary organizational SCA
initiatives primarily focus on process improvements. These initiatives are not addressing
customer needs directly. However, they have an indirect effect on customers. While a
reoccurring topic in the discussion with experts has been the difficulty of displaying the
impact from Analytics, a recommendation for managers is to think from the customers
207
and the indirect impact on them, when they design their SCA initiatives and estimate the
benefit. The following discussion may stimulate these thoughts.
The customers’ perceived service reliability of LSCM services can improve indirectly
from Analytics. Generically explained, improving planning under consideration of
various disruptive factors and increasing robustness due to improved understanding and
transparency enabled by Analytics solutions will affect the reliability of LSCM services.
Two prominent and tangible examples are predictive maintenance and disruption
recovery. Considering predictive maintenance, it usually concerns the prediction of
maintenance needs of manufacturing machines, which disrupt operations with ill-fitting
downtime. More relevant for LSCM are the maintenance needs of vehicles such as trains,
trucks or aircrafts. Due to these assets moving through logistical networks, an unexpected
downtime leads to asset recovery or transportation of maintenance crews, what increases
the time to repair. Applied predictive maintenance allows the consideration of
maintenance needs in fleet operations plans with assets in predicted need of repair ending
their routes in repair shops. Thus, the direct effects are less disruptions of operations and
an improved fit of plan to execution. Customers benefit indirectly from their shipments
being less affected by disruptions or, in case of public transport, their means of transport
adhering closer to schedule. As second example, disruption recovery creates plans to
recover from disruptions due to next best solution optimization or testing of a variety of
scenarios. Interviewees explained it as counter-intuitive behavior, since people in LSCM
are not only interested in the optimal solution of an optimization problem as opposed to
other domains but exploit the models for further business questions. Next best solutions
are the best solutions on the condition of few changes to the original solution. They allow
recovery from short-term changes of crucial factors in planned operations with the plans
execution already set in motion. Further, scenario analysis is an alternative use of existing
optimization models, which stress-tests the operations described by the model such as a
supplier network. The scenarios help to assess several situations of disruptions and
develop recovery plans before the disruptions occur. In both cases, the recovery from
disruptions is enhanced as a direct effect for the organization, such that a reliable service
stays available as indirect effect to customers.
Customers’ perceived service quality of LSCM operations is indirectly affected by SCA
initiatives addressing the process efficiency (e.g., detection of unexploited potential or
deficiencies). These initiatives are primarily aimed at improving processes in general

208
rather than adapting process efficiency to customers’ needs (see 7.2.2). However, these
improvements change process characteristics such as process times or error-rates, that are
eventually perceived by the customers. Two examples for such analytical actions are
process analysis and real-time monitoring. First, process analysis is an established tool in
LSCM, which can be supplemented by Analytics. Identifying bottlenecks, errors, or
factors that contribute to quality or performance degradation can be supplemented by
Analytics, if data collection is possible. However, this usually requires design changes
that must be implemented and tested to exploit the identified potential. Increased
efficiency and reduced deficiencies directly impact an organization’s process
performance but are eventually also indirectly perceived by the customers employing
services related to that improved process. Second, transport monitoring allows to reduce
issues of drivers taking large unplanned detours and unplanned stops resulting in delayed
shipments. These delays usually affect operations of manufacturing organizations
requiring their shipped material for manufacturing goods and products. Monitoring
shipments, revealing unplanned activities and terminating them directly results in
improved timeliness of the LSCM organization offering the service. Indirectly, the
perceived increase of the service quality of shipments increases the value for the
customers.
Customers can indirectly gain value from reduced costs of processes and operations. A
leading theme throughout the collected evidence is the relevance of a positive return-on-
investment for an Analytics initiative to be carried out. Thus, process improvements from
Analytics initiatives must be accompanied by cost reductions. Besides, SCA initiatives
also primarily address cost reductions. Provided that organizations pass cost savings on
to their customers, these customers can indirectly benefit from such initiatives. Reduction
of procurement costs and cross selling/up selling are two examples for this. First, the
relevant data to consider for reducing procurement costs may not necessarily be prices of
procured goods. With Analytics, the focus can be pivoted from prices to lifetime cost of
the goods. In addition, economies of scale or scope can be identified due to analyzing
orders of several business units and creating new allocations of orders to suppliers and
aggregating shipments across orders. Extended to a holistic optimization, the sum of
warehouse, transit, transaction and various other costs can change the procurement
strategy from lowest prices to lowest total cost. Eventually, analysis of supplier
performance can be used in contract negotiations. However, strategic partnerships should
209
have priority over such actions. Resultingly, Analytics can directly reduce the
procurement costs of goods, which can be passed on as indirect value to customers.
Second, cross selling/up selling refers to offering goods to customers they are likely to
demand in the future or to procure from other organizations already. While such Analytics
solutions (e.g., recommender systems) are intended to increase the profit of applying
organizations, they can create economies of scale and scope in procurement,
manufacturing, and transport due to adapted orders from customers. The direct cost
savings from these effects for organizations can be passed on to customers, indirectly
providing them value from the Analytics solution of the LSCM organizations.
7.2.2 Direct value for the customers
The direct value for customers from SCA is provided by customer facing Analytics
solutions on LSCM problems or by new offerings for customers enabled by Analytics
solutions. These solutions provide services that extend physical services by adding
relevant information and functionality beneficial to customers. Thereby, the collected
evidence emphasizes the migration of data-driven services from the consumer market to
the business market, such as e-commerce services of shipment tracking and ETA
predictions. Business customers can use these solutions to improve their own operations.
LSCM managers are recommended to observe Analytics-based innovations in the
consumer market for increasing the service portfolio of their organizations.
The operations efficiency of customers directly benefits from Analytics Solutions
provided by LSCM organizations. Customers improve efficiency and gain value due to
transparency, which they use for planning and executing their operations, and by
increased flexibility from novel Analytics-based services, which allows them to adapt
operations to changed situations. Two examples for direct value of this form are tracking
and tracing solutions for customers and LSCM services based on dynamic routing. First,
tracking and tracing solutions allow customers to react faster on changed conditions of
their shipments. Delays or premature shipments can be encountered with adapted
operations or reordered goods with faster shipping options. Thereby, the reactions and
subsequently efficiency improvements depend on the features of the Analytics solution.
For example, alerts raise attention to changed conditions to trigger reactive responses,
while predictions allow proactive responses. Further, the level of detail ranges from
passed locations of a shipment to its exact position and physical status, while the latter
allows faster reactions on damaged shipments with resultingly reduced effects on
210
customers’ operations. Second, dynamic routing allows LSCM organizations to provide
new services to customers. Dynamic delivery services allow customers to receive
shipments appropriate to their operations instead of adhering to static routes. Besides
consumers, the service can be relevant for business customers only operating at certain
times of the day (e.g., restaurants) or leaving for home visits (e.g., craftsmen). Dynamic
pick-up services enable customers to adapt their shipments to the operations, such as
moving the shipment backward in time on heavy workload or the other way around. In
both services, customers strongly benefit from the provided information (or rather
estimations) about the status of the LSCM organizations vehicles.
An aspect that can be improved in a twofold manner is time. Time can address the lead
time between customers placing their request for products and services and the successful
fulfillment of the request, which can be shortened due to SCA. It can further address the
timeframe customers have to reserve for receiving a service, which can be shortened as
well. In both cases, shortening the time provides directly value to customers. Two
examples relevant for the aspect of time are anticipatory shipping and improved accuracy
of ETA predictions. First, despite the fictional sounding vision of providing customers
with products before ordering them, as presented by the patent-holder of anticipatory
shipping (Amazon), the concept is already implemented in a less intrusive form. Opposed
to sending shipments to customers before ordering, products predicted to be ordered are
already transferred to distribution centers near the customers, who are predicted to order
them. Resultingly, the travel time to the customer is reduced in case of an order providing
them with a time benefit. Second, providing an ETA to customers is an alternative to
provide detailed transparency over moving assets (see tracking and tracing), if this level
of detail is unwanted such as with consumers. While an ETA prediction allows similar
adoption of operations as discussed above, it creates particularly value for receivers
unable to use the timeframe of waiting for alternative activities. Especially, consumers of
delivery service of modern business models (e.g., delivery of groceries or beverages) are
limited to wait at home for their delivery during the agreed timeframe. Accurate ETA
predictions eventually allow to shorten the communicated timeframe consumers must
reserve for waiting. In this case, the Analytics solution provides a direct time benefit to
consumers.
Finally, while no customer facing Analytics solution is employed, the availability of
products and services can be improved with customer-oriented solutions. One of the
211
earliest uses of SCA is demand prediction to the provision of demanded products to
customers. Today, it is one of the most developed and widely used applications. Any
product or service customers want to consume, requires its availability, and Analytics
improving availability resultingly leads to direct benefits for customers. The finally
presented two examples for improving availability with Analytics are demand forecasting
and shelf stock-out prediction. First, demand forecasting predicts the demand for a
product or service in a certain time and location. Different aggregation levels of time and
location are used for different decisions eventually leading to products or services being
available when and where the customers want to procure them. Inaccuracy of demand
forecasts lead either to non-availability of products and services, which is dissatisfactory
for customers, or products being over-stocked generating additional cost in perished
products, tied capital and storage costs, which are passed on to the customers dissatisfying
them in the future. Thus, increasing the accuracy of demand forecasts with Analytics is
directly valuable to the customers. Second, the prediction of shelf stock-outs affects
product availability to customers in retail stores, because shelf capacity is limited and
replenishment from storage areas may not keep pace with the procurement rate of the
customers. Usually, no depletion signal of the shelf availability is collected except the
sales transactions of products, which arrive delayed. Further, shelf replenishment is also
usually not electronically collected. Resultingly, the visibility of the stock level on the
shelf is missing and customers experience products as unavailable which are on stock in
the storage area. Analytics can be used to predict shelf stock-outs, which trigger
replenishment orders and reduce the number of dissatisfied customers. Hence, customers
gain value from product availability.
7.3 An approach to manage Supply Chain Analytics initiatives
As explained by interviewees, Analytics constantly goes through changes of labels and
names based on new emerging methods or technologies enabling new or larger scaled use
cases, more accurate analytical results, and higher performance of analytical calculations.
Besides, these new labels are usually accompanied by newly formulated approaches to
Analytics. However, as criticized by Franks (2014), these approaches are basically
identical to the Cross-industry standard process for data mining (CRISP-DM), which has
been developed in the end of the 1990s (Chapman et al., 2000). In the following section,
the procedure of deriving an approach to manage SCA is explained. Thereby, a
supplemented CRISP-DM approach is developed including the practices and insights

212
collected particularly from the domain of LSCM. The development was chosen as
opposed to a specific SCA initiative approach, as explained below. Further, a comparison
and alignment of process models is conducted and presented. Subsequently, the derived
supplemented approach is presented and explained. Finally, the supplemented approach
is applied to an SCA initiative to evaluate the results of this final analysis, which is
consistent with stage 5 of the SEP underlying this thesis (see section 1.2).
7.3.1 Motivation and procedure of deriving an approach to manage Supply Chain
Analytics initiatives
As indicated, other approaches to Analytics initiatives are highly similar. However, they
differ in the number and names of phases concealing the similarity. This leads to
confusion for managers intending to manage their Analytics initiatives, while labels and
names conflict and overlap. Since the mission of this thesis is to provide guidance (see
section 1.2), the creation of yet another approach for managing Analytics initiatives is not
considered as valuable because it is likely to contribute to confusion instead of dissolving
it. Besides, Analytics has been clearly established as a flexible tool, which is “very
transmissible” to various domains as an interviewee responded. To develop an approach
for managing Analytics initiatives for one specific domain contradicts this flexibility and
transmissibility and, thus, the results of this thesis. This thesis specially criticizes research
on Analytics that claims progress on Analytics to be limited to a focal domain and ignores
progress in other domains, while it could be transferred, valuable and problem-solving to
the focal domain. An approach to manage Analytics initiatives focused on the domain of
LSCM would only emphasize such enclosed thinking, while the generic approach chosen
to be developed in this research is supposed to be inviting managers in the domain of
LSCM to look beyond their domain when intending to generate value with Analytics
initiatives. In addition, the practices and insights collected from the domain of LSCM,
which are used to supplement the approach of managing Analytics initiatives, can provide
value in other domains. In developing a generic approach, these practices are more likely
to be recognized by scholars and practitioners in other domains as opposed to a domain-
specific approach. Resultingly, the approach to manage SCA initiatives presented below
is specifically kept generic as supplement to the CRISP-DM approach in favor of a
specific SCA approach.
In the interviews, the CRISP-DM approach was frequently named as the preferred
approach to manage Analytics initiatives in the interviewees’ organizations. Due to this
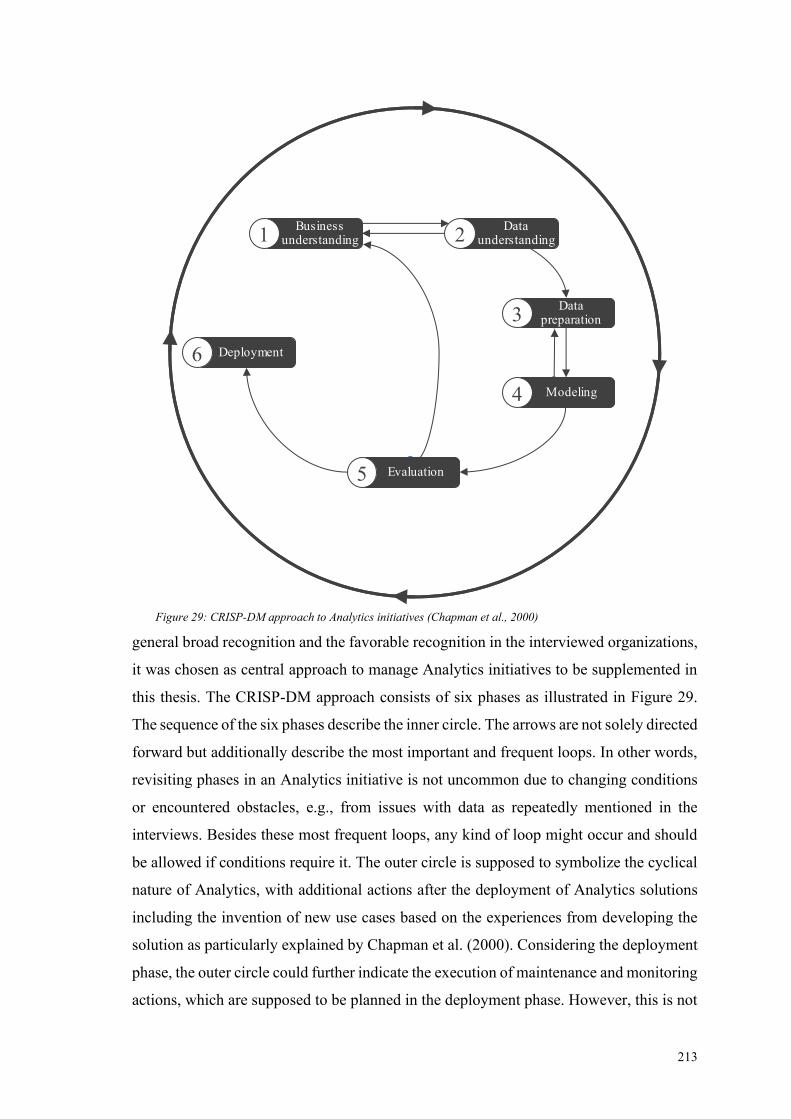
213
general broad recognition and the favorable recognition in the interviewed organizations,
it was chosen as central approach to manage Analytics initiatives to be supplemented in
this thesis. The CRISP-DM approach consists of six phases as illustrated in Figure 29.
The sequence of the six phases describe the inner circle. The arrows are not solely directed
forward but additionally describe the most important and frequent loops. In other words,
revisiting phases in an Analytics initiative is not uncommon due to changing conditions
or encountered obstacles, e.g., from issues with data as repeatedly mentioned in the
interviews. Besides these most frequent loops, any kind of loop might occur and should
be allowed if conditions require it. The outer circle is supposed to symbolize the cyclical
nature of Analytics, with additional actions after the deployment of Analytics solutions
including the invention of new use cases based on the experiences from developing the
solution as particularly explained by Chapman et al. (2000). Considering the deployment
phase, the outer circle could further indicate the execution of maintenance and monitoring
actions, which are supposed to be planned in the deployment phase. However, this is not
Business understanding1
Data preparation3
Modeling4
Evaluation5
Deployment6
Dataunderstanding2
Figure 29: CRISP-DM approach to Analytics initiatives (Chapman et al., 2000)
214
specifically mentioned by Chapman et al. (2000). As indicated above, to provide the
intended guidance and dissolving of confusion between the multitude of approaches to
Analytics initiatives, the CRISP-DM approach (Chapman et al., 2000) is compared to
fourteen additional approaches to manage Analytics initiatives. This shows how the
approaches overlap as well as it closes gaps of the CRISP-DM approach. The considered
approaches are presented in the following list. The interested reader may refer to
Appendix A for extensive details:
(1) Knowledge Discovery in Databases Process (Fayyad et al., 1996)
(2) Steps involved in using advanced analytics (Bose, 2009)
(3) The [process-application-data-insight-embed] PADIE Technique for
operationalizing Analytics (LaValle et al., 2010)
(4) Meaningful data integration (Bizer et al., 2012)
(5) Outline of big data analytics in healthcare methodology (Raghupathi and
Raghupathi, 2014)
(6) The Professional Job Task Analysis Process (INFORMS, 2014)
(7) Framework for implementation of Big Data projects in firms (Dutta and Bose,
2015)
(8) Operations Research Modeling Approach (Hillier and Lieberman, 2015)
(9) Mayor’s Office of Data Analytics 10 step model (Copeland, 2015)
(10) The life cycle view of statistics (Kenett, 2015)
(11) Data Analytics Lifecycle (Dietrich et al., 2015)
(12) Fast Analytics/Data Science Lifecycle (Larson and Chang, 2016)
(13) Data analytics lifecycle model (DALM) (Song and Zhu, 2016)
(14) [Sampling, Exploring, Modifying, Modeling, and Assessing] SEMMA (SAS,
2017)
In Addition, this thesis has collected a variety of data on managing Analytics initiatives
in the domain of LSCM. While few practices and insights are unique to LSCM, the
collected practices and insights are highly relevant to the domain of LSCM since they
have been particularly collected from or in reference to the domain. Thus, the practices
and insights collected are likely to be relevant to other managers in LSCM interested in
managing Analytics initiatives in the sense of the vision of this thesis – enabled to execute
Analytics such that it creates sustainable competitive advantage and continuous
improvement of processes and customer satisfaction. Considering the four inquiries of
215
this thesis, the practices and insights include information on initiatives influential factors,
purpose and objectives, value and (competitive) advantage creation, and measures to
overcome barriers investigated with focus on the domain of LSCM. Hence, the complete
evidence collected for this thesis has been reviewed and analyzed for relevant practices
and insights that could further supplement the CRISP-DM approach. Since the fourth
article specifically investigated practices, which were, however, only presented in an
aggregate form, the interested reader may refer to Appendix B listing and describing the
collected practices. The resulting supplemented CRISP-DM approach (sCRISP-A)
consequentially represents a proven approach for managing Analytics initiatives, in
particular including SCA initiatives, due to updates through insights on managing
Analytics initiatives since 2000 and practices particularly relevant to LSCM and, thus,
managing SCA. Thereby, the introduced abbreviation of “sCRISP-A” updates the
outdated “data mining” term with “Analytics”.
7.3.2 Comparison of approaches to manage Analytics initiatives
The CRISP-DM approach is extensively explained by Chapman et al. (2000) with a
motivation of the overall approach and individual sub-chapters for each phase in three
variations (general approach, user guide, outputs) including obstacles to be aware of. This
level of detail is only matched by few of the considered approaches. Further, the CRISP-
DM approach is clearly focused on Analytics initiatives. This is equivalent to most
approaches it was compared to. The summary of these characteristics of the analyzed
approaches is presented in Table 7. The numbering starts with zero, since all approaches
are compared to the CRISP-DM approach (No. 0).
Considering the general sequence of tasks, the compared approaches usually concur with
the sequence described in the CRISP-DM approach. Only two approaches recommend a
slightly different sequence of tasks. First, The Knowledge Discovery in Databases
approach (Fayyad et al., 1996) puts the data preparation phase previous and parallel to
the data understanding phase. This approach is the oldest approach in the set of compared
approaches and has been included explicitly due to its age and first-mover characteristic.
Considering anecdotes of the interviewees during the data collection, database
conventions have changed considerably over time. Thus, this difference was interpreted
as artifact of these database conventions demanding preparation of data before any
understanding of it could be attempted. Second, the MODA's 10 step model (Copeland,
2015) puts the task of formalizing an agreement between user and analysts after the data
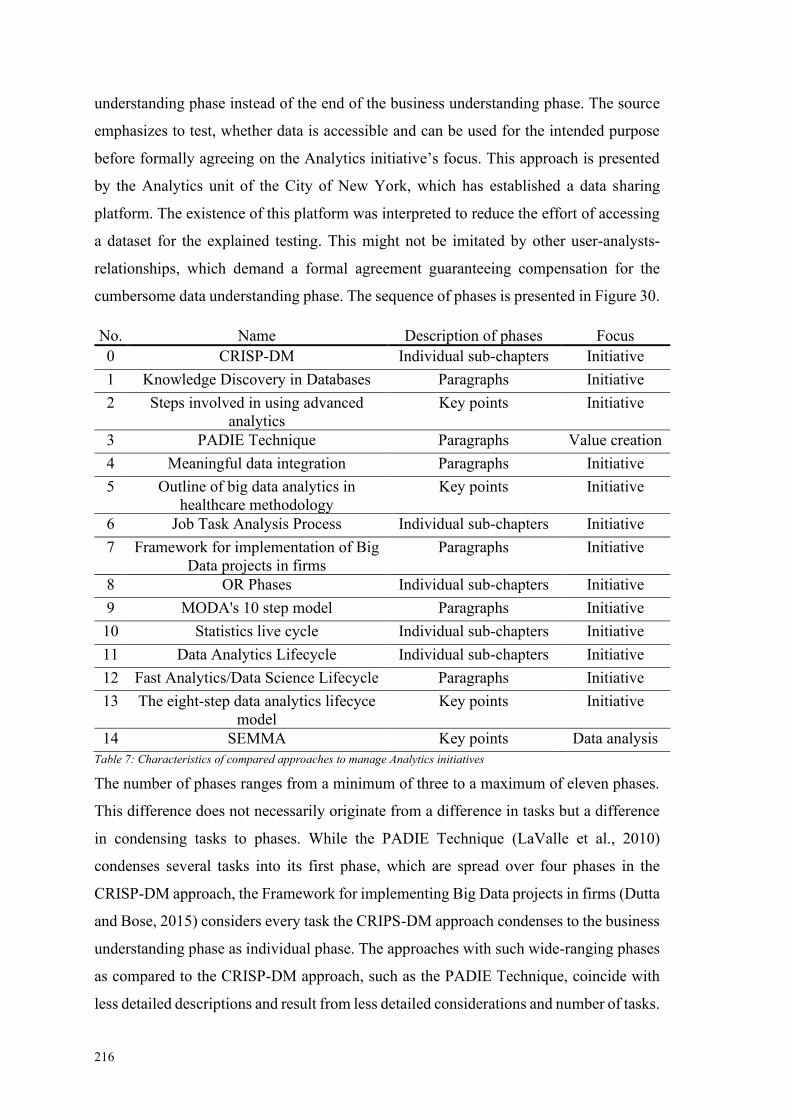
216
understanding phase instead of the end of the business understanding phase. The source
emphasizes to test, whether data is accessible and can be used for the intended purpose
before formally agreeing on the Analytics initiative’s focus. This approach is presented
by the Analytics unit of the City of New York, which has established a data sharing
platform. The existence of this platform was interpreted to reduce the effort of accessing
a dataset for the explained testing. This might not be imitated by other user-analysts-
relationships, which demand a formal agreement guaranteeing compensation for the
cumbersome data understanding phase. The sequence of phases is presented in Figure 30.
No. Name Description of phases Focus
0 CRISP-DM Individual sub-chapters Initiative
1 Knowledge Discovery in Databases Paragraphs Initiative
2 Steps involved in using advanced
analytics
Key points Initiative
3 PADIE Technique Paragraphs Value creation
4 Meaningful data integration Paragraphs Initiative
5 Outline of big data analytics in
healthcare methodology
Key points Initiative
6 Job Task Analysis Process Individual sub-chapters Initiative
7 Framework for implementation of Big
Data projects in firms
Paragraphs Initiative
8 OR Phases Individual sub-chapters Initiative
9 MODA's 10 step model Paragraphs Initiative
10 Statistics live cycle Individual sub-chapters Initiative
11 Data Analytics Lifecycle Individual sub-chapters Initiative
12 Fast Analytics/Data Science Lifecycle Paragraphs Initiative
13 The eight-step data analytics lifecyce
model
Key points Initiative
14 SEMMA Key points Data analysis
Table 7: Characteristics of compared approaches to manage Analytics initiatives
The number of phases ranges from a minimum of three to a maximum of eleven phases.
This difference does not necessarily originate from a difference in tasks but a difference
in condensing tasks to phases. While the PADIE Technique (LaValle et al., 2010)
condenses several tasks into its first phase, which are spread over four phases in the
CRISP-DM approach, the Framework for implementing Big Data projects in firms (Dutta
and Bose, 2015) considers every task the CRIPS-DM approach condenses to the business
understanding phase as individual phase. The approaches with such wide-ranging phases
as compared to the CRISP-DM approach, such as the PADIE Technique, coincide with
less detailed descriptions and result from less detailed considerations and number of tasks.
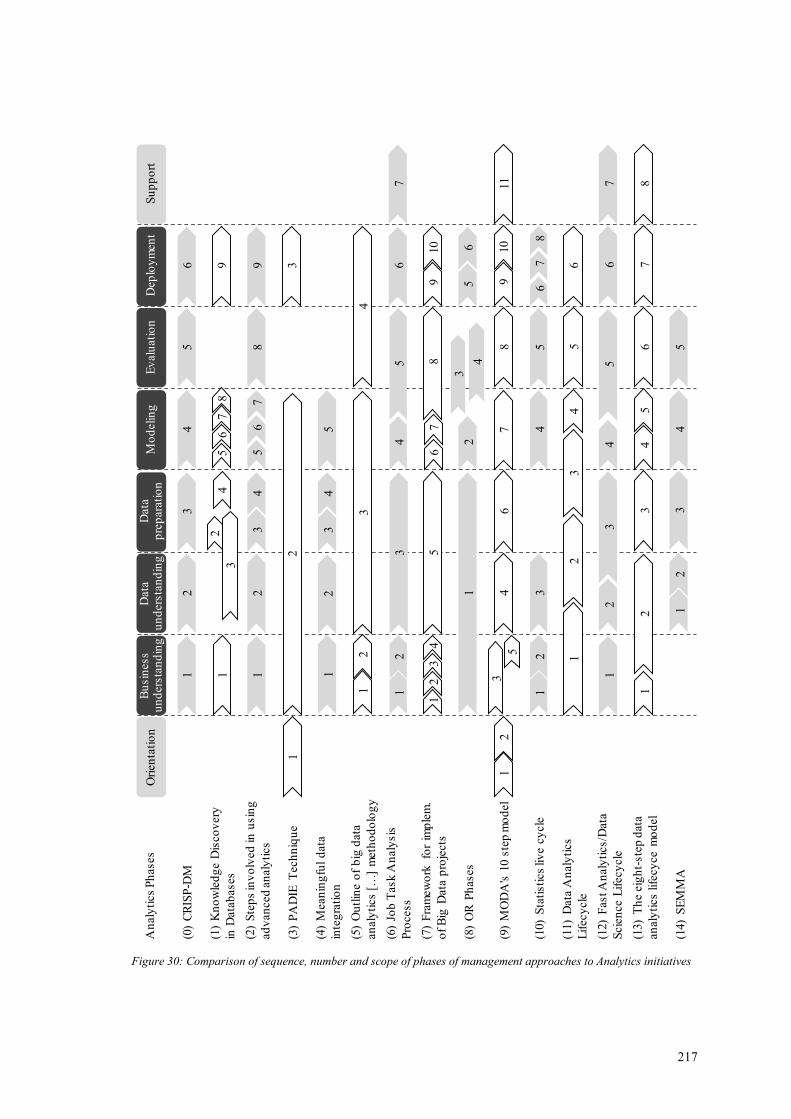
217
Bu
sin
ess
un
ders
tan
din
gD
ata
un
ders
tan
din
gD
ata
p
rep
ara
tio
nM
od
elin
gE
valu
ati
on
An
aly
tics P
hases
Ori
en
tati
on
Su
pp
ort
(7)
Fra
mew
ork
fo
r im
ple
m.
of
Big
Data
pro
jects
Dep
loy
men
t
(1)
Kn
ow
led
ge D
isco
very
in D
ata
bases
(2)
Ste
ps in
vo
lved
in
usin
g
ad
van
ced
an
aly
tics
(3)
PA
DIE
T
ech
niq
ue
(4)
Mean
ing
ful
data
inte
gra
tio
n
(5)
Ou
tlin
e o
f b
ig d
ata
an
aly
tics [
…]
meth
od
olo
gy
(6)
Job
Task A
naly
sis
Pro
cess
(8)
OR
Ph
ases
(9)
MO
DA
's 1
0 s
tep
mo
del
(10)
Sta
tisti
cs li
ve c
ycle
(11)
Data
An
aly
tics
Lif
ecy
cle
(12)
Fast A
naly
tics/D
ata
Scie
nce L
ifecy
cle
(13)
Th
e e
igh
t-ste
p d
ata
an
aly
tics lif
ecy
ce
mo
del
(14)
SE
MM
A
(0)
CR
ISP
-DM
12
34
56
12
34
12
34
9
12
34
56
78
9
12
3
12
34
5
12
34
12
34
56
7
58
67
910
12
4
35
6
12
5
34
67
89
10
11
12
34
56
78
12
34
56
12
34
56
7
12
34
56
78
12
34
5
56
78
Figure 30: Comparison of sequence, number and scope of phases of management approaches to Analytics initiatives
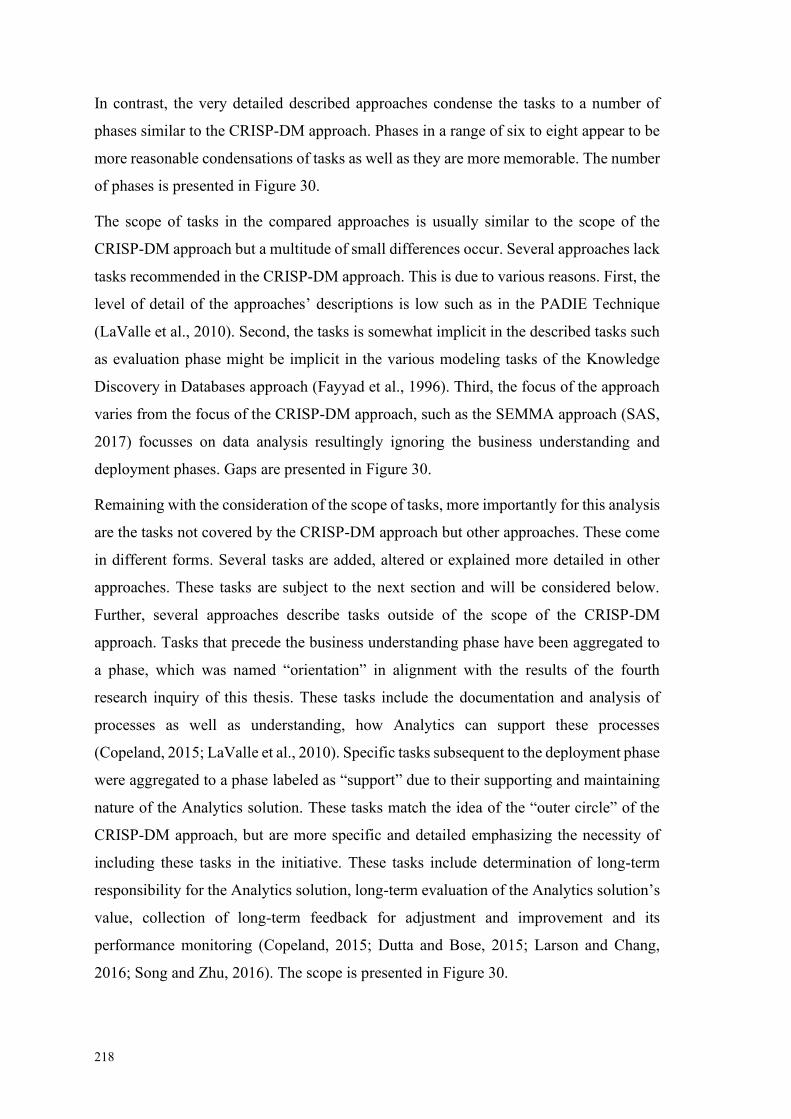
218
In contrast, the very detailed described approaches condense the tasks to a number of
phases similar to the CRISP-DM approach. Phases in a range of six to eight appear to be
more reasonable condensations of tasks as well as they are more memorable. The number
of phases is presented in Figure 30.
The scope of tasks in the compared approaches is usually similar to the scope of the
CRISP-DM approach but a multitude of small differences occur. Several approaches lack
tasks recommended in the CRISP-DM approach. This is due to various reasons. First, the
level of detail of the approaches’ descriptions is low such as in the PADIE Technique
(LaValle et al., 2010). Second, the tasks is somewhat implicit in the described tasks such
as evaluation phase might be implicit in the various modeling tasks of the Knowledge
Discovery in Databases approach (Fayyad et al., 1996). Third, the focus of the approach
varies from the focus of the CRISP-DM approach, such as the SEMMA approach (SAS,
2017) focusses on data analysis resultingly ignoring the business understanding and
deployment phases. Gaps are presented in Figure 30.
Remaining with the consideration of the scope of tasks, more importantly for this analysis
are the tasks not covered by the CRISP-DM approach but other approaches. These come
in different forms. Several tasks are added, altered or explained more detailed in other
approaches. These tasks are subject to the next section and will be considered below.
Further, several approaches describe tasks outside of the scope of the CRISP-DM
approach. Tasks that precede the business understanding phase have been aggregated to
a phase, which was named “orientation” in alignment with the results of the fourth
research inquiry of this thesis. These tasks include the documentation and analysis of
processes as well as understanding, how Analytics can support these processes
(Copeland, 2015; LaValle et al., 2010). Specific tasks subsequent to the deployment phase
were aggregated to a phase labeled as “support” due to their supporting and maintaining
nature of the Analytics solution. These tasks match the idea of the “outer circle” of the
CRISP-DM approach, but are more specific and detailed emphasizing the necessity of
including these tasks in the initiative. These tasks include determination of long-term
responsibility for the Analytics solution, long-term evaluation of the Analytics solution’s
value, collection of long-term feedback for adjustment and improvement and its
performance monitoring (Copeland, 2015; Dutta and Bose, 2015; Larson and Chang,
2016; Song and Zhu, 2016). The scope is presented in Figure 30.
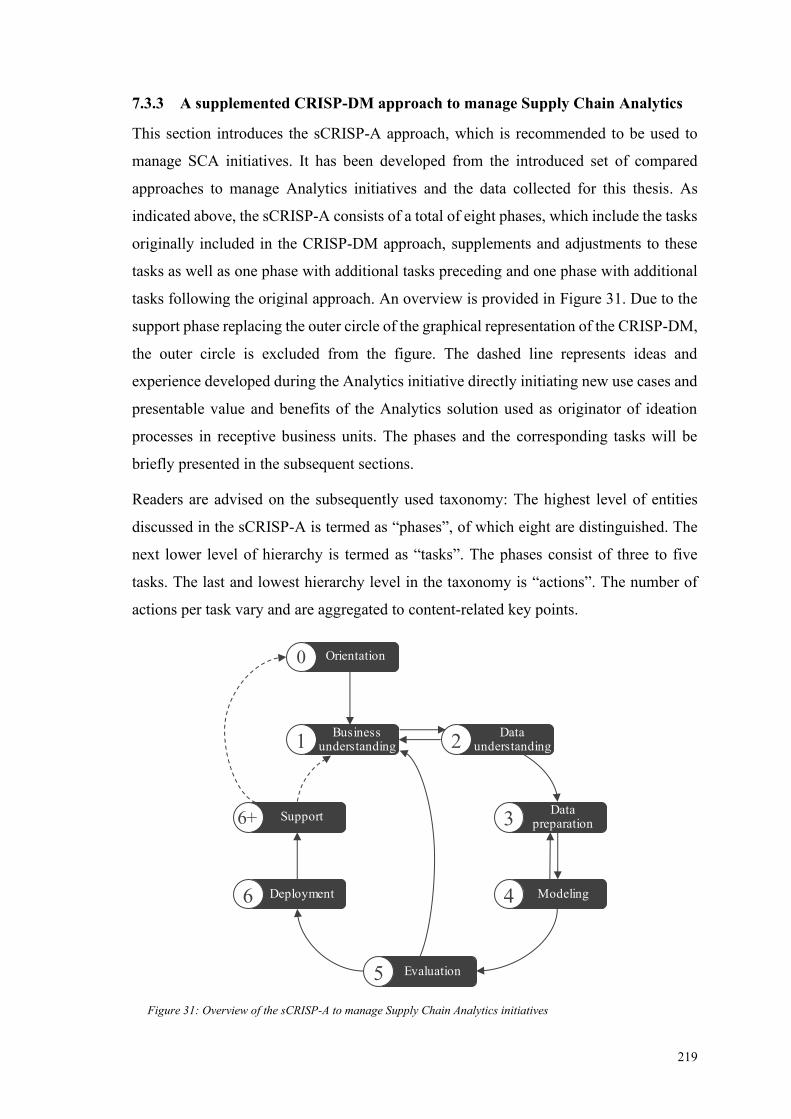
219
7.3.3 A supplemented CRISP-DM approach to manage Supply Chain Analytics
This section introduces the sCRISP-A approach, which is recommended to be used to
manage SCA initiatives. It has been developed from the introduced set of compared
approaches to manage Analytics initiatives and the data collected for this thesis. As
indicated above, the sCRISP-A consists of a total of eight phases, which include the tasks
originally included in the CRISP-DM approach, supplements and adjustments to these
tasks as well as one phase with additional tasks preceding and one phase with additional
tasks following the original approach. An overview is provided in Figure 31. Due to the
support phase replacing the outer circle of the graphical representation of the CRISP-DM,
the outer circle is excluded from the figure. The dashed line represents ideas and
experience developed during the Analytics initiative directly initiating new use cases and
presentable value and benefits of the Analytics solution used as originator of ideation
processes in receptive business units. The phases and the corresponding tasks will be
briefly presented in the subsequent sections.
Readers are advised on the subsequently used taxonomy: The highest level of entities
discussed in the sCRISP-A is termed as “phases”, of which eight are distinguished. The
next lower level of hierarchy is termed as “tasks”. The phases consist of three to five
tasks. The last and lowest hierarchy level in the taxonomy is “actions”. The number of
actions per task vary and are aggregated to content-related key points.
Business understanding1
Data preparation3
Modeling4
Evaluation5
Deployment6
Dataunderstanding2
Support6+
Orientation0
Figure 31: Overview of the sCRISP-A to manage Supply Chain Analytics initiatives
220
7.3.3.1 Phase 0: Orientation
The orientation phase ensures to identify the business areas with the highest impact of
Analytics on the competitive position, alignment of Analytics activities with this
competitive actions, fulfillment of the relevant requirements of these Analytics activities
and the identification of use cases in the respective business units. These four tasks of this
orientation phase are detailed in Table 8. Descriptions in square brackets ‘[]’ represent
alterations resulting from the validation (section 7.3.4) of the sCRISP-A approach.
The orientation phase intends to give organization a direction for the use of Analytics. To
gain competitive advantage, this direction depends on organizational characteristics that
determine the competitive position or the intended future competitive position and the
organizational strategy to achieve this position. As such, before planning and executing
any Analytics action, this competitive position and the organizational strategy need to be
analyzed in the business analysis task to ensure that Analytics strengthens them.
The subsequent task of creating a strategic plan for Analytics instructs the transfer of
the previously analyzed organizational strategy into Analytics actions and initiatives, that
support that strategy. Interviewees emphasized that building Analytics capabilities and
applying Analytics is not and should not be a strategy in LSCM and most other domains
but a tool to support the organizational strategies. Based on the identification of a plan
that fits the organizational strategy, the required capabilities and technologies are
determined as well as their investments. Further actions of this task enable the application
of Analytics in a controlled and strategic manner, by allocating resources, promoting the
topic and measuring its impact.
The task of creating a foundation for Analytics strongly depends on the identified
requirements for Analytics. While all actions are likely to be relevant for organizations,
the extent of their implementation differs by the determined support of Analytics to the
organizational strategy. The scale of investments and provided training or the sharing
agreements with partners depends on the chosen intensity of Analytics in the foreseeable
future of the organization. However, in an economy with a growing role of data, actions
regarding data quality, appreciative mindset towards use of data for decision-making and
an established data governance are recommended albeit this planned intensity of
Analytics. The value of data as an asset to the organization should not be neglected.
Eventually, use cases are required to realize the strategy and create returns on the
investments in capabilities and technologies. The task lists several actions to identify use
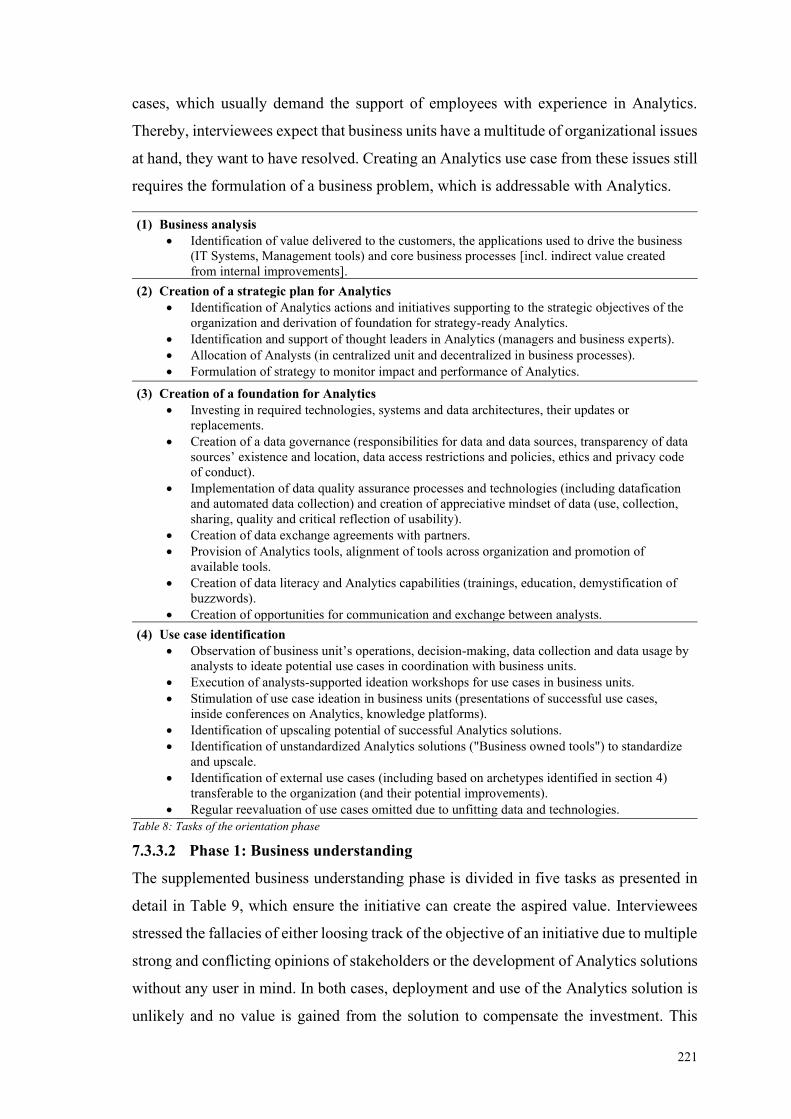
221
cases, which usually demand the support of employees with experience in Analytics.
Thereby, interviewees expect that business units have a multitude of organizational issues
at hand, they want to have resolved. Creating an Analytics use case from these issues still
requires the formulation of a business problem, which is addressable with Analytics.
(1) Business analysis
• Identification of value delivered to the customers, the applications used to drive the business
(IT Systems, Management tools) and core business processes [incl. indirect value created
from internal improvements].
(2) Creation of a strategic plan for Analytics
• Identification of Analytics actions and initiatives supporting to the strategic objectives of the
organization and derivation of foundation for strategy-ready Analytics.
• Identification and support of thought leaders in Analytics (managers and business experts).
• Allocation of Analysts (in centralized unit and decentralized in business processes).
• Formulation of strategy to monitor impact and performance of Analytics.
(3) Creation of a foundation for Analytics
• Investing in required technologies, systems and data architectures, their updates or
replacements.
• Creation of a data governance (responsibilities for data and data sources, transparency of data
sources’ existence and location, data access restrictions and policies, ethics and privacy code
of conduct).
• Implementation of data quality assurance processes and technologies (including datafication
and automated data collection) and creation of appreciative mindset of data (use, collection,
sharing, quality and critical reflection of usability).
• Creation of data exchange agreements with partners.
• Provision of Analytics tools, alignment of tools across organization and promotion of
available tools.
• Creation of data literacy and Analytics capabilities (trainings, education, demystification of
buzzwords).
• Creation of opportunities for communication and exchange between analysts.
(4) Use case identification
• Observation of business unit’s operations, decision-making, data collection and data usage by
analysts to ideate potential use cases in coordination with business units.
• Execution of analysts-supported ideation workshops for use cases in business units.
• Stimulation of use case ideation in business units (presentations of successful use cases,
inside conferences on Analytics, knowledge platforms).
• Identification of upscaling potential of successful Analytics solutions.
• Identification of unstandardized Analytics solutions ("Business owned tools") to standardize
and upscale.
• Identification of external use cases (including based on archetypes identified in section 4)
transferable to the organization (and their potential improvements).
• Regular reevaluation of use cases omitted due to unfitting data and technologies.
Table 8: Tasks of the orientation phase
7.3.3.2 Phase 1: Business understanding
The supplemented business understanding phase is divided in five tasks as presented in
detail in Table 9, which ensure the initiative can create the aspired value. Interviewees
stressed the fallacies of either loosing track of the objective of an initiative due to multiple
strong and conflicting opinions of stakeholders or the development of Analytics solutions
without any user in mind. In both cases, deployment and use of the Analytics solution is
unlikely and no value is gained from the solution to compensate the investment. This
222
phase ensures to develop an Analytics solution that solves a business problem, which has
a problem owner able to participate in the development and is provided with fitting
resources for the development. All tasks originally included in the CRISP-DM are
adjusted and a specific stakeholder analysis task is also included in the sCRISP-A to
emphasize the actions, which received little attention in the original approach.
The task of determining the business objective demands a clearly formulated and agreed
problem statement, which is likely to initiate discussions. However, early discussions are
beneficial as compared to discover a misalignment of understanding of the objective
between stakeholders at a later stage. Further actions evaluate the relevance of the
business problem to the organization and determination of success and failure criteria.
The actions of the task to assess the situation lead to an understanding of the environment
the Analytics initiative will be executed in and the Analytics solution will be deployed in.
Thus, a variety of information is collected about resources, requirements and assumptions
as well as previous attempts to solve the business problem. The task concludes with
estimations about the ability of solving the problem with the given resources and
conditions. Further, an estimation of costs and benefits is conducted.
The stakeholder analysis task ensures the identification of relevant stakeholders and
their expectations. Data presents the user of the Analytics solution as most relevant
stakeholders. Adherence to their requirements is vital to ensure the use of deployed
solutions. Stakeholders are further able to provide relevant information, funding, and
elimination of obstacles such that their identification and updating them their scheduled,
stakeholder-oriented and regular on the initiative’s progress is important for the initiative.
During this phase of business understanding, repeatedly redefining the business objective
is clearly intended to ensure the initiative develops an Analytics solution valuable to the
organization and the intended users. In the task of determining the Analytics objective,
this is supposed to be done implicitly. While executing the actions to determine the
Analytics objective, the analysts evaluate the formulated business problem and the
achievable business impact from a data analysis necessary to solve the business problem.
Thus, analysts are obligated to point out identified mismatches between the analytical
output and relevant value to the business process. This becomes especially relevant, if the
Analytics objective is formulated by the business experts without formulating a business
problem. As support for the analysts’ assessment, they can use the results of preliminary
exploratory data analysis and eventual prototyping.
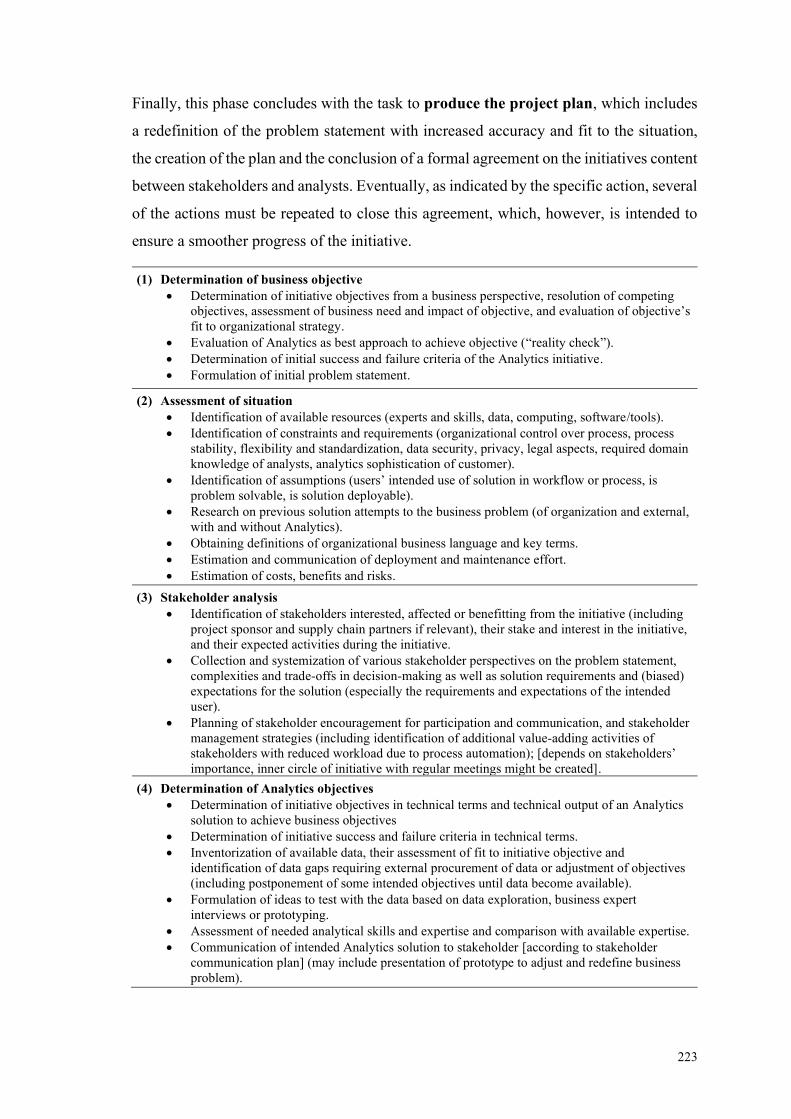
223
Finally, this phase concludes with the task to produce the project plan, which includes
a redefinition of the problem statement with increased accuracy and fit to the situation,
the creation of the plan and the conclusion of a formal agreement on the initiatives content
between stakeholders and analysts. Eventually, as indicated by the specific action, several
of the actions must be repeated to close this agreement, which, however, is intended to
ensure a smoother progress of the initiative.
(1) Determination of business objective
• Determination of initiative objectives from a business perspective, resolution of competing
objectives, assessment of business need and impact of objective, and evaluation of objective’s
fit to organizational strategy.
• Evaluation of Analytics as best approach to achieve objective (“reality check”).
• Determination of initial success and failure criteria of the Analytics initiative.
• Formulation of initial problem statement.
(2) Assessment of situation
• Identification of available resources (experts and skills, data, computing, software/tools).
• Identification of constraints and requirements (organizational control over process, process
stability, flexibility and standardization, data security, privacy, legal aspects, required domain
knowledge of analysts, analytics sophistication of customer).
• Identification of assumptions (users’ intended use of solution in workflow or process, is
problem solvable, is solution deployable).
• Research on previous solution attempts to the business problem (of organization and external,
with and without Analytics).
• Obtaining definitions of organizational business language and key terms.
• Estimation and communication of deployment and maintenance effort.
• Estimation of costs, benefits and risks.
(3) Stakeholder analysis
• Identification of stakeholders interested, affected or benefitting from the initiative (including
project sponsor and supply chain partners if relevant), their stake and interest in the initiative,
and their expected activities during the initiative.
• Collection and systemization of various stakeholder perspectives on the problem statement,
complexities and trade-offs in decision-making as well as solution requirements and (biased)
expectations for the solution (especially the requirements and expectations of the intended
user).
• Planning of stakeholder encouragement for participation and communication, and stakeholder
management strategies (including identification of additional value-adding activities of
stakeholders with reduced workload due to process automation); [depends on stakeholders’
importance, inner circle of initiative with regular meetings might be created].
(4) Determination of Analytics objectives
• Determination of initiative objectives in technical terms and technical output of an Analytics
solution to achieve business objectives
• Determination of initiative success and failure criteria in technical terms.
• Inventorization of available data, their assessment of fit to initiative objective and
identification of data gaps requiring external procurement of data or adjustment of objectives
(including postponement of some intended objectives until data become available).
• Formulation of ideas to test with the data based on data exploration, business expert
interviews or prototyping.
• Assessment of needed analytical skills and expertise and comparison with available expertise.
• Communication of intended Analytics solution to stakeholder [according to stakeholder
communication plan] (may include presentation of prototype to adjust and redefine business
problem).
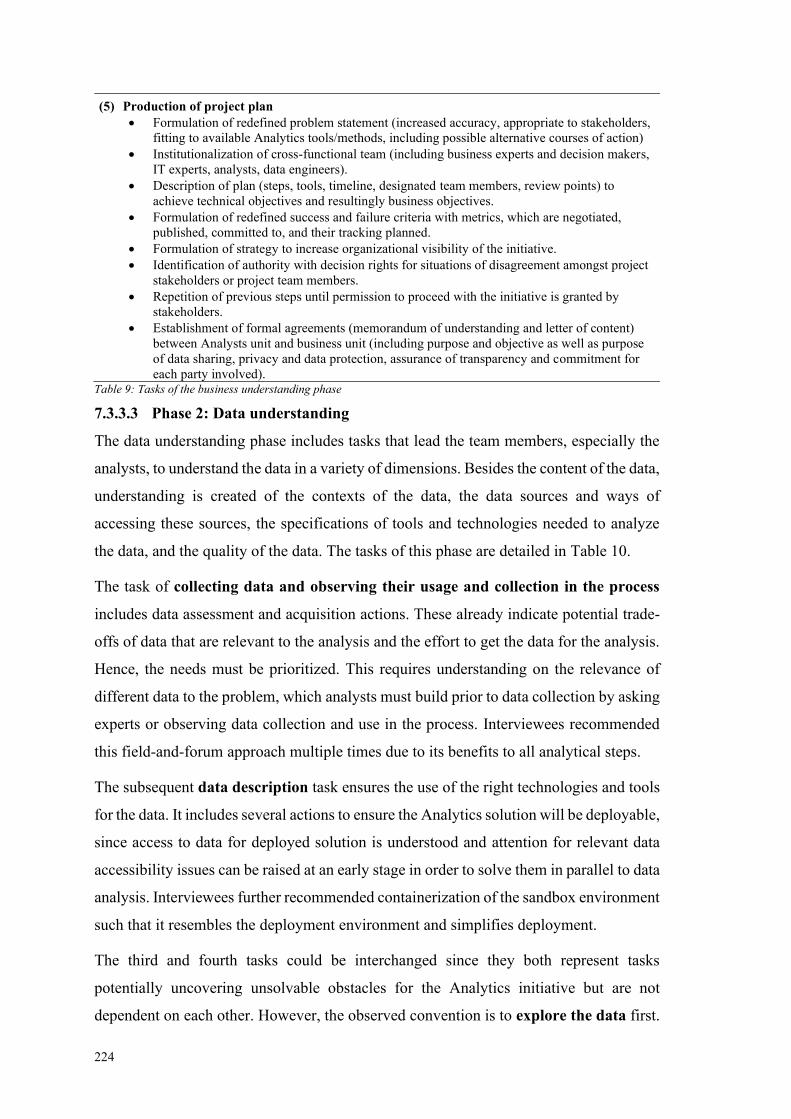
224
(5) Production of project plan
• Formulation of redefined problem statement (increased accuracy, appropriate to stakeholders,
fitting to available Analytics tools/methods, including possible alternative courses of action)
• Institutionalization of cross-functional team (including business experts and decision makers,
IT experts, analysts, data engineers).
• Description of plan (steps, tools, timeline, designated team members, review points) to
achieve technical objectives and resultingly business objectives.
• Formulation of redefined success and failure criteria with metrics, which are negotiated,
published, committed to, and their tracking planned.
• Formulation of strategy to increase organizational visibility of the initiative.
• Identification of authority with decision rights for situations of disagreement amongst project
stakeholders or project team members.
• Repetition of previous steps until permission to proceed with the initiative is granted by
stakeholders.
• Establishment of formal agreements (memorandum of understanding and letter of content)
between Analysts unit and business unit (including purpose and objective as well as purpose
of data sharing, privacy and data protection, assurance of transparency and commitment for
each party involved). Table 9: Tasks of the business understanding phase
7.3.3.3 Phase 2: Data understanding
The data understanding phase includes tasks that lead the team members, especially the
analysts, to understand the data in a variety of dimensions. Besides the content of the data,
understanding is created of the contexts of the data, the data sources and ways of
accessing these sources, the specifications of tools and technologies needed to analyze
the data, and the quality of the data. The tasks of this phase are detailed in Table 10.
The task of collecting data and observing their usage and collection in the process
includes data assessment and acquisition actions. These already indicate potential trade-
offs of data that are relevant to the analysis and the effort to get the data for the analysis.
Hence, the needs must be prioritized. This requires understanding on the relevance of
different data to the problem, which analysts must build prior to data collection by asking
experts or observing data collection and use in the process. Interviewees recommended
this field-and-forum approach multiple times due to its benefits to all analytical steps.
The subsequent data description task ensures the use of the right technologies and tools
for the data. It includes several actions to ensure the Analytics solution will be deployable,
since access to data for deployed solution is understood and attention for relevant data
accessibility issues can be raised at an early stage in order to solve them in parallel to data
analysis. Interviewees further recommended containerization of the sandbox environment
such that it resembles the deployment environment and simplifies deployment.
The third and fourth tasks could be interchanged since they both represent tasks
potentially uncovering unsolvable obstacles for the Analytics initiative but are not
dependent on each other. However, the observed convention is to explore the data first.

225
Actions of this task include pattern and relationship detection and their communication
to stakeholders to discuss potential adjustments of the initiative’s objectives.
Fourth, data quality is assessed, and cleaning strategies are decided, which should
primarily be justified by business and process relevance. Steps to transform data by
filtering and cleaning are automated at this point. However, the next phase will focus on
applying the cleaning techniques and prepare data for analysis. This third phase demands
precise documentation of decisions and their justification to allow recreation of decisions
later on as well as allow reusability of applied data integration and transformations.
(1) Collection of initial data and observation of data handling in the process
• Identification of data needs from problem statement and business understanding phase and
examination of existent organizational data (structured and unstructured). • Inquiry of business and process experts for potentially relevant critical internal and external
effects to decision-making. • Field (and forum) observation of the data collection and data usage in the decision-making by
the analyst to understand meaning of data, original context of data, sources of variation and
their categorization (controllable/not controllable), and the eventual impact of an Analytics
solution as support to decision-making. • Critical reflection of use of data and potential Analytics solution output in the decision-
making and recommendation of adjustments. • Prioritization of required data and identification of best way to acquire or access the data. • Acquisition and/or collection of data (including conviction of data owners and set-up of new
data collection if necessary). • Recording of encountered problems with data acquisition and collection and their resolutions.
(2) Description of data
• Documentation of physical locations of data collection, their accessibility, required tools and
infrastructure needed to handle data, and evaluation of the data integrity in the source the data
is extracted from as well as evaluation of the ability to automate data extraction. • Preparation of the Analytics sandbox environment according to documented requirements and
evaluation and loading of initial data into sandbox environment. • Surface examination of data characteristics, review of fit to requirements, and identification of
potential issues. • Filtering of relevant data and structuring (creation of meta data, tagging) • Examination and inventorization of data and data sources to build understanding on
availability of data, accessibility of data sources, additional data collection needs, and data
acquisition needs from third parties.
(3) Exploration of data
• Application of explorative techniques (queries, visualizations, reporting techniques, search of
patterns, trends, relationships and anomalies including documentation of them being
anticipated or unanticipated). • Identification of performance measurement of existing decision-making process from data as
basis of comparison (if relevant and possible) • Documentation of initial insights, initial hypothesis, recommended levels for parameters for
analytical models, and identified needs for data preparation • Redefinition of business problem statement/business objective and Analytics objective based
on data exploration results, • Determination of reporting and documentation strategy for different stakeholders and
communication of exploratory data analysis results and recommended objective redefinition
[according to stakeholder communication plan (e.g., presentation in regular meeting)]. • Creation of identified side products relevant to stakeholders and users (dashboards,
scoreboards), if requested based on reported result of data exploration.
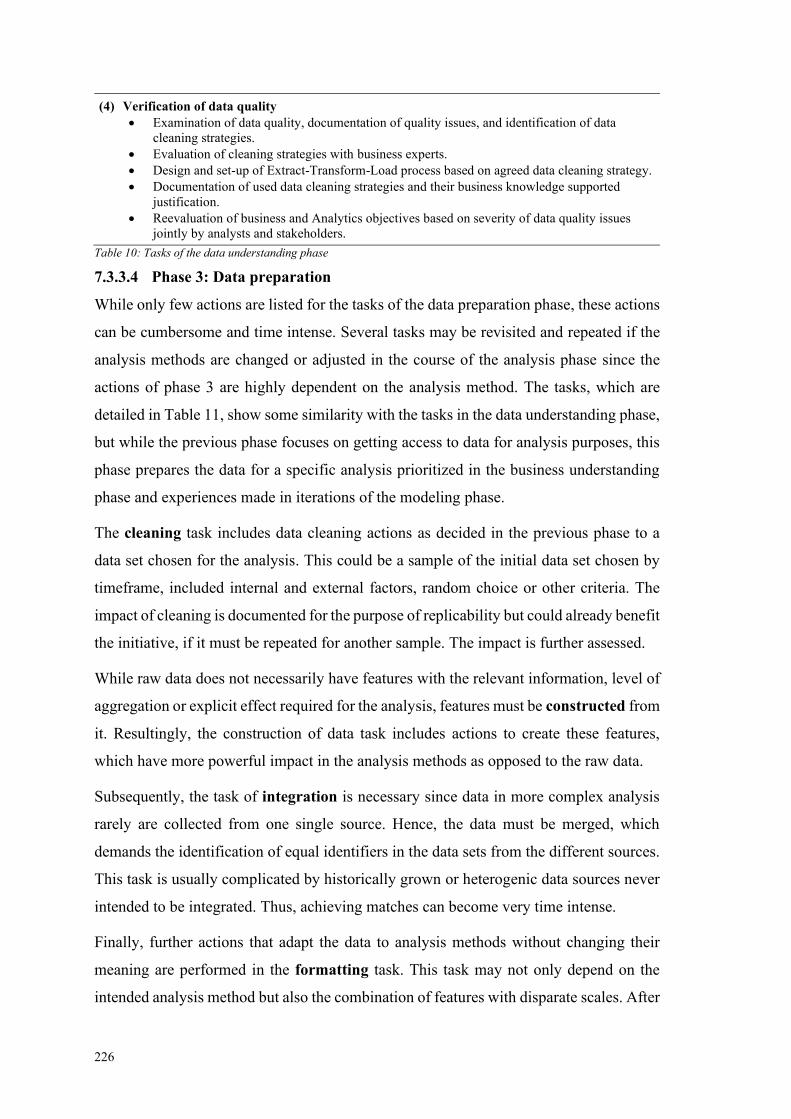
226
(4) Verification of data quality
• Examination of data quality, documentation of quality issues, and identification of data
cleaning strategies. • Evaluation of cleaning strategies with business experts. • Design and set-up of Extract-Transform-Load process based on agreed data cleaning strategy. • Documentation of used data cleaning strategies and their business knowledge supported
justification. • Reevaluation of business and Analytics objectives based on severity of data quality issues
jointly by analysts and stakeholders.
Table 10: Tasks of the data understanding phase
7.3.3.4 Phase 3: Data preparation
While only few actions are listed for the tasks of the data preparation phase, these actions
can be cumbersome and time intense. Several tasks may be revisited and repeated if the
analysis methods are changed or adjusted in the course of the analysis phase since the
actions of phase 3 are highly dependent on the analysis method. The tasks, which are
detailed in Table 11, show some similarity with the tasks in the data understanding phase,
but while the previous phase focuses on getting access to data for analysis purposes, this
phase prepares the data for a specific analysis prioritized in the business understanding
phase and experiences made in iterations of the modeling phase.
The cleaning task includes data cleaning actions as decided in the previous phase to a
data set chosen for the analysis. This could be a sample of the initial data set chosen by
timeframe, included internal and external factors, random choice or other criteria. The
impact of cleaning is documented for the purpose of replicability but could already benefit
the initiative, if it must be repeated for another sample. The impact is further assessed.
While raw data does not necessarily have features with the relevant information, level of
aggregation or explicit effect required for the analysis, features must be constructed from
it. Resultingly, the construction of data task includes actions to create these features,
which have more powerful impact in the analysis methods as opposed to the raw data.
Subsequently, the task of integration is necessary since data in more complex analysis
rarely are collected from one single source. Hence, the data must be merged, which
demands the identification of equal identifiers in the data sets from the different sources.
This task is usually complicated by historically grown or heterogenic data sources never
intended to be integrated. Thus, achieving matches can become very time intense.
Finally, further actions that adapt the data to analysis methods without changing their
meaning are performed in the formatting task. This task may not only depend on the
intended analysis method but also the combination of features with disparate scales. After
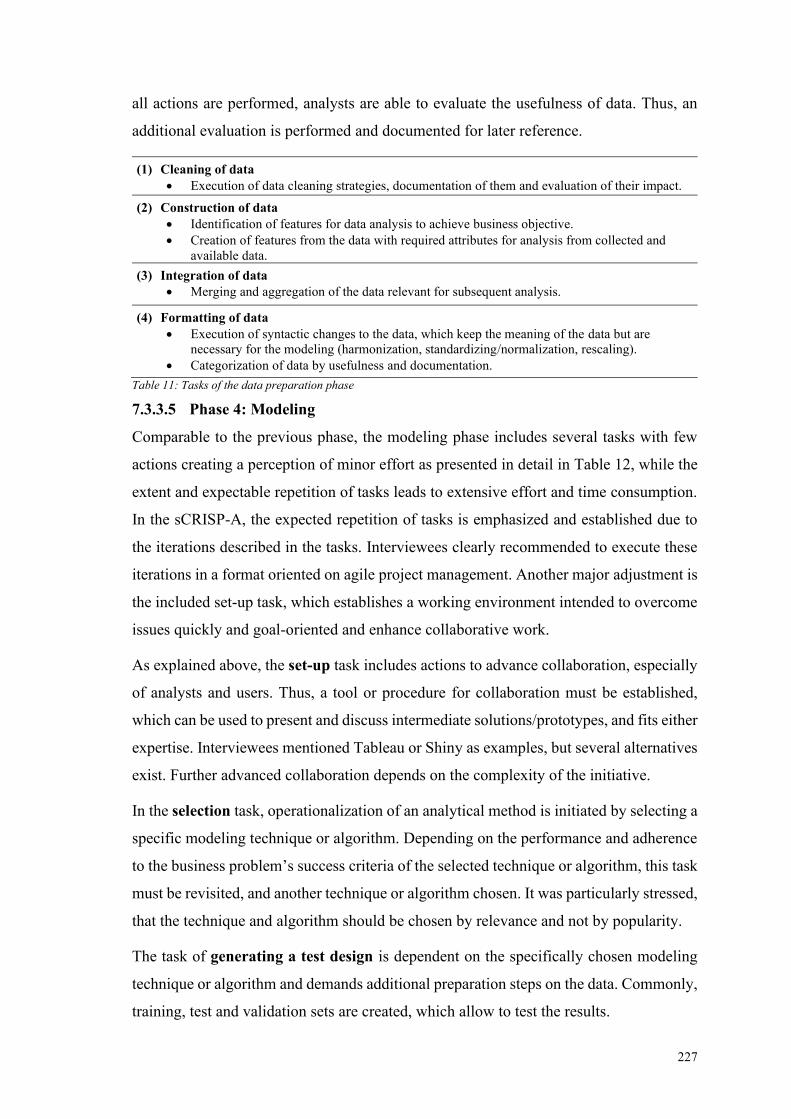
227
all actions are performed, analysts are able to evaluate the usefulness of data. Thus, an
additional evaluation is performed and documented for later reference.
(1) Cleaning of data
• Execution of data cleaning strategies, documentation of them and evaluation of their impact.
(2) Construction of data
• Identification of features for data analysis to achieve business objective.
• Creation of features from the data with required attributes for analysis from collected and
available data.
(3) Integration of data
• Merging and aggregation of the data relevant for subsequent analysis.
(4) Formatting of data
• Execution of syntactic changes to the data, which keep the meaning of the data but are
necessary for the modeling (harmonization, standardizing/normalization, rescaling).
• Categorization of data by usefulness and documentation.
Table 11: Tasks of the data preparation phase
7.3.3.5 Phase 4: Modeling
Comparable to the previous phase, the modeling phase includes several tasks with few
actions creating a perception of minor effort as presented in detail in Table 12, while the
extent and expectable repetition of tasks leads to extensive effort and time consumption.
In the sCRISP-A, the expected repetition of tasks is emphasized and established due to
the iterations described in the tasks. Interviewees clearly recommended to execute these
iterations in a format oriented on agile project management. Another major adjustment is
the included set-up task, which establishes a working environment intended to overcome
issues quickly and goal-oriented and enhance collaborative work.
As explained above, the set-up task includes actions to advance collaboration, especially
of analysts and users. Thus, a tool or procedure for collaboration must be established,
which can be used to present and discuss intermediate solutions/prototypes, and fits either
expertise. Interviewees mentioned Tableau or Shiny as examples, but several alternatives
exist. Further advanced collaboration depends on the complexity of the initiative.
In the selection task, operationalization of an analytical method is initiated by selecting a
specific modeling technique or algorithm. Depending on the performance and adherence
to the business problem’s success criteria of the selected technique or algorithm, this task
must be revisited, and another technique or algorithm chosen. It was particularly stressed,
that the technique and algorithm should be chosen by relevance and not by popularity.
The task of generating a test design is dependent on the specifically chosen modeling
technique or algorithm and demands additional preparation steps on the data. Commonly,
training, test and validation sets are created, which allow to test the results.
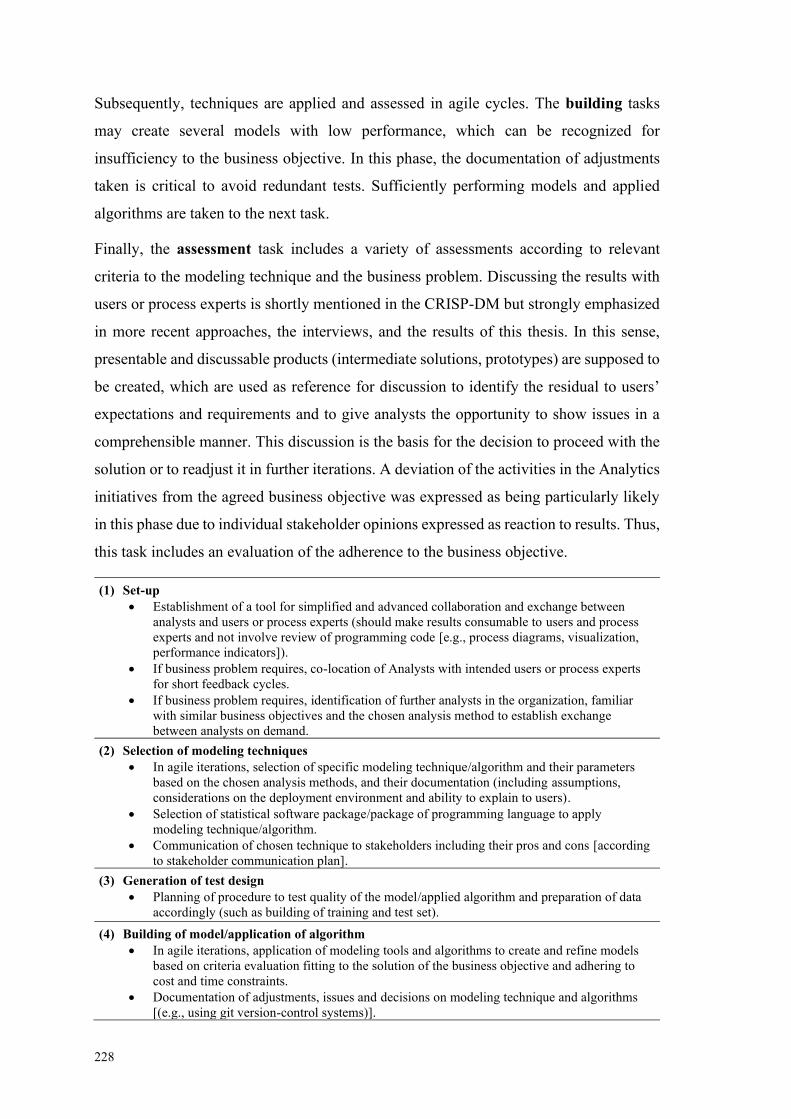
228
Subsequently, techniques are applied and assessed in agile cycles. The building tasks
may create several models with low performance, which can be recognized for
insufficiency to the business objective. In this phase, the documentation of adjustments
taken is critical to avoid redundant tests. Sufficiently performing models and applied
algorithms are taken to the next task.
Finally, the assessment task includes a variety of assessments according to relevant
criteria to the modeling technique and the business problem. Discussing the results with
users or process experts is shortly mentioned in the CRISP-DM but strongly emphasized
in more recent approaches, the interviews, and the results of this thesis. In this sense,
presentable and discussable products (intermediate solutions, prototypes) are supposed to
be created, which are used as reference for discussion to identify the residual to users’
expectations and requirements and to give analysts the opportunity to show issues in a
comprehensible manner. This discussion is the basis for the decision to proceed with the
solution or to readjust it in further iterations. A deviation of the activities in the Analytics
initiatives from the agreed business objective was expressed as being particularly likely
in this phase due to individual stakeholder opinions expressed as reaction to results. Thus,
this task includes an evaluation of the adherence to the business objective.
(1) Set-up
• Establishment of a tool for simplified and advanced collaboration and exchange between
analysts and users or process experts (should make results consumable to users and process
experts and not involve review of programming code [e.g., process diagrams, visualization,
performance indicators]).
• If business problem requires, co-location of Analysts with intended users or process experts
for short feedback cycles.
• If business problem requires, identification of further analysts in the organization, familiar
with similar business objectives and the chosen analysis method to establish exchange
between analysts on demand.
(2) Selection of modeling techniques
• In agile iterations, selection of specific modeling technique/algorithm and their parameters
based on the chosen analysis methods, and their documentation (including assumptions,
considerations on the deployment environment and ability to explain to users).
• Selection of statistical software package/package of programming language to apply
modeling technique/algorithm.
• Communication of chosen technique to stakeholders including their pros and cons [according
to stakeholder communication plan].
(3) Generation of test design
• Planning of procedure to test quality of the model/applied algorithm and preparation of data
accordingly (such as building of training and test set).
(4) Building of model/application of algorithm
• In agile iterations, application of modeling tools and algorithms to create and refine models
based on criteria evaluation fitting to the solution of the business objective and adhering to
cost and time constraints.
• Documentation of adjustments, issues and decisions on modeling technique and algorithms
[(e.g., using git version-control systems)].
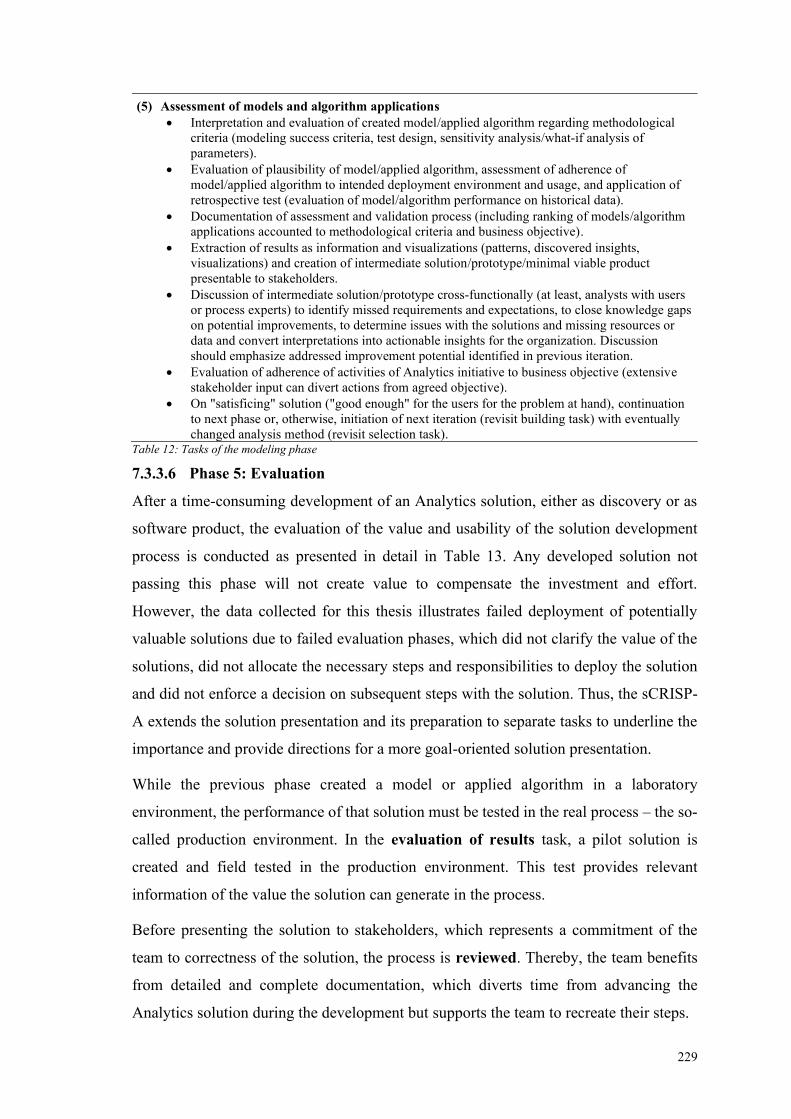
229
(5) Assessment of models and algorithm applications
• Interpretation and evaluation of created model/applied algorithm regarding methodological
criteria (modeling success criteria, test design, sensitivity analysis/what-if analysis of
parameters).
• Evaluation of plausibility of model/applied algorithm, assessment of adherence of
model/applied algorithm to intended deployment environment and usage, and application of
retrospective test (evaluation of model/algorithm performance on historical data).
• Documentation of assessment and validation process (including ranking of models/algorithm
applications accounted to methodological criteria and business objective).
• Extraction of results as information and visualizations (patterns, discovered insights,
visualizations) and creation of intermediate solution/prototype/minimal viable product
presentable to stakeholders.
• Discussion of intermediate solution/prototype cross-functionally (at least, analysts with users
or process experts) to identify missed requirements and expectations, to close knowledge gaps
on potential improvements, to determine issues with the solutions and missing resources or
data and convert interpretations into actionable insights for the organization. Discussion
should emphasize addressed improvement potential identified in previous iteration.
• Evaluation of adherence of activities of Analytics initiative to business objective (extensive
stakeholder input can divert actions from agreed objective).
• On "satisficing" solution ("good enough" for the users for the problem at hand), continuation
to next phase or, otherwise, initiation of next iteration (revisit building task) with eventually
changed analysis method (revisit selection task). Table 12: Tasks of the modeling phase
7.3.3.6 Phase 5: Evaluation
After a time-consuming development of an Analytics solution, either as discovery or as
software product, the evaluation of the value and usability of the solution development
process is conducted as presented in detail in Table 13. Any developed solution not
passing this phase will not create value to compensate the investment and effort.
However, the data collected for this thesis illustrates failed deployment of potentially
valuable solutions due to failed evaluation phases, which did not clarify the value of the
solutions, did not allocate the necessary steps and responsibilities to deploy the solution
and did not enforce a decision on subsequent steps with the solution. Thus, the sCRISP-
A extends the solution presentation and its preparation to separate tasks to underline the
importance and provide directions for a more goal-oriented solution presentation.
While the previous phase created a model or applied algorithm in a laboratory
environment, the performance of that solution must be tested in the real process – the so-
called production environment. In the evaluation of results task, a pilot solution is
created and field tested in the production environment. This test provides relevant
information of the value the solution can generate in the process.
Before presenting the solution to stakeholders, which represents a commitment of the
team to correctness of the solution, the process is reviewed. Thereby, the team benefits
from detailed and complete documentation, which diverts time from advancing the
Analytics solution during the development but supports the team to recreate their steps.
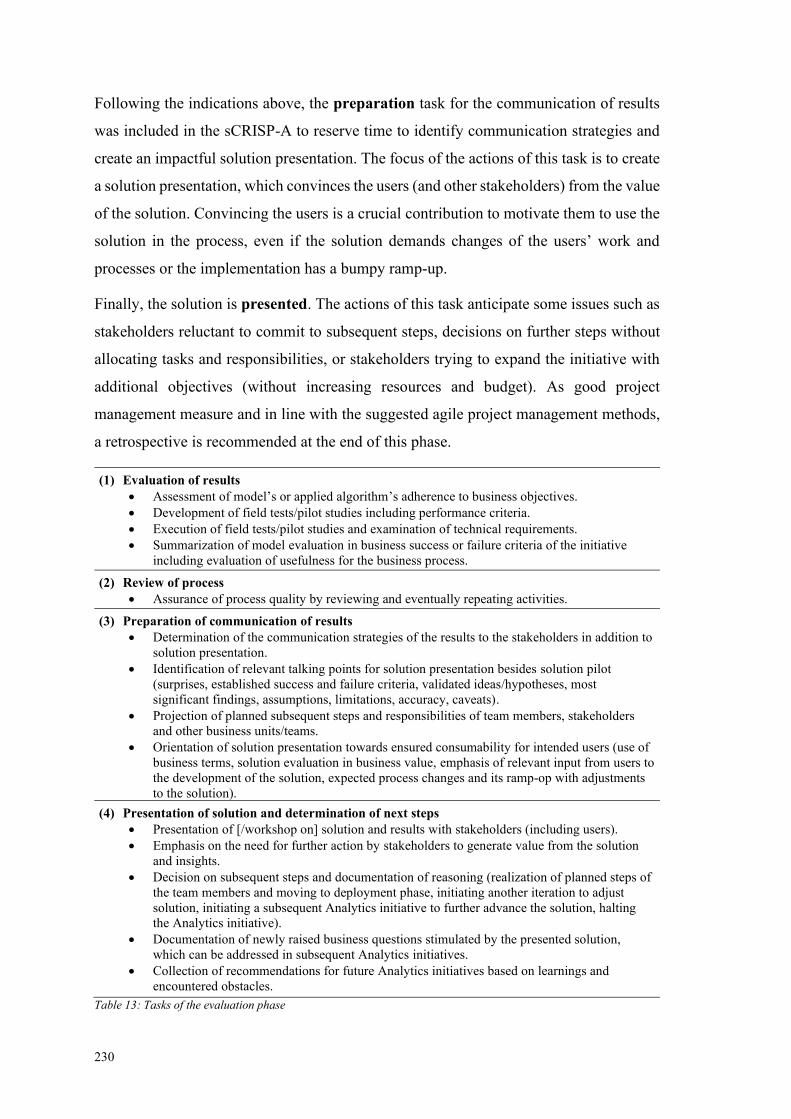
230
Following the indications above, the preparation task for the communication of results
was included in the sCRISP-A to reserve time to identify communication strategies and
create an impactful solution presentation. The focus of the actions of this task is to create
a solution presentation, which convinces the users (and other stakeholders) from the value
of the solution. Convincing the users is a crucial contribution to motivate them to use the
solution in the process, even if the solution demands changes of the users’ work and
processes or the implementation has a bumpy ramp-up.
Finally, the solution is presented. The actions of this task anticipate some issues such as
stakeholders reluctant to commit to subsequent steps, decisions on further steps without
allocating tasks and responsibilities, or stakeholders trying to expand the initiative with
additional objectives (without increasing resources and budget). As good project
management measure and in line with the suggested agile project management methods,
a retrospective is recommended at the end of this phase.
(1) Evaluation of results
• Assessment of model’s or applied algorithm’s adherence to business objectives.
• Development of field tests/pilot studies including performance criteria.
• Execution of field tests/pilot studies and examination of technical requirements.
• Summarization of model evaluation in business success or failure criteria of the initiative
including evaluation of usefulness for the business process.
(2) Review of process
• Assurance of process quality by reviewing and eventually repeating activities.
(3) Preparation of communication of results
• Determination of the communication strategies of the results to the stakeholders in addition to
solution presentation.
• Identification of relevant talking points for solution presentation besides solution pilot
(surprises, established success and failure criteria, validated ideas/hypotheses, most
significant findings, assumptions, limitations, accuracy, caveats).
• Projection of planned subsequent steps and responsibilities of team members, stakeholders
and other business units/teams.
• Orientation of solution presentation towards ensured consumability for intended users (use of
business terms, solution evaluation in business value, emphasis of relevant input from users to
the development of the solution, expected process changes and its ramp-op with adjustments
to the solution).
(4) Presentation of solution and determination of next steps
• Presentation of [/workshop on] solution and results with stakeholders (including users).
• Emphasis on the need for further action by stakeholders to generate value from the solution
and insights.
• Decision on subsequent steps and documentation of reasoning (realization of planned steps of
the team members and moving to deployment phase, initiating another iteration to adjust
solution, initiating a subsequent Analytics initiative to further advance the solution, halting
the Analytics initiative).
• Documentation of newly raised business questions stimulated by the presented solution,
which can be addressed in subsequent Analytics initiatives.
• Collection of recommendations for future Analytics initiatives based on learnings and
encountered obstacles.
Table 13: Tasks of the evaluation phase
231
7.3.3.7 Phase 6: Deployment
After the approval of the Analytics solution, it must be deployed. The deployment phase
finishes the development of the Analytics solution, which marks the final phase in the
original CRISP-DM. Thereby, either a software product is finalized and implemented into
the IT eco-system (“Analytics product” or “data product”) or a discovery is provided to
management to initiate organizational changes. The investigated approaches to manage
Analytics initiatives and the interviewees primarily focused on the former such that users
are provided with a decision-support tool or some process automating capability. The
latter has a significantly shorter deployment regarding the Analytics initiative, since the
product to transfer the discoveries is usually a PowerPoint slide deck or a report. These
reports demand subsequent projects based on the discoveries to create organizational
changes exploiting the discoveries. The tasks of the deployment phase are presented in
detail in Table 14 with actions primarily focused towards Analytics products.
Across the investigated approaches, the deployment phase is implicitly understood to
require an additional team of software developers for programming and implementation
of an Analytics product. Thus, the actions of the Analytics initiative’s team members are
limited to preparing the solution for these software developers and preparing the users
for using the solution. In contrast to the original CRISP-DM, a very explicit and strong
focus is put on the users and their expected handling of the solution in the sCRISP-A.
The performance of deployed Analytics solutions is influenced by a variety of factors.
Internal factors can limit the impact and functionality of solutions such as users using the
solution in the wrong way or changing IT landscapes compromising data inputs to the
solution. External factors such as changing market conditions or changing customer
behavior including changed behavior due to deployed solutions can result in reduced
validity of solutions. In both cases, the quality degradation of solutions must be detected
and countered. To enable longevity and durability of solutions, maintenance and
monitoring is planned. To improve understanding of the impact of Analytics solutions
on the organization, which can eventually be used as motivation for further initiatives, a
long-term evaluation of the business value is additionally planned.
While a multitude of documentations and reports is created along the Analytics initiative,
the task of producing a final report is supposed to collect information beyond
justification and reproducibility of actions. The team is asked to look ahead and consider
scalability, changes in the organizational knowledge and the opportunity to spread the
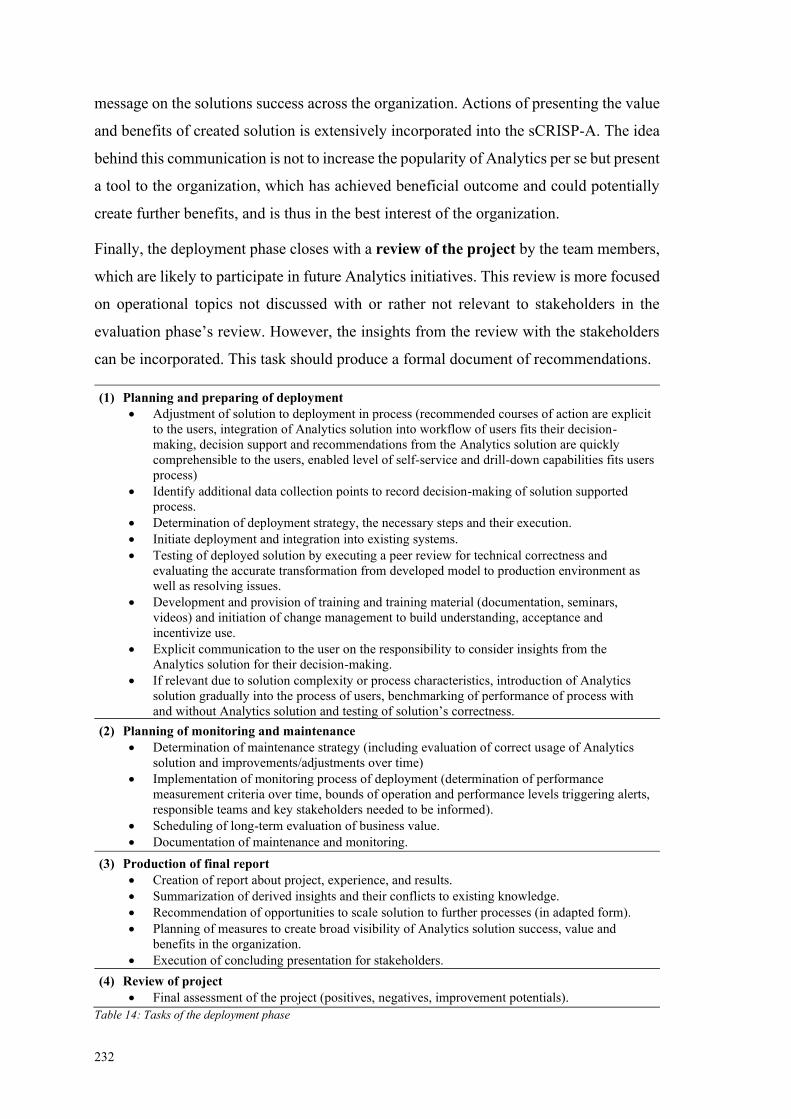
232
message on the solutions success across the organization. Actions of presenting the value
and benefits of created solution is extensively incorporated into the sCRISP-A. The idea
behind this communication is not to increase the popularity of Analytics per se but present
a tool to the organization, which has achieved beneficial outcome and could potentially
create further benefits, and is thus in the best interest of the organization.
Finally, the deployment phase closes with a review of the project by the team members,
which are likely to participate in future Analytics initiatives. This review is more focused
on operational topics not discussed with or rather not relevant to stakeholders in the
evaluation phase’s review. However, the insights from the review with the stakeholders
can be incorporated. This task should produce a formal document of recommendations.
(1) Planning and preparing of deployment
• Adjustment of solution to deployment in process (recommended courses of action are explicit
to the users, integration of Analytics solution into workflow of users fits their decision-
making, decision support and recommendations from the Analytics solution are quickly
comprehensible to the users, enabled level of self-service and drill-down capabilities fits users
process)
• Identify additional data collection points to record decision-making of solution supported
process.
• Determination of deployment strategy, the necessary steps and their execution.
• Initiate deployment and integration into existing systems.
• Testing of deployed solution by executing a peer review for technical correctness and
evaluating the accurate transformation from developed model to production environment as
well as resolving issues.
• Development and provision of training and training material (documentation, seminars,
videos) and initiation of change management to build understanding, acceptance and
incentivize use.
• Explicit communication to the user on the responsibility to consider insights from the
Analytics solution for their decision-making.
• If relevant due to solution complexity or process characteristics, introduction of Analytics
solution gradually into the process of users, benchmarking of performance of process with
and without Analytics solution and testing of solution’s correctness.
(2) Planning of monitoring and maintenance
• Determination of maintenance strategy (including evaluation of correct usage of Analytics
solution and improvements/adjustments over time)
• Implementation of monitoring process of deployment (determination of performance
measurement criteria over time, bounds of operation and performance levels triggering alerts,
responsible teams and key stakeholders needed to be informed).
• Scheduling of long-term evaluation of business value.
• Documentation of maintenance and monitoring.
(3) Production of final report
• Creation of report about project, experience, and results.
• Summarization of derived insights and their conflicts to existing knowledge.
• Recommendation of opportunities to scale solution to further processes (in adapted form).
• Planning of measures to create broad visibility of Analytics solution success, value and
benefits in the organization.
• Execution of concluding presentation for stakeholders.
(4) Review of project
• Final assessment of the project (positives, negatives, improvement potentials).
Table 14: Tasks of the deployment phase
233
7.3.3.8 Phase 6+: Support
Finally, the support phase follows the development of the Analytics solution and ensures
the exploitation of the maximum value and benefits from solutions as presented in detail
in Table 15. This phase maximizes the long-term return on investments of Analytics
solutions in production that finally create value compensating their investments (and the
maintenance effort). It further creates spillover effects to other Analytics initiatives by
ensuring the distribution of gained knowledge during the Analytics initiative.
The task of evaluating the usage of the Analytics solution is primarily the responsibility
of the users themselves since the development team has separated in this phase. Users are
demanded to actively reflect their usage of the solution and collect feedback on necessary
changes and improvements. They must further communicate their need for re-training to
Analytics experts to obtain the best support for their processes. Depending on the users’
role, these responsibilities might be exercised by users’ supervision or management.
In parallel, the task of distributing the documentations from the initiatives is executed.
The responsibility of this task is assumed by Analytics experts but not necessarily by the
development team members. Actions of this tasks lead to the distribution of knowledge
as passively being available at easily accessible places or as actively provided trainings
to analysts or other roles potentially participating in Analytics initiatives.
Lastly, monitoring and maintenance are conducted. The actions require Analytics
experts to be involved. Experts with knowledge on the solutions are particularly valuable
contributors and reactivating former development team members can enhance the impact
of methodological or technological advancements. However, maintenance addresses
minor solutions adjustments to recent changes in data or users’ feedback. Major changes
should trigger novel Analytics initiatives with individual value to compensate efforts. To
conclude, the necessity of gaining business value and benefits from applying the tool of
Analytics equivalently upholds for improvements of Analytics solutions.
(1) Evaluation of usage
• Users assume responsibility of the Analytics solution (assurance of solution’s use in the
process, management of solution, formulation of requests for advancements)
• Tracking of decision-making in the Analytics solution supported process and the conformity
to the solutions recommendations.
• Collection of user feedback (perceived performance, usability, consumability of decision
support, speed, scope of capabilities, and need for adjustments to changes in process,
organization, or industry).
• Provision for regular re-education on Analytics solutions functionality and use of results, and
opportunities to ask questions (short trainings, webcasts).
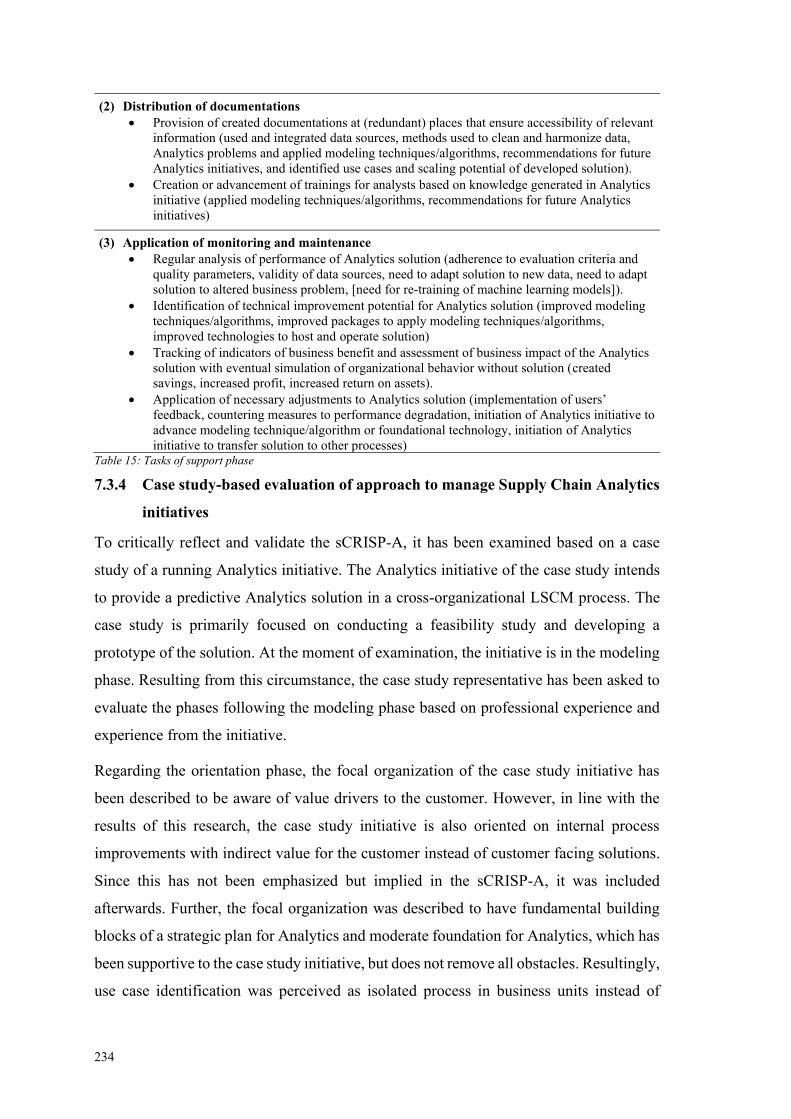
234
(2) Distribution of documentations
• Provision of created documentations at (redundant) places that ensure accessibility of relevant
information (used and integrated data sources, methods used to clean and harmonize data,
Analytics problems and applied modeling techniques/algorithms, recommendations for future
Analytics initiatives, and identified use cases and scaling potential of developed solution).
• Creation or advancement of trainings for analysts based on knowledge generated in Analytics
initiative (applied modeling techniques/algorithms, recommendations for future Analytics
initiatives)
(3) Application of monitoring and maintenance
• Regular analysis of performance of Analytics solution (adherence to evaluation criteria and
quality parameters, validity of data sources, need to adapt solution to new data, need to adapt
solution to altered business problem, [need for re-training of machine learning models]).
• Identification of technical improvement potential for Analytics solution (improved modeling
techniques/algorithms, improved packages to apply modeling techniques/algorithms,
improved technologies to host and operate solution)
• Tracking of indicators of business benefit and assessment of business impact of the Analytics
solution with eventual simulation of organizational behavior without solution (created
savings, increased profit, increased return on assets).
• Application of necessary adjustments to Analytics solution (implementation of users’
feedback, countering measures to performance degradation, initiation of Analytics initiative to
advance modeling technique/algorithm or foundational technology, initiation of Analytics
initiative to transfer solution to other processes) Table 15: Tasks of support phase
7.3.4 Case study-based evaluation of approach to manage Supply Chain Analytics
initiatives
To critically reflect and validate the sCRISP-A, it has been examined based on a case
study of a running Analytics initiative. The Analytics initiative of the case study intends
to provide a predictive Analytics solution in a cross-organizational LSCM process. The
case study is primarily focused on conducting a feasibility study and developing a
prototype of the solution. At the moment of examination, the initiative is in the modeling
phase. Resulting from this circumstance, the case study representative has been asked to
evaluate the phases following the modeling phase based on professional experience and
experience from the initiative.
Regarding the orientation phase, the focal organization of the case study initiative has
been described to be aware of value drivers to the customer. However, in line with the
results of this research, the case study initiative is also oriented on internal process
improvements with indirect value for the customer instead of customer facing solutions.
Since this has not been emphasized but implied in the sCRISP-A, it was included
afterwards. Further, the focal organization was described to have fundamental building
blocks of a strategic plan for Analytics and moderate foundation for Analytics, which has
been supportive to the case study initiative, but does not remove all obstacles. Resultingly,
use case identification was perceived as isolated process in business units instead of
235
systematically applied across the organization. Thus, especially the accessibility of data
owners and their data as well as the oversight on Analytics activities across the
organization was experienced as inadequate. Hence, the proposed orientation phase has
been endorsed by the case study representative since it would resolve issues experienced
in the case study initiative.
The business understanding phase of the case study initiative has been an already
identified weakness by the representative. The Analytics objective of the initiative had
been agreed upon without a clear problem statement. This resulted in challenges in
defining requirements on the solution or the characteristics of the solution, as well as to
identify needed data and skills. Further, tasks could have been executed more efficiently
and in shorter time with a clear problem statement. Thus, starting an initiative with the
determination of the business objective has been endorsed by the case study
representative. Further, due to the cross-organizational nature of the initiative, the formal
agreement had been concluded before an assessment of the situation, stakeholder analysis
or initial assessment of available data had been conducted. Thus, the agreement did not
fit to the best approach to the initiatives but required the execution of tasks barely
contributing to the solution. Resultingly, the case study representative endorsed to
conclude the formal agreement on project plan and tasks to the end of the business
understanding phase. Further tasks in the initiative were conducted in the sequence as
recommended in the sCRISP-A and the sequence was confirmed as proper. Regarding
specific tasks, the case study representative emphasized the stakeholder communication
as being dependent on the stakeholder importance with the most important stakeholders
being present in regular meetings. These meetings were described to provide a platform
for all the communication activities listed subsequently in the sCRISP-A. In addition,
defining the Analytics objective includes the investigation of possible analytical methods
to address the business problem. While this does not indicate the choice of specific
techniques, it might include ideas and thoughts on combinations and chaining of
techniques representing analytical methods. These comments have been included in the
sCRISP-A.
In the discussion of the data understanding phase, the case study representative agreed
completely to the comprehensiveness and sequence of recommended tasks. Especially
the cross-functional cooperation, which is emphasized in the sCRISP-A, was endorsed
such as the field and forum observation of the process by analysts to gain deep
236
understanding of the process, and the involvement of business experts in solving data
quality issues. This form of cooperation was explained as being vital for goal-oriented
development of Analytics solutions.
Similar to the prior phase, the tasks and activities of the data preparation phase were
acknowledged as comprehensive and correct in their sequence. The case study
representative explained that this phase remained uncompleted and ran in parallel to the
modeling phase for some time. Due to the cross-organizational initiative, stakeholders of
organizations, which had already provided data, demanded to see prototypes while other
were still working on providing the data. However, the indication of a loop of these phases
included in the sCRISP-A was deemed sufficient to represent such eventual abnormal
behavior.
Regarding the modeling phase, the inclusion of the set-up task in the sCRISP-A was
endorsed. Prior to any modeling in the case study initiative, modes of communication
were created. Driven by the analysts, process diagrams of the analysis including input and
output as well as visualizations were created aiming at consumability of the results to the
users and reusability along different modeling techniques. Further, in cooperation with
stakeholders, the analytical performance indicators for the modeling phase were
specified. The benefits of setting up these communication products before applying
modeling techniques have been goal-orientation and a clearer benchmarking of progress.
For documentation purpose, modern git version-control applications have been suggested
by the case study representative since they were appropriate to the case study so far. The
use of agile project management methods was discussed and while these methods were
recommended as supportive, it was clearly explained that scrum sprints were not possible
due to other responsibilities of the team members of the initiative. The iterative
development of intermediate solutions was instead denoted as “rapid prototyping”.
However, this acknowledges the development of intermediate solutions which are
discussed with users and business experts to identify residuals to requirements, solutions
for issues and improvement potentials as already included in the sCRISP-A.
The tasks of the evaluation phase have been acknowledged in comprehension and
sequence by the case study representative. Thereby, the specifically emphasized user
orientation of the solution presentation in the sCRISP-A was endorsed by the case study
representative. As a comment on the solution presentation task, the presentation in the
described complexity was recommended to be elevated to an extensive workshop if all
237
described activities are supposed to be executed. It was further underlined that this might
be the last chance to discuss the solution, subsequent steps and learnings with all
stakeholders since it might be perceived as conclusion of the initiative even though the
deployment phase follows this phase. However, the phase only concludes the solution
development.
As for the evaluation phase, the tasks of the deployment phase have been evaluated based
on the professional experience of the case study representative and the experience with
the case study initiatives with a resulting anticipation of which tasks and actions would
be necessary. Since the case study initiative has not been concluded, this anticipation
format was necessary. The tasks, actions and their sequence in the sCRISP-A have been
acknowledged. It was discussed that a data collection on made decisions from an eventual
Analytics solution might be too complex to implement. In the case study initiative, this
would be certainly the case due to the cross-organizational nature.
Finally, the evaluation stage introduced in the sCRISP-A was endorsed by the case study
representative. While the idea of giving the responsibility of the solution to the users was
confusing in the beginning since they do not have the skills to perform monitoring and
maintenance, this confusion was resolved after the range of tasks and activities was
explained including the allocation of responsibilities to Analytics business units. Since
the case study initiative is focused on machine learning techniques, the explicit inclusion
of their re-training was suggested. Beyond that, no issues were raised.
Summarized, the sCRISP-A was acknowledged for comprehensiveness and appropriate
sequence of tasks. Proposed phases and tasks, which were not included in the original
CRISP-DM approach were endorsed for their relevance. After the adjustments resulting
from this case study-based examination have been applied to the sCRISP-A, it is
considered as validated.

238
239
8 Conclusion
This thesis has investigated the management of Supply Chain Analytics (SCA). For this
purpose, the thesis is structured by the five stage strategy execution process (SEP) by
Gamble et al. (2015). For stage 1 of the SEP, a vision, mission and values for this thesis
have been formulated. Resultingly, this thesis envisions a state of LSCM organizations
being enabled to achieve sustainable competitive advantage and continuous improvement
from SCA and aspires to contribute to provide guidance that leads LSCM organizations
towards this vision by conducting valid and reliable empirical research. For stage 2,
individual objectives to fulfill this mission were derived. These objectives are oriented on
the theory on structuring problems (TSP) from Simon (1973). The derived objectives
advance the creation of a structure of the “problem” of a LSCM organization achieving
to execute Analytics in the sense of the vision of this thesis. For stage 3, four research
designs have been developed to achieve the objectives. These research designs have been
realized by rigorous empirical research employing a diversity of research methods. Thus,
the following steps have been taken for each individual research design: elaboration of
extensive theoretical background related to the research objective, collection of data and
analysis of the data strictly adhering to methodological standards of an appropriate
research methodology, and interpretation and discussion of results. The execution of the
research designs is documented in four research articles, which form the body of this
thesis. The final 5th stage of the applied SEP demands evaluation and analysis of factors,
which suggest corrective adjustments. The evaluation is presented by the discussions on
trustworthiness, implications and limitations individually included in the four articles as
well as in the discussion on the scope of the thesis. Since the mission of this thesis is of
providing guidance, two measures have been chosen as corrective actions to convert the
results of the articles into guidance. First, several forms of value creation for customers
through SCA were discussed. Second, an approach to manage Analytics has been
developed by supplementing the popular CRISP-DM approach. The CRISP-DM
approach has been compared to 14 (mostly more recently published) approaches and the
insights on managing SCA generated in this thesis, supplemented accordingly, and
validated by a case study. These two measures of guidance stimulate use case
identification and design and execution of Analytics initiatives. This guidance is founded
on the established notion in this thesis of Analytics being a novel tool for organizations.
As such, it should be mindfully employed by comparing its potential to other tools in an
240
organization’s toolbox and its cost efficiency in solving the organizational problem. This
tool requires human expertise and creativity to identify valuable business problems and
design Analytics initiatives to develop valuable solution. Hence, the guidance provided
in this thesis emphasizes the importance of the individuals in organizations and their
contribution to Analytics. Resultingly, it supports the exploitation of this tool by
individuals to support individuals in their decisions and actions, because, as explained by
an interviewee, “when data insights and [professional] experience come together, that's
unbeatable”.
This section summarizes this thesis, presents limitations and gives an outlook on future
research. The thesis is concluded by this section.
8.1 Summary
The motivation of this thesis is based on theoretical and practical aspects of the
application of Analytics in the domain of LSCM. From a theoretical perspective, LSCM
is an eligible domain to use Analytics due to its complexity and uncertainty and the data-
intense decision-making. Technological and methodological advancements further make
the use of Analytics accessible to LSCM. Scholars have presented the impact of
exploiting SCA and the potential performance increases in LSCM processes due to
increased visibility and reduced costs. Further, competitive advantages have been argued
for the application of SCA in efficiency, innovativeness and quality. However, LSCM
organizations are unable to realize these benefits due to encountered barriers.
Practically, the application of SCA is motivated by a variety of reported efficiency gains
such as improved reaction time and increased product availability. Additionally,
organizations exploit new business potential in new business models or new revenue
streams. Central to LSCM, the customer orientation can be strengthened by improved
understanding of the customers’ needs and increased achieved satisfaction levels.
However, despite some organization gaining value from SCA, on average the LSCM
organizations show reluctance towards it and give it a low priority, since they considered
it as a “trend to pass by” or irrelevant to their business. Theoretical barriers and reluctance
result in unused potential of resource-saving efficiency and service quality as well as it
makes organizations vulnerable to new competitors in the market. This motivates this
thesis.
241
The theoretical background of this thesis aligns the terms Logistics and Supply Chain
Management, compares Analytics to Data Science, Big Data and Artificial Intelligence,
and provides an overview of different domains applying Analytics. Given the extensive
and clear similarities of the terms Logistics and Supply Chain Management and the lack
of value for this thesis in distinguishing the terms, they are fairly treated as one term.
LSCM represents the processes that enable the flow of materials and related assets,
information and funds from the initial supplier to the final customer by actions of
planning, controlling, executing and monitoring. It is ideally executed with holistic
thinking and customer orientation.
Comparing the analytical terms of contemporary most relevance for this thesis, they
overlap extensively but show nuances of individuality. Creating new terms for the
analytical field is rooted to some degree in an advertisement of advancements, while final
products and services sold under the newer terms may not necessarily incorporate the
advancements. The term Analytics has been chosen as central term for this thesis due to
its focus on management, while for the realm of management issues all terms are
considered as synonyms. Analytics represents evidence-based problem recognition and
solving within a business context, with evidence primarily referring to data. Regarding
the incorporation of analytical methods into business, it is the most mature term of the
compared terms. Due to its emergence during the domestication of analytical methods
from analytical experts to non-experts in organizations, it has a dense consideration of
management issues in the literature. In contrast, Big Data emerged with advancements in
database technology, Data Science arose from advanced analytical methods, and the
business popularity of AI follows from novel analytical solutions. These advancements
in technologies, methods and solutions have usually little focus on management.
To emphasize the influence of the domain on Analytics, the application of Analytics has
been presented for LSCM, marketing, healthcare, the public sector and sports. All fields
show different use cases, different objectives in the application of Analytics and barriers
arising from different characteristics of the domains. However, similarities are
recognizable and Analytics itself shows a transferability to a multitude of domains. In this
sense, while use cases may not be transferable with simple adaption of methods, the ideas
behind the use cases could be transferred to enabled additional potential.
The first article (“Mapping Domain characteristics influencing Analytics Initiatives - The
example of Supply Chain Analytics”) explores differences of applying Analytics in
242
LSCM as opposed to other domains. The research develops a framework mapping a
variety of potentially differentiating characteristics and influences among characteristics.
LSCM displays a stronger focus on efficiency, descriptive and prescriptive use cases, and
the use of mobile sensors. The domain is less knowledgeable on Analytics and the
lifecycle of Analytics initiatives creating an entry barrier. LSCM perceives unfavorable
conditions of less pressure by external forces to apply Analytics (e.g., regulations,
requirements of customers), and many use cases demanding cooperation across
organizational boundaries, which require a stronger persuasion for the potential of
Analytics. The article uses and rigorously adheres to the Grounded Theory methodology
building on twelve interviews. Its results contribute to later articles, the discussion on
creating value for customers and the approach to manage SCA initiatives.
The second article (“Archetypes of Supply Chain Analytics”) investigates the current
state of SCA. In this article, six archetypes of SCA initiatives have been developed and
labeled educating, observing, alerting, advancing, refining and investigating, with the
labels referring to core objectives of these archetypes. The archetypes are based on 46
secondary case studies of organizations applying Analytics to LSCM, which were
asymmetrically binary coded on 34 characteristics and hierarchically clustered with
Ward’s method. By interpretation of content similarities of case studies in the same
clusters and dissimilarities between clusters, the cluster labels and descriptions have been
developed representing archetypes of SCA. The results contribute extensively to the
discussion of the value SCA can create for customers and minorly to the supplemented
approach to manage SCA.
Article number three (“Explaining the Competitive Advantage generated from Analytics
with Knowledge-based view”) focusses on the condition of competitive advantage. It
creates a well-argued explanation of critical practices for Analytics in the context of
LSCM to create value – theoretical competitive advantage – from SCA. This article’s
results establish the problem-orientation of Analytics, the life-cycle view on Analytics
solutions, the essentiality of steady cross-functional cooperation, and the understanding
of Analytics as tool instead of a pillar of organizational culture (at least in LSCM), which
strongly shapes the guidance this thesis provides. The provided explanation is based on
the argumentation of the KBV for creating competitive advantage from integrating
knowledge in the value creation process and reported practices and processes to gain
value from Analytics. Derived testable propositions of Analytics best practices and their
243
reasoning for being best fitting the theoretical argumentation of competitive advantage of
the KBV have been tested with a multiple case study approach. Four case studies were
collected from LSCM organizations and four from organizations providing Analytics to
LSCM organizations. Thereby, each case study represented an individual experiment
rejecting or supporting each individual proposition, which were subsequently aggregated.
Compared to usual confirmatory research designs, this confirmatory design provided the
unusually extensive explanations and information necessary to understand the creation of
competitive advantage from Analytics. The results contributed extensively to the
supplemented approach to manage SCA initiatives and minorly to the discussion on value
for the customer.
Concluding the articles, the fourth article (“Overcoming Barriers in Supply Chain
Analytics”) explores measures LSCM organizations use to overcome barriers in SCA.
Core themes of barriers and measures are presented including the effect of barriers on
different phases of SCA initiatives and the impact of measures on barriers. Thereby, the
individual barriers are described as well as several specific examples of measures given,
while the research did not allow to implicate specific measures to overcome specific
barriers due to the dynamically changing nature of measures and the dependence of
effects on context and the development path. The measures provided are intended to
stimulate ideas. To identify barriers and measures and to derive core themes, 13 experts
in SCA were interviewed and data analysis was conducted based on a mixed methods
approach using Grounded Theory and the Q-Methodology. The results of this article
contributed extensively to the supplemented approach to manage SCA initiatives.
The value for customers from SCA was discussed based on data collected for the articles
as first form of guidance to LSCM managers. The value organizations create must be
distinguished in direct value for customers from LSCM organizations employing
Analytics solutions for them and indirect value for customers from Analytics solutions
focused on organizational improvements. LSCM organizations were identified to
contemporarily focus their time and resources primarily on the latter due to the beneficial
opportunities. Still, a non-exhaustive list of value for customers was presented supported
by examples. The presented types of indirect value are increased reliability, increased
service quality, and reduced costs. Direct types of value for the customer include
improved operational efficiency, reduced time and increased availability of products and
services.
244
Finally, as second form of guidance to LSCM managers an approach to manage SCA
initiatives is provided. Based on the popular CRISP-DM approach to manage Analytics
initiatives, a supplemented approach (sCRISP-A) was developed by incorporating
insights from investigating 14 additional approaches and all data collected for this thesis.
Due to the emphasis on transferability of Analytics in this thesis, the idea of creating a
novel and SCA specific approach was rejected. The resulting sCRISP-A consists of eight
phases with detailed tasks and actions to manage Analytics initiatives, in particular SCA
initiatives. It has a stronger focus of attention in a variety of aspects identified as relevant
and vital in this thesis compared to the CRISP-DM. The sCRISP-A provides guidance to
manage SCA initiatives.
8.2 Limitations
This thesis is subject to limitations as usual in scientific research. A variety of limitations
has been discussed in the body of this thesis already. As cumulative thesis, individual
sections on the limitations are included in the articles of this research (Section 3.5.3, 4.6.1,
5.5.3 and 6.5.2). In addition, aspects are discussed regarding the scope of this research
and the resulting validity for managers in section 7.1. The section reflects general
limitations to this thesis.
The insights of this thesis are limited to the applied methods. All chosen methods are
based on anecdotal evidence, which does not allow to quantify identified effects, the
impact of presented measures or benefits Analytics can provide to organizations. Except
for the explanatory case studies of article 3, the methods are exploratory in nature and
aspire to provide a vast understanding of the investigated unit of analysis. The explanatory
case studies are confirmatory and provide reasoning for confirmation and rejection
instead of numeric parameters. Since the objective of this thesis is the guidance of
managers, providing understanding and reasoning is understood as better fitting to the
objective as compared to quantified effects. In addition, research methods to quantify
effects require exploratory methods to previously identify these effects.
The form of insights of this thesis are limited by the focus of data collection. This thesis
has focused on objectives, processes, practices, motivation and similar forms of
phenomena. Thereby, the focus has excluded countable resource commitments such as
costs or physical resources as well as advantages such as return on investment, percentage
of quality improvement or time reduction in minutes. Considering the discussion above,
the intended small sample size on a variety of organizations would not have created

245
reliable measurements and these measurements would not have contributed to the
research objectives. However, considering the dynamically changing analytical methods,
tools and technologies, the wide range of maturity levels of organizations regarding them,
and the high context dependency of their impact, no resilient measurement can be
expected to be created. Further, to recapitulate the discussion on the scope of application
(section 7.1), the unwillingness to disclosure that was signaled by organization is unfitting
to the particularly high level of detail of such countable measurements.
With the examination of the theoretical background to the individual articles and the
design of the examination setups according to the chosen research methods, the
completeness of the relevant phenomenon and aspects of the unit of analysis was aimed
at. However, the completeness cannot be guaranteed. Considering the individual research
designs, theoretical background and examination set up could have missed causes outside
the cause categories inquired for article 1, relevant coding factors for article 2, rival
propositions for article 3 or barrier categories for article 4. To achieve completeness, the
examination of the theoretical background of either article has been extensive and goal-
oriented, and the methods were systematically and rigorously followed, as displayed by
the according sections in the articles.
All research designs have been executed such that bias is minimized. However, the
absence of bias cannot be guaranteed. Especially since two articles have been created
solely by one researcher and accordingly the method has been applied by this one
researcher alone, the individual bias of this researcher to the results has not been evaluated
extensively by other researchers. To ensure the minimization of bias, the trustworthiness
criteria of the chosen research methods have been investigated, the compliance to them
has been tracked and the taken measure the comply have been documented in the articles.
This thesis has a total sample size of 32 interviews with 34 experts plus 46 secondary case
studies. This amount is still representing a small sample size. Further, this sample size
draws data from several groups including manufacturers, LSPs, retailers and Analytics
providers. A larger sample size would increase confidence in the results and allow to
provide a clear distinction of the results in each group. As explained in section 7.1, the
sample size was limited to the response of experts and affected by perceived
unwillingness to respond. Additional effort to increase the sample size was taken as long
as additional observations promised compensating returns in insights, inspired or directly
following the criteria of saturation.
246
The individual research objectives of the articles of this thesis are based on the TSP
(Simon, 1973). As explained in section 1.2, this theory argues for several objectives
necessary to be fulfilled such that a problem is structured. Structuring the problem of
managing SCA would, in theory, allow managers to solve it in their individual
organizations. However, only a choice of necessary objectives has been pursued for this
thesis, since the resources to conduct this thesis have been limited. The choice was made
considering the relevance of objectives and based on the strong contextual connection of
the chosen objectives, which is illustrated in section 1.4.
All things considered, the results and created insights of this thesis are valid and reliable
despite the limitations. The individual research objectives of the articles have been
fulfilled, creating valuable insights on various aspects of managing SCA. Under
additional consideration of further sources on managing Analytics initiatives, guidance
to create value for customers with SCA and to manage SCA initiatives have been
developed from the insights. Thus. a contribution to guidance of managers of LSCM
organization in the beneficial application of Analytics to their organizations has been
created, fulfilling the overall research objective of this thesis.
8.3 Future Research
This thesis calls for further research. Based on reoccurring issues of managers to motivate
budget for their Analytics initiatives due to the uncertainty of the created value, research
on estimating the impact is beneficial to managers. This thesis has established to evaluate
the value from Analytics solutions based on the effects in the supported process and
additionally the indirect effects from the supported decisions in the process. A method to
operationalize this approach should be developed. Furthermore, different starting
positions of Analytics initiatives and the resulting uncertainty of value need to be
categorized and specific recommendations need to be developed. Regarding the TSP
(Simon, 1973), this addresses a minor and detailed characteristic required to define to
structure the problem of managing SCA.
Altogether, the remaining characteristics required to define to structure the problem of
managing SCA according to the TSP are differences of states in the problem space, tests
of these differences and the connection of operators (measures to overcome barriers in
this thesis) to reduce or remove the differences. On a broader level, this would be
represented by a SCA maturity model, which links measures to maturity stages. This
investigation requires a different perspective on measures as compared to the perspective
247
this thesis has assumed, since measures to advance in Analytics are specifically inquired.
With a potential to identify further beneficial measures and practices to manage SCA,
such an investigation represents valuable research.
More practically, further research is required in areas in which LSCM organizations
display reluctance. In the evidence, the contemporary focus was identified to be on
internal improvements from Analytics. Thus, research that creates motivation for the
development of customer facing Analytics solutions could benefit LSCM organizations.
In an affirmative and supporting effort, motivation could be created with novel methods
to evaluate the impact of customer facing Analytics solutions developed by scientific
research. In contrast, an investigation of the degrading competitive position of LSCM
organizations in market areas absorbed by innovative digital business models based on
customer facing Analytics solution could be conducted, representing a more intimidating
form of motivation for investments in customer facing Analytics solutions.
Finally, while physical LSCM processes usually cross organizational boundaries,
cooperation on Analytics use cases crossing organizational boundaries are rare. Mistrust
and protectionism prohibit the development for holistically beneficial Analytics solutions
to the Supply Chain or even the exchange of data beyond forecasts. Further, from the
exchange of incorrect data due to carelessness to the exchange of fraudulent data to
improve the individual position, the evidence of this thesis has captured a variety of
unfavorable behavior even if data exchange agreements are in place. Thus, research is
needed to estimate and show the effects of such behavior and provide scientifically sound
evidence to stimulate more cooperative behavior of Supply Chain actors to enable more
efficient, reliable and customer-oriented Supply Chains driven by Analytics.
248
References
Acito, F. and Khatri, V. (2014), “Business analytics: Why now and what next?”, Business
Horizons, “Kelley School of Business, Indiana University”, Vol. 57 No. 5, pp. 565–
570.
Agarwal, R. and Dhar, V. (2014), “Big Data, Data Science, and Analytics: The
Opportunity and Challenge for IS Research”, Information Systems Research, Vol.
25 No. 3, pp. 443–448.
Akerkar, R. (2019), “Artificial Intelligence for Business”.
Akter, S., Wamba, S.F., Gunasekaran, A., Dubey, R. and Childe, S.J. (2016), “How to
improve firm performance using big data analytics capability and business strategy
alignment?”, International Journal of Production Economics, Elsevier, Vol. 182, pp.
113–131.
Alavi, M. and Leidner, D.E. (2001), “Review: Knowledge Management and Knowledge
Management Systems: Conceptual Foundations and Research Issues”, MIS
Quarterly, Vol. 25 No. 1, p. 107.
Alles, B.Y.D. and Burshek, J. (2016), Ranking Analytics Maturity by Industry.
Alpaydin, E. (2016), “Machine learning : the new AI”, MIT Press.
Ambe, I.M. (2013), “Key Indicators For Optimising Supply Chain Performance: The
Case Of Light Vehicle Manufacturers In South Africa”, Journal of Applied Business
Research (JABR), Vol. 30 No. 1, pp. 277–290.
Amin, Z. (2000), “Q methodology - A journey into the subjectivity of human mind”,
Singapore Medical Journal, Vol. 41 No. 8, pp. 410–414.
Amit, R. and Schoemaker, P.J.H. (1993), “Strategic assets and organizational rent”,
Strategic Management Journal, Vol. 14 No. 1, pp. 33–46.
Anant Gupta. (2014), “Making Big Data Something More than the ‘Next Big Thing’”, in
Bilbao-Osorio, B., Dutta, S. and Lanvin, B. (Eds.), The Global Information
Technology Report 2014 - Rewards and Risks of Big Data, World Economic Forum,
Geneva, pp. 87–93.
APICS. (2015), Exploring the Big Data Revolution.
Bange, C., Bloemen, J., Derwisch, S., Fuchs, C., Grosser, T., Iffert, L., Janoschek, N., et
al. (2017), BI Trend Monitor 2018.
Bange, C., Grosser, T. and Janoschek, N. (2015), Big Data Use Cases 2015 - Getting Real
on Data Monetization.
Banks, G.C., Pollack, J.M., Bochantin, J.E., Kirkman, B.L., Whelpley, C.E. and O’Boyle,
E.H. (2016), “Management’s science-practice gap: A grand challenge for all
stakeholders”, Academy of Management Journal, Vol. 59 No. 6, pp. 2205–2231.
Barney, J.B. (1986), “Strategic Factor Markets: Expectations, Luck, and Business
Strategy”, Management Science, Vol. 32 No. 10, pp. 1231–1241.
Barney, J.B. (1991), “Firm Resources and Sustained Competitive Advantage”, Journal of
Management, Vol. 17 No. 1, pp. 99–120.

249
Barton, D. and Court, D. (2012), “Making advanced analytics work for you.”, Harvard
Business Review, Vol. 90 No. 10, pp. 78–83.
Baumgarten, H. (1980), Logistik im Unternehmen : Schwachstellen, Lösungen,
Perspektiven, Technische Universität Berlin, Berlin.
Baumgarten, H. and Walter, S. (2001), Trends Und Strategien in Der Logistik 2000+:
Eine Untersuchung Der Logistik in Industrie, Handel, Logistik-Dienstleistung Und
Anderen Dienstleistungsunternehmen, Technische Universität Berlin, Berlin.
Bedeley, R.T., Ghoshal, T., Iyer, L.S. and Bhadury, J. (2018), “Business Analytics and
Organizational Value Chains: A Relational Mapping”, Journal of Computer
Information Systems, Vol. 58 No. 2, pp. 151–161.
Beer, D. (2018), “Envisioning the power of data analytics”, Information, Communication
& Society, Vol. 21 No. 3, pp. 465–479.
Belle, A., Thiagarajan, R., Soroushmehr, S.M.R., Navidi, F., Beard, D.A. and Najarian,
K. (2015), “Big Data Analytics in Healthcare”, BioMed Research International, Vol.
2015, pp. 1–16.
Bizer, C., Boncz, P., Brodie, M.L. and Erling, O. (2012), “The meaningful use of big
data”, ACM SIGMOD Record, Vol. 40 No. 4, p. 56.
Blackburn, R., Kallrath, J. and Klosterhalfen, S.T. (2015), “Operations research in
BASF’s supply chain operations”, International Transactions in Operational
Research, Vol. 22 No. 3, pp. 385–405.
Bode, C., Hübner, D. and Wagner, S.M. (2014), “Managing Financially Distressed
Suppliers: An Exploratory Study”, Journal of Supply Chain Management, Vol. 50
No. 4, pp. 24–43.
Bode, C. and Wagner, S.M. (2015), “Structural drivers of upstream supply chain
complexity and the frequency of supply chain disruptions”, Journal of Operations
Management, Vol. 36 No. 1, pp. 215–228.
Boden, M.A. (2016), AI : Its Nature and Future, Oxford University Press, Oxford.
Bose, R. (2009), “Advanced analytics: opportunities and challenges”, Industrial
Management & Data Systems, Vol. 109 No. 2, pp. 155–172.
Bowersox, D.J., Closs, D.J. and Cooper, M.B. (2007), Supply Chain Logistics
Management, McGraw-Hill/Irwin, Boston, MA.
Bradley, E. (2016), Reliability Engineering: A Life Cycle Approach, CRC Press, Boca
Raton, FL.
Brinch, M., Stentoft, J., Jensen, J.K. and Rajkumar, C. (2018), “Practitioners
understanding of big data and its applications in supply chain management”, The
International Journal of Logistics Management, Vol. 29 No. 2, pp. 555–574.
Brown, M. (2004), “Illuminating Patterns of Perception: An Overview of Q
Methodology”, Methodology, No. October, pp. 1–21.
Brynjolfsson, E. (1993), “The productivity paradox of information technology”,
Communications of the ACM, Vol. 36 No. 12, pp. 66–77.

250
Buttermann, G., Germain, R. and Iyer, K.N.S. (2008), “Contingency theory ‘fit’ as
gestalt: An application to supply chain management”, Transportation Research Part
E: Logistics and Transportation Review, Vol. 44 No. 6, pp. 955–969.
Cady, F. (2017), The Data Science Handbook.
Canonico, P., De Nito, E. and Mangia, G. (2012), “Control mechanisms and knowledge
integration in exploitative project teams: a case study from the coal fired power plant
industry”, edited by Schiuma, G.Journal of Knowledge Management, Vol. 16 No. 4,
pp. 538–549.
Cao, G. and Duan, Y. (2017), “How do top- and bottom-performing companies differ in
using business analytics?”, Journal of Enterprise Information Management, Vol. 30
No. 6, pp. 874–892.
Cao, G., Duan, Y. and Li, G. (2015), “Linking Business Analytics to Decision Making
Effectiveness: A Path Model Analysis”, IEEE Transactions on Engineering
Management, Vol. 62 No. 3, pp. 384–395.
Carillo, K.D.A. (2017), “Let’s stop trying to be ‘sexy’ – preparing managers for the (big)
data-driven business era”, Business Process Management Journal, Vol. 23 No. 3,
pp. 598–622.
Caya, O. and Bourdon, A. (2016), “A Framework of Value Creation from Business
Intelligence and Analytics in Competitive Sports”, 2016 49th Hawaii International
Conference on System Sciences (HICSS), Vol. 2016-March, IEEE, pp. 1061–1071.
Chae, B. (Kevin), Olson, D. and Sheu, C. (2014), “The impact of supply chain analytics
on operational performance: a resource-based view”, International Journal of
Production Research, Vol. 52 No. 16, pp. 4695–4710.
Chae, B. (Kevin), Yang, C., Olson, D. and Sheu, C. (2014), “The impact of advanced
analytics and data accuracy on operational performance: A contingent resource
based theory (RBT) perspective”, Decision Support Systems, Elsevier B.V., Vol. 59
No. 1, pp. 119–126.
Chan, F.T.S. (2003), “Performance Measurement in a Supply Chain”, The International
Journal of Advanced Manufacturing Technology, Vol. 21 No. 7, pp. 534–548.
Chapman, P., Clinton, J., Kerber, R., Khabaza, T., Reinartz, T., Shearer, C. and Wirth, R.
(2000), CRISP-DM 1.0 Step-by-Step Data Mining Guide.
Chavez, R., Yu, W., Jacobs, M.A. and Feng, M. (2017), “Data-driven supply chains,
manufacturing capability and customer satisfaction”, Production Planning &
Control, Taylor & Francis, Vol. 28 No. 11–12, pp. 906–918.
Chen, H., Chiang, R.H.L. and Storey, V.C. (2012), “Business intelligence and analytics:
from big data to big impact”, MIS Quarterly, New York, NY, Vol. 36 No. 4, pp.
1165–1188.
Chiang, R.H.L., Goes, P. and Stohr, E.A. (2012), “Business Intelligence and Analytics
Education, and Program Development”, ACM Transactions on Management
Information Systems, Vol. 3 No. 3, pp. 1–13.
Choo, A.S., Nag, R. and Xia, Y. (2015), “The role of executive problem solving in
knowledge accumulation and manufacturing improvements”, Journal of Operations
251
Management, Vol. 36, pp. 63–74.
Chopra, S. and Meindl, P. (2016), Supply Chain Management: Strategy, Planning, and
Operation.
Christopher, M. (2011), “Logistics & supply chain management”, Financial Times
Prentice Hall, Harlow, UK.
Chung, G., Gesing, B., Chaturvedi, K. and Bodenbrenner, P. (2018), DHL Logistics Trend
Radar.
Cohen, J. (1960), “A Coefficient of Agreement for Nominal Scales”, Educational and
Psychological Measurement, Vol. 20 No. 1, pp. 37–46.
Conner, K.R. and Prahalad, C.K. (1996), “A Resource-Based Theory of the Firm:
Knowledge Versus Opportunism”, Organization Science, Vol. 7 No. 5, pp. 477–501.
Copeland, E. (2015), Big Data in the Big Apple: The Lessons London Can Learn from
New York’s Data-Driven Approach to Smart Cities, New York, NY.
Cui, M. and Pan, S.L. (2015), “Developing focal capabilities for e-commerce adoption:
A resource orchestration perspective”, Information & Management, Elsevier B.V.,
Vol. 52 No. 2, pp. 200–209.
Daniell, K.A., Morton, A. and Ríos Insua, D. (2016), “Policy analysis and policy
analytics”, Annals of Operations Research, Springer US, Vol. 236 No. 1, pp. 1–13.
Das, S. (2014), Computational Business Analytics, CRC Press, Boca Raton, FL.
Davenport, T.H. (2009), Realizing the Potential of Retail Analytics - Plenty of Food for
Those with the Appetite, Babson Park, MA.
Davenport, T.H. (2013), “Analytics 3.0”, Harvard Business Review, Vol. 91 No. 12, pp.
64–72.
Davenport, T.H. (2014a), “It’s Already Time to Kill the ‘Data Scientist’ Title”, The Wall
Street Journal, available at: http://on.wsj.com/1ful9gW (accessed 23 January 2019).
Davenport, T.H. (2014b), “What Businesses Can Learn From Sports Analytics.”, MIT
Sloan Management Review, pp. 10–14.
Davenport, T.H., Harris, J. and Morison, R. (2010), Analytics at Work, Harvard Business
School Publishing Corporation, Boston, MA.
Davenport, T.H. and Harris, J.G. (2007), Competing on Analytics: The New Science of
Winning, Harvard Business School Press, Boston, MA, available
at:https://doi.org/10.1225/3323.
Davenport, T.H. and Harris, J.G. (2017), Competing on Analytics : The New Science of
Winning, 2nd Ed., Harvard Business School Press, Boston, MA.
Davenport, T.H., Harris, J.G., De Long, D.W. and Jacobson, A.L. (2001), “Data to
Knowledge to Results”, California Management Review, Vol. 43 No. 2, p. 117.
Davenport, T.H. and Patil, D.J. (2012), “"Data scientist: the sexiest job of the 21st
century.”, Harvard Business Review, Vol. 90 No. 10, pp. 70–77.
Davenport, T.H. and Ronanki, R. (2018), “Artificial Intelligence for the Real World”,
252
Harvard Business Review, Vol. 96 No. 1, pp. 108–116.
Debortoli, S., Müller, O. and vom Brocke, J. (2014), “Comparing Business Intelligence
and Big Data Skills”, Business & Information Systems Engineering, Vol. 6 No. 5,
pp. 289–300.
Demsetz, H. (1988), “The Theory of the Firm Revisited”, Journal of Law, Economics,
and Organization, Vol. 4 No. 1, pp. 141–161.
Denk, N., Kaufmann, L. and Carter, C.R. (2012), “Increasing the rigor of grounded theory
research – a review of the SCM literature”, International Journal of Physical
Distribution & Logistics Management, Vol. 42 No. 8/9, pp. 742–763.
Desouza, K.C. and Jacob, B. (2017), “Big Data in the Public Sector: Lessons for
Practitioners and Scholars”, Administration & Society, Vol. 49 No. 7, pp. 1043–
1064.
Dhar, V. (2013), “Data science and prediction”, Communications of the ACM, Vol. 56
No. 12, pp. 64–73.
Díaz, A., Rowshankish, K. and Saleh, T. (2018), “Why data culture matters.”, McKinsey
Quarterly, Vol. 3 No. 1, pp. 36–53.
Dichter, A., Rothkopf, M., Bauer, F., Bäumi, M. and Rösch, M. (2018), Travel and
Logistics: Data Drives the Race for Customers.
Dietrich, D., Heller, B. and Yang, B. (2015), Data Science & Big Data Analytics :
Discovering, Analyzing, Visualizing and Presenting Data, John Wiley & Sons,
Indianapolis, Ind.
Dittfeld, H., Scholten, K. and Van Donk, D.P. (2018), “Burden or blessing in disguise:
interactions in supply chain complexity”, International Journal of Operations &
Production Management, Vol. 38 No. 2, pp. 314–332.
Dunn, J.C. (1973), “A Fuzzy Relative of the ISODATA Process and Its Use in Detecting
Compact Well-Separated Clusters”, Journal of Cybernetics, Taylor & Francis, Vol.
3 No. 3, pp. 32–57.
Dutta, D. and Bose, I. (2015), “Managing a big data project: The case of Ramco cements
limited”, International Journal of Production Economics, Elsevier, Vol. 165, pp.
293–306.
Dyer, J.H. and Singh, H. (1998), “The Relational View: Cooperative Strategy and Sources
of Interorganizational Competitive Advantage”, The Academy of Management
Review, Vol. 23 No. 4, p. 660.
Eisenhardt, K.M. (1989), “Building theories from case study research”, Academy of
Management Review, Academy of Management Briarcliff Manor, NY 10510, Vol.
14 No. 4, pp. 532–550.
Ellingsen, I.T., Størksen, I. and Stephens, P. (2010), “Q methodology in social work
research”, International Journal of Social Research Methodology, Vol. 13 No. 5, pp.
395–409.
Erwin, T., Heidkamp, P. and Pols, A. (2016), Mit Daten Werte Schaffen 2016.
Faith, D.P. (1983), “Asymmetric binary similarity measures”, Oecologia, Vol. 57 No. 3,
253
pp. 287–290.
Fang, H. (2015), “Managing data lakes in big data era: What’s a data lake and why has it
became popular in data management ecosystem”, 2015 IEEE International
Conference on Cyber Technology in Automation, Control, and Intelligent Systems,
pp. 820–824.
Fawcett, S.E., Waller, M.A., Miller, J.W., Schwieterman, M.A., Hazen, B.T. and
Overstreet, R.E. (2014), “A Trail Guide to Publishing Success: Tips on Writing
Influential Conceptual, Qualitative, and Survey Research”, Journal of Business
Logistics, Vol. 35 No. 1, pp. 1–16.
Fayyad, U., Piatetsky-Shapiro, G. and Smyth, P. (1996), “From Data Mining to
Knowledge Discovery in Databases”, AI Magazine, Vol. 17 No. 3, pp. 37–54.
Fiol, C.M. and O’Connor, E.J. (2003), “Waking up! Mindfulness in the Face of
Bandwagons”, The Academy of Management Review, Vol. 28 No. 1, p. 54.
Flint, D.J., Woodruff, R.B. and Gardial, S.F. (2002), “Exploring the Phenomenon of
Customers’ Desired Value Change in a Business-to-Business Context”, Journal of
Marketing, Vol. 66 No. 4, pp. 102–117.
Flynn, B.B., Huo, B. and Zhao, X. (2010), “The impact of supply chain integration on
performance: A contingency and configuration approach”, Journal of Operations
Management, Vol. 28 No. 1, pp. 58–71.
Fosso Wamba, S., Akter, S., Edwards, A., Chopin, G. and Gnanzou, D. (2015), “How
‘big data’ can make big impact: Findings from a systematic review and a longitudinal
case study”, International Journal of Production Economics, Elsevier, Vol. 165, pp.
234–246.
Franks, B. (2014), The Analytics Revolution: How to Improve Your Business by Making
Analytics Operational in the Big Data Era, John Wiley & Sons, New York, NY.
Fredriksson, C., Mubarak, F., Tuohimaa, M. and Zhan, M. (2017), “Big Data in the Public
Sector : A Systematic Literature Review”, Scandinavian Journal of Public
Administration, Vol. 21 No. 3, pp. 39–61.
FreshMinds. (2015), Big & Fast Data: The Rise of Insight-Driven Business.
Galbraith, J.R. (1973), Designing Complex Organizations, Organization Development,
Addison-Wesley, Upper Saddle River, NJ, available
at:https://doi.org/10.2307/248839.
Gamage, P. (2016), “New development: Leveraging ‘big data’ analytics in the public
sector”, Public Money & Management, Vol. 36 No. 5, pp. 385–390.
Gamble, J., Thompson, A.A. and Peteraf, M.A. (2015), Essentials of Strategic
Management : The Quest for Competitive Advantage, 4th Ed., McGraw-Hill
Education, New York, NY.
Gandomi, A. and Haider, M. (2015), “Beyond the hype: Big data concepts, methods, and
analytics”, International Journal of Information Management, Elsevier Ltd, Vol. 35
No. 2, pp. 137–144.
Garner, H. and Kirkwood, A. (2017), 2017 Global Logistics Report.
254
Gavetti, G. and Levinthal, D. (2000), “Looking Forward and Looking Backward:
Cognitive and Experiential Search”, Administrative Science Quarterly, Vol. 45 No.
1, p. 113.
Germann, F., Lilien, G.L. and Rangaswamy, A. (2013), “Performance implications of
deploying marketing analytics”, International Journal of Research in Marketing,
Elsevier B.V., Vol. 30 No. 2, pp. 114–128.
Gerring, J. and Cojocaru, L. (2016), “Selecting Cases for Intensive Analysis”,
Sociological Methods & Research, Vol. 45 No. 3, pp. 392–423.
Ghasemaghaei, M., Hassanein, K. and Turel, O. (2017), “Increasing firm agility through
the use of data analytics: The role of fit”, Decision Support Systems, Vol. 101, pp.
95–105.
Gligor, D.M. and Autry, C.W. (2012), “The role of personal relationships in facilitating
supply chain communications: a qualitative study”, Journal of Supply Chain
Management, Vol. 48 No. 1, pp. 24–43.
Glöckner, M., Ludwig, A. and Franczyk, B. (2017), “Go with the Flow - Design of Cloud
Logistics Service Blueprints”, Proceedings of the 50th Hawaii International
Conference on System Sciences (2017), pp. 5058–5067.
Gower, J.C. (1971), “A General Coefficient of Similarity and Some of Its Properties”,
Biometrics, Vol. 27 No. 4, pp. 857–871.
Grant, R.M. (1996a), “Toward a knowledge-based theory of the firm”, Strategic
Management Journal, Vol. 17, pp. 109–122.
Grant, R.M. (1996b), “Prospering in Dynamically-competitive Environments:
Organizational Capability as Knowledge Integration”, Organization Science, Vol. 7
No. 4, p. 13.
Grossman, R.L. and Siegel, K.P. (2014), “Organizational Models for Big Data and
Analytics”, Journal of Organization Design, Vol. 3 No. 1, p. 20.
Gudehus, T. (2012), Logistik. 1, Grundlagen, Verfahren und Strategien, 4th Ed.
Gudmundsson, J. and Horton, M. (2017), “Spatio-Temporal Analysis of Team Sports”,
ACM Computing Surveys, Vol. 50 No. 2, pp. 1–34.
Guerra, P. and Borne, K. (2016), Ten Signs of Data Science Maturity, O’Reilly Media,
Sebastopol, CA.
Gunasekaran, A., Patel, C. and McGaughey, R.E. (2004), “A framework for supply chain
performance measurement”, International Journal of Production Economics, Vol.
87 No. 3, pp. 333–347.
Gupta, M. and George, J.F. (2016), “Toward the development of a big data analytics
capability”, Information & Management, Elsevier B.V., Vol. 53 No. 8, pp. 1049–
1064.
Hahn, G.J. and Packowski, J. (2015), “A perspective on applications of in-memory
analytics in supply chain management”, Decision Support Systems, Elsevier B.V.,
Vol. 76, pp. 45–52.
Hair, J.F., Black, W.C., Babin, B.J. and Anderson, R.E. (2010), Multivariate Data

255
Analysis, Pearson Prentice Hall, Upper Saddle River, NJ.
Hamming, R.W. (1962), Numerical Methods for Scientists and Engineers, Internat.,
McGraw-Hill, New York, NY.
Harris, J., Craig, E. and Egan, H. (2010), “How successful organizations strategically
manage their analytic talent”, Strategy & Leadership, Vol. 38 No. 3, pp. 15–22.
Harris, J.G. and Craig, E. (2011), “Developing analytical leadership”, Strategic HR
Review, Vol. 11 No. 1, pp. 25–30.
Hayes, J. (2018), The Theory and Practice of Change Management, 5th Ed., Palgrave
Macmillan UK, London, available at:https://doi.org/9921742347402884.
Hazen, B.T., Boone, C.A., Ezell, J.D. and Jones-Farmer, L.A. (2014), “Data quality for
data science, predictive analytics, and big data in supply chain management: An
introduction to the problem and suggestions for research and applications”,
International Journal of Production Economics, Elsevier, Vol. 154, pp. 72–80.
Hazen, B.T., Weigel, F.K., Ezell, J.D., Boehmke, B.C. and Bradley, R. V. (2017),
“Toward understanding outcomes associated with data quality improvement”,
International Journal of Production Economics, Elsevier Ltd, Vol. 193 No. July, pp.
737–747.
Heckmann, I., Comes, T. and Nickel, S. (2015), “A critical review on supply chain risk –
Definition, measure and modeling”, Omega, Vol. 52, pp. 119–132.
Henke, N., Bughin, J., Chui, M., Manyika, J., Saleh, T., Wiseman, B. and Sethupathy, G.
(2016), “The Age of Analytics : Competing in a Data-Driven World”, McKinsey
Global Institute, Vol. 12 No. January, available
at:https://doi.org/10.1111/bjet.12230.
Herden, T.T. and Bunzel, S. (2018), “Archetypes of Supply Chain Analytics Initiatives—
An Exploratory Study”, Logistics, Multidisciplinary Digital Publishing Institute,
Vol. 2 No. 2, pp. 1–20.
Heugens, P.P.M. a R., van Riel, C.B.M. and van den Bosch, F.A.J. (2004), “Reputation
Management Capabilities as Decision Rules”, Journal of Management Studies, Vol.
41 No. 8, pp. 1349–1377.
Hillier, F.S. and Lieberman, G.J. (2015), Introduction to Operations Research, 10th Ed.,
McGraw-Hill Education, New York, NY.
Hirschman, E.C. (1986), “Humanistic Inquiry in Marketing Research: Philosophy,
Method, and Criteria”, Journal of Marketing Research, Vol. 23 No. 3, pp. 237–249.
Holsapple, C., Lee-Post, A. and Pakath, R. (2014), “A unified foundation for business
analytics”, Decision Support Systems, Vol. 64, pp. 130–141.
Hopkins, J. and Hawking, P. (2018), “Big Data Analytics and IoT in logistics: a case
study”, The International Journal of Logistics Management, Vol. 29 No. 2, pp. 575–
591.
Hsieh, C., Nickerson, J.A. and Zenger, T.R. (2007), “Opportunity Discovery, Problem
Solving and a Theory of the Entrepreneurial Firm”, Journal of Management Studies,
Vol. 44 No. 7, pp. 1255–1277.
256
Hugos, M. (2011), Essentials of Supply Chain Management, Wiley, Hoboken, N.J.
Hurnonen, S., Ritala, P. and Ellonen, H.-K. (2016), “The Role of Knowledge-Integration
Practices in Service Innovation Projects”, International Journal of Innovation
Management, Vol. 20 No. 01, p. 1650007.
Hutchins, B. (2016), “Tales of the digital sublime”, Convergence: The International
Journal of Research into New Media Technologies, Vol. 22 No. 5, pp. 494–509.
INFORMS. (2014), Certified Analytics Professional Candidate Handbook, INFORMS,
Catonsville, MD.
Ittoo, A., Nguyen, L.M. and van den Bosch, A. (2016), “Text analytics in industry:
Challenges, desiderata and trends”, Computers in Industry, Elsevier B.V., Vol. 78,
pp. 96–107.
Janssen, M., van der Voort, H. and Wahyudi, A. (2017), “Factors influencing big data
decision-making quality”, Journal of Business Research, Elsevier Inc., Vol. 70, pp.
338–345.
Jeppesen, L.B. and Lakhani, K.R. (2010), “Marginality and Problem-Solving
Effectiveness in Broadcast Search”, Organization Science, Vol. 21 No. 5, pp. 1016–
1033.
Jeske, M., Grüner, M. and Weiß, F. (2013), Big Data in Logistics, DHL Customer
Solutions & Innovation, Troisdorf.
Johnson, E. and Cole, Z. (2016), You Can’t Manage What You Can’t Measure: Supply
Chain Analytics Benchmark Study.
Kache, F. and Seuring, S. (2017), “Challenges and opportunities of digital information at
the intersection of Big Data Analytics and supply chain management”, International
Journal of Operations & Production Management, Vol. 37 No. 1, pp. 10–36.
Kambatla, K., Kollias, G., Kumar, V. and Grama, A. (2014), “Trends in big data
analytics”, Journal of Parallel and Distributed Computing, Vol. 74 No. 7, pp. 2561–
2573.
Kaufman, L. and Rousseeuw, P.J. (2005), Finding Groups in Data: An Introduction to
Cluster Analysis, John Wiley & Sons, Hoboken, NJ.
Kaufmann, L., Carter, C.R. and Buhrmann, C. (2010), “Debiasing the supplier selection
decision: a taxonomy and conceptualization”, International Journal of Physical
Distribution & Logistics Management, Vol. 40 No. 10, pp. 792–821.
Kaufmann, L. and Denk, N. (2011), “How to demonstrate rigor when presenting
grounded theory research in the supply chain management literature”, Journal of
Supply Chain Management, Vol. 47 No. 4, pp. 64–72.
Keen, A. (2012), “Battle lines drawn as data becomes oil of digital age”, CNN, available
at: http://edition.cnn.com/2012/01/25/opinion/keen-technology-data/ (accessed 6
May 2018).
Kelleher, J.D. and Tierney, B. (2018), Data Science, MIT Press, Cambridge, MA.
Kenett, R.S. (2015), “Statistics: A Life Cycle View”, Quality Engineering, Vol. 27 No.
1, pp. 111–121.
257
Kersten, W., Seiter, M., von See, B., Hackius, N. and Maurer, T. (2017), Trends Und
Strategien in Logistik Und Supply Chain Management–Chancen Der Digitalen
Transformation., Bremen.
Kiron, D., Prentice, P.K. and Ferguson, R.B. (2014), “Raising the Bar With Analytics”,
MIT Sloan Management Review, Vol. 55 No. 2, pp. 28–33.
Kiron, D., Shockley, R., Kruschwitz, N., Finch, G. and Haydock, M. (2012), “Analytics:
The Widening Divide”, MIT Sloan Management Review, Vol. 53 No. 2, pp. 1–23.
Klievink, B., Romijn, B.-J., Cunningham, S. and de Bruijn, H. (2017), “Big data in the
public sector: Uncertainties and readiness”, Information Systems Frontiers,
Information Systems Frontiers, Vol. 19 No. 2, pp. 267–283.
Kogut, B. and Zander, U. (1992), “Knowledge of the Firm, Combinative Capabilities, and
the Replication of Technology”, Organization Science, Vol. 3 No. 3, pp. 383–397.
Kohn, M.S., Sun, J., Knoop, S., Shabo, A., Carmeli, B., Sow, D. and Rapp, W. (2014),
“IBM ’ s Health Analytics and Clinical Decision Support”, Yearbook of Medical
Informatics, Vol. 9 No. 1, pp. 154–162.
Kopfer, H. and Bierwirth, C. (2003), “Grundlagen der Systemorientierung”, in
Baumgarten, H., Wiendahl, H.-P. and Zentes, J. (Eds.), Logistik-Management:
Strategien-Konzepte-Praxisbeispiele, Springer, Berlin, p. 4.01.01.
Kvale, S. (1983), “The Qualitative Research Interview: A Phenomenological and a
Hermeneutical Mode of Understanding”, Journal of Phenomenological Psychology,
Vol. 14 No. 2, pp. 171–197.
Lai, Y., Sun, H. and Ren, J. (2018), “Understanding the determinants of big data analytics
(BDA) adoption in logistics and supply chain management”, The International
Journal of Logistics Management, Vol. 29 No. 2, pp. 676–703.
Landis, J.R. and Koch, G.G. (1977), “The Measurement of Observer Agreement for
Categorical Data”, Biometrics, Vol. 33 No. 1, p. 159.
Laney, D. (2001), 3D Data Management: Controlling Data Volume, Velocity, and
Variety, META Group.
Larson, D. and Chang, V. (2016), “A review and future direction of agile, business
intelligence, analytics and data science”, International Journal of Information
Management, Elsevier Ltd, Vol. 36 No. 5, pp. 700–710.
Larson, P.D. and Halldorsson, A. (2004), “Logistics versus supply chain management:
An international survey”, International Journal of Logistics Research and
Applications, Vol. 7 No. 1, pp. 17–31.
LaValle, S., Hopkins, M.S., Lesser, E., Shockley, R. and Kruschwitz, N. (2010),
“Analytics: The New Path to Value”, MIT Sloan Management Review, pp. 1–24.
Lavalle, S., Lesser, E., Shockley, R., Hopkins, M.S. and Kruschwitz, N. (2011), “Big
Data, Analytics and the Path From Insights to Value”, MIT Sloan Management
Review, Vol. 52 No. 2, pp. 21–32.
Leeflang, P.S.H., Verhoef, P.C., Dahlström, P. and Freundt, T. (2014), “Challenges and
solutions for marketing in a digital era”, European Management Journal, Elsevier
Ltd, Vol. 32 No. 1, pp. 1–12.

258
de Leeuw, S., Minguela-Rata, B., Sabet, E., Boter, J. and Sigurðardóttir, R. (2016),
“Trade-offs in managing commercial consumer returns for online apparel retail”,
International Journal of Operations & Production Management, Vol. 36 No. 6, pp.
710–731.
Leventhal, B. (2015), “All Models are Wrong but Some are Useful: the Use of Predictive
Analytics in Direct Marketing”, Quality Technology & Quantitative Management,
Vol. 12 No. 1, pp. 93–104.
Lewis, M., Brandon‐Jones, A., Slack, N. and Howard, M. (2010), “Competing through
operations and supply”, International Journal of Operations & Production
Management, Vol. 30 No. 10, pp. 1032–1058.
Liberatore, M.J. and Luo, W. (2010), “The Analytics Movement: Implications for
Operations Research”, Interfaces, Vol. 40 No. 4, pp. 313–324.
Lincoln, Y.S. and Guba, E.G. (1985), “Establishing trustworthiness”, Naturalistic
Inquiry, No. 289, pp. 289–331.
Ludwig, A. (2014), “Engineering und Management kundenindividueller Logistikdienste
nach dem Cloud-Prinzip”, Wirtschaftsinformatik & Management, Vol. 6 No. 1, pp.
46–55.
Ludwig, A. (2017), “Perspektiven zu aktuellen und künftigen Entwicklungen im
Schnittbereich IT und Mobilität”, Wirtschaftsinformatik & Management, Vol. 9 No.
3, pp. 8–11.
Lueth, K.L., Patsioura, C., Diaz Williams, Z. and Kermani, Z.Z. (2016), Industrial
Industrial Analytics 2016 / 2017: The Current State of Data Analytics Usage in
Industrial Companies, available
at:https://doi.org/http://dx.doi.org/10.1016/j.jagp.2012.12.017.
Macdonald, J.R. and Corsi, T.M. (2013), “Supply Chain Disruption Management: Severe
Events, Recovery, and Performance”, Journal of Business Logistics, Vol. 34 No. 4,
pp. 270–288.
Macher, J.T. (2006), “Technological Development and the Boundaries of the Firm: A
Knowledge-Based Examination in Semiconductor Manufacturing”, Management
Science, Vol. 52 No. 6, pp. 826–843.
Macher, J.T. and Boerner, C. (2012), “Technological development at the boundaries of
the firm: a knowledge-based examination in drug development”, Strategic
Management Journal, Vol. 33 No. 9, pp. 1016–1036.
MacInnis, D.J. (2011), “A Framework for Conceptual Contributions in Marketing”,
Journal of Marketing, Vol. 75 No. 4, pp. 136–154.
Maissin, J., Van Der Elst, R., Griedlich, N., Mouton, M. and Van Der Poorten, M. (2016),
“Cognitive Intelligence - When intelligent machines learn to venture into the
business world”, Inside, No. 13, pp. 20–27.
Malomo, F. and Sena, V. (2017), “Data Intelligence for Local Government? Assessing
the Benefits and Barriers to Use of Big Data in the Public Sector”, Policy & Internet,
Vol. 9 No. 1, pp. 7–27.
Manuj, I. and Pohlen, T.L. (2012), “A reviewer’s guide to the grounded theory

259
methodology in logistics and supply chain management research”, edited by Flint,
D.International Journal of Physical Distribution & Logistics Management, Vol. 42
No. 8/9, pp. 784–803.
Manuj, I. and Sahin, F. (2011), “A model of supply chain and supply chain decision‐
making complexity”, International Journal of Physical Distribution & Logistics
Management, Vol. 41 No. 5, pp. 511–549.
Manyika, J., Chui, M., Brown, B., Bughin, J., Dobbs, R., Roxburgh, C. and Byers, A.H.
(2011), “Big data: The next frontier for innovation, competition, and productivity”,
McKinsey Global Institute, No. June, p. 156.
Marchand, D.A. and Peppard, J. (2013), “Why IT fumbles analytics”, Harvard Business
Review, Vol. 91 No. 1, pp. 104–112.
Marchese, K. and Dollar, B. (2015), Supply Chain Talent of the Future - Findings from
the Third Annual Supply Chain Survey, Deloitte Consulting LLP.
Markl, V., Löser, A., Hoeren, T., Krcmar, H., Hemsen, H., Schermann, M., Gottlieb, M.,
et al. (2013), Innovationspotenzialanalyse Für Die Neuen Technologien Für Das
Verwalten Und Analysieren von Großen Datenmengen (Big Data Management),
Berlin, München, Münster.
Matthias, O., Fouweather, I., Gregory, I. and Vernon, A. (2017), “Making sense of Big
Data – can it transform operations management?”, International Journal of
Operations & Production Management, Vol. 37 No. 1, pp. 37–55.
McAfee, A. and Brynjolfsson, E. (2012), “Big data: the management revolution.”,
Harvard Business Review, Vol. 90 No. 10, pp. 60–68.
McCracken, G. (1988), The Long Interview, Sage, Newbury Park, CA.
Mello, J. and Flint, D.J. (2009), “A refined view of grounded theory and its application
to logistics research”, Journal of Business Logistics, Vol. 30 No. 1, pp. 107–125.
Miles, M.B., Huberman, A.M. and Saldana, J. (2014), Qualitative Data Analysis: A
Methods Sourcebook, 3rd Ed., Sage, Thousand Oaks, CA.
Miller, T.W. (2015), Sports Analytics and Data Science: Winning the Game with Methods
and Models, Pearson Education, Inc., Old Tappan, NJ.
Monahan, S., Ward, J., Zimmermann, M., Sonthalia, B. and Vanhencxthoven, M. (2017),
Accelerating into Uncertainty, CSCMP’s Annual State of Logistics Report.
Nicholas, P.K., Mandolesi, S., Naspetti, S. and Zanoli, R. (2014), “Innovations in low
input and organic dairy supply chains—What is acceptable in Europe?”, Journal of
Dairy Science, Elsevier, Vol. 97 No. 2, pp. 1157–1167.
Nickerson, J. a. and Zenger, T.R. (2004), “A Knowledge-Based Theory of the Firm—The
Problem-Solving Perspective”, Organization Science, Vol. 15 No. 6, pp. 617–632.
Nitsche, B. and Durach, C.F. (2018), “Much discussed, little conceptualized: supply chain
volatility”, edited by Maria Jesus Saenz, P. and Xenophon Koufteros,
D.International Journal of Physical Distribution & Logistics Management, Vol. 48
No. 8, pp. 866–886.
Nonaka, I. and von Krogh, G. (2009), “Perspective—Tacit Knowledge and Knowledge
260
Conversion: Controversy and Advancement in Organizational Knowledge Creation
Theory”, Organization Science, Vol. 20 No. 3, pp. 635–652.
O’Neil, C. and Schutt, R. (2013), Doing Data Science: Straight Talk from the Frontline,
O’Reilly Media, Inc., Sebastopol, CA.
Oliveira, M.P.V. De, McCormack, K. and Trkman, P. (2012), “Business analytics in
supply chains – The contingent effect of business process maturity”, Expert Systems
with Applications, Elsevier Ltd, Vol. 39 No. 5, pp. 5488–5498.
Oliver, R.K. and Webber, M.D. (1982), “Supply-chain management: logistics catches up
with strategy”, Outlook, M Christopher, Chapman Hall, London, Vol. 5 No. 1, pp.
42–47.
Omar, A., Davis-Sramek, B., Fugate, B.S. and Mentzer, J.T. (2012), “Exploring the
Complex Social Processes of Organizational Change: Supply Chain Orientation
From a Manager’s Perspective”, Journal of Business Logistics, Vol. 33 No. 1, pp.
4–19.
Opher, A., Onda, A., Chou, A. and Sounderrajan, K. (2016), The Rise of the Data
Economy: Driving Value through Internet of Things Data Monetization, Somers.
Pearson, M., Gjendem, F.H., Kaltenbach, P., Schatteman, O. and Hanifan, G. (2014), Big
Data Analytics in Supply Chain: Hype or Here to Stay?, Accenture Global
Operations Megatrend Study, Munich.
Pfohl, H.-C. (1974), “Die Logistik als Beispiel für Auswirkungen des Systemdenkens in
der entscheidungs-orientierten Betriebswirtschaftslehre”, Management
International Review, Vol. 14 No. 1, pp. 67–80.
Pfohl, H.-C. (2010), “Logistiksysteme : betriebswirtschaftliche Grundlagen”, Springer,
Heidelberg.
Philip Chen, C.L. and Zhang, C.-Y. (2014), “Data-intensive applications, challenges,
techniques and technologies: A survey on Big Data”, Information Sciences, Elsevier
Inc., Vol. 275, pp. 314–347.
Phillipps, T. and Davenport, T.H. (2013), The Analytics Advantage. We’re Just Getting
Started.
Provost, F. and Fawcett, T. (2013), Data Science for Business, O’Reilly Media,
Sebastopol, CA.
Purvis, R.L., Sambamurthy, V. and Zmud, R.W. (2001), “The Assimilation of Knowledge
Platforms in Organizations: An Empirical Investigation”, Organization Science,
Vol. 12 No. 2, pp. 117–135.
Raghupathi, W. and Raghupathi, V. (2014), “Big data analytics in healthcare: promise
and potential”, Health Information Science and Systems, Vol. 2 No. 1, p. 3.
Ramanathan, R., Philpott, E., Duan, Y. and Cao, G. (2017), “Adoption of business
analytics and impact on performance: a qualitative study in retail”, Production
Planning & Control, Taylor & Francis, Vol. 28 No. 11–12, pp. 985–998.
Ransbotham, S., Kiron, D. and Prentice, P.K. (2015), “Minding the Analytics Gap”, MIT
Sloan Management Review, Vol. 56 No. Spring, pp. 63–68.
261
Ransbotham, S., Kiron, D. and Prentice, P.K. (2016), “Beyond the hype: the hard work
behind analytics success”, MIT Sloan Management Review, Massachusetts Institute
of Technology, Cambridge, MA, Vol. 57 No. 3.
Rao, A. (2016), “AI everywhere & nowhere part 3 – AI is AAAI (Assisted-Augmented-
Autonomous Intelligence)”, PwC.
Rauer, J. and Kaufmann, L. (2015), “Mitigating External Barriers to Implementing Green
Supply Chain Management: A Grounded Theory Investigation of Green-Tech
Companies’ Rare Earth Metals Supply Chains”, Journal of Supply Chain
Management, Vol. 51 No. 2, pp. 65–88.
Reinsel, D., Gantz, J. and Rydning, J. (2018), Data Age 2025: The Digitization of the
World From Edge to Core.
Richards, G.S. (2016), “Business Intelligence and Analytics Research”, International
Journal of Business Intelligence Research, Vol. 7 No. 1, pp. 1–10.
Richey, R.G., Morgan, T.R., Lindsey-Hall, K. and Adams, F.G. (2016), “A global
exploration of Big Data in the supply chain”, International Journal of Physical
Distribution & Logistics Management, Vol. 46 No. 8, pp. 710–739.
Rivera, L., Gligor, D. and Sheffi, Y. (2016), “The benefits of logistics clustering”, edited
by Shong-lee Ivan Su, D.International Journal of Physical Distribution & Logistics
Management, Vol. 46 No. 3, pp. 242–268.
Rosenbaum, P.R. (2002), Observational Studies, edited by 2nd Ed.Observational Studies,
Springer New York, New York, NY, available at:https://doi.org/10.1007/978-1-
4757-3692-2.
Ross, J.W., Beath, C.M. and Quaadgras, A. (2013), “You May Not Need Big Data After
All”, Havard Business Review, Vol. 91 No. 12, pp. 90–98.
Rossetti, C.L. and Dooley, K.J. (2010), “Job types in the supply chain management
profession”, Journal of Supply Chain Management, Vol. 46 No. 3, pp. 40–56.
Roßmann, B., Canzaniello, A., von der Gracht, H. and Hartmann, E. (2018), “The future
and social impact of Big Data Analytics in Supply Chain Management: Results from
a Delphi study”, Technological Forecasting and Social Change, Elsevier, Vol. 130
No. January 2017, pp. 135–149.
Rothberg, H.N. and Erickson, G.S. (2017), “Big data systems: knowledge transfer or
intelligence insights?”, Journal of Knowledge Management, Vol. 21 No. 1, pp. 92–
112.
Rousseeuw, P.J. (1987), “Silhouettes: A graphical aid to the interpretation and validation
of cluster analysis”, Journal of Computational and Applied Mathematics, Vol. 20,
pp. 53–65.
Rüegg-Stürm, J. (2003), Das Neue St. Galler Management-Modell: Grundkategorien
Einer Integrierten Managementlehre: Der HSG-Ansatz, Vol. 2, Haupt, Bern.
Russell, S.J. and Norvig, P. (2016), Artificial Intelligence: A Modern Approach, Pearson,
Boston.
Rust, R.T. and Huang, M.-H. (2014), “The Service Revolution and the Transformation of
Marketing Science”, Marketing Science, Vol. 33 No. 2, pp. 206–221.
262
Saldanha, J.P., Mello, J.E., Knemeyer, A.M. and Vijayaraghavan, T.A.S. (2015),
“Implementing Supply Chain Technologies in Emerging Markets: An Institutional
Theory Perspective”, Journal of Supply Chain Management, Vol. 51 No. 1, pp. 5–
26.
Sanders, N.R.. (2014), Big Data Driven Supply Chain Management: A Framework for
Implementing Analytics and Turning Information into Intelligence, Pearson
Education, Inc., Upper Saddle River, NJ.
Sanders, N.R. (2016), “How to Use Big Data to Drive Your Supply Chain”, California
Management Review, Vol. 58 No. 3, pp. 26–48.
SAS. (2017), SAS Enterprise Miner 14.3: Reference Help, SAS Institute Inc., Cary, NC.
Schmidt, B., Rutkowsky, S., Petersen, I., Kloetzke, F., Wallenburg, M. and Einmahl, L.
(2015), Digital Supply Chains: Increasingly Critical for Competitive Edge,
European A.T Kearney/WHU Logistics Study 2015, Düsseldorf.
Schoenherr, T. and Speier-Pero, C. (2015), “Data Science, Predictive Analytics, and Big
Data in Supply Chain Management: Current State and Future Potential”, Journal of
Business Logistics, Vol. 36 No. 1, pp. 120–132.
Seddon, P.B., Constantinidis, D., Tamm, T. and Dod, H. (2017), “How does business
analytics contribute to business value?”, Information Systems Journal, Vol. 27 No.
3, pp. 237–269.
Seuring, S.A. (2008), “Assessing the rigor of case study research in supply chain
management”, Supply Chain Management: An International Journal, Vol. 13 No. 2,
pp. 128–137.
Shneiderman, B., Plaisant, C. and Hesse, B.W. (2013), “Improving Healthcare with
Interactive Visualization”, Computer, Vol. 46 No. 5, pp. 58–66.
Shuradze, G. and Wagner, H.-T. (2016), “Towards a Conceptualization of Data Analytics
Capabilities”, 2016 49th Hawaii International Conference on System Sciences
(HICSS), Vol. 2016-March, IEEE, pp. 5052–5064.
Simchi-Levi, D., Simchi-Levi, E. and Kaminsky, P. (2003), Designing and Managing the
Supply Chain: Concepts, Strategies, and Cases, 3rd Ed., McGraw-Hill New York,
Boston, MA.
Simon, H.A. (1962), “The Architecture of Complexity”, Proceedings of the American
Philosophical Society, Vol. 106 No. 6, pp. 467–482.
Simon, H.A. (1973), “The structure of ill structured problems”, Artificial Intelligence,
Vol. 4 No. 3–4, pp. 181–201.
Sivarajah, U., Kamal, M.M., Irani, Z. and Weerakkody, V. (2017), “Critical analysis of
Big Data challenges and analytical methods”, Journal of Business Research, Vol.
70, pp. 263–286.
Song, I.-Y. and Zhu, Y. (2016), “Big data and data science: what should we teach?”,
Expert Systems, Vol. 33 No. 4, pp. 364–373.
Souza, G.C. (2014), “Supply chain analytics”, Business Horizons, “Kelley School of
Business, Indiana University”, Vol. 57 No. 5, pp. 595–605.
263
Spanos, Y.E. and Prastacos, G. (2004), “Understanding organizational capabilities:
towards a conceptual framework”, Journal of Knowledge Management, Vol. 8 No.
3, pp. 31–43.
Spender, J.-C. (1996), “Making knowledge the basis of a dynamic theory of the firm”,
Strategic Management Journal, Vol. 17 No. S2, pp. 45–62.
Spiess, J., Joens, Y.T., Dragnea, R. and Spencer, P. (2014), “Using Big Data to Improve
Customer Experience and Business Performance”, Bell Labs Technical Journal,
Vol. 18 No. 4, pp. 3–17.
Srinivasan, R. and Swink, M. (2018), “An Investigation of Visibility and Flexibility as
Complements to Supply Chain Analytics: An Organizational Information
Processing Theory Perspective”, Production and Operations Management, Vol. 27
No. 10, pp. 1849–1867.
Srinivasan, U. and Arunasalam, B. (2013), “Leveraging Big Data Analytics to Reduce
Healthcare Costs”, IT Professional, Vol. 15 No. 6, pp. 21–28.
Stein, M., Janetzko, H., Seebacher, D., Jäger, A., Nagel, M., Hölsch, J., Kosub, S., et al.
(2017), “How to Make Sense of Team Sport Data: From Acquisition to Data
Modeling and Research Aspects”, Data, Vol. 2 No. 1, p. 2.
Straube, F. (2004), E-Logistik: Ganzheitliches Logistikmanagement.
Straube, F., Bahnsen, M., Junge, A.L. and Mittag, P. (2017), “Datenbasierte
Geschäftsmodelle im Straßenverkehr”, Jahrbuch Logistik 2017, unikat
Werbeagentur, Wuppertal, pp. 68–72.
Straube, F., Reipert, J. and Schöder, D. (2017), “City-Logistik der Zukunft — im
Spannungsfeld von Elektromobilität und Digitalisierung”, Wirtschaftsinformatik &
Management, Vol. 9 No. 3, pp. 28–35.
Strauss, A.L. and Corbin, J.M. (1998), “Basics of Qualitative Research: Techniques and”,
Citeseer.
Suddaby, R. (2010), “Challenges for Institutional Theory”, Journal of Management
Inquiry, Vol. 19 No. 1, pp. 14–20.
Swanson, E.B. and Ramiller, N.C. (2004), “Innovating Mindfully with Information
Technology”, MIS Quarterly, Vol. 28 No. 4, p. 553.
Teece, D.J. (1981), “The Market for Know-How and the Efficient International Transfer
of Technology”, The ANNALS of the American Academy of Political and Social
Science, Vol. 458 No. 1, pp. 81–96.
Teece, D.J. (1998), “Capturing Value from Knowledge Assets”, California Management
Review, Vol. 40, pp. 55–79.
Thieullent, A.-L., Colas, M., Buvat, J., KVJ, S. and Bisht, A. (2016), Going Big: Why
Companies Need to Focus on Operational Analytics, Paris.
Thornton, L.M., Esper, T.L. and Morris, M.L. (2013), “Exploring the impact of supply
chain counterproductive work behaviors on supply chain relationships”,
International Journal of Physical Distribution & Logistics Management, Vol. 43
No. 9, pp. 786–804.
264
Tiwana, A. (2008), “Do bridging ties complement strong ties? An empirical examination
of alliance ambidexterity”, Strategic Management Journal, Vol. 29 No. 3, pp. 251–
272.
Toonen, A., Kanthadai, S. and Jones, S. (2016), The Big Data Payoff: Turning Big Data
into Business Value.
Trieu, V.-H. (2017), “Getting value from Business Intelligence systems: A review and
research agenda”, Decision Support Systems, Elsevier B.V., Vol. 93, pp. 111–124.
Trkman, P. (2010), “The critical success factors of business process management”,
International Journal of Information Management, Vol. 30 No. 2, pp. 125–134.
Trkman, P., McCormack, K., de Oliveira, M.P.V. and Ladeira, M.B. (2010), “The impact
of business analytics on supply chain performance”, Decision Support Systems,
Elsevier B.V., Vol. 49 No. 3, pp. 318–327.
Troester, M. (2012), Big Data Meets Big Data Analytics: Three Key Technologies for
Extracting Real-Time Business Value from the Big Data That Threatens to
Overwhelm Traditional Computing Architectures.
Troilo, M., Bouchet, A., Urban, T.L. and Sutton, W.A. (2016), “Perception, reality, and
the adoption of business analytics: Evidence from North American professional
sport organizations”, Omega, Elsevier, Vol. 59 No. October 2017, pp. 72–83.
Tsai, C.-W., Lai, C.-F., Chao, H.-C. and Vasilakos, A. V. (2015), “Big data analytics: a
survey”, Journal of Big Data, Springer International Publishing, Vol. 2 No. 1, p. 21.
UPS. (2016), The Rise of Smart Operations: Smart Operations Will Be Critical to Future
Success.
Vachon, S. and Klassen, R.D. (2008), “Environmental management and manufacturing
performance: The role of collaboration in the supply chain”, International Journal
of Production Economics, Vol. 111 No. 2, pp. 299–315.
Valenta, A.L. and Wigger, U. (1997), “Q-methodology: Definition and Application in
Health Care Informatics”, Journal of the American Medical Informatics Association,
Vol. 4 No. 6, pp. 501–510.
Van De Ven, A.H., Delbecq, A.L. and Koenig, R. (1976), “Determinants of Coordination
Modes within Organizations”, American Sociological Review, Vol. 41 No. 2, pp.
322–338.
Viaene, S. (2013), “Data Scientists Aren’t Domain Experts”, IT Professional, Vol. 15 No.
6, pp. 12–17.
Viaene, S. and Bunder, A. Van den. (2011), “The secrets to managing business analytics
projects”, MIT Sloan Management Review, Vol. 53 No. 1, pp. 65–69.
Viceconti, M., Hunter, P. and Hose, R. (2015), “Big Data, Big Knowledge: Big Data for
Personalized Healthcare”, IEEE Journal of Biomedical and Health Informatics, Vol.
19 No. 4, pp. 1209–1215.
Vidgen, R., Shaw, S. and Grant, D.B. (2017), “Management challenges in creating value
from business analytics”, European Journal of Operational Research, Elsevier B.V.,
Vol. 261 No. 2, pp. 626–639.
265
Voss, C., Tsikriktsis, N. and Frohlich, M. (2002), “Case research in operations
management”, International Journal of Operations and Production Management,
Vol. 22 No. 2, pp. 195–219.
Waller, M.A. and Fawcett, S.E. (2013), “Data Science, Predictive Analytics, and Big
Data: A Revolution That Will Transform Supply Chain Design and Management”,
Journal of Business Logistics, Vol. 34 No. 2, pp. 77–84.
Wang, G., Gunasekaran, A., Ngai, E.W.T. and Papadopoulos, T. (2016), “Big data
analytics in logistics and supply chain management: Certain investigations for
research and applications”, International Journal of Production Economics,
Elsevier, Vol. 176, pp. 98–110.
Wang, L. and Alexander, C.A. (2015), “Big Data Driven Supply Chain Management and
Business Administration”, American Journal of Economics and Business
Administration, Vol. 7 No. 2, pp. 60–67.
Wang, Y., Caron, F., Vanthienen, J., Huang, L. and Guo, Y. (2014), “Acquiring logistics
process intelligence: Methodology and an application for a Chinese bulk port”,
Expert Systems with Applications, Elsevier Ltd, Vol. 41 No. 1, pp. 195–209.
Watson, H.J. (2014), “Tutorial: Big Data Analytics: Concepts, Technologies, and
Applications”, Communications of the Association for Information Systems, Vol. 34,
pp. 1247–1268.
Wedel, M. and Kannan, P.K. (2016), “Marketing Analytics for Data-Rich Environments”,
Journal of Marketing, Vol. 80 No. 6, pp. 97–121.
Winter, S.G. (1987), “Knowledge And Competence As Strategic Assets”, The
Competitive Challange, Teece, David J, pp. 159–184.
Wixom, B.H., Yen, B. and Relich, M. (2013), “Maximizing Value from Business
Analytics”, MIS Quarterly Executive, Vol. 12 No. 2, pp. 111–123.
Wu, L., Yue, X., Jin, A. and Yen, D.C. (2016), “Smart supply chain management: a
review and implications for future research”, The International Journal of Logistics
Management, Vol. 27 No. 2, pp. 395–417.
Yin, R.K. (2014), “Case study research: Design and methods”, London, UK: SAGE
Publications Ltd.
Zack, M.H. (1999), “Developing a Knowledge Strategy”, California Management
Review, Vol. 41 No. 3, pp. 125–145.
Zhao, D. (2013), “Frontiers of Big Data Business Analytics: Patterns and Cases in Online
Marketing”, Big Data and Business Analytics, pp. 43–67.
Zhu, S., Song, J., Hazen, B.T., Lee, K. and Cegielski, C. (2018), “How supply chain
analytics enables operational supply chain transparency”, International Journal of
Physical Distribution & Logistics Management, Vol. 48 No. 1, pp. 47–68.
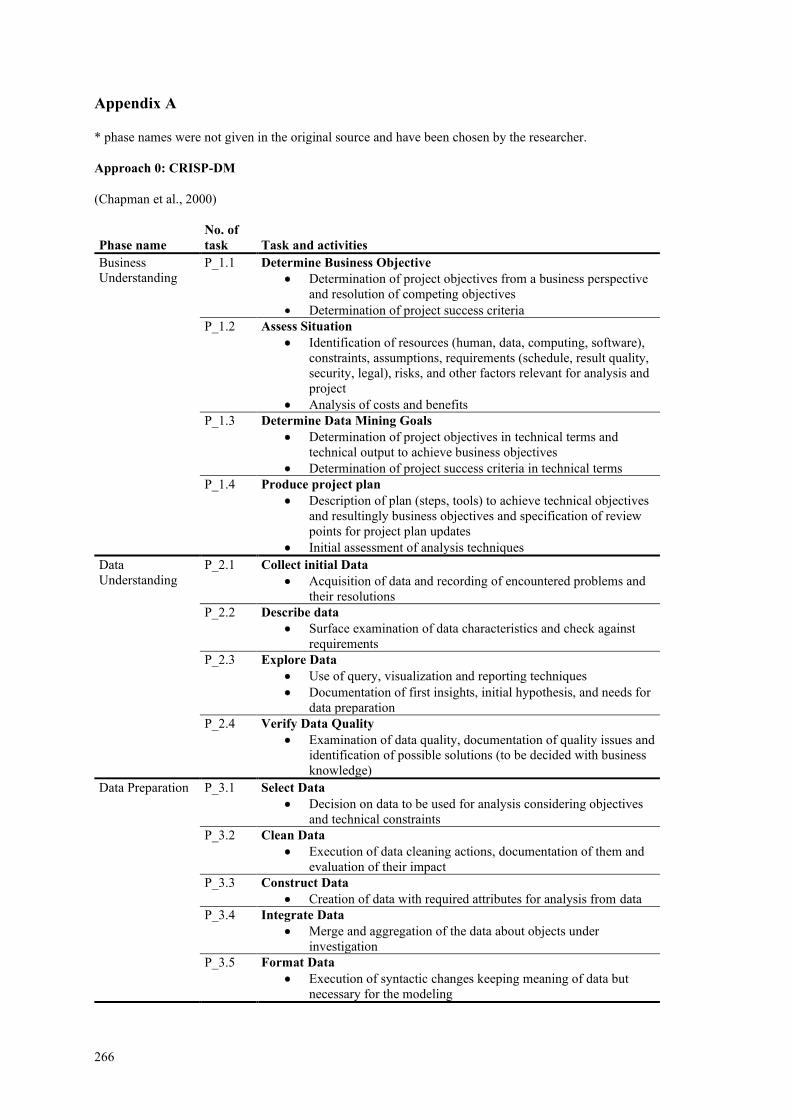
266
Appendix A
* phase names were not given in the original source and have been chosen by the researcher.
Approach 0: CRISP-DM
(Chapman et al., 2000)
Phase name
No. of
task Task and activities
Business
Understanding
P_1.1 Determine Business Objective
• Determination of project objectives from a business perspective
and resolution of competing objectives
• Determination of project success criteria
P_1.2 Assess Situation
• Identification of resources (human, data, computing, software),
constraints, assumptions, requirements (schedule, result quality,
security, legal), risks, and other factors relevant for analysis and
project
• Analysis of costs and benefits
P_1.3 Determine Data Mining Goals
• Determination of project objectives in technical terms and
technical output to achieve business objectives
• Determination of project success criteria in technical terms
P_1.4 Produce project plan
• Description of plan (steps, tools) to achieve technical objectives
and resultingly business objectives and specification of review
points for project plan updates
• Initial assessment of analysis techniques
Data
Understanding
P_2.1 Collect initial Data
• Acquisition of data and recording of encountered problems and
their resolutions
P_2.2 Describe data
• Surface examination of data characteristics and check against
requirements
P_2.3 Explore Data
• Use of query, visualization and reporting techniques
• Documentation of first insights, initial hypothesis, and needs for
data preparation
P_2.4 Verify Data Quality
• Examination of data quality, documentation of quality issues and
identification of possible solutions (to be decided with business
knowledge)
Data Preparation P_3.1 Select Data
• Decision on data to be used for analysis considering objectives
and technical constraints
P_3.2 Clean Data
• Execution of data cleaning actions, documentation of them and
evaluation of their impact
P_3.3 Construct Data
• Creation of data with required attributes for analysis from data
P_3.4 Integrate Data
• Merge and aggregation of the data about objects under
investigation
P_3.5 Format Data
• Execution of syntactic changes keeping meaning of data but
necessary for the modeling
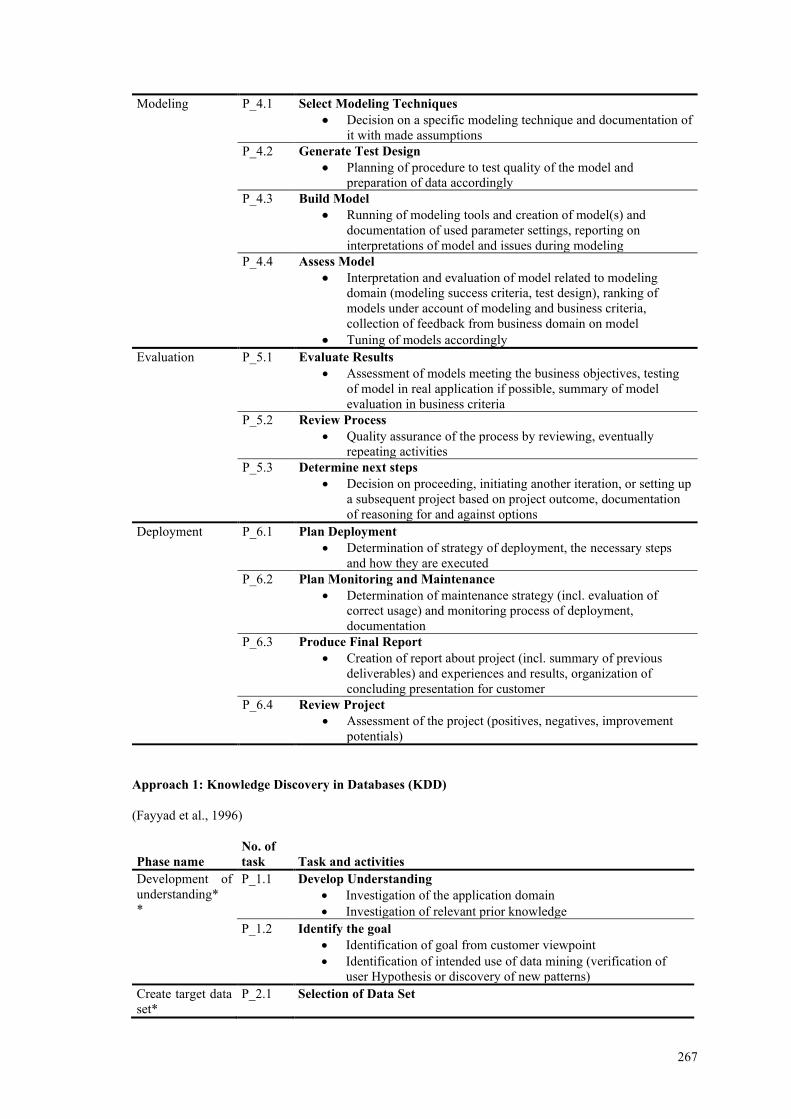
267
Modeling P_4.1 Select Modeling Techniques
• Decision on a specific modeling technique and documentation of
it with made assumptions
P_4.2 Generate Test Design
• Planning of procedure to test quality of the model and
preparation of data accordingly
P_4.3 Build Model
• Running of modeling tools and creation of model(s) and
documentation of used parameter settings, reporting on
interpretations of model and issues during modeling
P_4.4 Assess Model
• Interpretation and evaluation of model related to modeling
domain (modeling success criteria, test design), ranking of
models under account of modeling and business criteria,
collection of feedback from business domain on model
• Tuning of models accordingly
Evaluation P_5.1 Evaluate Results
• Assessment of models meeting the business objectives, testing
of model in real application if possible, summary of model
evaluation in business criteria
P_5.2 Review Process
• Quality assurance of the process by reviewing, eventually
repeating activities
P_5.3 Determine next steps
• Decision on proceeding, initiating another iteration, or setting up
a subsequent project based on project outcome, documentation
of reasoning for and against options
Deployment P_6.1 Plan Deployment
• Determination of strategy of deployment, the necessary steps
and how they are executed
P_6.2 Plan Monitoring and Maintenance
• Determination of maintenance strategy (incl. evaluation of
correct usage) and monitoring process of deployment,
documentation
P_6.3 Produce Final Report
• Creation of report about project (incl. summary of previous
deliverables) and experiences and results, organization of
concluding presentation for customer
P_6.4 Review Project
• Assessment of the project (positives, negatives, improvement
potentials)
Approach 1: Knowledge Discovery in Databases (KDD)
(Fayyad et al., 1996)
Phase name
No. of
task Task and activities
Development of
understanding*
*
P_1.1 Develop Understanding
• Investigation of the application domain
• Investigation of relevant prior knowledge
P_1.2 Identify the goal
• Identification of goal from customer viewpoint
• Identification of intended use of data mining (verification of
user Hypothesis or discovery of new patterns)
Create target data
set*
P_2.1 Selection of Data Set
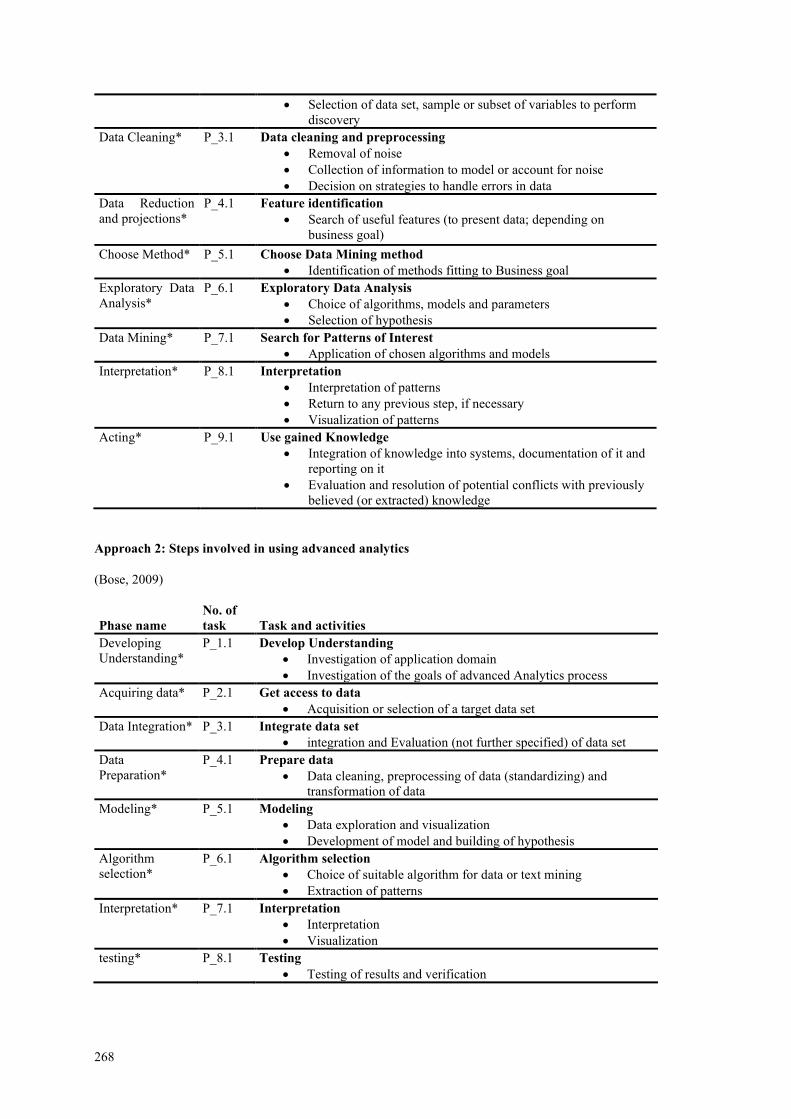
268
• Selection of data set, sample or subset of variables to perform
discovery
Data Cleaning* P_3.1 Data cleaning and preprocessing
• Removal of noise
• Collection of information to model or account for noise
• Decision on strategies to handle errors in data
Data Reduction
and projections*
P_4.1 Feature identification
• Search of useful features (to present data; depending on
business goal)
Choose Method* P_5.1 Choose Data Mining method
• Identification of methods fitting to Business goal
Exploratory Data
Analysis*
P_6.1 Exploratory Data Analysis
• Choice of algorithms, models and parameters
• Selection of hypothesis
Data Mining* P_7.1 Search for Patterns of Interest
• Application of chosen algorithms and models
Interpretation* P_8.1 Interpretation
• Interpretation of patterns
• Return to any previous step, if necessary
• Visualization of patterns
Acting* P_9.1 Use gained Knowledge
• Integration of knowledge into systems, documentation of it and
reporting on it
• Evaluation and resolution of potential conflicts with previously
believed (or extracted) knowledge
Approach 2: Steps involved in using advanced analytics
(Bose, 2009)
Phase name
No. of
task Task and activities
Developing
Understanding*
P_1.1 Develop Understanding
• Investigation of application domain
• Investigation of the goals of advanced Analytics process
Acquiring data* P_2.1 Get access to data
• Acquisition or selection of a target data set
Data Integration* P_3.1 Integrate data set
• integration and Evaluation (not further specified) of data set
Data
Preparation*
P_4.1 Prepare data
• Data cleaning, preprocessing of data (standardizing) and
transformation of data
Modeling* P_5.1 Modeling
• Data exploration and visualization
• Development of model and building of hypothesis
Algorithm
selection*
P_6.1 Algorithm selection
• Choice of suitable algorithm for data or text mining
• Extraction of patterns
Interpretation* P_7.1 Interpretation
• Interpretation
• Visualization
testing* P_8.1 Testing
• Testing of results and verification
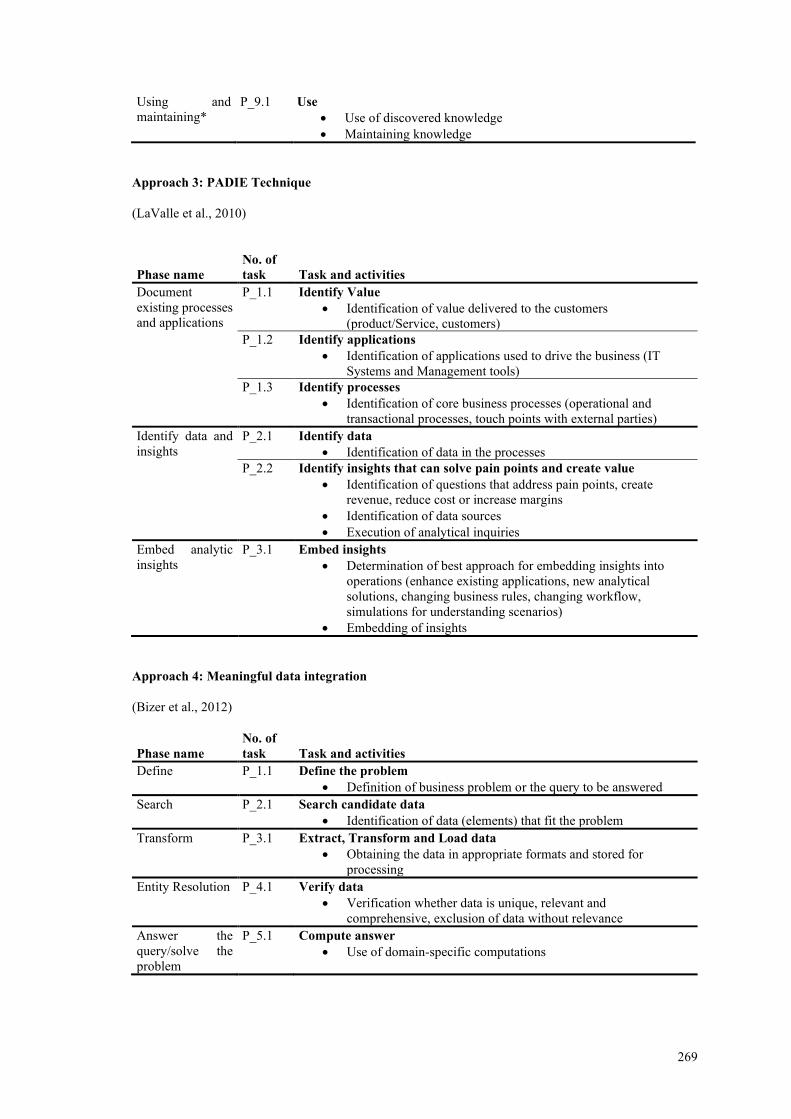
269
Using and
maintaining*
P_9.1 Use
• Use of discovered knowledge
• Maintaining knowledge
Approach 3: PADIE Technique
(LaValle et al., 2010)
Phase name
No. of
task Task and activities
Document
existing processes
and applications
P_1.1 Identify Value
• Identification of value delivered to the customers
(product/Service, customers)
P_1.2 Identify applications
• Identification of applications used to drive the business (IT
Systems and Management tools)
P_1.3 Identify processes
• Identification of core business processes (operational and
transactional processes, touch points with external parties)
Identify data and
insights
P_2.1 Identify data
• Identification of data in the processes
P_2.2 Identify insights that can solve pain points and create value
• Identification of questions that address pain points, create
revenue, reduce cost or increase margins
• Identification of data sources
• Execution of analytical inquiries
Embed analytic
insights
P_3.1 Embed insights
• Determination of best approach for embedding insights into
operations (enhance existing applications, new analytical
solutions, changing business rules, changing workflow,
simulations for understanding scenarios)
• Embedding of insights
Approach 4: Meaningful data integration
(Bizer et al., 2012)
Phase name
No. of
task Task and activities
Define P_1.1 Define the problem
• Definition of business problem or the query to be answered
Search P_2.1 Search candidate data
• Identification of data (elements) that fit the problem
Transform P_3.1 Extract, Transform and Load data
• Obtaining the data in appropriate formats and stored for
processing
Entity Resolution P_4.1 Verify data
• Verification whether data is unique, relevant and
comprehensive, exclusion of data without relevance
Answer the
query/solve the
problem
P_5.1 Compute answer
• Use of domain-specific computations
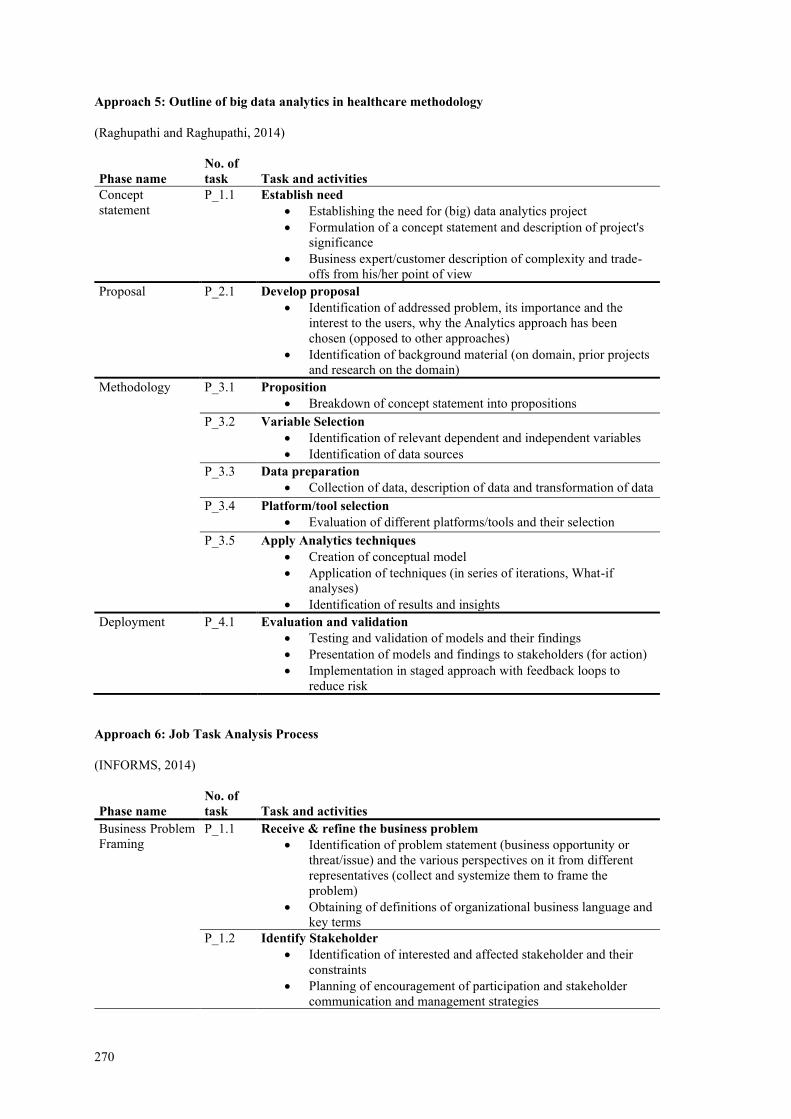
270
Approach 5: Outline of big data analytics in healthcare methodology
(Raghupathi and Raghupathi, 2014)
Phase name
No. of
task Task and activities
Concept
statement
P_1.1 Establish need
• Establishing the need for (big) data analytics project
• Formulation of a concept statement and description of project's
significance
• Business expert/customer description of complexity and trade-
offs from his/her point of view
Proposal P_2.1 Develop proposal
• Identification of addressed problem, its importance and the
interest to the users, why the Analytics approach has been
chosen (opposed to other approaches)
• Identification of background material (on domain, prior projects
and research on the domain)
Methodology P_3.1 Proposition
• Breakdown of concept statement into propositions
P_3.2 Variable Selection
• Identification of relevant dependent and independent variables
• Identification of data sources
P_3.3 Data preparation
• Collection of data, description of data and transformation of data
P_3.4 Platform/tool selection
• Evaluation of different platforms/tools and their selection
P_3.5 Apply Analytics techniques
• Creation of conceptual model
• Application of techniques (in series of iterations, What-if
analyses)
• Identification of results and insights
Deployment P_4.1 Evaluation and validation
• Testing and validation of models and their findings
• Presentation of models and findings to stakeholders (for action)
• Implementation in staged approach with feedback loops to
reduce risk
Approach 6: Job Task Analysis Process
(INFORMS, 2014)
Phase name
No. of
task Task and activities
Business Problem
Framing
P_1.1 Receive & refine the business problem
• Identification of problem statement (business opportunity or
threat/issue) and the various perspectives on it from different
representatives (collect and systemize them to frame the
problem)
• Obtaining of definitions of organizational business language and
key terms
P_1.2 Identify Stakeholder
• Identification of interested and affected stakeholder and their
constraints
• Planning of encouragement of participation and stakeholder
communication and management strategies
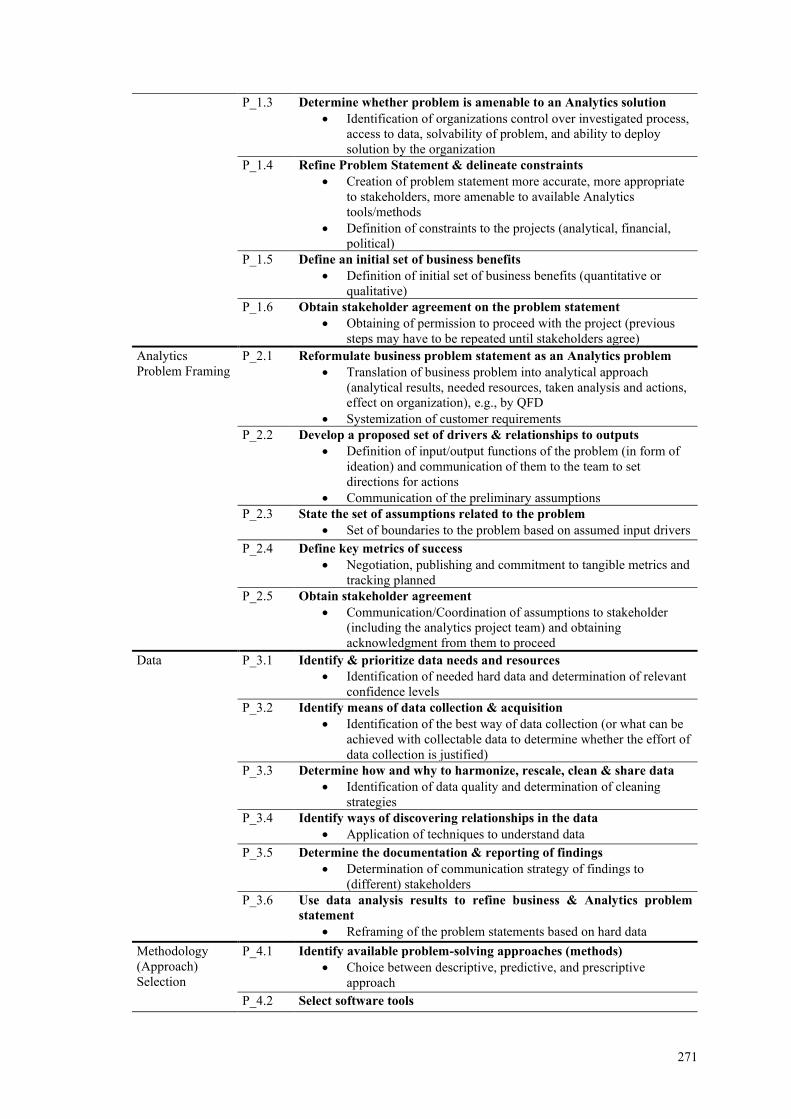
271
P_1.3 Determine whether problem is amenable to an Analytics solution
• Identification of organizations control over investigated process,
access to data, solvability of problem, and ability to deploy
solution by the organization
P_1.4 Refine Problem Statement & delineate constraints
• Creation of problem statement more accurate, more appropriate
to stakeholders, more amenable to available Analytics
tools/methods
• Definition of constraints to the projects (analytical, financial,
political)
P_1.5 Define an initial set of business benefits
• Definition of initial set of business benefits (quantitative or
qualitative)
P_1.6 Obtain stakeholder agreement on the problem statement
• Obtaining of permission to proceed with the project (previous
steps may have to be repeated until stakeholders agree)
Analytics
Problem Framing
P_2.1 Reformulate business problem statement as an Analytics problem
• Translation of business problem into analytical approach
(analytical results, needed resources, taken analysis and actions,
effect on organization), e.g., by QFD
• Systemization of customer requirements
P_2.2 Develop a proposed set of drivers & relationships to outputs
• Definition of input/output functions of the problem (in form of
ideation) and communication of them to the team to set
directions for actions
• Communication of the preliminary assumptions
P_2.3 State the set of assumptions related to the problem
• Set of boundaries to the problem based on assumed input drivers
P_2.4 Define key metrics of success
• Negotiation, publishing and commitment to tangible metrics and
tracking planned
P_2.5 Obtain stakeholder agreement
• Communication/Coordination of assumptions to stakeholder
(including the analytics project team) and obtaining
acknowledgment from them to proceed
Data P_3.1 Identify & prioritize data needs and resources
• Identification of needed hard data and determination of relevant
confidence levels
P_3.2 Identify means of data collection & acquisition
• Identification of the best way of data collection (or what can be
achieved with collectable data to determine whether the effort of
data collection is justified)
P_3.3 Determine how and why to harmonize, rescale, clean & share data
• Identification of data quality and determination of cleaning
strategies
P_3.4 Identify ways of discovering relationships in the data
• Application of techniques to understand data
P_3.5 Determine the documentation & reporting of findings
• Determination of communication strategy of findings to
(different) stakeholders
P_3.6 Use data analysis results to refine business & Analytics problem
statement
• Reframing of the problem statements based on hard data
Methodology
(Approach)
Selection
P_4.1 Identify available problem-solving approaches (methods)
• Choice between descriptive, predictive, and prescriptive
approach
P_4.2 Select software tools
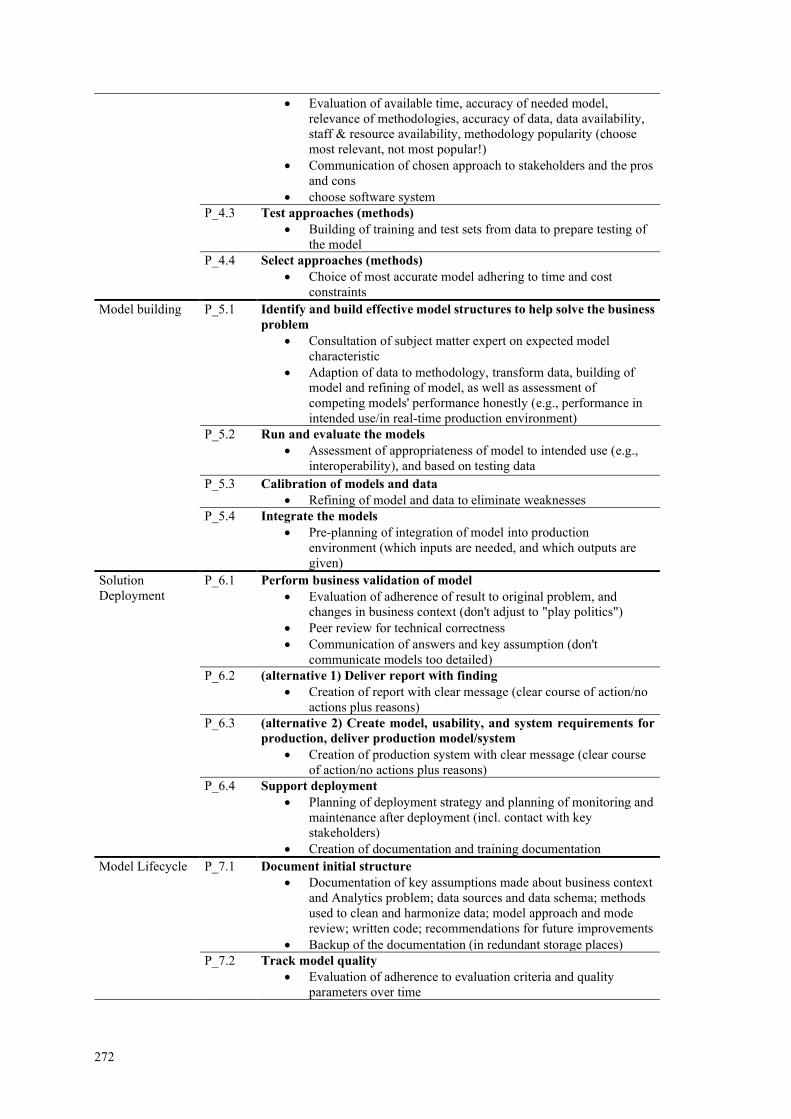
272
• Evaluation of available time, accuracy of needed model,
relevance of methodologies, accuracy of data, data availability,
staff & resource availability, methodology popularity (choose
most relevant, not most popular!)
• Communication of chosen approach to stakeholders and the pros
and cons
• choose software system
P_4.3 Test approaches (methods)
• Building of training and test sets from data to prepare testing of
the model
P_4.4 Select approaches (methods)
• Choice of most accurate model adhering to time and cost
constraints
Model building P_5.1 Identify and build effective model structures to help solve the business
problem
• Consultation of subject matter expert on expected model
characteristic
• Adaption of data to methodology, transform data, building of
model and refining of model, as well as assessment of
competing models' performance honestly (e.g., performance in
intended use/in real-time production environment)
P_5.2 Run and evaluate the models
• Assessment of appropriateness of model to intended use (e.g.,
interoperability), and based on testing data
P_5.3 Calibration of models and data
• Refining of model and data to eliminate weaknesses
P_5.4 Integrate the models
• Pre-planning of integration of model into production
environment (which inputs are needed, and which outputs are
given)
Solution
Deployment
P_6.1 Perform business validation of model
• Evaluation of adherence of result to original problem, and
changes in business context (don't adjust to "play politics")
• Peer review for technical correctness
• Communication of answers and key assumption (don't
communicate models too detailed)
P_6.2 (alternative 1) Deliver report with finding
• Creation of report with clear message (clear course of action/no
actions plus reasons)
P_6.3 (alternative 2) Create model, usability, and system requirements for
production, deliver production model/system
• Creation of production system with clear message (clear course
of action/no actions plus reasons)
P_6.4 Support deployment
• Planning of deployment strategy and planning of monitoring and
maintenance after deployment (incl. contact with key
stakeholders)
• Creation of documentation and training documentation
Model Lifecycle P_7.1 Document initial structure
• Documentation of key assumptions made about business context
and Analytics problem; data sources and data schema; methods
used to clean and harmonize data; model approach and mode
review; written code; recommendations for future improvements
• Backup of the documentation (in redundant storage places)
P_7.2 Track model quality
• Evaluation of adherence to evaluation criteria and quality
parameters over time
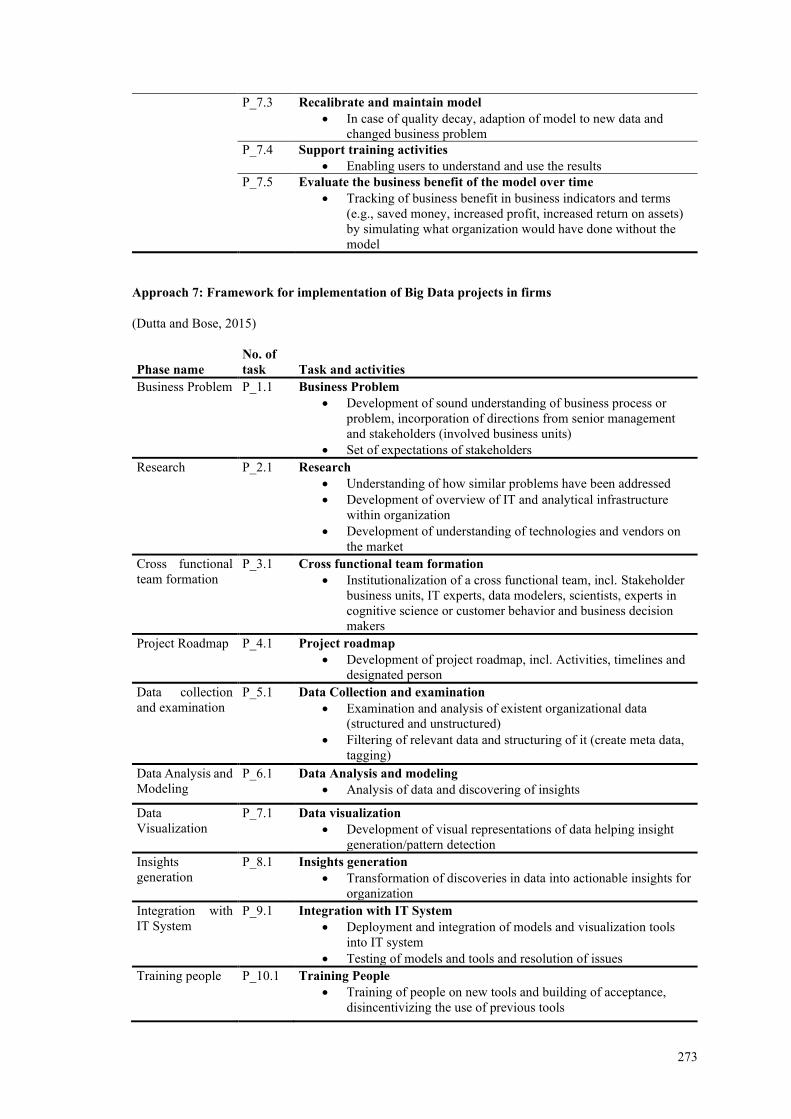
273
P_7.3 Recalibrate and maintain model
• In case of quality decay, adaption of model to new data and
changed business problem
P_7.4 Support training activities
• Enabling users to understand and use the results
P_7.5 Evaluate the business benefit of the model over time
• Tracking of business benefit in business indicators and terms
(e.g., saved money, increased profit, increased return on assets)
by simulating what organization would have done without the
model
Approach 7: Framework for implementation of Big Data projects in firms
(Dutta and Bose, 2015)
Phase name
No. of
task Task and activities
Business Problem P_1.1 Business Problem
• Development of sound understanding of business process or
problem, incorporation of directions from senior management
and stakeholders (involved business units)
• Set of expectations of stakeholders
Research P_2.1 Research
• Understanding of how similar problems have been addressed
• Development of overview of IT and analytical infrastructure
within organization
• Development of understanding of technologies and vendors on
the market
Cross functional
team formation
P_3.1 Cross functional team formation
• Institutionalization of a cross functional team, incl. Stakeholder
business units, IT experts, data modelers, scientists, experts in
cognitive science or customer behavior and business decision
makers
Project Roadmap P_4.1 Project roadmap
• Development of project roadmap, incl. Activities, timelines and
designated person
Data collection
and examination
P_5.1 Data Collection and examination
• Examination and analysis of existent organizational data
(structured and unstructured)
• Filtering of relevant data and structuring of it (create meta data,
tagging)
Data Analysis and
Modeling
P_6.1 Data Analysis and modeling
• Analysis of data and discovering of insights
Data
Visualization
P_7.1 Data visualization
• Development of visual representations of data helping insight
generation/pattern detection
Insights
generation
P_8.1 Insights generation
• Transformation of discoveries in data into actionable insights for
organization
Integration with
IT System
P_9.1 Integration with IT System
• Deployment and integration of models and visualization tools
into IT system
• Testing of models and tools and resolution of issues
Training people P_10.1 Training People
• Training of people on new tools and building of acceptance,
disincentivizing the use of previous tools
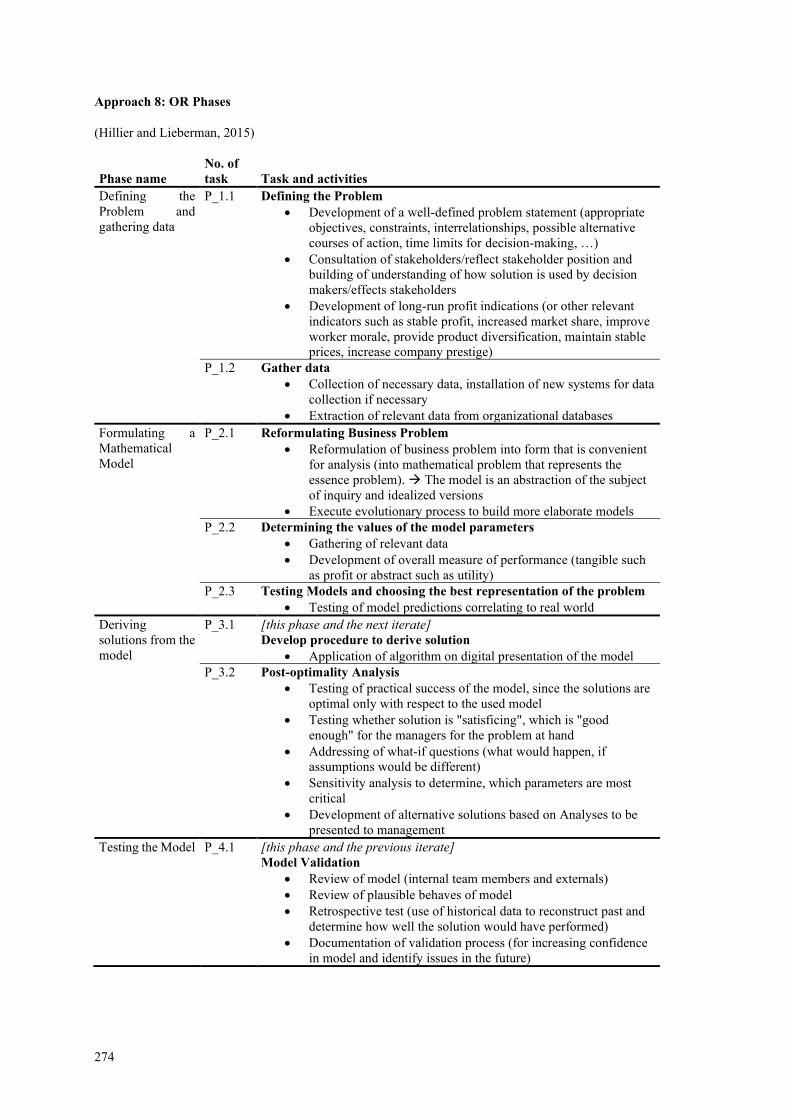
274
Approach 8: OR Phases
(Hillier and Lieberman, 2015)
Phase name
No. of
task Task and activities
Defining the
Problem and
gathering data
P_1.1 Defining the Problem
• Development of a well-defined problem statement (appropriate
objectives, constraints, interrelationships, possible alternative
courses of action, time limits for decision-making, …)
• Consultation of stakeholders/reflect stakeholder position and
building of understanding of how solution is used by decision
makers/effects stakeholders
• Development of long-run profit indications (or other relevant
indicators such as stable profit, increased market share, improve
worker morale, provide product diversification, maintain stable
prices, increase company prestige)
P_1.2 Gather data
• Collection of necessary data, installation of new systems for data
collection if necessary
• Extraction of relevant data from organizational databases
Formulating a
Mathematical
Model
P_2.1 Reformulating Business Problem
• Reformulation of business problem into form that is convenient
for analysis (into mathematical problem that represents the
essence problem). → The model is an abstraction of the subject
of inquiry and idealized versions
• Execute evolutionary process to build more elaborate models
P_2.2 Determining the values of the model parameters
• Gathering of relevant data
• Development of overall measure of performance (tangible such
as profit or abstract such as utility)
P_2.3 Testing Models and choosing the best representation of the problem
• Testing of model predictions correlating to real world
Deriving
solutions from the
model
P_3.1 [this phase and the next iterate]
Develop procedure to derive solution
• Application of algorithm on digital presentation of the model
P_3.2 Post-optimality Analysis
• Testing of practical success of the model, since the solutions are
optimal only with respect to the used model
• Testing whether solution is "satisficing", which is "good
enough" for the managers for the problem at hand
• Addressing of what-if questions (what would happen, if
assumptions would be different)
• Sensitivity analysis to determine, which parameters are most
critical
• Development of alternative solutions based on Analyses to be
presented to management
Testing the Model P_4.1 [this phase and the previous iterate]
Model Validation
• Review of model (internal team members and externals)
• Review of plausible behaves of model
• Retrospective test (use of historical data to reconstruct past and
determine how well the solution would have performed)
• Documentation of validation process (for increasing confidence
in model and identify issues in the future)
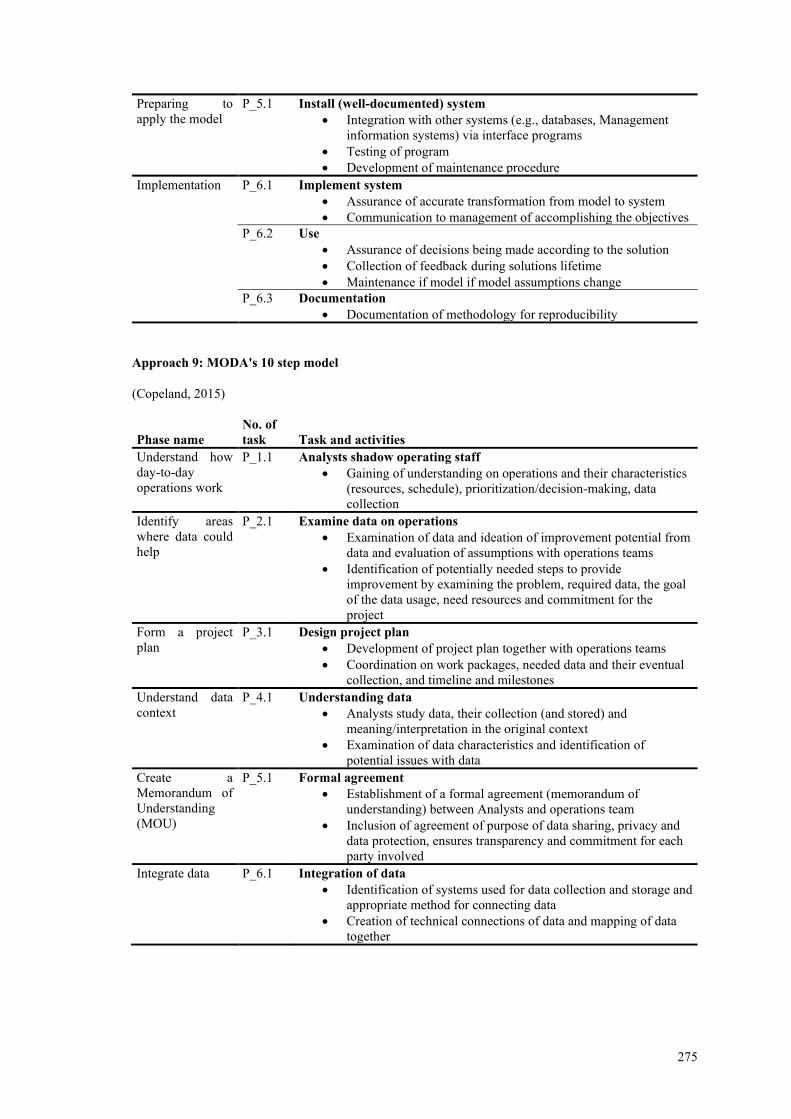
275
Preparing to
apply the model
P_5.1 Install (well-documented) system
• Integration with other systems (e.g., databases, Management
information systems) via interface programs
• Testing of program
• Development of maintenance procedure
Implementation P_6.1 Implement system
• Assurance of accurate transformation from model to system
• Communication to management of accomplishing the objectives
P_6.2 Use
• Assurance of decisions being made according to the solution
• Collection of feedback during solutions lifetime
• Maintenance if model if model assumptions change
P_6.3 Documentation
• Documentation of methodology for reproducibility
Approach 9: MODA's 10 step model
(Copeland, 2015)
Phase name
No. of
task Task and activities
Understand how
day-to-day
operations work
P_1.1 Analysts shadow operating staff
• Gaining of understanding on operations and their characteristics
(resources, schedule), prioritization/decision-making, data
collection
Identify areas
where data could
help
P_2.1 Examine data on operations
• Examination of data and ideation of improvement potential from
data and evaluation of assumptions with operations teams
• Identification of potentially needed steps to provide
improvement by examining the problem, required data, the goal
of the data usage, need resources and commitment for the
project
Form a project
plan
P_3.1 Design project plan
• Development of project plan together with operations teams
• Coordination on work packages, needed data and their eventual
collection, and timeline and milestones
Understand data
context
P_4.1 Understanding data
• Analysts study data, their collection (and stored) and
meaning/interpretation in the original context
• Examination of data characteristics and identification of
potential issues with data
Create a
Memorandum of
Understanding
(MOU)
P_5.1 Formal agreement
• Establishment of a formal agreement (memorandum of
understanding) between Analysts and operations team
• Inclusion of agreement of purpose of data sharing, privacy and
data protection, ensures transparency and commitment for each
party involved
Integrate data P_6.1 Integration of data
• Identification of systems used for data collection and storage and
appropriate method for connecting data
• Creation of technical connections of data and mapping of data
together
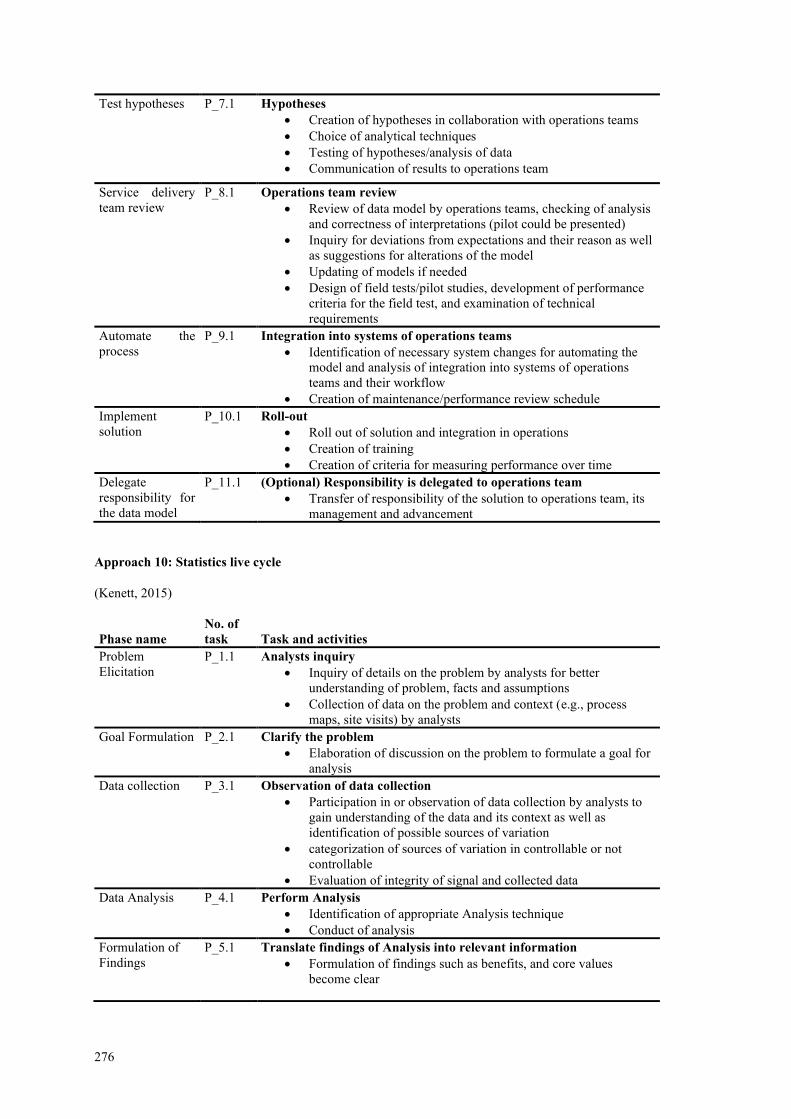
276
Test hypotheses P_7.1 Hypotheses
• Creation of hypotheses in collaboration with operations teams
• Choice of analytical techniques
• Testing of hypotheses/analysis of data
• Communication of results to operations team
Service delivery
team review
P_8.1 Operations team review
• Review of data model by operations teams, checking of analysis
and correctness of interpretations (pilot could be presented)
• Inquiry for deviations from expectations and their reason as well
as suggestions for alterations of the model
• Updating of models if needed
• Design of field tests/pilot studies, development of performance
criteria for the field test, and examination of technical
requirements
Automate the
process
P_9.1 Integration into systems of operations teams
• Identification of necessary system changes for automating the
model and analysis of integration into systems of operations
teams and their workflow
• Creation of maintenance/performance review schedule
Implement
solution
P_10.1 Roll-out
• Roll out of solution and integration in operations
• Creation of training
• Creation of criteria for measuring performance over time
Delegate
responsibility for
the data model
P_11.1 (Optional) Responsibility is delegated to operations team
• Transfer of responsibility of the solution to operations team, its
management and advancement
Approach 10: Statistics live cycle
(Kenett, 2015)
Phase name
No. of
task Task and activities
Problem
Elicitation
P_1.1 Analysts inquiry
• Inquiry of details on the problem by analysts for better
understanding of problem, facts and assumptions
• Collection of data on the problem and context (e.g., process
maps, site visits) by analysts
Goal Formulation P_2.1 Clarify the problem
• Elaboration of discussion on the problem to formulate a goal for
analysis
Data collection P_3.1 Observation of data collection
• Participation in or observation of data collection by analysts to
gain understanding of the data and its context as well as
identification of possible sources of variation
• categorization of sources of variation in controllable or not
controllable
• Evaluation of integrity of signal and collected data
Data Analysis P_4.1 Perform Analysis
• Identification of appropriate Analysis technique
• Conduct of analysis
Formulation of
Findings
P_5.1 Translate findings of Analysis into relevant information
• Formulation of findings such as benefits, and core values
become clear
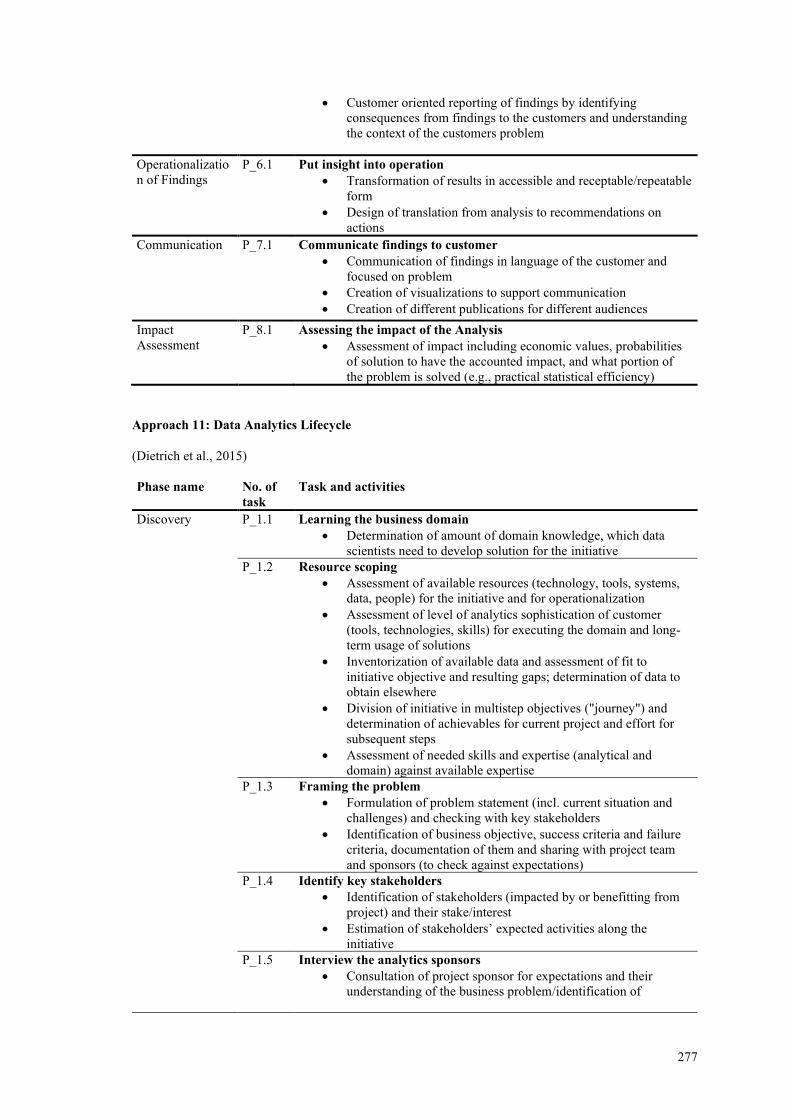
277
• Customer oriented reporting of findings by identifying
consequences from findings to the customers and understanding
the context of the customers problem
Operationalizatio
n of Findings
P_6.1 Put insight into operation
• Transformation of results in accessible and receptable/repeatable
form
• Design of translation from analysis to recommendations on
actions
Communication P_7.1 Communicate findings to customer
• Communication of findings in language of the customer and
focused on problem
• Creation of visualizations to support communication
• Creation of different publications for different audiences
Impact
Assessment
P_8.1 Assessing the impact of the Analysis
• Assessment of impact including economic values, probabilities
of solution to have the accounted impact, and what portion of
the problem is solved (e.g., practical statistical efficiency)
Approach 11: Data Analytics Lifecycle
(Dietrich et al., 2015)
Phase name No. of
task
Task and activities
Discovery P_1.1 Learning the business domain
• Determination of amount of domain knowledge, which data
scientists need to develop solution for the initiative
P_1.2 Resource scoping
• Assessment of available resources (technology, tools, systems,
data, people) for the initiative and for operationalization
• Assessment of level of analytics sophistication of customer
(tools, technologies, skills) for executing the domain and long-
term usage of solutions
• Inventorization of available data and assessment of fit to
initiative objective and resulting gaps; determination of data to
obtain elsewhere
• Division of initiative in multistep objectives ("journey") and
determination of achievables for current project and effort for
subsequent steps
• Assessment of needed skills and expertise (analytical and
domain) against available expertise
P_1.3 Framing the problem
• Formulation of problem statement (incl. current situation and
challenges) and checking with key stakeholders
• Identification of business objective, success criteria and failure
criteria, documentation of them and sharing with project team
and sponsors (to check against expectations)
P_1.4 Identify key stakeholders
• Identification of stakeholders (impacted by or benefitting from
project) and their stake/interest
• Estimation of stakeholders’ expected activities along the
initiative
P_1.5 Interview the analytics sponsors
• Consultation of project sponsor for expectations and their
understanding of the business problem/identification of
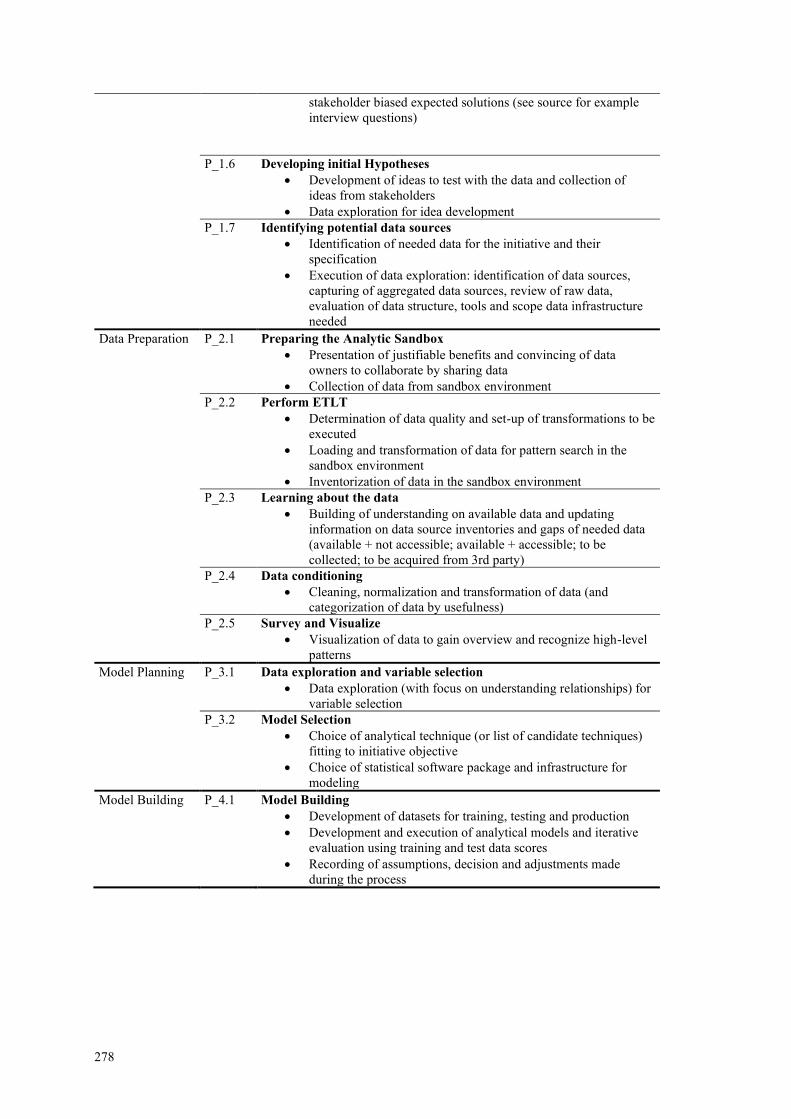
278
stakeholder biased expected solutions (see source for example
interview questions)
P_1.6 Developing initial Hypotheses
• Development of ideas to test with the data and collection of
ideas from stakeholders
• Data exploration for idea development
P_1.7 Identifying potential data sources
• Identification of needed data for the initiative and their
specification
• Execution of data exploration: identification of data sources,
capturing of aggregated data sources, review of raw data,
evaluation of data structure, tools and scope data infrastructure
needed
Data Preparation P_2.1 Preparing the Analytic Sandbox
• Presentation of justifiable benefits and convincing of data
owners to collaborate by sharing data
• Collection of data from sandbox environment
P_2.2 Perform ETLT
• Determination of data quality and set-up of transformations to be
executed
• Loading and transformation of data for pattern search in the
sandbox environment
• Inventorization of data in the sandbox environment
P_2.3 Learning about the data
• Building of understanding on available data and updating
information on data source inventories and gaps of needed data
(available + not accessible; available + accessible; to be
collected; to be acquired from 3rd party)
P_2.4 Data conditioning
• Cleaning, normalization and transformation of data (and
categorization of data by usefulness)
P_2.5 Survey and Visualize
• Visualization of data to gain overview and recognize high-level
patterns
Model Planning P_3.1 Data exploration and variable selection
• Data exploration (with focus on understanding relationships) for
variable selection
P_3.2 Model Selection
• Choice of analytical technique (or list of candidate techniques)
fitting to initiative objective
• Choice of statistical software package and infrastructure for
modeling
Model Building P_4.1 Model Building
• Development of datasets for training, testing and production
• Development and execution of analytical models and iterative
evaluation using training and test data scores
• Recording of assumptions, decision and adjustments made
during the process
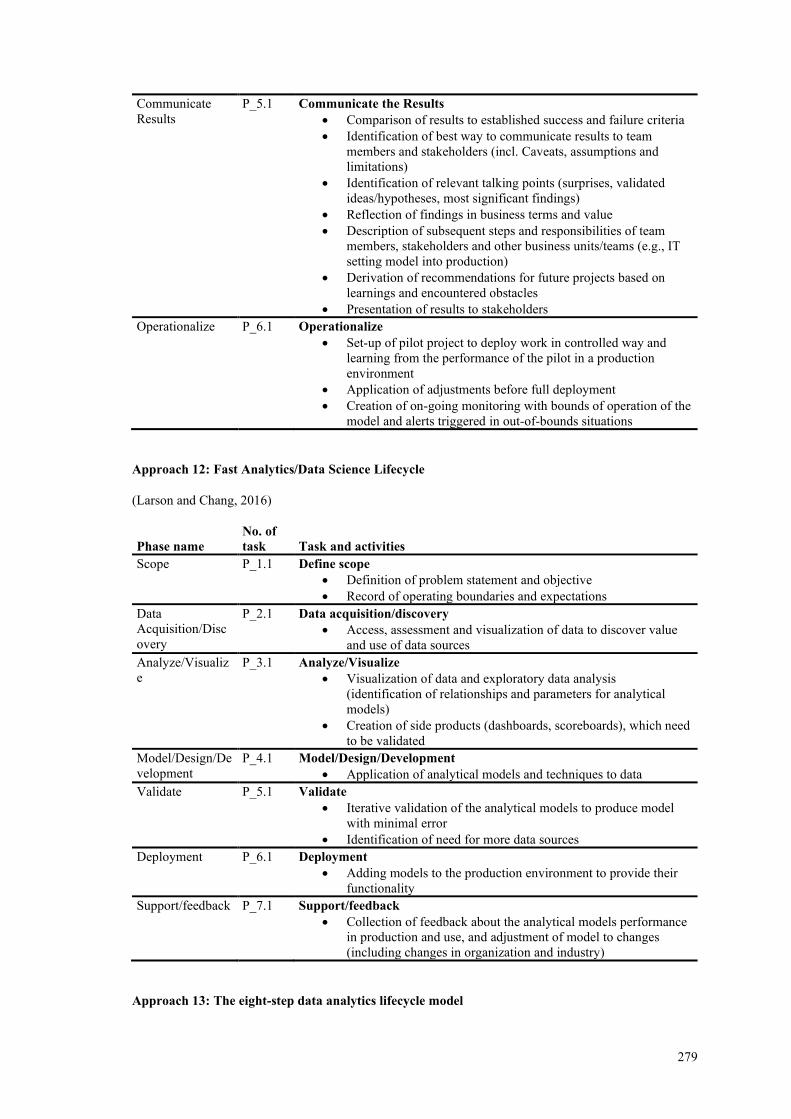
279
Communicate
Results
P_5.1 Communicate the Results
• Comparison of results to established success and failure criteria
• Identification of best way to communicate results to team
members and stakeholders (incl. Caveats, assumptions and
limitations)
• Identification of relevant talking points (surprises, validated
ideas/hypotheses, most significant findings)
• Reflection of findings in business terms and value
• Description of subsequent steps and responsibilities of team
members, stakeholders and other business units/teams (e.g., IT
setting model into production)
• Derivation of recommendations for future projects based on
learnings and encountered obstacles
• Presentation of results to stakeholders
Operationalize P_6.1 Operationalize
• Set-up of pilot project to deploy work in controlled way and
learning from the performance of the pilot in a production
environment
• Application of adjustments before full deployment
• Creation of on-going monitoring with bounds of operation of the
model and alerts triggered in out-of-bounds situations
Approach 12: Fast Analytics/Data Science Lifecycle
(Larson and Chang, 2016)
Phase name
No. of
task Task and activities
Scope P_1.1 Define scope
• Definition of problem statement and objective
• Record of operating boundaries and expectations
Data
Acquisition/Disc
overy
P_2.1 Data acquisition/discovery
• Access, assessment and visualization of data to discover value
and use of data sources
Analyze/Visualiz
e
P_3.1 Analyze/Visualize
• Visualization of data and exploratory data analysis
(identification of relationships and parameters for analytical
models)
• Creation of side products (dashboards, scoreboards), which need
to be validated
Model/Design/De
velopment
P_4.1 Model/Design/Development
• Application of analytical models and techniques to data
Validate P_5.1 Validate
• Iterative validation of the analytical models to produce model
with minimal error
• Identification of need for more data sources
Deployment P_6.1 Deployment
• Adding models to the production environment to provide their
functionality
Support/feedback P_7.1 Support/feedback
• Collection of feedback about the analytical models performance
in production and use, and adjustment of model to changes
(including changes in organization and industry)
Approach 13: The eight-step data analytics lifecycle model
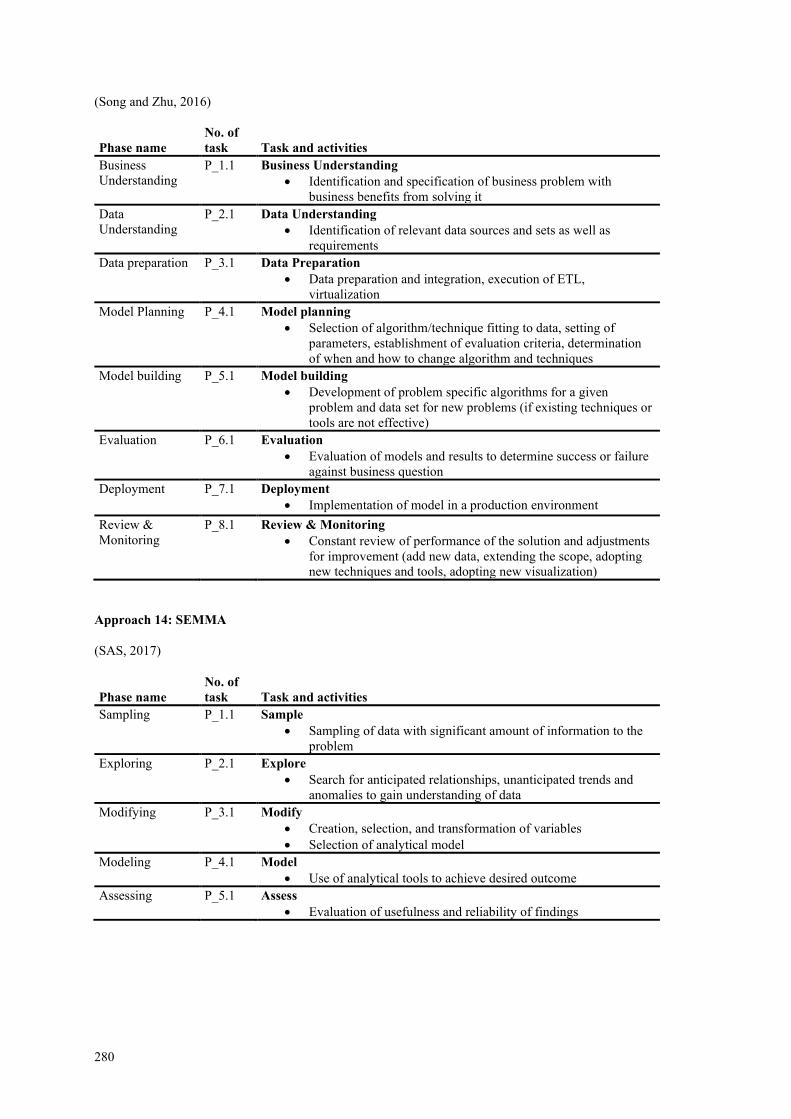
280
(Song and Zhu, 2016)
Phase name
No. of
task Task and activities
Business
Understanding
P_1.1 Business Understanding
• Identification and specification of business problem with
business benefits from solving it
Data
Understanding
P_2.1 Data Understanding
• Identification of relevant data sources and sets as well as
requirements
Data preparation P_3.1 Data Preparation
• Data preparation and integration, execution of ETL,
virtualization
Model Planning P_4.1 Model planning
• Selection of algorithm/technique fitting to data, setting of
parameters, establishment of evaluation criteria, determination
of when and how to change algorithm and techniques
Model building P_5.1 Model building
• Development of problem specific algorithms for a given
problem and data set for new problems (if existing techniques or
tools are not effective)
Evaluation P_6.1 Evaluation
• Evaluation of models and results to determine success or failure
against business question
Deployment P_7.1 Deployment
• Implementation of model in a production environment
Review &
Monitoring
P_8.1 Review & Monitoring
• Constant review of performance of the solution and adjustments
for improvement (add new data, extending the scope, adopting
new techniques and tools, adopting new visualization)
Approach 14: SEMMA
(SAS, 2017)
Phase name
No. of
task Task and activities
Sampling P_1.1 Sample
• Sampling of data with significant amount of information to the
problem
Exploring P_2.1 Explore
• Search for anticipated relationships, unanticipated trends and
anomalies to gain understanding of data
Modifying P_3.1 Modify
• Creation, selection, and transformation of variables
• Selection of analytical model
Modeling P_4.1 Model
• Use of analytical tools to achieve desired outcome
Assessing P_5.1 Assess
• Evaluation of usefulness and reliability of findings
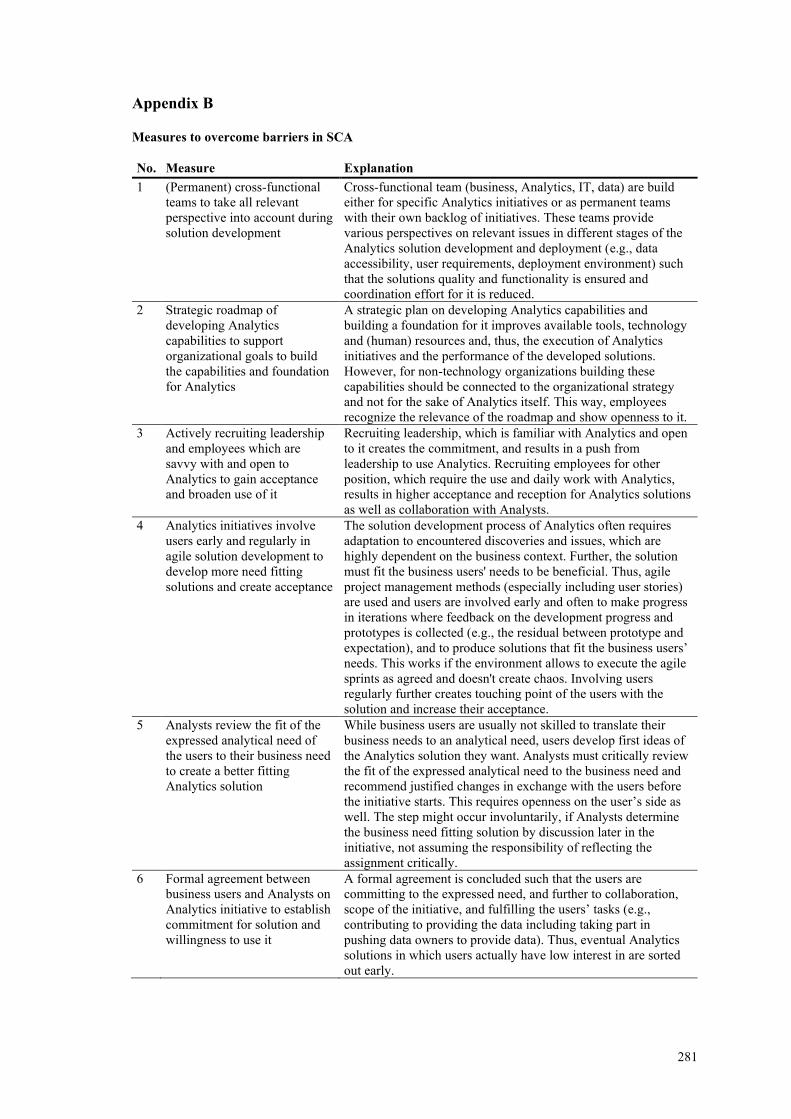
281
Appendix B
Measures to overcome barriers in SCA
No. Measure Explanation
1 (Permanent) cross-functional
teams to take all relevant
perspective into account during
solution development
Cross-functional team (business, Analytics, IT, data) are build
either for specific Analytics initiatives or as permanent teams
with their own backlog of initiatives. These teams provide
various perspectives on relevant issues in different stages of the
Analytics solution development and deployment (e.g., data
accessibility, user requirements, deployment environment) such
that the solutions quality and functionality is ensured and
coordination effort for it is reduced.
2 Strategic roadmap of
developing Analytics
capabilities to support
organizational goals to build
the capabilities and foundation
for Analytics
A strategic plan on developing Analytics capabilities and
building a foundation for it improves available tools, technology
and (human) resources and, thus, the execution of Analytics
initiatives and the performance of the developed solutions.
However, for non-technology organizations building these
capabilities should be connected to the organizational strategy
and not for the sake of Analytics itself. This way, employees
recognize the relevance of the roadmap and show openness to it.
3 Actively recruiting leadership
and employees which are
savvy with and open to
Analytics to gain acceptance
and broaden use of it
Recruiting leadership, which is familiar with Analytics and open
to it creates the commitment, and results in a push from
leadership to use Analytics. Recruiting employees for other
position, which require the use and daily work with Analytics,
results in higher acceptance and reception for Analytics solutions
as well as collaboration with Analysts.
4 Analytics initiatives involve
users early and regularly in
agile solution development to
develop more need fitting
solutions and create acceptance
The solution development process of Analytics often requires
adaptation to encountered discoveries and issues, which are
highly dependent on the business context. Further, the solution
must fit the business users' needs to be beneficial. Thus, agile
project management methods (especially including user stories)
are used and users are involved early and often to make progress
in iterations where feedback on the development progress and
prototypes is collected (e.g., the residual between prototype and
expectation), and to produce solutions that fit the business users’
needs. This works if the environment allows to execute the agile
sprints as agreed and doesn't create chaos. Involving users
regularly further creates touching point of the users with the
solution and increase their acceptance.
5 Analysts review the fit of the
expressed analytical need of
the users to their business need
to create a better fitting
Analytics solution
While business users are usually not skilled to translate their
business needs to an analytical need, users develop first ideas of
the Analytics solution they want. Analysts must critically review
the fit of the expressed analytical need to the business need and
recommend justified changes in exchange with the users before
the initiative starts. This requires openness on the user’s side as
well. The step might occur involuntarily, if Analysts determine
the business need fitting solution by discussion later in the
initiative, not assuming the responsibility of reflecting the
assignment critically.
6 Formal agreement between
business users and Analysts on
Analytics initiative to establish
commitment for solution and
willingness to use it
A formal agreement is concluded such that the users are
committing to the expressed need, and further to collaboration,
scope of the initiative, and fulfilling the users’ tasks (e.g.,
contributing to providing the data including taking part in
pushing data owners to provide data). Thus, eventual Analytics
solutions in which users actually have low interest in are sorted
out early.
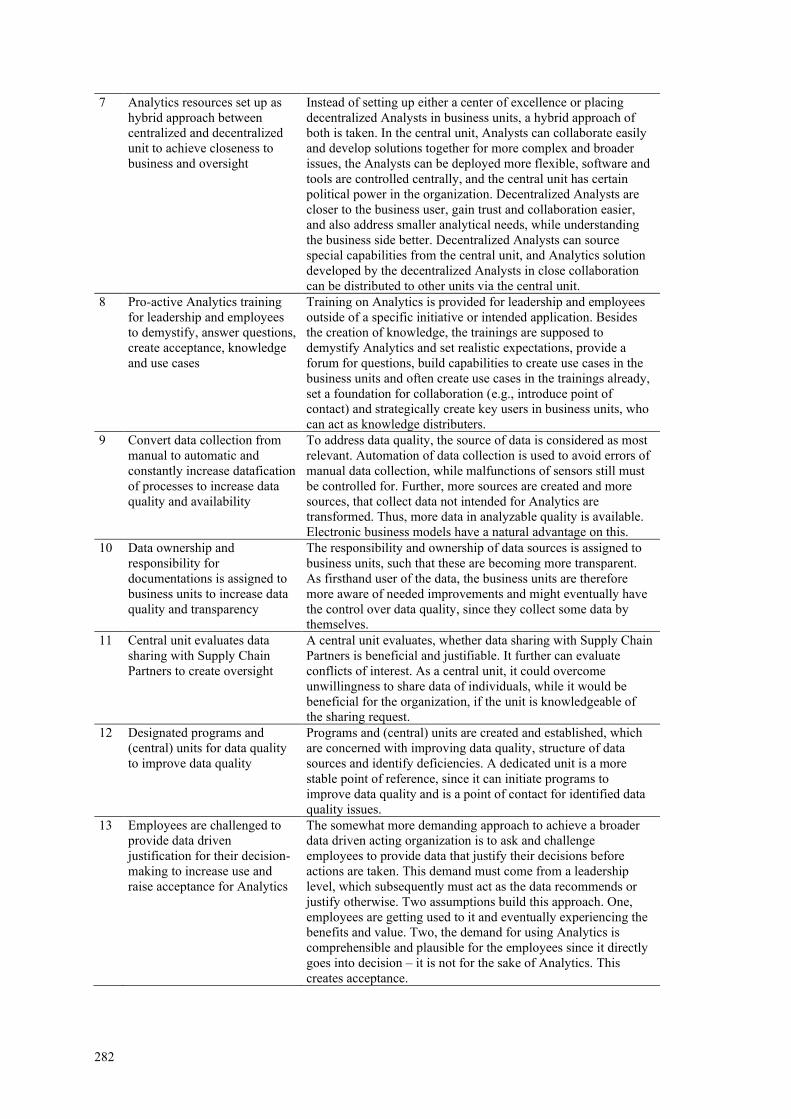
282
7 Analytics resources set up as
hybrid approach between
centralized and decentralized
unit to achieve closeness to
business and oversight
Instead of setting up either a center of excellence or placing
decentralized Analysts in business units, a hybrid approach of
both is taken. In the central unit, Analysts can collaborate easily
and develop solutions together for more complex and broader
issues, the Analysts can be deployed more flexible, software and
tools are controlled centrally, and the central unit has certain
political power in the organization. Decentralized Analysts are
closer to the business user, gain trust and collaboration easier,
and also address smaller analytical needs, while understanding
the business side better. Decentralized Analysts can source
special capabilities from the central unit, and Analytics solution
developed by the decentralized Analysts in close collaboration
can be distributed to other units via the central unit.
8 Pro-active Analytics training
for leadership and employees
to demystify, answer questions,
create acceptance, knowledge
and use cases
Training on Analytics is provided for leadership and employees
outside of a specific initiative or intended application. Besides
the creation of knowledge, the trainings are supposed to
demystify Analytics and set realistic expectations, provide a
forum for questions, build capabilities to create use cases in the
business units and often create use cases in the trainings already,
set a foundation for collaboration (e.g., introduce point of
contact) and strategically create key users in business units, who
can act as knowledge distributers.
9 Convert data collection from
manual to automatic and
constantly increase datafication
of processes to increase data
quality and availability
To address data quality, the source of data is considered as most
relevant. Automation of data collection is used to avoid errors of
manual data collection, while malfunctions of sensors still must
be controlled for. Further, more sources are created and more
sources, that collect data not intended for Analytics are
transformed. Thus, more data in analyzable quality is available.
Electronic business models have a natural advantage on this.
10 Data ownership and
responsibility for
documentations is assigned to
business units to increase data
quality and transparency
The responsibility and ownership of data sources is assigned to
business units, such that these are becoming more transparent.
As firsthand user of the data, the business units are therefore
more aware of needed improvements and might eventually have
the control over data quality, since they collect some data by
themselves.
11 Central unit evaluates data
sharing with Supply Chain
Partners to create oversight
A central unit evaluates, whether data sharing with Supply Chain
Partners is beneficial and justifiable. It further can evaluate
conflicts of interest. As a central unit, it could overcome
unwillingness to share data of individuals, while it would be
beneficial for the organization, if the unit is knowledgeable of
the sharing request.
12 Designated programs and
(central) units for data quality
to improve data quality
Programs and (central) units are created and established, which
are concerned with improving data quality, structure of data
sources and identify deficiencies. A dedicated unit is a more
stable point of reference, since it can initiate programs to
improve data quality and is a point of contact for identified data
quality issues.
13 Employees are challenged to
provide data driven
justification for their decision-
making to increase use and
raise acceptance for Analytics
The somewhat more demanding approach to achieve a broader
data driven acting organization is to ask and challenge
employees to provide data that justify their decisions before
actions are taken. This demand must come from a leadership
level, which subsequently must act as the data recommends or
justify otherwise. Two assumptions build this approach. One,
employees are getting used to it and eventually experiencing the
benefits and value. Two, the demand for using Analytics is
comprehensible and plausible for the employees since it directly
goes into decision – it is not for the sake of Analytics. This
creates acceptance.
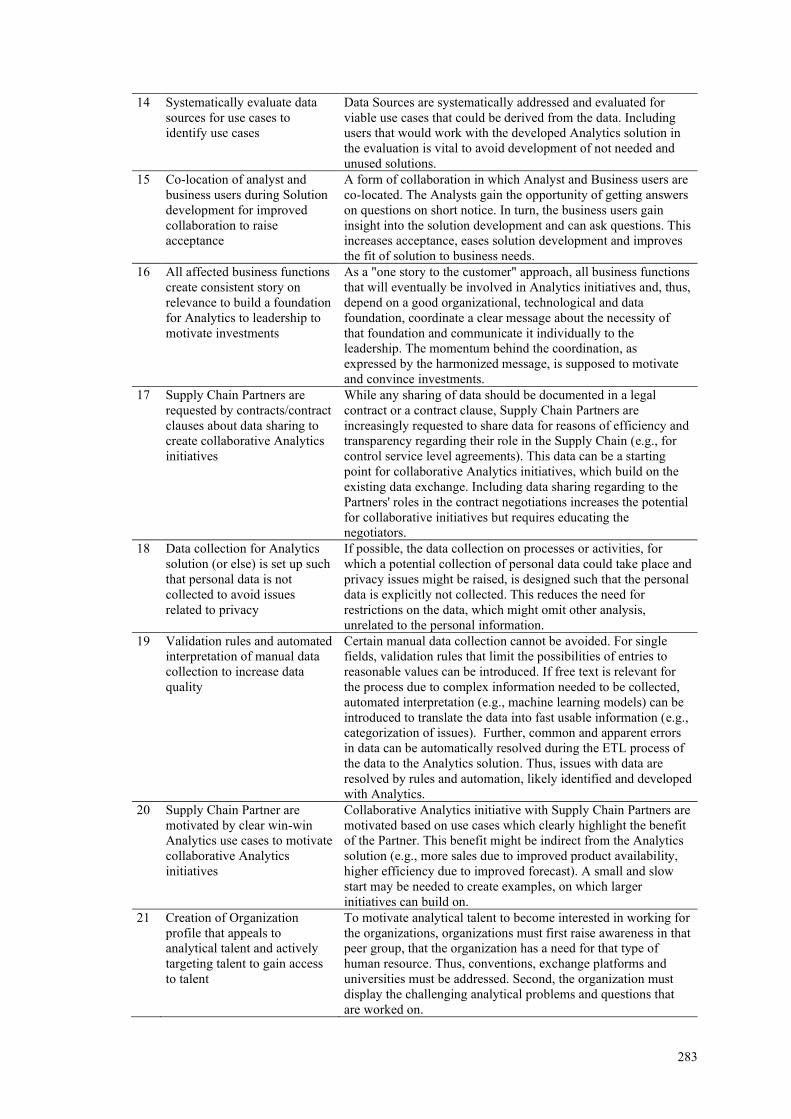
283
14 Systematically evaluate data
sources for use cases to
identify use cases
Data Sources are systematically addressed and evaluated for
viable use cases that could be derived from the data. Including
users that would work with the developed Analytics solution in
the evaluation is vital to avoid development of not needed and
unused solutions.
15 Co-location of analyst and
business users during Solution
development for improved
collaboration to raise
acceptance
A form of collaboration in which Analyst and Business users are
co-located. The Analysts gain the opportunity of getting answers
on questions on short notice. In turn, the business users gain
insight into the solution development and can ask questions. This
increases acceptance, eases solution development and improves
the fit of solution to business needs.
16 All affected business functions
create consistent story on
relevance to build a foundation
for Analytics to leadership to
motivate investments
As a "one story to the customer" approach, all business functions
that will eventually be involved in Analytics initiatives and, thus,
depend on a good organizational, technological and data
foundation, coordinate a clear message about the necessity of
that foundation and communicate it individually to the
leadership. The momentum behind the coordination, as
expressed by the harmonized message, is supposed to motivate
and convince investments.
17 Supply Chain Partners are
requested by contracts/contract
clauses about data sharing to
create collaborative Analytics
initiatives
While any sharing of data should be documented in a legal
contract or a contract clause, Supply Chain Partners are
increasingly requested to share data for reasons of efficiency and
transparency regarding their role in the Supply Chain (e.g., for
control service level agreements). This data can be a starting
point for collaborative Analytics initiatives, which build on the
existing data exchange. Including data sharing regarding to the
Partners' roles in the contract negotiations increases the potential
for collaborative initiatives but requires educating the
negotiators.
18 Data collection for Analytics
solution (or else) is set up such
that personal data is not
collected to avoid issues
related to privacy
If possible, the data collection on processes or activities, for
which a potential collection of personal data could take place and
privacy issues might be raised, is designed such that the personal
data is explicitly not collected. This reduces the need for
restrictions on the data, which might omit other analysis,
unrelated to the personal information.
19 Validation rules and automated
interpretation of manual data
collection to increase data
quality
Certain manual data collection cannot be avoided. For single
fields, validation rules that limit the possibilities of entries to
reasonable values can be introduced. If free text is relevant for
the process due to complex information needed to be collected,
automated interpretation (e.g., machine learning models) can be
introduced to translate the data into fast usable information (e.g.,
categorization of issues). Further, common and apparent errors
in data can be automatically resolved during the ETL process of
the data to the Analytics solution. Thus, issues with data are
resolved by rules and automation, likely identified and developed
with Analytics.
20 Supply Chain Partner are
motivated by clear win-win
Analytics use cases to motivate
collaborative Analytics
initiatives
Collaborative Analytics initiative with Supply Chain Partners are
motivated based on use cases which clearly highlight the benefit
of the Partner. This benefit might be indirect from the Analytics
solution (e.g., more sales due to improved product availability,
higher efficiency due to improved forecast). A small and slow
start may be needed to create examples, on which larger
initiatives can build on.
21 Creation of Organization
profile that appeals to
analytical talent and actively
targeting talent to gain access
to talent
To motivate analytical talent to become interested in working for
the organizations, organizations must first raise awareness in that
peer group, that the organization has a need for that type of
human resource. Thus, conventions, exchange platforms and
universities must be addressed. Second, the organization must
display the challenging analytical problems and questions that
are worked on.
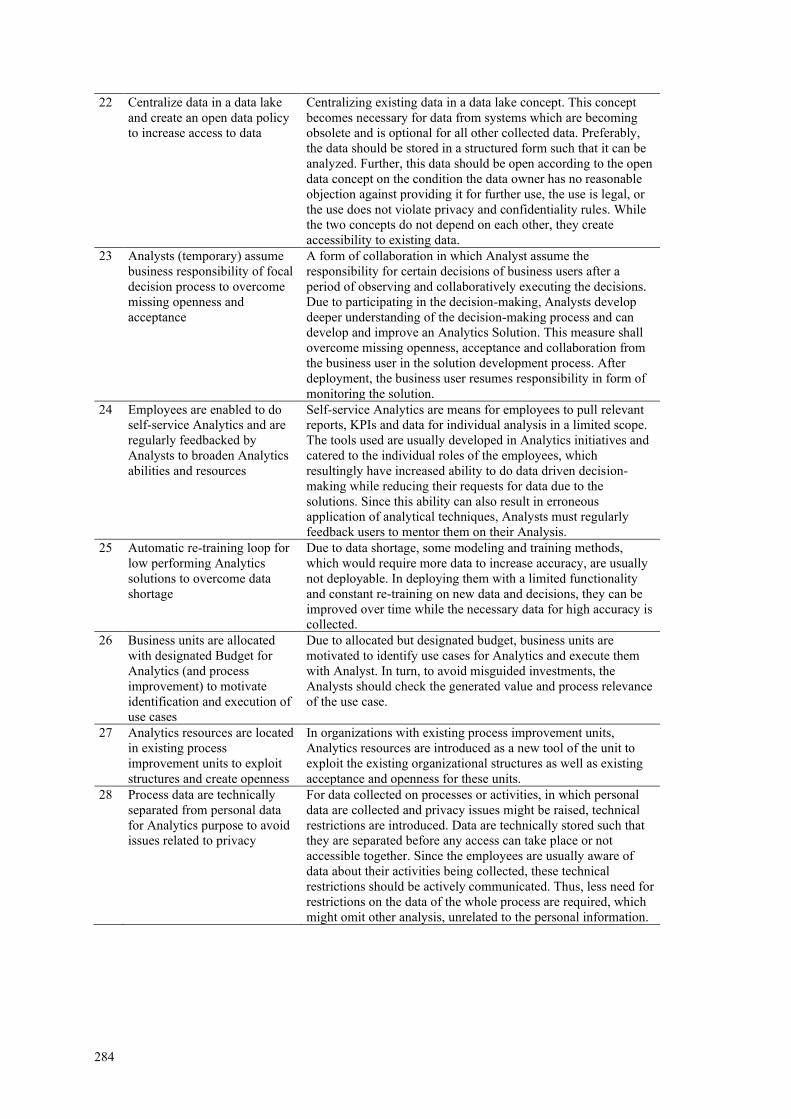
284
22 Centralize data in a data lake
and create an open data policy
to increase access to data
Centralizing existing data in a data lake concept. This concept
becomes necessary for data from systems which are becoming
obsolete and is optional for all other collected data. Preferably,
the data should be stored in a structured form such that it can be
analyzed. Further, this data should be open according to the open
data concept on the condition the data owner has no reasonable
objection against providing it for further use, the use is legal, or
the use does not violate privacy and confidentiality rules. While
the two concepts do not depend on each other, they create
accessibility to existing data.
23 Analysts (temporary) assume
business responsibility of focal
decision process to overcome
missing openness and
acceptance
A form of collaboration in which Analyst assume the
responsibility for certain decisions of business users after a
period of observing and collaboratively executing the decisions.
Due to participating in the decision-making, Analysts develop
deeper understanding of the decision-making process and can
develop and improve an Analytics Solution. This measure shall
overcome missing openness, acceptance and collaboration from
the business user in the solution development process. After
deployment, the business user resumes responsibility in form of
monitoring the solution.
24 Employees are enabled to do
self-service Analytics and are
regularly feedbacked by
Analysts to broaden Analytics
abilities and resources
Self-service Analytics are means for employees to pull relevant
reports, KPIs and data for individual analysis in a limited scope.
The tools used are usually developed in Analytics initiatives and
catered to the individual roles of the employees, which
resultingly have increased ability to do data driven decision-
making while reducing their requests for data due to the
solutions. Since this ability can also result in erroneous
application of analytical techniques, Analysts must regularly
feedback users to mentor them on their Analysis.
25 Automatic re-training loop for
low performing Analytics
solutions to overcome data
shortage
Due to data shortage, some modeling and training methods,
which would require more data to increase accuracy, are usually
not deployable. In deploying them with a limited functionality
and constant re-training on new data and decisions, they can be
improved over time while the necessary data for high accuracy is
collected.
26 Business units are allocated
with designated Budget for
Analytics (and process
improvement) to motivate
identification and execution of
use cases
Due to allocated but designated budget, business units are
motivated to identify use cases for Analytics and execute them
with Analyst. In turn, to avoid misguided investments, the
Analysts should check the generated value and process relevance
of the use case.
27 Analytics resources are located
in existing process
improvement units to exploit
structures and create openness
In organizations with existing process improvement units,
Analytics resources are introduced as a new tool of the unit to
exploit the existing organizational structures as well as existing
acceptance and openness for these units.
28 Process data are technically
separated from personal data
for Analytics purpose to avoid
issues related to privacy
For data collected on processes or activities, in which personal
data are collected and privacy issues might be raised, technical
restrictions are introduced. Data are technically stored such that
they are separated before any access can take place or not
accessible together. Since the employees are usually aware of
data about their activities being collected, these technical
restrictions should be actively communicated. Thus, less need for
restrictions on the data of the whole process are required, which
might omit other analysis, unrelated to the personal information.
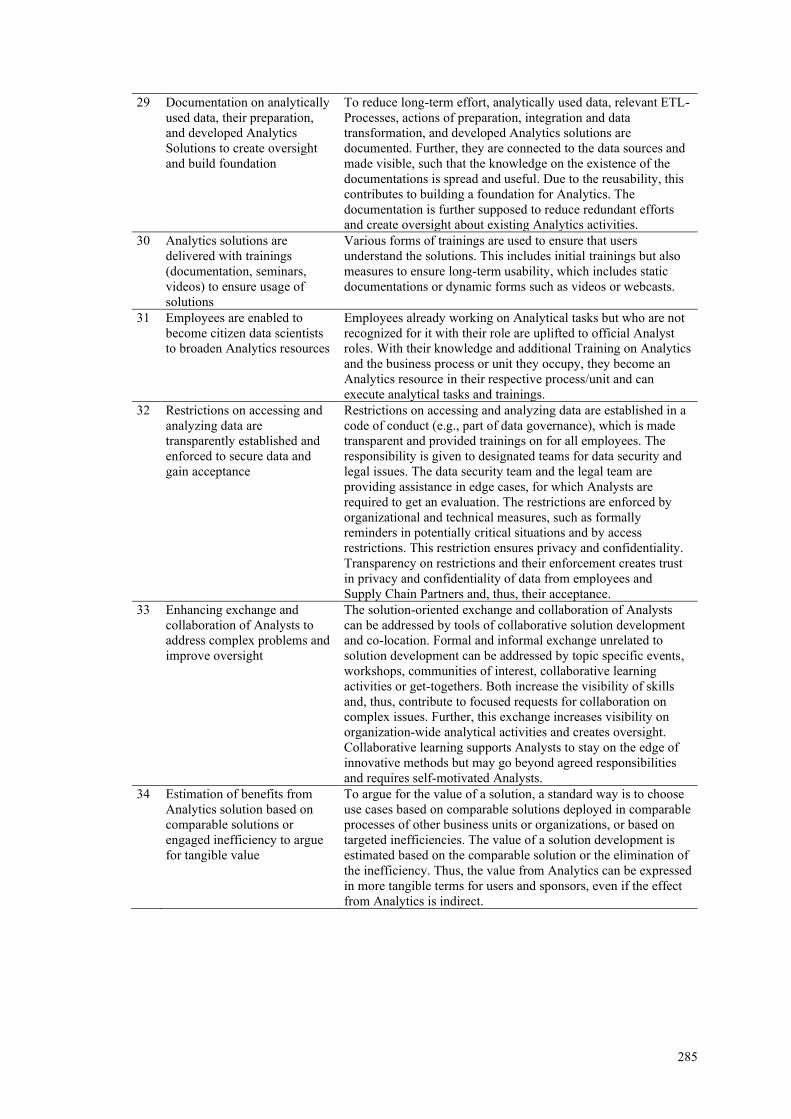
285
29 Documentation on analytically
used data, their preparation,
and developed Analytics
Solutions to create oversight
and build foundation
To reduce long-term effort, analytically used data, relevant ETL-
Processes, actions of preparation, integration and data
transformation, and developed Analytics solutions are
documented. Further, they are connected to the data sources and
made visible, such that the knowledge on the existence of the
documentations is spread and useful. Due to the reusability, this
contributes to building a foundation for Analytics. The
documentation is further supposed to reduce redundant efforts
and create oversight about existing Analytics activities.
30 Analytics solutions are
delivered with trainings
(documentation, seminars,
videos) to ensure usage of
solutions
Various forms of trainings are used to ensure that users
understand the solutions. This includes initial trainings but also
measures to ensure long-term usability, which includes static
documentations or dynamic forms such as videos or webcasts.
31 Employees are enabled to
become citizen data scientists
to broaden Analytics resources
Employees already working on Analytical tasks but who are not
recognized for it with their role are uplifted to official Analyst
roles. With their knowledge and additional Training on Analytics
and the business process or unit they occupy, they become an
Analytics resource in their respective process/unit and can
execute analytical tasks and trainings.
32 Restrictions on accessing and
analyzing data are
transparently established and
enforced to secure data and
gain acceptance
Restrictions on accessing and analyzing data are established in a
code of conduct (e.g., part of data governance), which is made
transparent and provided trainings on for all employees. The
responsibility is given to designated teams for data security and
legal issues. The data security team and the legal team are
providing assistance in edge cases, for which Analysts are
required to get an evaluation. The restrictions are enforced by
organizational and technical measures, such as formally
reminders in potentially critical situations and by access
restrictions. This restriction ensures privacy and confidentiality.
Transparency on restrictions and their enforcement creates trust
in privacy and confidentiality of data from employees and
Supply Chain Partners and, thus, their acceptance.
33 Enhancing exchange and
collaboration of Analysts to
address complex problems and
improve oversight
The solution-oriented exchange and collaboration of Analysts
can be addressed by tools of collaborative solution development
and co-location. Formal and informal exchange unrelated to
solution development can be addressed by topic specific events,
workshops, communities of interest, collaborative learning
activities or get-togethers. Both increase the visibility of skills
and, thus, contribute to focused requests for collaboration on
complex issues. Further, this exchange increases visibility on
organization-wide analytical activities and creates oversight.
Collaborative learning supports Analysts to stay on the edge of
innovative methods but may go beyond agreed responsibilities
and requires self-motivated Analysts.
34 Estimation of benefits from
Analytics solution based on
comparable solutions or
engaged inefficiency to argue
for tangible value
To argue for the value of a solution, a standard way is to choose
use cases based on comparable solutions deployed in comparable
processes of other business units or organizations, or based on
targeted inefficiencies. The value of a solution development is
estimated based on the comparable solution or the elimination of
the inefficiency. Thus, the value from Analytics can be expressed
in more tangible terms for users and sponsors, even if the effect
from Analytics is indirect.
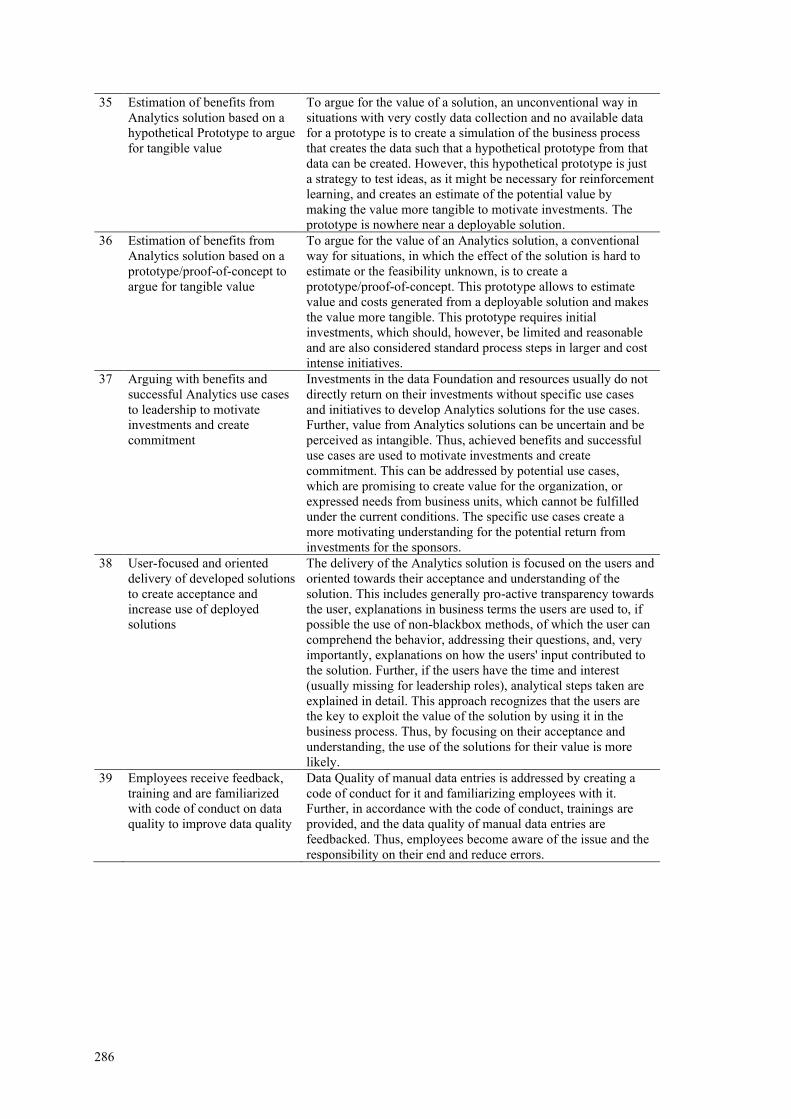
286
35 Estimation of benefits from
Analytics solution based on a
hypothetical Prototype to argue
for tangible value
To argue for the value of a solution, an unconventional way in
situations with very costly data collection and no available data
for a prototype is to create a simulation of the business process
that creates the data such that a hypothetical prototype from that
data can be created. However, this hypothetical prototype is just
a strategy to test ideas, as it might be necessary for reinforcement
learning, and creates an estimate of the potential value by
making the value more tangible to motivate investments. The
prototype is nowhere near a deployable solution.
36 Estimation of benefits from
Analytics solution based on a
prototype/proof-of-concept to
argue for tangible value
To argue for the value of an Analytics solution, a conventional
way for situations, in which the effect of the solution is hard to
estimate or the feasibility unknown, is to create a
prototype/proof-of-concept. This prototype allows to estimate
value and costs generated from a deployable solution and makes
the value more tangible. This prototype requires initial
investments, which should, however, be limited and reasonable
and are also considered standard process steps in larger and cost
intense initiatives.
37 Arguing with benefits and
successful Analytics use cases
to leadership to motivate
investments and create
commitment
Investments in the data Foundation and resources usually do not
directly return on their investments without specific use cases
and initiatives to develop Analytics solutions for the use cases.
Further, value from Analytics solutions can be uncertain and be
perceived as intangible. Thus, achieved benefits and successful
use cases are used to motivate investments and create
commitment. This can be addressed by potential use cases,
which are promising to create value for the organization, or
expressed needs from business units, which cannot be fulfilled
under the current conditions. The specific use cases create a
more motivating understanding for the potential return from
investments for the sponsors.
38 User-focused and oriented
delivery of developed solutions
to create acceptance and
increase use of deployed
solutions
The delivery of the Analytics solution is focused on the users and
oriented towards their acceptance and understanding of the
solution. This includes generally pro-active transparency towards
the user, explanations in business terms the users are used to, if
possible the use of non-blackbox methods, of which the user can
comprehend the behavior, addressing their questions, and, very
importantly, explanations on how the users' input contributed to
the solution. Further, if the users have the time and interest
(usually missing for leadership roles), analytical steps taken are
explained in detail. This approach recognizes that the users are
the key to exploit the value of the solution by using it in the
business process. Thus, by focusing on their acceptance and
understanding, the use of the solutions for their value is more
likely.
39 Employees receive feedback,
training and are familiarized
with code of conduct on data
quality to improve data quality
Data Quality of manual data entries is addressed by creating a
code of conduct for it and familiarizing employees with it.
Further, in accordance with the code of conduct, trainings are
provided, and the data quality of manual data entries are
feedbacked. Thus, employees become aware of the issue and the
responsibility on their end and reduce errors.
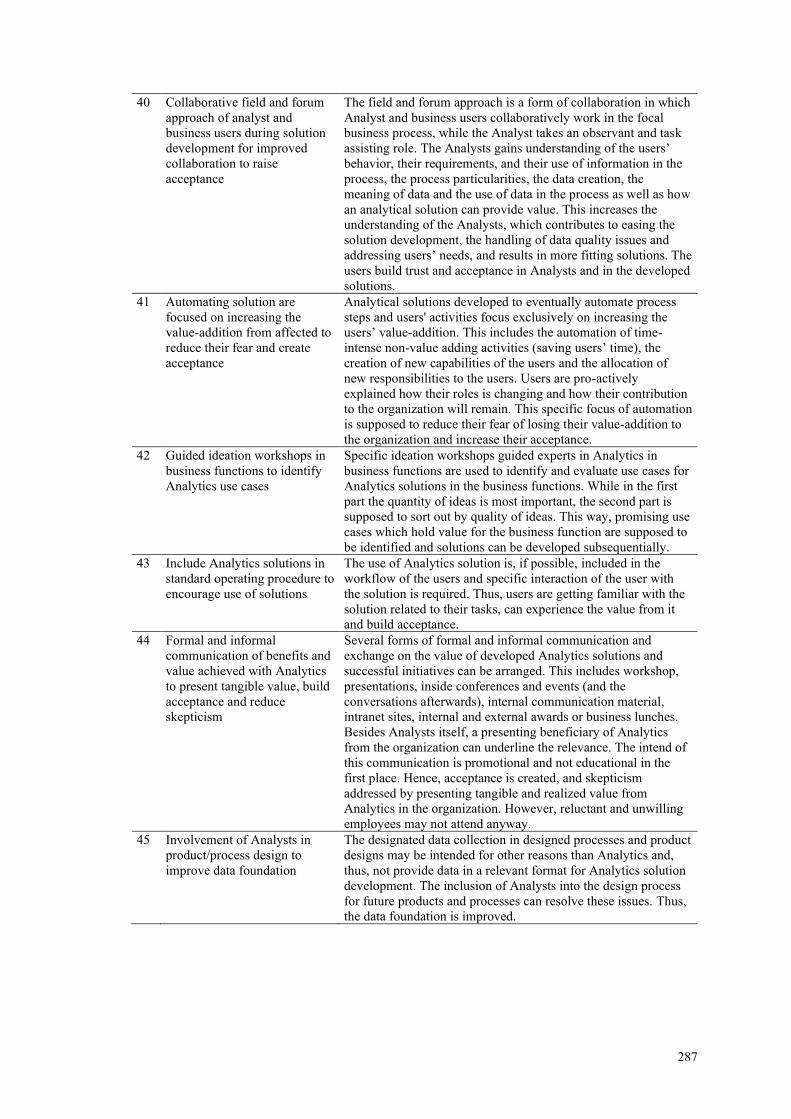
287
40 Collaborative field and forum
approach of analyst and
business users during solution
development for improved
collaboration to raise
acceptance
The field and forum approach is a form of collaboration in which
Analyst and business users collaboratively work in the focal
business process, while the Analyst takes an observant and task
assisting role. The Analysts gains understanding of the users’
behavior, their requirements, and their use of information in the
process, the process particularities, the data creation, the
meaning of data and the use of data in the process as well as how
an analytical solution can provide value. This increases the
understanding of the Analysts, which contributes to easing the
solution development, the handling of data quality issues and
addressing users’ needs, and results in more fitting solutions. The
users build trust and acceptance in Analysts and in the developed
solutions.
41 Automating solution are
focused on increasing the
value-addition from affected to
reduce their fear and create
acceptance
Analytical solutions developed to eventually automate process
steps and users' activities focus exclusively on increasing the
users’ value-addition. This includes the automation of time-
intense non-value adding activities (saving users’ time), the
creation of new capabilities of the users and the allocation of
new responsibilities to the users. Users are pro-actively
explained how their roles is changing and how their contribution
to the organization will remain. This specific focus of automation
is supposed to reduce their fear of losing their value-addition to
the organization and increase their acceptance.
42 Guided ideation workshops in
business functions to identify
Analytics use cases
Specific ideation workshops guided experts in Analytics in
business functions are used to identify and evaluate use cases for
Analytics solutions in the business functions. While in the first
part the quantity of ideas is most important, the second part is
supposed to sort out by quality of ideas. This way, promising use
cases which hold value for the business function are supposed to
be identified and solutions can be developed subsequentially.
43 Include Analytics solutions in
standard operating procedure to
encourage use of solutions
The use of Analytics solution is, if possible, included in the
workflow of the users and specific interaction of the user with
the solution is required. Thus, users are getting familiar with the
solution related to their tasks, can experience the value from it
and build acceptance.
44 Formal and informal
communication of benefits and
value achieved with Analytics
to present tangible value, build
acceptance and reduce
skepticism
Several forms of formal and informal communication and
exchange on the value of developed Analytics solutions and
successful initiatives can be arranged. This includes workshop,
presentations, inside conferences and events (and the
conversations afterwards), internal communication material,
intranet sites, internal and external awards or business lunches.
Besides Analysts itself, a presenting beneficiary of Analytics
from the organization can underline the relevance. The intend of
this communication is promotional and not educational in the
first place. Hence, acceptance is created, and skepticism
addressed by presenting tangible and realized value from
Analytics in the organization. However, reluctant and unwilling
employees may not attend anyway.
45 Involvement of Analysts in
product/process design to
improve data foundation
The designated data collection in designed processes and product
designs may be intended for other reasons than Analytics and,
thus, not provide data in a relevant format for Analytics solution
development. The inclusion of Analysts into the design process
for future products and processes can resolve these issues. Thus,
the data foundation is improved.
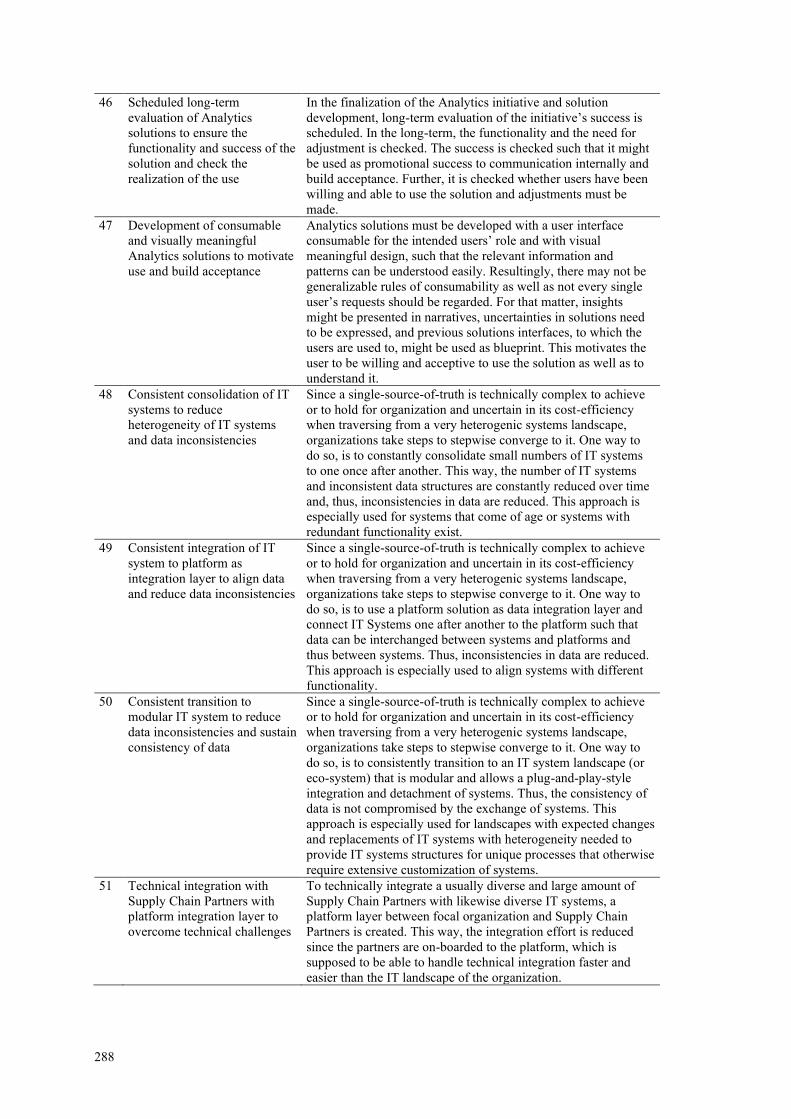
288
46 Scheduled long-term
evaluation of Analytics
solutions to ensure the
functionality and success of the
solution and check the
realization of the use
In the finalization of the Analytics initiative and solution
development, long-term evaluation of the initiative’s success is
scheduled. In the long-term, the functionality and the need for
adjustment is checked. The success is checked such that it might
be used as promotional success to communication internally and
build acceptance. Further, it is checked whether users have been
willing and able to use the solution and adjustments must be
made.
47 Development of consumable
and visually meaningful
Analytics solutions to motivate
use and build acceptance
Analytics solutions must be developed with a user interface
consumable for the intended users’ role and with visual
meaningful design, such that the relevant information and
patterns can be understood easily. Resultingly, there may not be
generalizable rules of consumability as well as not every single
user’s requests should be regarded. For that matter, insights
might be presented in narratives, uncertainties in solutions need
to be expressed, and previous solutions interfaces, to which the
users are used to, might be used as blueprint. This motivates the
user to be willing and acceptive to use the solution as well as to
understand it.
48 Consistent consolidation of IT
systems to reduce
heterogeneity of IT systems
and data inconsistencies
Since a single-source-of-truth is technically complex to achieve
or to hold for organization and uncertain in its cost-efficiency
when traversing from a very heterogenic systems landscape,
organizations take steps to stepwise converge to it. One way to
do so, is to constantly consolidate small numbers of IT systems
to one once after another. This way, the number of IT systems
and inconsistent data structures are constantly reduced over time
and, thus, inconsistencies in data are reduced. This approach is
especially used for systems that come of age or systems with
redundant functionality exist.
49 Consistent integration of IT
system to platform as
integration layer to align data
and reduce data inconsistencies
Since a single-source-of-truth is technically complex to achieve
or to hold for organization and uncertain in its cost-efficiency
when traversing from a very heterogenic systems landscape,
organizations take steps to stepwise converge to it. One way to
do so, is to use a platform solution as data integration layer and
connect IT Systems one after another to the platform such that
data can be interchanged between systems and platforms and
thus between systems. Thus, inconsistencies in data are reduced.
This approach is especially used to align systems with different
functionality.
50 Consistent transition to
modular IT system to reduce
data inconsistencies and sustain
consistency of data
Since a single-source-of-truth is technically complex to achieve
or to hold for organization and uncertain in its cost-efficiency
when traversing from a very heterogenic systems landscape,
organizations take steps to stepwise converge to it. One way to
do so, is to consistently transition to an IT system landscape (or
eco-system) that is modular and allows a plug-and-play-style
integration and detachment of systems. Thus, the consistency of
data is not compromised by the exchange of systems. This
approach is especially used for landscapes with expected changes
and replacements of IT systems with heterogeneity needed to
provide IT systems structures for unique processes that otherwise
require extensive customization of systems.
51 Technical integration with
Supply Chain Partners with
platform integration layer to
overcome technical challenges
To technically integrate a usually diverse and large amount of
Supply Chain Partners with likewise diverse IT systems, a
platform layer between focal organization and Supply Chain
Partners is created. This way, the integration effort is reduced
since the partners are on-boarded to the platform, which is
supposed to be able to handle technical integration faster and
easier than the IT landscape of the organization.
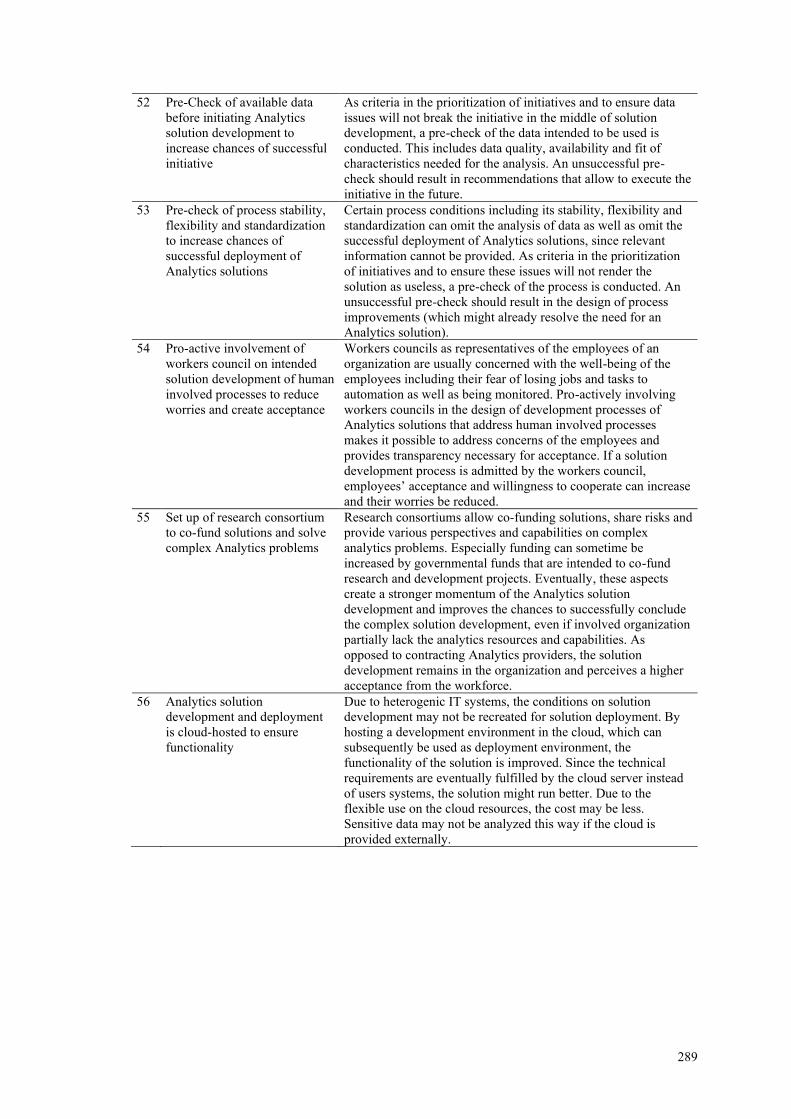
289
52 Pre-Check of available data
before initiating Analytics
solution development to
increase chances of successful
initiative
As criteria in the prioritization of initiatives and to ensure data
issues will not break the initiative in the middle of solution
development, a pre-check of the data intended to be used is
conducted. This includes data quality, availability and fit of
characteristics needed for the analysis. An unsuccessful pre-
check should result in recommendations that allow to execute the
initiative in the future.
53 Pre-check of process stability,
flexibility and standardization
to increase chances of
successful deployment of
Analytics solutions
Certain process conditions including its stability, flexibility and
standardization can omit the analysis of data as well as omit the
successful deployment of Analytics solutions, since relevant
information cannot be provided. As criteria in the prioritization
of initiatives and to ensure these issues will not render the
solution as useless, a pre-check of the process is conducted. An
unsuccessful pre-check should result in the design of process
improvements (which might already resolve the need for an
Analytics solution).
54 Pro-active involvement of
workers council on intended
solution development of human
involved processes to reduce
worries and create acceptance
Workers councils as representatives of the employees of an
organization are usually concerned with the well-being of the
employees including their fear of losing jobs and tasks to
automation as well as being monitored. Pro-actively involving
workers councils in the design of development processes of
Analytics solutions that address human involved processes
makes it possible to address concerns of the employees and
provides transparency necessary for acceptance. If a solution
development process is admitted by the workers council,
employees’ acceptance and willingness to cooperate can increase
and their worries be reduced.
55 Set up of research consortium
to co-fund solutions and solve
complex Analytics problems
Research consortiums allow co-funding solutions, share risks and
provide various perspectives and capabilities on complex
analytics problems. Especially funding can sometime be
increased by governmental funds that are intended to co-fund
research and development projects. Eventually, these aspects
create a stronger momentum of the Analytics solution
development and improves the chances to successfully conclude
the complex solution development, even if involved organization
partially lack the analytics resources and capabilities. As
opposed to contracting Analytics providers, the solution
development remains in the organization and perceives a higher
acceptance from the workforce.
56 Analytics solution
development and deployment
is cloud-hosted to ensure
functionality
Due to heterogenic IT systems, the conditions on solution
development may not be recreated for solution deployment. By
hosting a development environment in the cloud, which can
subsequently be used as deployment environment, the
functionality of the solution is improved. Since the technical
requirements are eventually fulfilled by the cloud server instead
of users systems, the solution might run better. Due to the
flexible use on the cloud resources, the cost may be less.
Sensitive data may not be analyzed this way if the cloud is
provided externally.
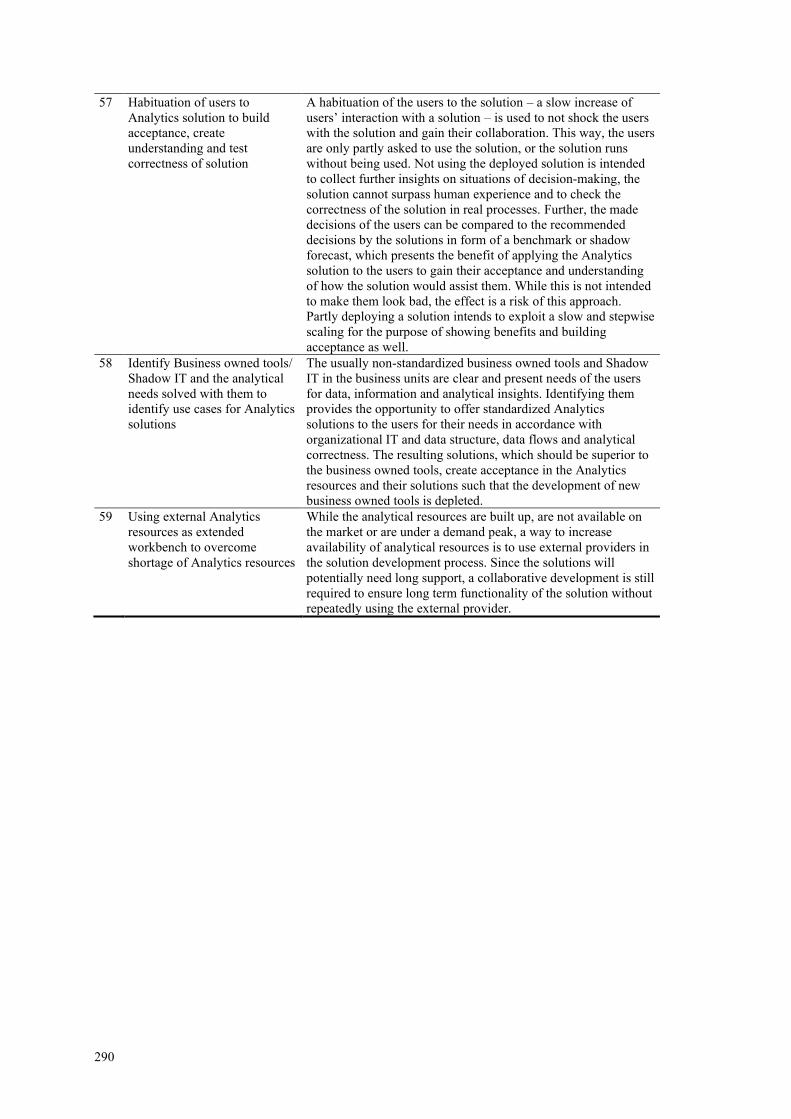
290
57 Habituation of users to
Analytics solution to build
acceptance, create
understanding and test
correctness of solution
A habituation of the users to the solution – a slow increase of
users’ interaction with a solution – is used to not shock the users
with the solution and gain their collaboration. This way, the users
are only partly asked to use the solution, or the solution runs
without being used. Not using the deployed solution is intended
to collect further insights on situations of decision-making, the
solution cannot surpass human experience and to check the
correctness of the solution in real processes. Further, the made
decisions of the users can be compared to the recommended
decisions by the solutions in form of a benchmark or shadow
forecast, which presents the benefit of applying the Analytics
solution to the users to gain their acceptance and understanding
of how the solution would assist them. While this is not intended
to make them look bad, the effect is a risk of this approach.
Partly deploying a solution intends to exploit a slow and stepwise
scaling for the purpose of showing benefits and building
acceptance as well.
58 Identify Business owned tools/
Shadow IT and the analytical
needs solved with them to
identify use cases for Analytics
solutions
The usually non-standardized business owned tools and Shadow
IT in the business units are clear and present needs of the users
for data, information and analytical insights. Identifying them
provides the opportunity to offer standardized Analytics
solutions to the users for their needs in accordance with
organizational IT and data structure, data flows and analytical
correctness. The resulting solutions, which should be superior to
the business owned tools, create acceptance in the Analytics
resources and their solutions such that the development of new
business owned tools is depleted.
59 Using external Analytics
resources as extended
workbench to overcome
shortage of Analytics resources
While the analytical resources are built up, are not available on
the market or are under a demand peak, a way to increase
availability of analytical resources is to use external providers in
the solution development process. Since the solutions will
potentially need long support, a collaborative development is still
required to ensure long term functionality of the solution without
repeatedly using the external provider.

Managing Supply Chain Analytics
This doctoral thesis seeks to contribute to research on the managerial aspects of Analytics in the field of Logistics and Supply Chain Management by conducting four individual research studies and an extensive synopsis of their results. The goal of this thesis is to provide managers in Logistics and Supply Chain Management with means and insights to manage Analytics initiatives in their organizations successfully and impactfully. The four research studies investigate separate components of the management process of Analytics relevant to the research objective including contributing factors outside of Analytics initiatives influencing them, archetypes of common Analytics initiatives in Logistics and Supply Chain Management, the value contribution of Analytics initiatives to the competitive advantage of organizations as well as barriers against impactful Analytics initiatives and measures against these barriers. Combined with an additional investigation of 15 process models of conducting Analytics projects and initiatives, the insights of the individual studies are mapped to process phases of Analytics initiatives.