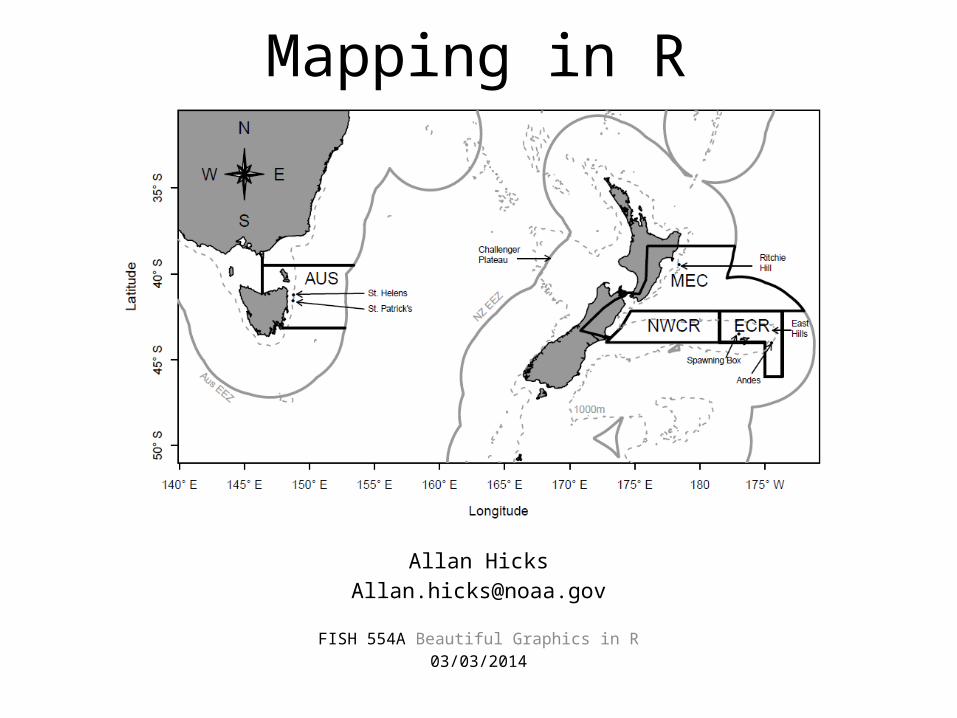
mapping in r allan hicks [email protected] fish 554a beautiful graphics in r 03/03/2014
TRANSCRIPT
Maps
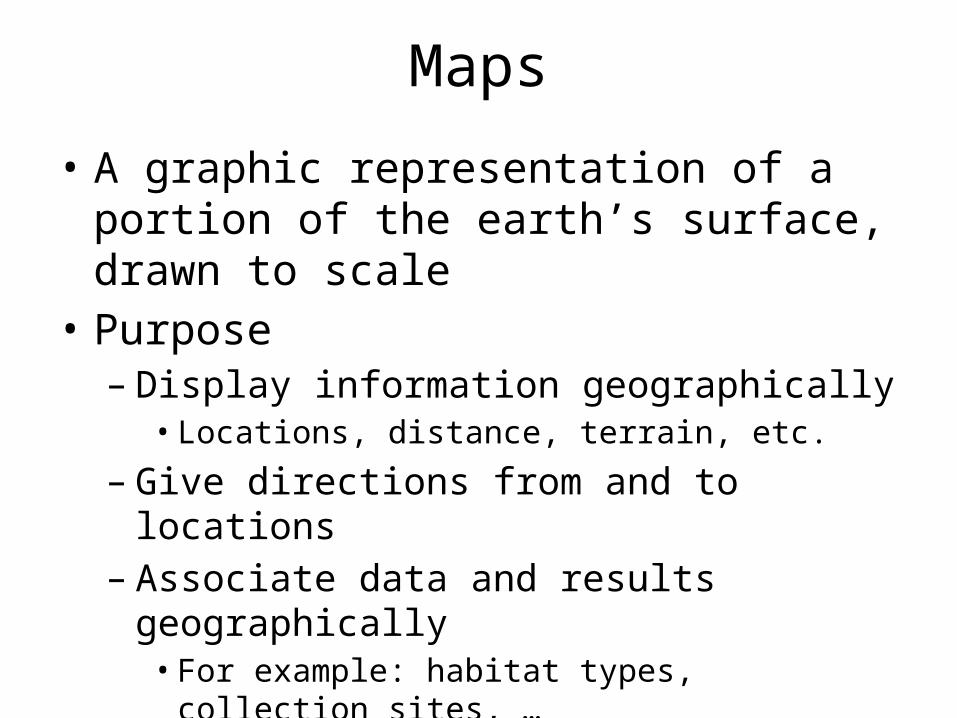
• A graphic representation of a portion of the earth’s surface, drawn to scale
• Purpose– Display information geographically• Locations, distance, terrain, etc.
– Give directions from and to locations– Associate data and results geographically• For example: habitat types, collection sites, …
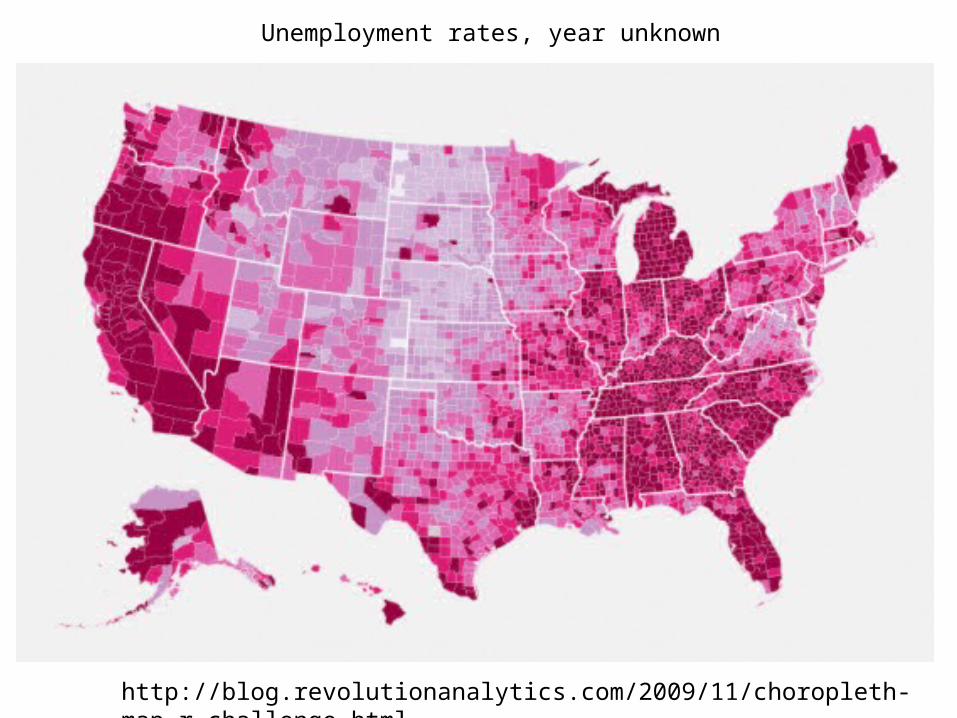
http://blog.revolutionanalytics.com/2009/11/choropleth-map-r-challenge.html
Unemployment rates, year unknown
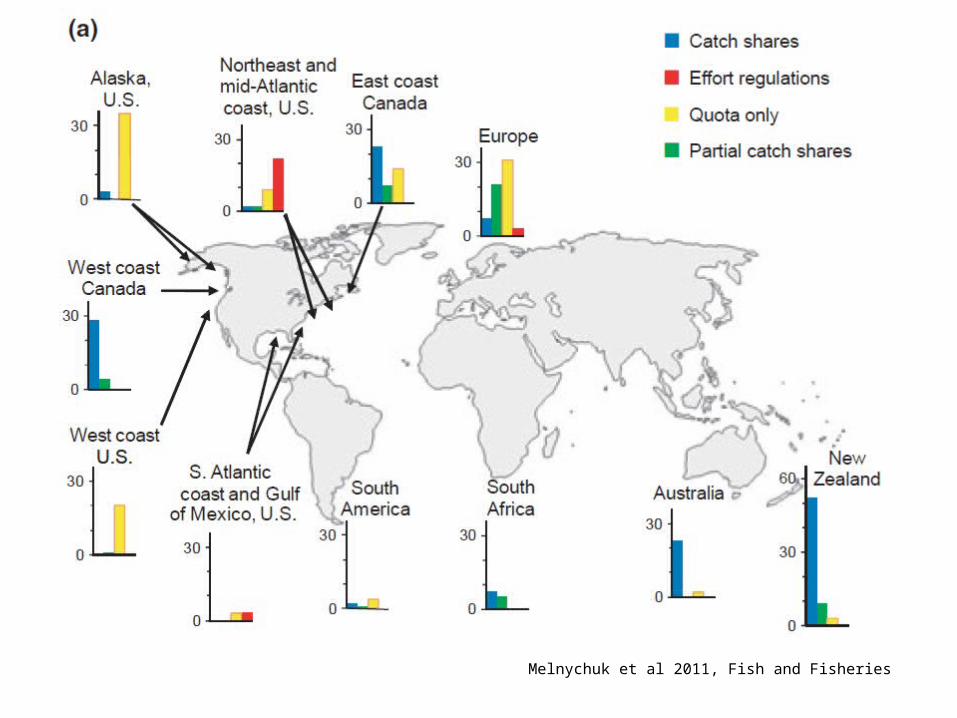
Melnychuk et al 2011, Fish and Fisheries
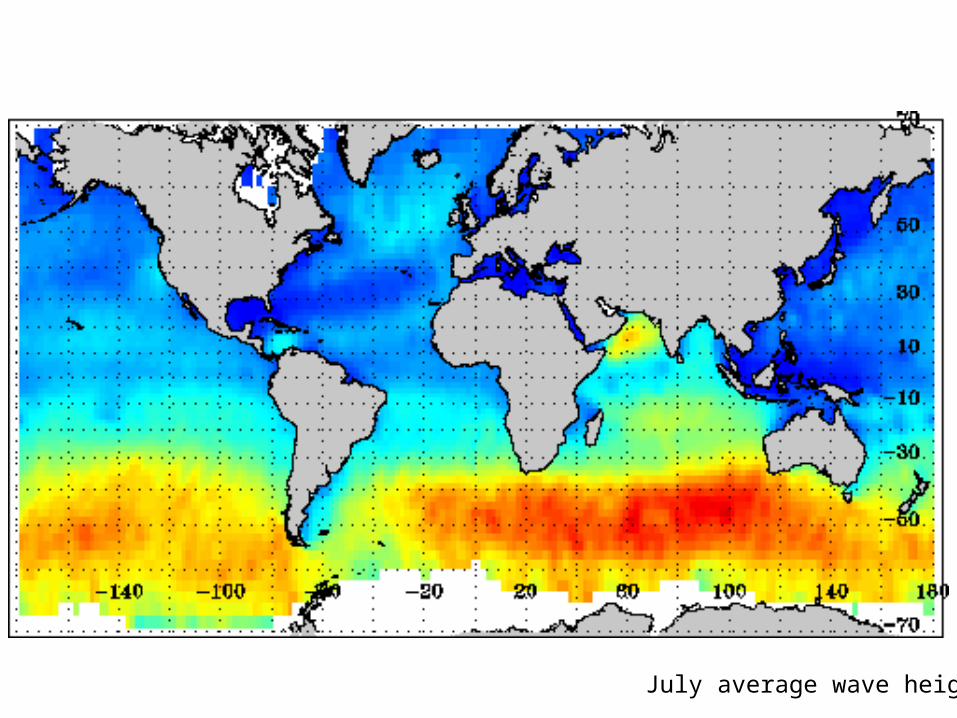
July average wave height
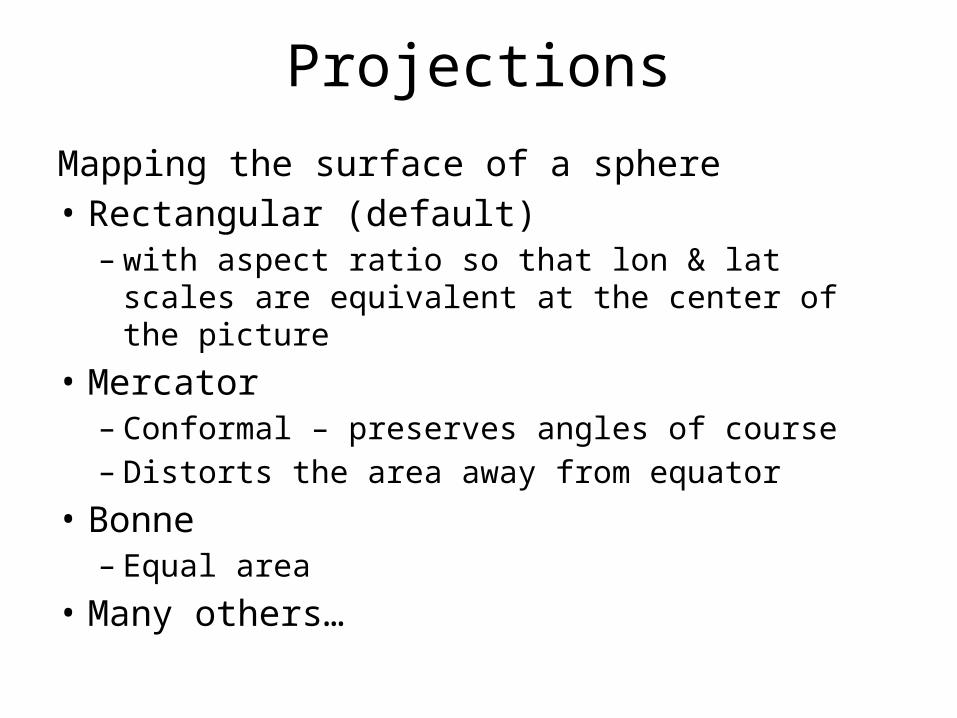
Projections
Mapping the surface of a sphere• Rectangular (default)– with aspect ratio so that lon & lat scales are
equivalent at the center of the picture• Mercator– Conformal – preserves angles of course– Distorts the area away from equator
• Bonne– Equal area
• Many others…
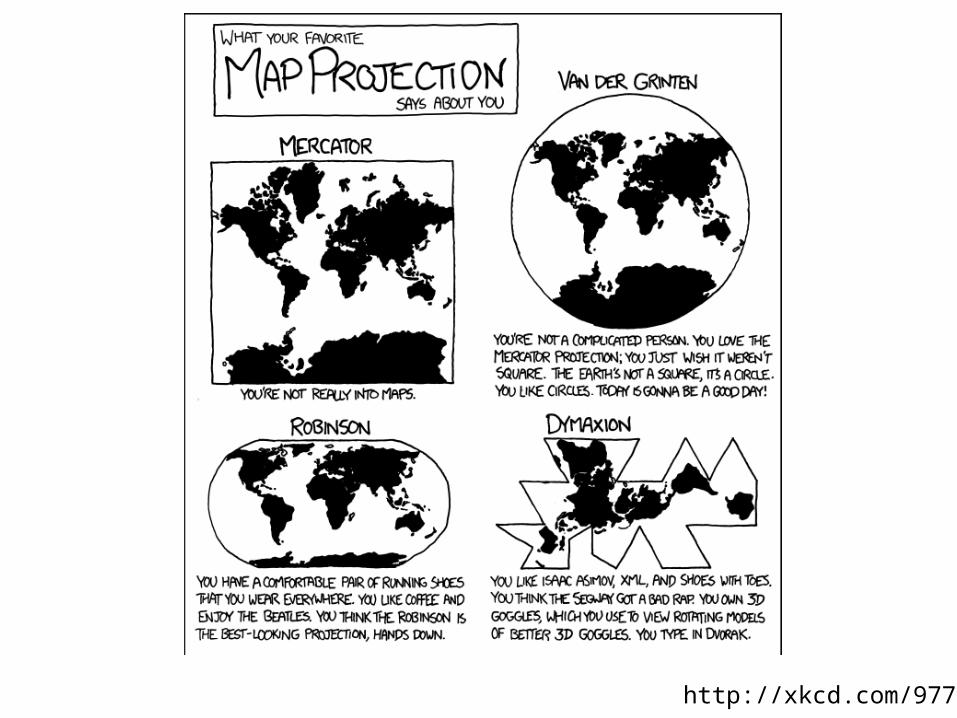
http://xkcd.com/977/
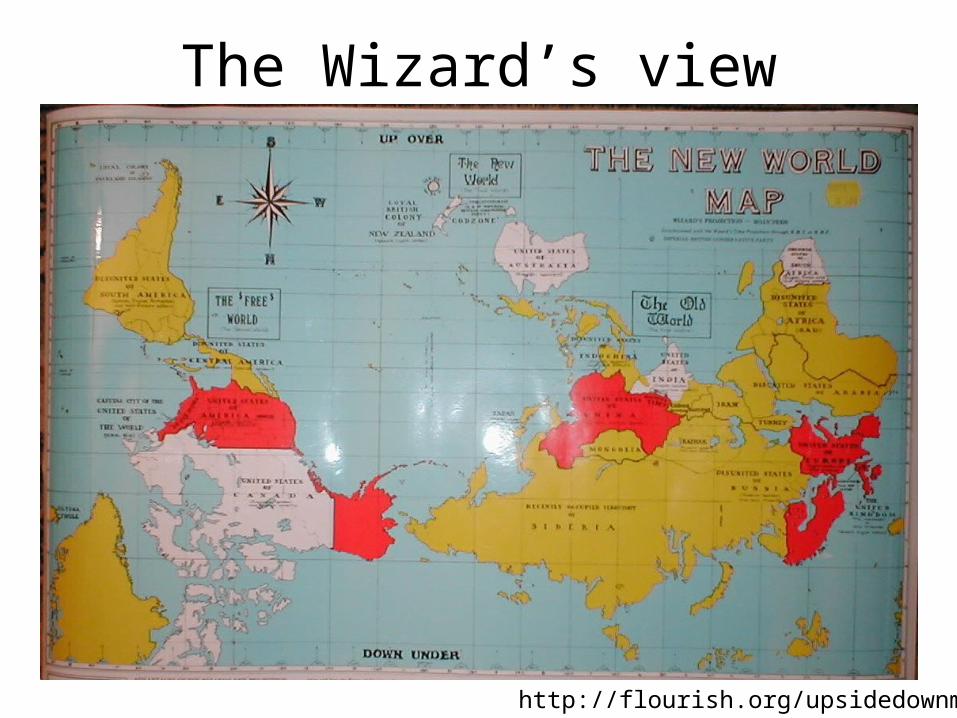
The Wizard’s view
http://flourish.org/upsidedownmap/
Mapping in R
• This is not GIS– But can read shapefiles– We want to plot spatial data such that the lat and
lon are not distorted too badly• Many different ways to display spatial data– Plot latitude & longitude as x and y– Use the spatial package called sp– The map package and associated tools– The PBSmapping package– Many other methods …
The map package (and others)• Packages
– map, maptools, mapproj, mapdata• Functions
– map: the main function– map.axes– Can use points, lines, etc. easily with default projection
• Data structure– Of class “map” with a list containing
• x: latitude values with polygons separated by NA• y: longitude values matching x (NA’s also)• range: x and y ranges• names: names of the polygons
PBSmapping
http://www.dfo-mpo.gc.ca/Library/285683.pdf• Powerful mapping package, especially useful for
the Northeast Pacific• Has high resolution shoreline data (GSHHS)• Uses a PolySet with– PID: primary ID– SID: Seconday ID– POS: Position number– X: longitude– Y: latitude
Shapefiles
• Files containing geographic information• Use readShapePoly and other functions from
the maptools package• Or importShapeFile from PBSmapping• I usually just ask for a shapefile with lon & lat
coordinates (not any other special formats)
Other data sources
• Can download a lot of data from different sources– Shapefiles (i.e., census)– GSHHS (Global Self-consistent Hierarchical High-
resolution Shoreline database)– Internet (http://topex.ucsd.edu/cgi-bin/get_data.cgi)– R packages (mapdata, PBSmapping, mapplots)
Other R packages
• rworldmap: Maps of countries with attributes• mapplots: data visualization on maps• geo: N. Atlantic used by HAFRO for fisheries• sp: Spatial data• Imap: Point and click interface• ggmap: plot on top of Google maps• gmt: interface with GMT mapping software• plotGoogleMaps: data on Google maps• RgoogleMaps: Google map backgrounds• nwfscMapping: some things I use