mapping land-use/land-cover of khartoum … · a.a. salman, a.e. ali and h.e. mattar 28 emirates...
TRANSCRIPT
Emirates Journal for Engineering Research, 13 (2), 27-43 (2008) (Regular Paper)
27
MAPPING LAND-USE/LAND-COVER OF KHARTOUM USING FUZZY CLASSIFICATION
A.A. Salman1, A.E. Ali2 and H.E. Mattar3 1Civil Engineering Department, King Saud University, Saudi Arabia, Email: [email protected] 2Sudan National Survey Authority, P.O. Box 306, Khartoum, Sudan, Email: [email protected]
3Intergraph Saudi Arabia, P.O. Box 9843 Jeddah 21423, Saudi Arabia, Email: [email protected]
(Received April 2008 and accepted August 2008)
الخرطوم الكبري باستعمال فكرة التصنيف يوضح البحث نتائج تجربة لترسيم خرائط استعماالت األراضي وغطائھا لمدينةومتوسطة 7-من الندسات) متراً 30(الغامض لمرئيات مختلفة من أقمار صناعية ذات خصائص مختلفة دقة تمييزية منخفضة
لتشريح الصور وبرنامج eCognition، استعملت لھذا الغرض برامج ايكونوس من) متر 4(وعالية من سبوت) متر 10(، وقد أثبت البحث أنه "دالة العضوية " و" الجار األقرب " لمرئيات من شركة ديفنينس والذي يحتوي علي طريقتين تحليل ا
بالرغم من درجة عدم التالءم الكبيرة في الغطاء األرضي للمنطقة المغطاة فإن دقة تصنيف استعماالت األراضي وغطائھا %.80-75وصلت إلي
This paper presents results of an experiment carried out to extract land-use/land cover (LULC) of greater Khartoum-Sudan. In the experiment, the fuzzy classification concept was applied to multi-sensor and multi-resolution satellite images. The images include low resolution (Landsat TM, 30m), (medium resolution SPOT HRV20 10m) and high resolution (IKONOS 4m). eCognition commercial ismage segmentation and object-oriented image analysis software from Definiens were used. Two methods resident in the software, namely: the nearest neighbor (NN)” and the “membership function” were utilized. In spite of the high degree of heterogeneity in the study area due to prevailing surface and building patterns, a general classification accuracy value in the range 75-80% has been achieved. Keywords: land-use/land cover, image segmentation, fuzzy classification, multi-resolution, multi-
sensor, Greater Khartoum
1. INTRODUCTION Fuzzy logic is a mathematical approach used to quantify uncertainty (i.e. imprecision) in the boundaries between natural geographic features. Instead of expressing the boundary by exactly “true=1” or “false=0”, the logic replaces these two limited expressions by a continuous range [0..1]. All values between 0 and 1 represent more or less certain state of “true” or “false”. In remotely sensed data, to resolve the fuzziness of a pixel falling in the transition region between two classes, a membership value is given based on its defined characteristics. In image classification, the fuzzy logic is used to partition the image prior to class assignment into a homogenous region “segment” according to the following equation[1].
shapecolourcolourcolourf hwhwS ).1(. −+= (1)
Where fS is the segmentation function and h is the degree of heterogeneity, while w is a weight function of shape criteria (0 ≤ colourw ≤ 1). Spectral (i.e. colour) heterogeneity of an image is computed using the following equation:
∑=
=m
kkkwh
1.σ (2)
Shape criterion is computed using compactness and smoothness defined as follows:
Compactness nlcpt =)( (3)
Where l is pixel perimeter and n is the number of pixels forming an object.
Smoothness blsm =)( (4)
Where b is the shortest possible border length of a box bounding the image object.
In the present experiment the above concept was employed to extract LULC of Greater Khartoum with eCognition software. eCognition is a commercial image segmentation and object-oriented image analysis software designed for analysis of remotely sensed data[2,3]. eCognition’s multivariate segmentation is based on “region merging techniques” that start with regions of one pixel in size (Figure 1).

A.A. Salman, A.E. Ali and H.E. Mattar
28 Emirates Journal for Engineering Research, Vol. 13, No.2, 2008
Figure 1. eCognition multi-resolution segmentation level and
hierarchical network illustration
The region-merging algorithm is iterative and it merges adjacent areas based on their spectral and spatial properties. The main parameters controlling the algorithm are “scale” and “homogeneity” criteria. Scale restricts heterogeneity of segments with the help of the homogeneity criteria that can be controlled by weighting the “color” and “shape” parameters. “Color” refers to spectral aspects and “shape” to geometric properties of the segments.
2. STUDY AREA Greater Khartoum comprises three main towns. These are Khartoum, Khartoum North (Bahri) and Omdurman. Khartoum town lies at the confluence of the two Niles, the White Nile on its west side and the Blue Nile on its east. The shape of the meeting point of the two Niles resembles elephant trunk and that is called in Arabic “Khartoum”. This fact can be clearly seen on satellite imagery. Therefore, Khartoum, together with the two cities, Omdurman and Bahri, are jointly called the Tri-capital (or the Three Towns). Geographically the study area is situated at latitude 15° 12' 00" N to 15° 51' 00"N, and from longitude 32° 18' 00"E to 32° 46' 00"E. World Reference System refers to row=49 and path=173 and it is about 400m above mean sea level on average (Figure 2).
The present population of the three towns is about 5 million (with an annual growth of 4.04%) which represents 16% of the total urban population of Sudan. On the other hand, the size of Khartoum State administrative limits which includes the three towns and environs, is about 4,168.7km² and it is believed to be increasing at a rate of 3% annually[4]. The climate of Khartoum area is poor savanna with two temperature maximums (forced by the onset and offset of Inter-Tropical Conversion Zone (ITCZ)) in May and December. A short rainy season from June to September gives about 164mm of rain. August is the wettest month in which the relative humidity rises to 70 per cent at 6.00 a.m. Most of the rainfall occurs at night and to a lesser degree in the mornings and afternoons. The precipitation is lost through evapotranspiration due to excessive heat, percolation and gradient runoff. April has the highest rate of evapotranspiration[5,6].
Figure 2. Location of the study area
3. SATELLITE DATA USED IN THE EXPERIMENT
Landsat-7 ETM+ acquired on April 28, 2000, SPOT4 HRV2 acquired on May 25, 2003 and IKONOS acquired on December 22, 1999 images were available for the test. All test images were made to undergo a geometric registration operation. Simple geometric model affine transformation was used. The digital image processing system Intergraph Image Analyst (IA) was used to achieve the geometric correction. Contrast enhancement was done for all the data set after registration. It used the simple contrast/brightness approach in the image analyst and histogram equalization in ERDAS imagine. Then, the resulting imageries were saved as standard GeoTIFF file format. The geometric accuracy achieved is better than half a pixel.
Landsat coverageArea of the study limits

Mapping Land-Use/Land-Cover of Khartoum using Fuzzy Classification
Emirates Journal for Engineering Research, Vol. 13, No.2, 2008 29
Figure 3. LULC General object oriented classification workflow used with the study data

A.A. Salman, A.E. Ali and H.E. Mattar
30 Emirates Journal for Engineering Research, Vol. 13, No.2, 2008
4. METHODOLOGY USED IN THE TEST Development of LULC GIS database, based on classification of remotely sensed data requires enormous efforts. The major challenge is the development of the best method that can be followed to extract and aggregate classes in a manner that can reflect the true phenomenon. This is due to the assumption that different land use or land cover classes have distinct spectral signatures. Using spectral information only, confusion between land used/land cover classes is certain. This is particularly true with this study area due surface heterogeneity. As a result, the fuzzy classification concept was attempted. Two classification methods were used. These are the “nearest neighbor (NN)” method and the “membership function” technique. Nearest neighbor is a method for classifying objects based on closest training examples in the feature space, where membership functions are used to formulate knowledge based on the fuzzy rules to distinguish each class from others in the designed classification scheme (see eCognition software Concepts and Methods and User Guide[7]). Other constrains of LULC classification task pertain to characterization of the LULC feature classes. Therefore, prior to classification, logical consideration was worked out to design a limited classification scheme associated with the local environment of the study area. The methodology followed is shown in Figure 3.
Certain classification schemes have been developed that can readily incorporate land-use and land cover obtained by interpreting remotely sensed data. Examples from U.S.A are:
- U.S. Geological survey land use/land cover classification;
- U.S. Fish and wildlife service wetland classification; and
- N.O.A.A. Coast watch land cover classification system.
The author has no idea about classification systems being adopted outside USA except the Africover classification system. Africover is a project developed by Food and Agriculture Organization (FAO) of the United Nations (FAO)[8,9]. It was not possible to find a reliable and well-defined LULC classification system for the present test area. So, the classification scheme described in Table 1 was modified and used. The scheme is the USA Geological Survey Land-Use/Land-Cover classification for use with remote sensor data[10,11].
The Classification scheme has two hierarchical levels; Level-I and level-II. Level-I includes seven classes. It represents the main LULC classes expected in the study area. Level-II represents a further expansion of level-I into subclasses, i.e. urban areas (built-up areas) that contain non-transportation facilities and transportation class which defines subclasses such as paved roads, bridges, parks, etc.
Table 1. Land-use/land-cover classification scheme of the city
All images were segmented into multi-resolution
levels (i.e. more than three) based on spectrally homogenous objects. For instance, in segmentation of level-I, the size of the object is set to be 2 pixels. In level-ll, the image is partitioned into 5 pixel object size, and so forth. The multi-resolution segmentation levels were established by controlling the color and shape. Different levels (sizes) of segments were used to identify features of different size. Larger segments identified water bodies, agricultural, barren fields, and athletic polygons. Detailed features such as roads, walkways and buildings were identified by smaller segments. Even in the context of a spatially and spectrally complex urban environment, image segmentation and object-oriented classification provided a superior approach in deriving detailed land cover information. So, all of the above sets were classified with both methods.
In order to collect training samples for each class, a hierarchy was designed for the NN classifier. The class hierarchy is a frame of formulating the knowledge base for classifying image objects. It contains all levels of a classification scheme in a hierarchical structure. The classes are categorized
Level-I Level-II 1.Urban or Build-up Land
1.1. Residential. 1.2. Industrial 1.3. Commercial complexes and Markets Services 1.4. Cemetery. 1.5. Recreational Areas. 1.6. Stores. 1.7. Waste/Garbage collection Areas 1.8. Firewood/Charcoal Squares 1.9. Mixed Urban or Built-up 1.10. Other Urban or Built-up Land
2. Transportation
2.1. Paved Roads 2.2. Roads under construction 2.3. Unpaved Roads 2.4. Track 2.5. Railways 2.6. Airport-Runway 2.7. Parks 2.8. Bridges
3.Vegetation and Agricultural Lands
3.1. Forest 3.2. Trees-canopy 3.3. Grassland 3.4. Cropland and Pasture 3.5. Orchards, Groves 3.6. Vineyards, Nurseries, and Ornamental Horticultural Areas 3.7. Other Agricultural Land
4. Water 4.1. Rivers (deep water) 4.2. Rivers (shallow water) 4.3. Streams and Canals 4.4. Ponds 4.5. Valleys/Wadi 4.6. Reservoirs
5. Wetland 5.1. Flood prone Lands 5.2. Irrigated Lands
6. Elevation 6.1. Mountain 6.2. Spot Height/Bench Mark
7. Soil 7.1. Open Space-(within urban) 7.2. Sand(Desert) 7.3. Clay

Mapping Land-Use/Land-Cover of Khartoum using Fuzzy Classification
Emirates Journal for Engineering Research, Vol. 13, No.2, 2008 31
into groups and each class is a child of a certain group. The relation defined by the class hierarchy is the inheritance of class descriptions from its parents (i.e. group). It means that class descriptions defined in parent classes are passed down to their child classes. The strategy adopted to perform image classification with the test data using NN algorithm is presented in Figure 4. The class hierarchy designed to be used with Landsat and SPOT imagery is illustrated in Figure 5.
With the test data, the average of the maximum and the minimum values of an object feature (i.e. attributes) that discriminate each class were determined by collecting a set of values from potential sample objects in the image through manually reading the value by moving the mouse on the object. This is to form a general idea about each particular feature. For example, to determine low and high limits of the feature for a certain class, the expression object feature>layer values-> ratio can be used. Then the “feature range” tool is employed to determine the threshold values that can be used to set the left and right border of a membership function slope. All image objects whose object feature values are within the range defined in the feature range box are colored in smooth transition from light blue to green (Figure 6).
The approach followed to perform membership function fuzzy classification operations is shown in Figure 7. Different object features i.e. layer values (mean, standard deviation, ratio, standard deviation to neighbor pixels, minimum or maximum values, etc.) were checked. After threshold values of each class are identified, the borders of fuzzy membership functions classifying the image are specified empirically.
This is completed by selection of the appropriate function slope after modification of the left and right border based on the final threshold obtained by the feature range tool. A number of attempts were made to reach the most acceptable isolation of the classes before the next class was extracted. The final step carried out is refining the last classification results by manually assigning non-classified and mis-classified image objects to the correct class using training sample technique (i.e. assign them as training samples).
5. CLASSIFICATION RESULTS OF THE LANDSAT-7 ETM+ (BANDS123457)
The six bands of Landsat ETM+ were segmented and classified simultaneously. The experiment was made in order to test potentiality in terms of improving the classification accuracy when using object- oriented classification method. Due to image size restriction in the evaluation version of the software, the image size was reduced to 1040195 pixels (845x1231) for each band. Then, the six bands were made to undergo multi-resolution image segmentation.
Figure 4. Fuzzy classification with NN classifier workflow

A.A. Salman, A.E. Ali and H.E. Mattar
32 Emirates Journal for Engineering Research, Vol. 13, No.2, 2008
Figure 5. Class hierarchy designed for use with fuzzy
classification
a). Threshold value extracting the Blue Nile (layer values->ratio 0.3531-0.4350)
b). Threshold value extracting vegetation (layer values->ratio: 0.2325-
0.4273)
Figure 6. Landsat-7 ETM+, b4 (band 4) feature range setting for the Blue Nile and vegetation
Figure 7. Fuzzy classification with membership function workflow

Mapping Land-Use/Land-Cover of Khartoum using Fuzzy Classification
Emirates Journal for Engineering Research, Vol. 13, No.2, 2008 33
a). Scale parameter=10; Shape=0; Smoothness=0
b). Scale parameter=10; Shape=0.9; Smoothness=0.5
c). Scale parameter=10; Shape=0.6; Smoothness=0.9
Figure 8. Samples of Landsat-7 ETM+, b234 segmented images with different parameters
To produce segmented images with different sizes
for the first level classification purpose (i.e. to classify parent class (Figure 5)) the segmentation parameter which influences the size of the image
object (i.e. scale parameter) was tested with values 10, 15, 20, and 30 successively. Several segmented images were produced based on a combination of different scale parameters with homogeneity criteria (color and shape, smoothness and compactness). Similarly, to classify the second level (i.e. child classes) several segmented images with different object sizes were produced. Object size was controlled by setting the scale parameter to 2 and 5. Table 2 contains the designed segmentation parameters as well as the visual evaluation of the resultant images. Figure 8 shows a segmented multi-spectral Landsat 7 ETM+ of the central region of the study area.
6. CLASSIFICATION WITH NN CLASSIFIER
After multi-resolution segmentation of the Landsat data was accomplished, the results were examined and evaluated. It was found that the following variables gave meaningful image objects at level 6(scale parameter=5, color=0.1, shape=0.9, smoothness=1.0, and compactness= 0.0). In most cases, however, color criterion was more important for creating meaningful objects. After image objects were generated, the most acceptable level (level 6) was further processed. Feature space defined and applied to the class hierarchy is the standard nearest neighbor. The class hierarchy was designed to encompass eleven LULC themes (e.g. classification scheme level-I). The classification of segmented images produced with level 6 parameters was carried out in two stages. In the first stage, a simple class hierarchy was developed. Only five classes were defined for the purpose of extracting road segments. Then, classification of the rest of other LULC classes was carried out. In the second stage, the training samples were collected for every one of the classification scheme category. The initial training samples collected for each class are five areas excluding residential and industrial areas. For the residential and industrial areas, fifteen training sites were identified. For each of them, five obvious areas were selected as training sites in Khartoum, Omdurman and Khartoum North.
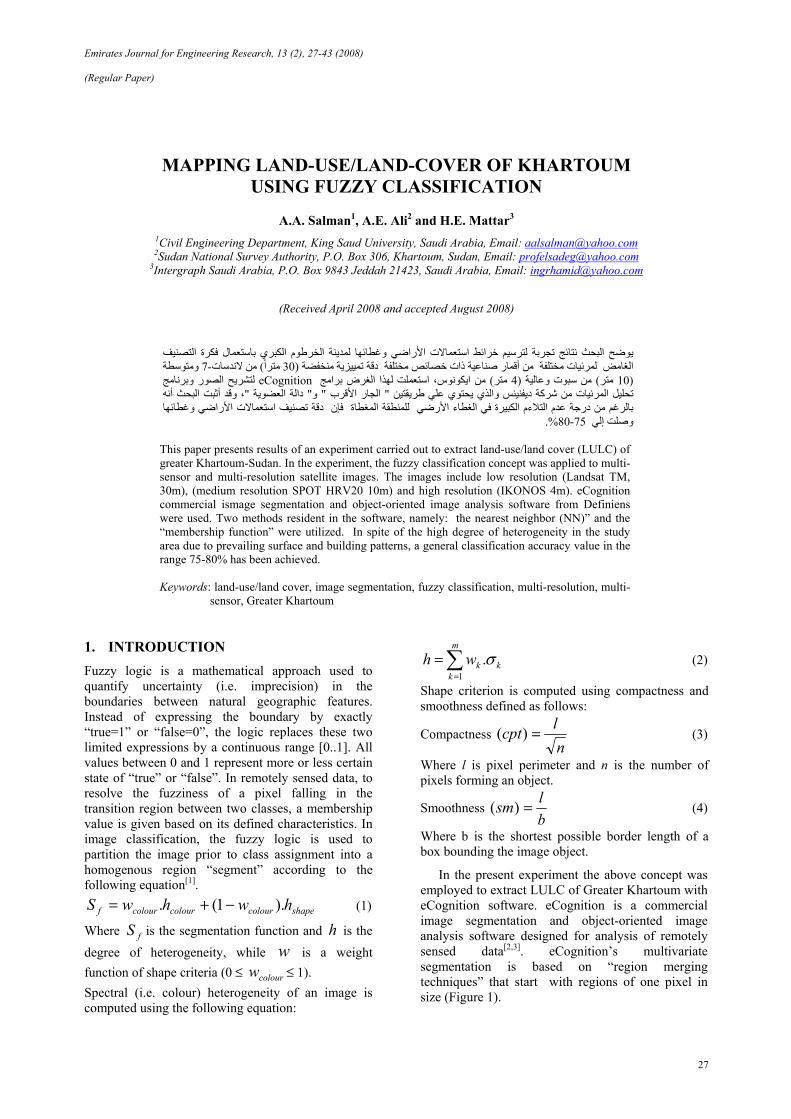
Thence, training samples were increased by selecting new samples after each classification performance. The classification routine was executed several times before reaching the required results. Based on the third classification session, the accuracy assessment process and statistical evaluation reports were generated. The subsequent results were accepted and defined as the final product. However, it was refined manually by correcting the mis-classified objects or assigns the unclassified objects to the desired class. Figure 9 shows the final LULC classified thematic image with the two-dimensional (2D) feature plot which gives an overview of the correlation between classes.
A.A. Salman, A.E. Ali and H.E. Mattar
34 Emirates Journal for Engineering Research, Vol. 13, No.2, 2008
Table 2. Segmentation parameters and segmented image evaluation of Landsat-7 ETM+ b234
Level Scale
Parameter Segmentation Mode Composition of Homogeneity Criteria
Visual Assessment of the Result Normal Color Shape Smoothness Compactness
Level 0 10 (Default) Normal 0. 8 0.2 0.9 0.1 Very good roads segmentation
Level 1 2 Normal 0.1 0.9 0.9 0.1 The objects size close to pixel (only few pixels are grouped)
Level 2 2 Normal 0.8 0.2 0.9 0.1 No big different than level 1
Level 3 2 Normal 1.0 0.0 Not applicable Not applicable Result is the same as level 1
Level 4 5 Normal 1. 0 0.0 Not applicable Not applicable Good roads and fair water segmentation
Level 5 5 Normal 0.1 0.9 0.0 1.0 Almost the same as level 4
Level 6 5 Normal 0.1 0.9 1.0 0.0 roads segmentation better than level 4
Level 7 10 Normal 1.0 0.0 Not applicable Not applicable Good roads and fair water segmentation
Level 8 10 Normal 0.1 0.9 0.5 0.5 Good water and poor roads segmentation
Level 9 10 Normal 0.4 0.6 0.9 0.1 Almost the same as level 8
Level 10 20 Normal 1.0 0 Not applicable Not applicable Fair roads segmentation
Level 11 20 Normal 0.4 0.6 0.5 0.5 Very Poor road segments
Level 12 30 Normal 0. 8 0.2 0.9 0.1 Good roads segmentation
Level 13 30 Normal 0.8 0.2 0.1 0.9 Fair roads segmentation
Level 14 30 Normal 1.0 0 Not applicable Not applicable Fair roads segmentation
Remarks 1. Shape and color criteria always sum up to 1 2. The weight sum of compactness and smoothness is equal 1
Table 3. Landsat-7 ETM+, b432: minimum and maximum values of object feature>layer values> ratio
No. class band object feature> layer values> function slope type range
1 Roads b4 mean diff.to neighbors Full range -17.97- -4.2
2 Airport runways b3 mean Approximate Gaussian 95 - 97 3 Industrial areas b1 Stdev. About rang 7.6 - 49 4 Built up areas b2 ratio Approximate Gaussian 0.13-0.16 5 Vegetaion1 b4 ratio Full range 0.13 – 0.27 6 Vegetaion2 b4 ratio Approximate Gaussian 0.10-0.157 Deep water(Blue Nile) b3 ratio Full range 0.218 – 0.230 8 Shallow water(White Nile) b3 ratio Full range 0.24 – 0.29 9 Flood-prone areas /wet land b4 mean diff.to scene About range -26 – -12 10 Soil (vacant areas within urban) b3 ratio Full range 0.23-0.19 11 Soil (sand in the desert) b5 mean Full range 231 - 255 12 Soil ( clay) b7 mean Full range 147 - 155
13 Mountains b3 ratio Approximate Gaussian 0.08 – 0.21
Mapping Land-Use/Land-Cover of Khartoum using Fuzzy Classification
Emirates Journal for Engineering Research, Vol. 13, No.2, 2008 35
a). For 2D feature space plot X=b1, y=b4
b). For 2D feature space plot X=b1, y=b4
Figure 9. Landsat-7 ETM+, b123457: NN supervised classification results
7. CLASSUIFICATION RESULTS WITH MEMBERSHIP FUNCTIONS
Naturally, there is no exact threshold between densely and sparsely populated areas, or between low and high vegetation. However, with the threshold defined in terms of number, only approximate values, visually indicating the separation of classes, can be used. On the other hand, in many cases the desired information for specific class is not available or satisfactory in one band or in one object feature. Therefore, to develop an adequate threshold discriminating class in a certain area, numerous procedures and attempts are required. All object features provided in the eCognition were examined against each band and
visually evaluated to see which of them gives a good description of the individual class. In this study, two steps were carried out. In the first step, several potential sites of each class were visited then; maximum and minimum values of computed ratio features from each band of Landsat data for each class in the class hierarchy were tabulated as in Table 3. In the second step, the feature range tool was used to obtain approximate threshold values of each class.
The key issue of the fuzzy classification by means of membership functions is the definition of class boundary. This requires determination of object feature, its range, and membership function slope. The fist two conditions were determined in the previous step for each class in the classification scheme. So, the next steps are the determination of the membership function slope type; its left and right borders and the performance of the classification. The classification process was carried out in an iterative manner. Each time only one class is classified and a certain class from class hierarchy is selected. After that a membership functions slope is chosen arbitrarily based on object feature description knowledge. Then slope left and right borders are specified. Following that, the classification is executed and the results are evaluated. If the extraction of that class is not satisfied, then membership functions slope needs to be either edited or substituted with another slope type (Figure 10). Generally, classes level-I are extracted. At the end, meaningful membership functions parameters were determined and tabulated in Table 4. 8. FUZZY CLASSIFICATION OF SPOT-4
IMAGERY (BANDS123) The first step in eCognition image classification is to construct image objects, which will be used in subsequent classification processes. The SPOT-4HRVIR, b123 imagery was segmented into six multi-resolution object levels. The SPOT data sets are large. Because of the trial software limitation imposed on the authors, the image was extracted to size 932x1124 pixels. SPOT data have better resolution than Landsat. So, segmentation of the image was initialized to produce image object with more pixels (e.g. 5 pixels). The partitioning parameters were designed to group the pixels into homogeneous regions from bottom (i.e. few pixels) to top (i.e. maximum number of pixels that can be acceptable as a real object). The purpose is to aggregate pixels into an image object with small size then medium and large. Table 5 contains parameters used to segment the image and the associated results. Objects generated in level 4 and level 5 were superlative. However, the aggregation of pixels into objects is not sufficient in terms of meaning. The two classification approaches provided by eCognition were performed to classify the segmented images produced in levels 4 and 5.

A.A. Salman, A.E. Ali and H.E. Mattar
36 Emirates Journal for Engineering Research, Vol. 13, No.2, 2008
Figure 10. Landsat-7 ETM+, b123457: final classification results
Table 4. Fuzzy classification: membership functions parameter settings
No. class band object feature> layer values> function slope type range
1 Roads b4 mean diff.to neighbors Full range -17.97- -4.2
2 Airport runways b3 mean Approximate Gaussian 95 - 97
3 Industrial areas b1 Stdev. About rang 7.6 - 49
4 Built up areas b2 ratio Approximate Gaussian 0.13-0.16
5 Vegetaion1 b4 ratio Full range 0.13 – 0.27
6 Vegetaion2 b4 ratio Approximate Gaussian 0.10-0.15
7 Deep water(Blue Nile) b3 ratio Full range 0.218 – 0.230
8 Shallow water(White Nile) b3 ratio Full range 0.24 – 0.29
9 Flood-prone areas /wet land b4 mean diff.to scene About range -26 – -12
10 Soil (vacant areas within urban) b3 ratio Full range 0.23-0.19
11 Soil (sand in the desert) b5 mean Full range 231 - 255
12 Soil ( clay) b7 mean Full range 147 - 155
13 Mountains b3 ratio Approximate Gaussian 0.08 – 0.21
Class hierarchy

Mapping Land-Use/Land-Cover of Khartoum using Fuzzy Classification
Emirates Journal for Engineering Research, Vol. 13, No.2, 2008 37
Table 5. SPOT-4 b123 segmentation parameters and associated result evaluation
9. CLASSIFICATION WITH NN CLASSIFIER
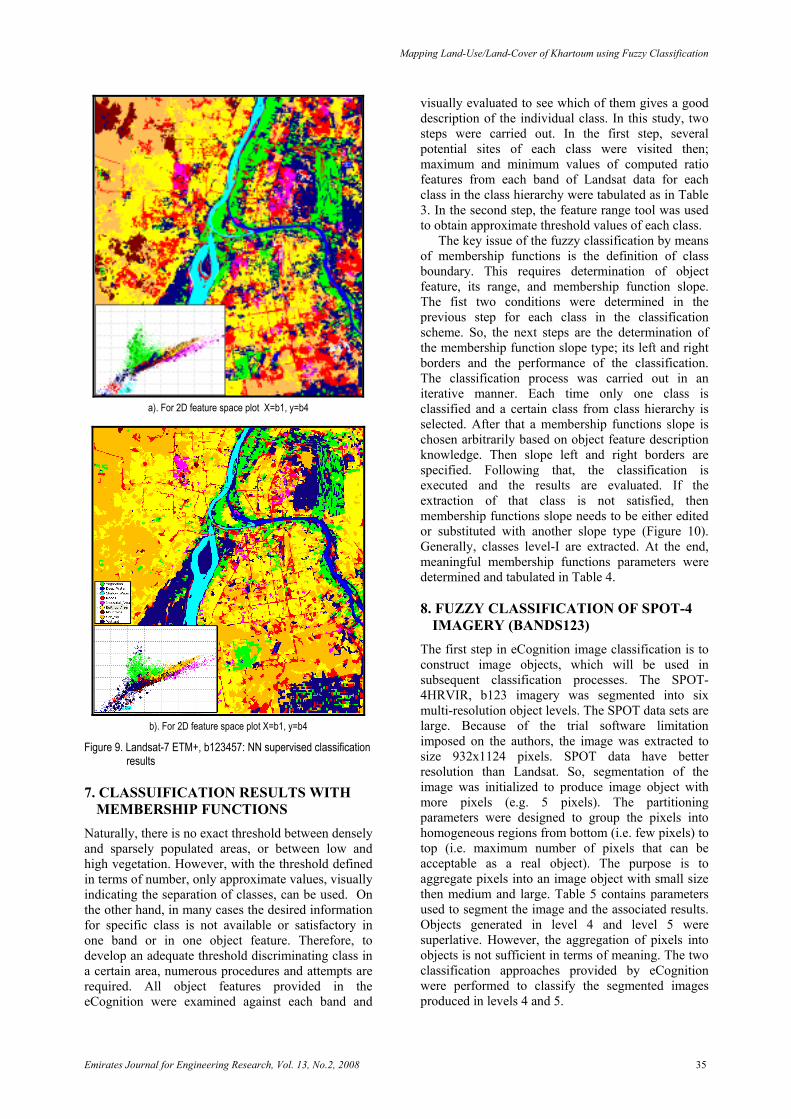
In this experiment, a classification strategy was developed to classify two levels of image segmentation, i.e. level 5 (large objects) and level 2 (small objects). The objects in level 5 become super-objects in the lower level i.e. level 2. The idea is to use the inheritance property to see if it can improve the accuracy. The super-object image is classified using classification scheme level-I (i.e. urban area, transportation, vegetation etc.) with few training sets. In the next step, the class hierarchy is altered to add the sub-class, and the training samples are intensified to refine the classification results. Figure 11a shows training sites. Figure 11b and c show the classified image produced with super- classes and sub-classes respectively.
10. FUZZY CLASSIFICATION WITH MEMBERSHIP FUNCTIONS
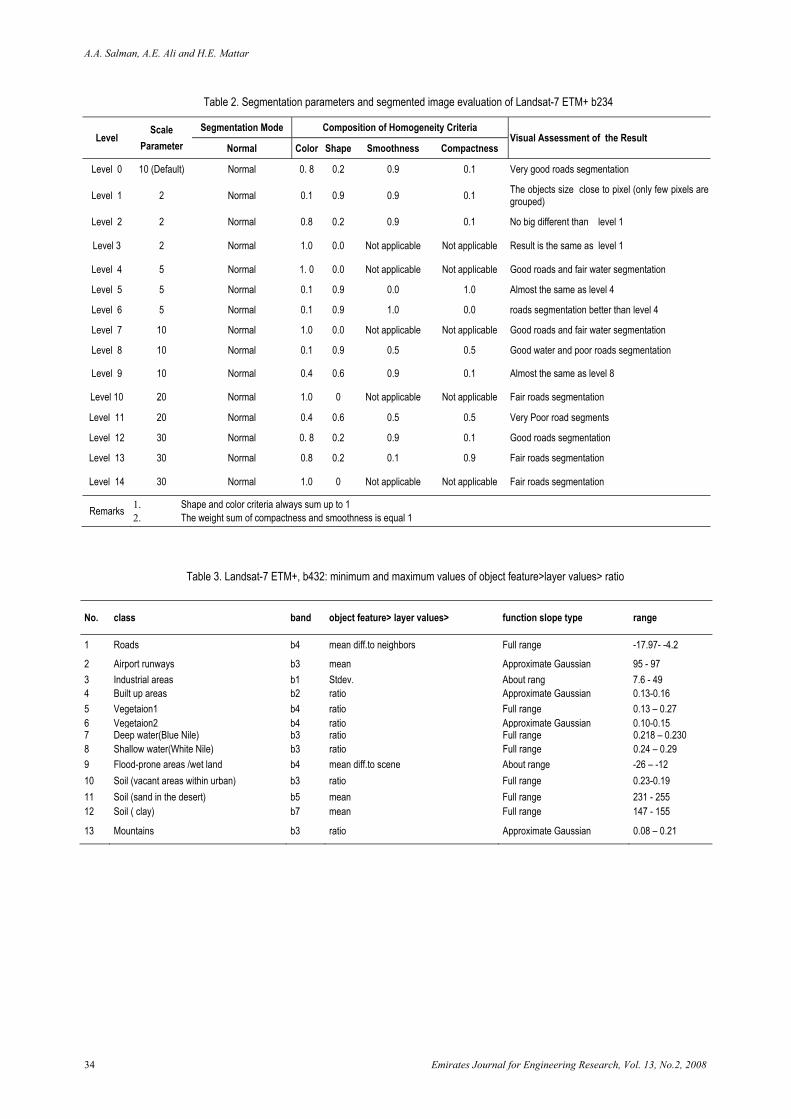
Extraction of LULC as seen in the previous cases, involves several steps, from designing the parameters of the membership functions through classification of the satellite image to the refining the final product. To decide the threshold of membership functions that lead to appropriate classification of the scene, the three SPOT bands were investigated by the “feature view” tool, and the gray layers based on object feature>layer>values>ratio criteria were then generated. The LULC extraction was carried out with the same method developed for Landsat data. The classification was performed with segmentation results produced in level 4. Five classification runs were achieved. The result is quite superlative compared to NN outcomes. A thematic layer of SPOT scene and an enlarged portion of it are displayed in Figure 12.
11. CLASSIFICATION OF IKONOS IMAGERY (BANDS123)
Landsat and SPOT can be used to extract general LULC, although they are not very useful when we deal with urban areas. For example, building footprints, roof tops, individual landmarks and trees are not easy to extract from Landsat 30m or SPOT 10m. High resolution satellite data such as that from Quickbird and IKONOS provide a good alternative to aerial photography and could be used to map urban areas[12]. However, with present image processing tools used by the authors, it is still not a straightforward business. Nevertheless, an attempt was made to test the eCognition classification capability with IKONOS data of the test area.
IKONOS imagery is a color-image resampled to one meter spatial resolution, 8-bit and GeoTIFF format. The IKONOS image was then segmented and classified in two phases. Due to software limitation (the demo version restricts image size to a maximum of 1048576 pixels) , an image size of 970x970 pixels was extracted which covers only a small part of the city, a small portion of the flood-prone areas, part of the White Nile and a small segment of Toti Island (Figure 13). In general, this portion contains a variety of land use/ land cover aspects which made it a good testing site.
One basic rule in segmentation is to create an image object as large as possible and at the same time as small as necessary. Segmentation is a bottom- up starting with one-pixel object to larger objects i.e. with several pixels. In the numerous subsequent steps, smaller image objects are merged into bigger ones. Then, various scales of image segmentation were considered, wherein each successive scale contained a larger image object. Multi-resolution segmentation parameters were utilized including the scale parameter, layer weight and homogeneity criteria.
Level of segmentation
Scale Parameter
Segmentation Mode
Composition of Homogeneity Criterion Visual Assessment of the Results
Color Shape Smoothness Compactness
Level 1 10 (default) normal 0. 8 0.2 0.9 0.1 Object size is small. Some road segments are acceptable.
Level 2 5 normal 1.0 0.0 0.5 0.5 The result is almost the same as level1
Level 3 10 normal 1.0 0.0 0.0 0.0 Acceptable segmentation of road objects and good for major buildings,
Level 4 10 normal 0.0 1.0 1.0 0.0 Good segmentation of road objects and very good for major buildings,
Level 5 20 normal 1.0 0.0 0.0 0.0 Good segmentation of road objects and very good for major buildings,
Level 6 20 normal 0.8 0.2 0.5 0.5 Not better than level 5.
A.A. Salman, A.E. Ali and H.E. Mattar
38 Emirates Journal for Engineering Research, Vol. 13, No.2, 2008
a). Training samples with segmentation level 5
b). Classified image of super-classes
c). Classified image with sub-classes
Figure 11. SPOT-4, band321 NN classification
a). The extracted image
b). Enlarged portion represents middle of the test area
Figure 12. SPOT-4, b321: Membership Functions Classification Result
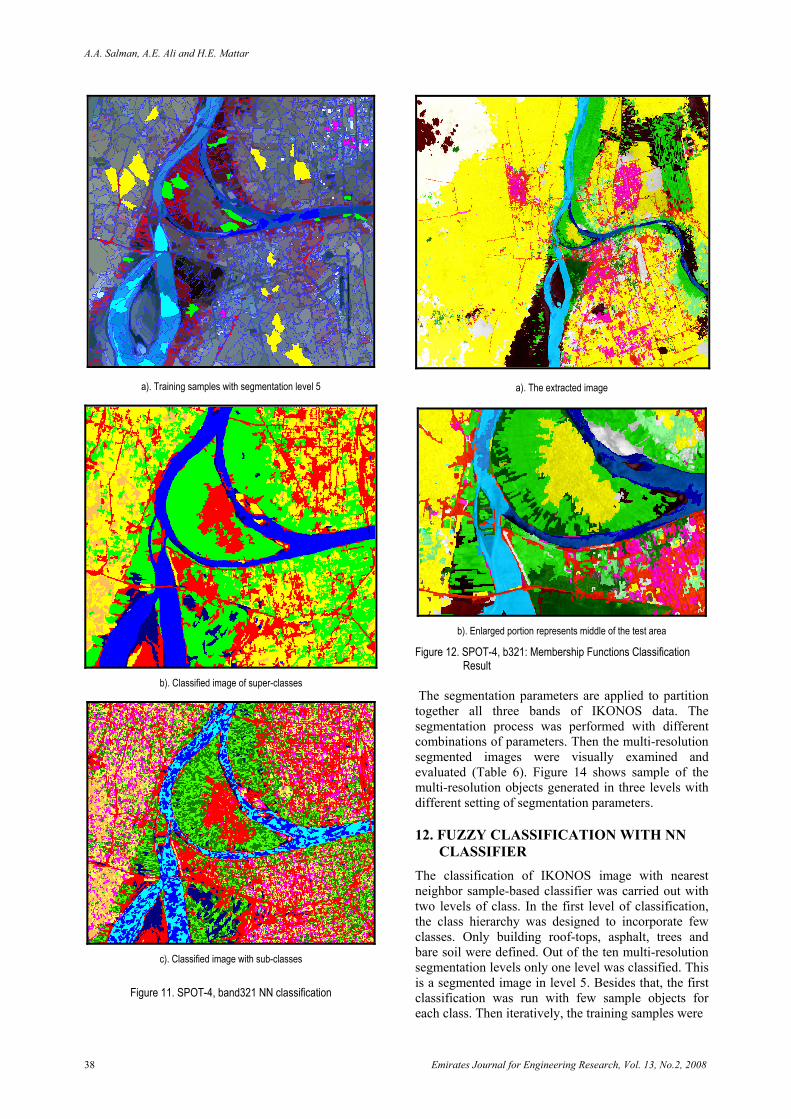
The segmentation parameters are applied to partition together all three bands of IKONOS data. The segmentation process was performed with different combinations of parameters. Then the multi-resolution segmented images were visually examined and evaluated (Table 6). Figure 14 shows sample of the multi-resolution objects generated in three levels with different setting of segmentation parameters.
12. FUZZY CLASSIFICATION WITH NN CLASSIFIER
The classification of IKONOS image with nearest neighbor sample-based classifier was carried out with two levels of class. In the first level of classification, the class hierarchy was designed to incorporate few classes. Only building roof-tops, asphalt, trees and bare soil were defined. Out of the ten multi-resolution segmentation levels only one level was classified. This is a segmented image in level 5. Besides that, the first classification was run with few sample objects for each class. Then iteratively, the training samples were

Mapping Land-Use/Land-Cover of Khartoum using Fuzzy Classification
Emirates Journal for Engineering Research, Vol. 13, No.2, 2008 39
a). Extracted Image-1
b). Extracted Image-2
Figure 13. IKONOS color image chips represent part of Omdurman
urban area increased till satisfactory results were achieved. It was found that tree objects were confused with building shadows. However, the test produced a significant classification of building roof-tops and paved roads. Figure 15 shows the original, the segmented and the final thematic image.
In the second classification performance, the class hierarchy was extended to include features(paved roads, building roof-tops, long building shadows, mixed trees and buildings, residential (houses), vacant areas,vegetation1 (mostly grass), vegetation2 (mostly trees), water bodies, wetlands and mountains Selection of the initial training sample objects were decided in a careful organized manner. The number and distribution of the training sites were chosen to demonstrate the real class as much as possible within the landscape. With larger objects, the classified image looks very smooth and smart. However, classification omission and commission errors are noticeable.
a). Segmented image (level 2)
b). Segmented image:(level 5)
c). Segmented image: (level 10)
Figure 14. IKONOS, b123: image segmentation results (National council area and portion of the River Nile)
A.A. Salman, A.E. Ali and H.E. Mattar
40 Emirates Journal for Engineering Research, Vol. 13, No.2, 2008
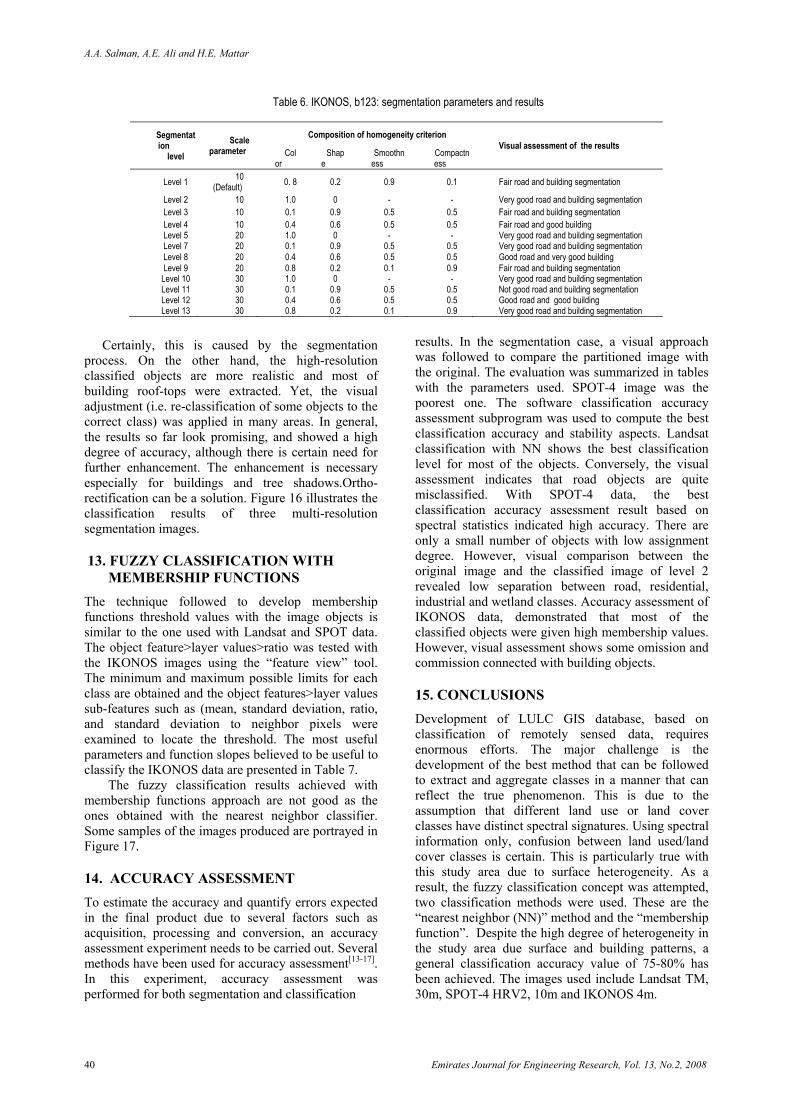
Table 6. IKONOS, b123: segmentation parameters and results
Certainly, this is caused by the segmentation process. On the other hand, the high-resolution classified objects are more realistic and most of building roof-tops were extracted. Yet, the visual adjustment (i.e. re-classification of some objects to the correct class) was applied in many areas. In general, the results so far look promising, and showed a high degree of accuracy, although there is certain need for further enhancement. The enhancement is necessary especially for buildings and tree shadows.Ortho-rectification can be a solution. Figure 16 illustrates the classification results of three multi-resolution segmentation images.
13. FUZZY CLASSIFICATION WITH MEMBERSHIP FUNCTIONS
The technique followed to develop membership functions threshold values with the image objects is similar to the one used with Landsat and SPOT data. The object feature>layer values>ratio was tested with the IKONOS images using the “feature view” tool. The minimum and maximum possible limits for each class are obtained and the object features>layer values sub-features such as (mean, standard deviation, ratio, and standard deviation to neighbor pixels were examined to locate the threshold. The most useful parameters and function slopes believed to be useful to classify the IKONOS data are presented in Table 7.
The fuzzy classification results achieved with membership functions approach are not good as the ones obtained with the nearest neighbor classifier. Some samples of the images produced are portrayed in Figure 17.
14. ACCURACY ASSESSMENT To estimate the accuracy and quantify errors expected in the final product due to several factors such as acquisition, processing and conversion, an accuracy assessment experiment needs to be carried out. Several methods have been used for accuracy assessment[13-17]. In this experiment, accuracy assessment was performed for both segmentation and classification
results. In the segmentation case, a visual approach was followed to compare the partitioned image with the original. The evaluation was summarized in tables with the parameters used. SPOT-4 image was the poorest one. The software classification accuracy assessment subprogram was used to compute the best classification accuracy and stability aspects. Landsat classification with NN shows the best classification level for most of the objects. Conversely, the visual assessment indicates that road objects are quite misclassified. With SPOT-4 data, the best classification accuracy assessment result based on spectral statistics indicated high accuracy. There are only a small number of objects with low assignment degree. However, visual comparison between the original image and the classified image of level 2 revealed low separation between road, residential, industrial and wetland classes. Accuracy assessment of IKONOS data, demonstrated that most of the classified objects were given high membership values. However, visual assessment shows some omission and commission connected with building objects.
15. CONCLUSIONS Development of LULC GIS database, based on classification of remotely sensed data, requires enormous efforts. The major challenge is the development of the best method that can be followed to extract and aggregate classes in a manner that can reflect the true phenomenon. This is due to the assumption that different land use or land cover classes have distinct spectral signatures. Using spectral information only, confusion between land used/land cover classes is certain. This is particularly true with this study area due to surface heterogeneity. As a result, the fuzzy classification concept was attempted, two classification methods were used. These are the “nearest neighbor (NN)” method and the “membership function”. Despite the high degree of heterogeneity in the study area due surface and building patterns, a general classification accuracy value of 75-80% has been achieved. The images used include Landsat TM, 30m, SPOT-4 HRV2, 10m and IKONOS 4m.
Segmentation
level Scale
parameter Composition of homogeneity criterion
Visual assessment of the results Col
or Shap
e Smoothn
ess Compactness
Level 1 10 (Default) 0. 8 0.2 0.9 0.1 Fair road and building segmentation
Level 2 10 1.0 0 - - Very good road and building segmentation Level 3 10 0.1 0.9 0.5 0.5 Fair road and building segmentation Level 4 10 0.4 0.6 0.5 0.5 Fair road and good building Level 5 20 1.0 0 - - Very good road and building segmentation Level 7 20 0.1 0.9 0.5 0.5 Very good road and building segmentation Level 8 20 0.4 0.6 0.5 0.5 Good road and very good building Level 9 20 0.8 0.2 0.1 0.9 Fair road and building segmentation Level 10 30 1.0 0 - - Very good road and building segmentation Level 11 30 0.1 0.9 0.5 0.5 Not good road and building segmentation Level 12 30 0.4 0.6 0.5 0.5 Good road and good building Level 13 30 0.8 0.2 0.1 0.9 Very good road and building segmentation

Mapping Land-Use/Land-Cover of Khartoum using Fuzzy Classification
Emirates Journal for Engineering Research, Vol. 13, No.2, 2008 41
a). Original Image
b). Segmented Image: Level5
c). Classified Image
class hierarchy:
Figure 15. IKONOS color image: segmentation and NN
classification output
a). Segmented image: Level 3
b). Segmented image: Level 7
c). Segmented image: Level 10
Figure 16. IKONOS color image NN classification results

A.A. Salman, A.E. Ali and H.E. Mattar
42 Emirates Journal for Engineering Research, Vol. 13, No.2, 2008
a). Segmented Image: (Level 3)
b). Segmented Image:(Level 7)
c). road network classification result
d).Water: band1, MF slope type(full range)
e).Vegetation2 :band3, MF slope type (Full range)
Figure 17. Samples of membership functions classification results of IKONOS
Generally, classes level-I are extracted when
Landsat images are classified with both NN and membership functions methods. However, results with the latter are more accurate and meaningful. With SPOT-4 HRV2, the best classification accuracy assessment results based on spectral statistics indicated high accuracy. There are only a small number of objects with low assignment degree. However, visual comparison between the original image and the classified image revealed low separation between road, residential, industrial and wetland classes. On the other hand, classification results with IKONOS data, so far look very promising, and showed a high degree of accuracy, although there is certain need for further enhancement. The enhancement is necessary especially for buildings and tree shadows. Ortho-rectification can be a solution. The fuzzy classification results achieved with membership functions approach are not good as the ones obtained with the nearest neighbor classifier.
In conclusion, therefore, high resolution satellite data, such as Quickbird and IKONOS provide a good alternative to aerial photography and could be used to map urban areas. However, with present image processing tools used by the authors, particularly in the present test area, it is still not a straightforward process. Further research experiments are, therefore, recommended

Mapping Land-Use/Land-Cover of Khartoum using Fuzzy Classification
Emirates Journal for Engineering Research, Vol. 13, No.2, 2008 43
Table 7. IKONOS: Membership functions classification parameters settings
REFERENCES 1. Baatz, M. (2001). eCognition User Guide 2.0: Object
Oriented Image Analysis, Definiens Imaging GmbH, Munich, Germany., 427.
2. Pekkarinen, A. (2004). Image segmentation in multisource forest inventory. Finnish Forest Research Institute, Research Paper 926.
3. http://www.definiens.com/ visited 2005. 4. Ibrahim, I.M. (1984). The social and environmental
impact of industrial wastes on the waste workers in Khartoum North. A monograph Published by the Institute or Environmental Studies, University of Khartoum, 126.
5. Ali, A.E. (1988). Assessment of visual interpretation of the thematic mapper (TM) images for land use and land cover in Sudan. Earth Surface Processes and Landforms, 14, 399-405.
6. eCognition User Guide 3 (2003). Definiens Imaging, 3-2.
7. Lillesand, T.M., Kiefer, R.W. and Chipman, J.W. (2004). Remote Sensing and Image Interpretation, Fifth Edition. John Wiley and Sons, New York, U.S.A., 750.
8. http://www.fao.org visited 2006. 9. Jensen, J.R. (2005). Introductory Digital Image
Processing: A Remote Sensing Perspective, Third Edition. Prentice-Hall, New Jersey, U.S.A., 526.
10. Anderson, J.R. (1976). A Land use and land cover classification system for use with remote sensor data. Geological Survey Professional Paper 964, Government Printing Office, Washington, DC. U.S.A.
11. Petrie, G. (2002). Optical imagery from airborne and spaceborne platforms: comparisons of resolution, coverage and geometry for a given ground pixel size. GeoInformatics, 5, 1, 28-35.
12. Aguilar, M.A. (2007). Geometric accuracy assessment of QuickBird basic imagery using different operational approaches. Photogrammetric Engineering and Remote Sensing, 73, 12, 1321–1332.
13. Aronoff, S. (1985). The minimum accuracy value as an index of classification accuracy. Photogrammetric Engineering and Remote Sensing, 51, 1, 99-111.
14. Rosenfield, G. (1981). Analysis of variance of thematic mapping experimental data. Photogrammetric Engineering and Remote Sensing, 47, 12, 685-1692.
15. Skidmore, A. and Turner, B. (1989). Assessing the accuracy of resource inventory maps, in Proceedings of Global Natural Resource Monitoring and Assessments: Preparing for the 21st Century. Venice, Italy, 2, 524-535.
16. Stehman, S.V. and Czaplewski, R.L. (1998). Design and analysis for thematic map accuracy assessment: fundamental principles. Remote Sensing of Environment, 64, 331–344.
No. Class hierarchy band object feature> layer values> Function slope range 1 Paved roads b21 StdDev Full range 3.1 – 3.45 2 Building roof tops b1 mean Approximate Gaussian 538 - 798 3 Building shadows b3 mean About range 27 - 32 4 Mixed tree and buildings b2 ratio Approximate Gaussian 0.31 – 0.34 5 Residential b4 ratio Full range 4.01 – 4.45 6 Vacant areas b1 mean Approximate Gaussian 198 - 591 7 Vegetaion1 b3 ratio Approximate Gaussian 0.293 – 0.348 8 Vegetaion2 b3 StdDev.to neighbour pixels-Full range About range 34.6 – 52.2 9 Water b1 StdDev About range 5.11 – 14.29
10 Wet lands b3 ratio Approximate Gaussian 178 - 461 11 Mountains Not covered by the scene