mapping the development process in cape town
TRANSCRIPT

Mapping the Development Process in Cape Town
May 2018

The UCT Nedbank Urban Real Estate Research Unit (URERU) is a research unit in the Department of Construction Economics and Management
Aim is to provide a research platform for urban real estate economic, finance and
management issues on the African continent.
Real Estate Market Dynamics
& Trends
Investment & Finance
Urban Development &
Management
African Real Estate Markets
Public Land Development
Research Programme
Leasehold Land Release Models
Public Sector Property
Developments Success Factors
Real Estate Training
Mapping the Development Process / Cost
Drivers
Johannesburg Property Company (JPC) • CoCT • Other municipalities
& state entities

Challenge: Not building enough (affordable) housing…
Estimated number of households = 1 200 000
Estimated number of formal houses = 880 000 (incl. shared)
Estimated shortfall = 320 000
Estimated household growth = 1,8% p.a.
Estimated house growth as a % of HH = 1,1% p.a.
Need between 30 000 – 40 000 houses p.a.
Building between 8 000 – 10 000 p.a.
(Own calculation – STATSSA, CoCT)
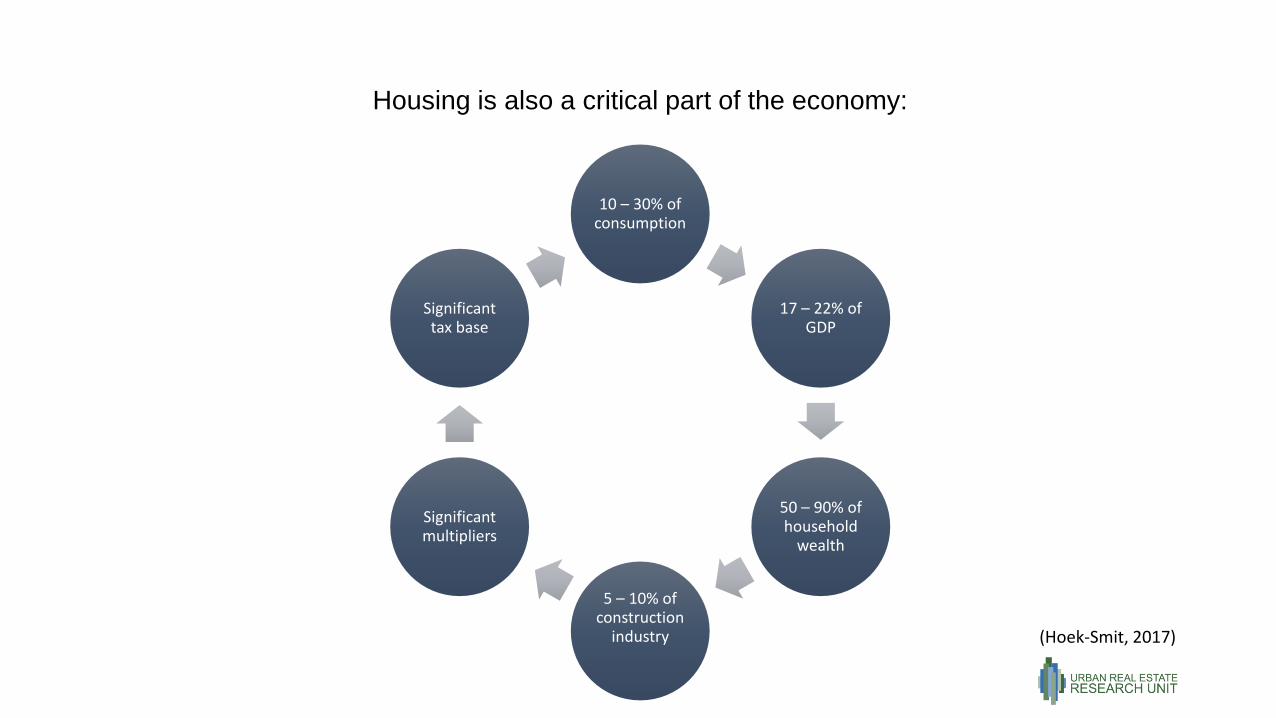
Housing is also a critical part of the economy:
(Hoek-Smit, 2017)
10 – 30% of consumption
17 – 22% of GDP
50 – 90% of household
wealth
5 – 10% of construction
industry
Significant multipliers
Significant tax base


Why?
• The “Value vs. Cost” equation is working the wrong way • Rental yields 5 – 7%
• Cost of finance 10 – 15%
Value is a function of income and is unlikely to change in the short-run, therefore need to look at costs

Drivers of Costs
(Njokweni et al, 2016)
Scarcity Factor
Non Construction Costs

Drivers of Costs
Constructions costs:
• Building materials low (1,8%)
• Tender prices low (4%)
Non construction costs:
• Land
• Development rights
• Infrastructure
Land production process
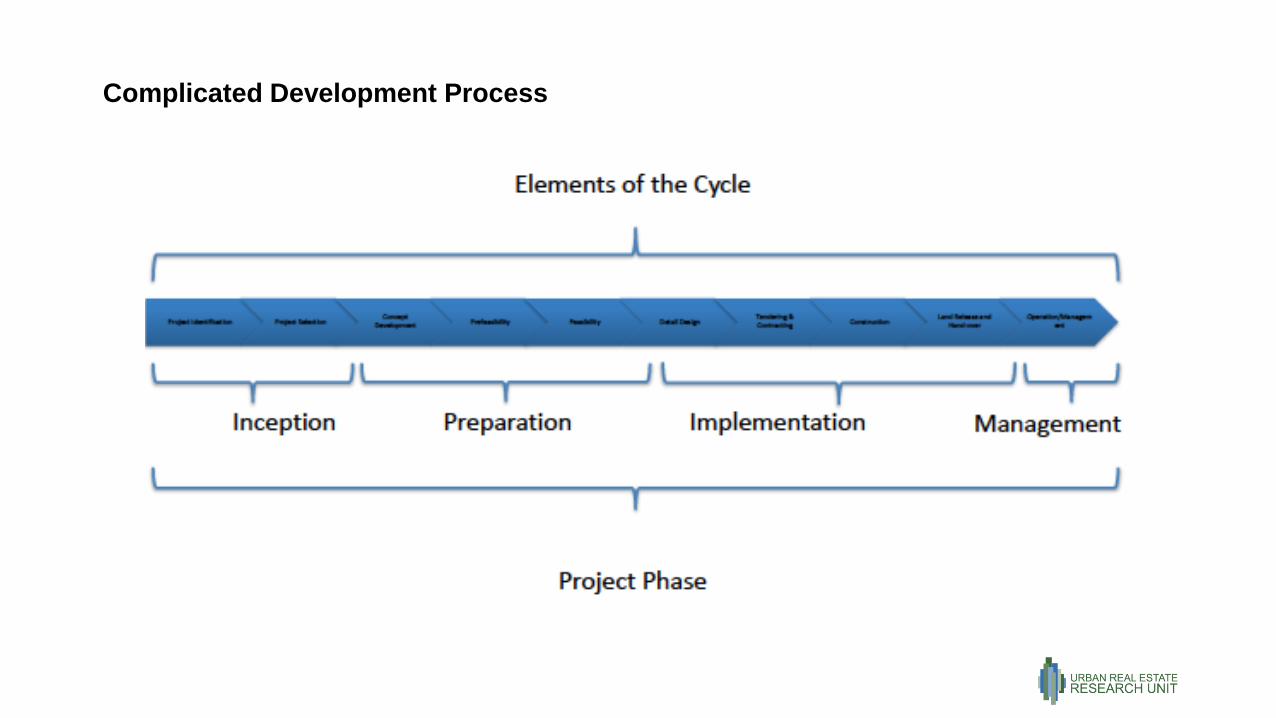
Complicated Development Process

Mapping Exercise
• UCT Nedbank Urban Real Estate Research Unit (URERU) identify non construction-related drivers of the cost of housing development.
• Unrelated, MDA Projects & WCDF begin
mapping the development process.
• Informal agreement between URERU,
MDA & CoCT for URERU to continue to
map the development process.
• Phase 1: Map steps and timeframes
Phase 2: Map costs & include acquiring finance process.
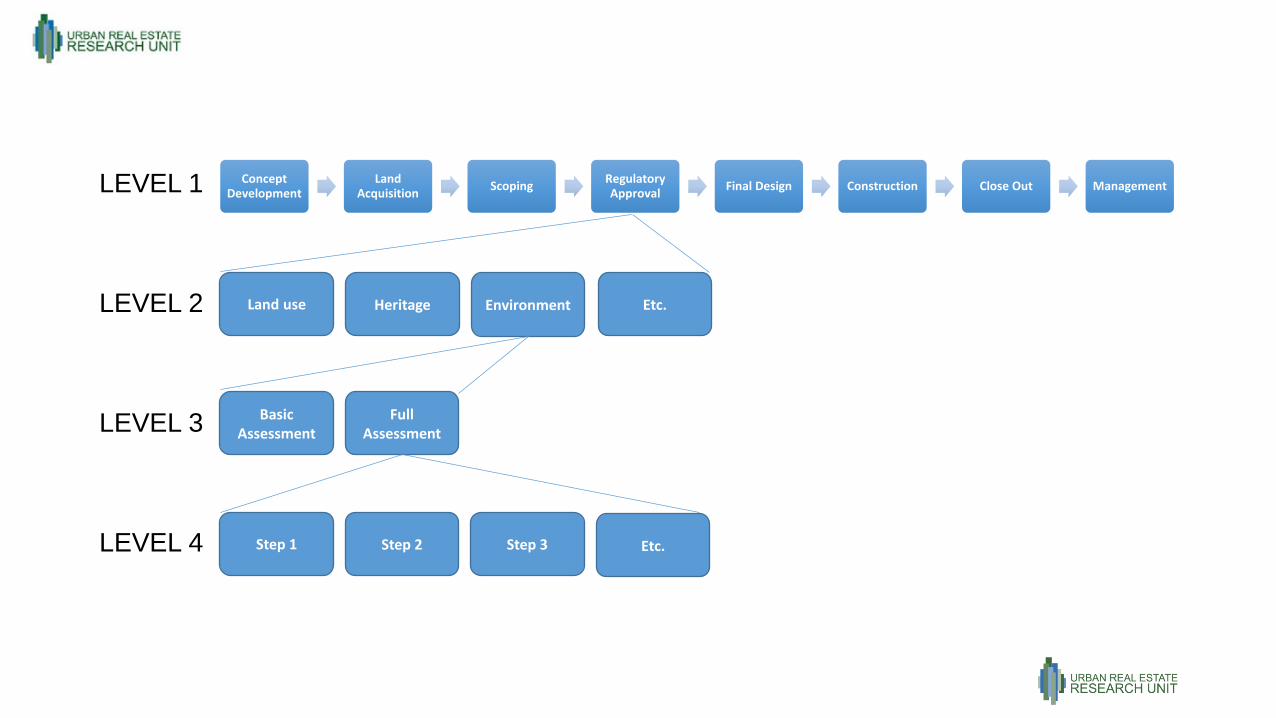
LEVEL 1
LEVEL 2
LEVEL 3
LEVEL 4
Concept Development
Land Acquisition
Scoping Regulatory Approval
Final Design Construction Close Out Management
Environment Heritage Land use
Full Assessment
Basic Assessment
Etc.
Step 3 Step 2 Step 1 Etc.

Development Process
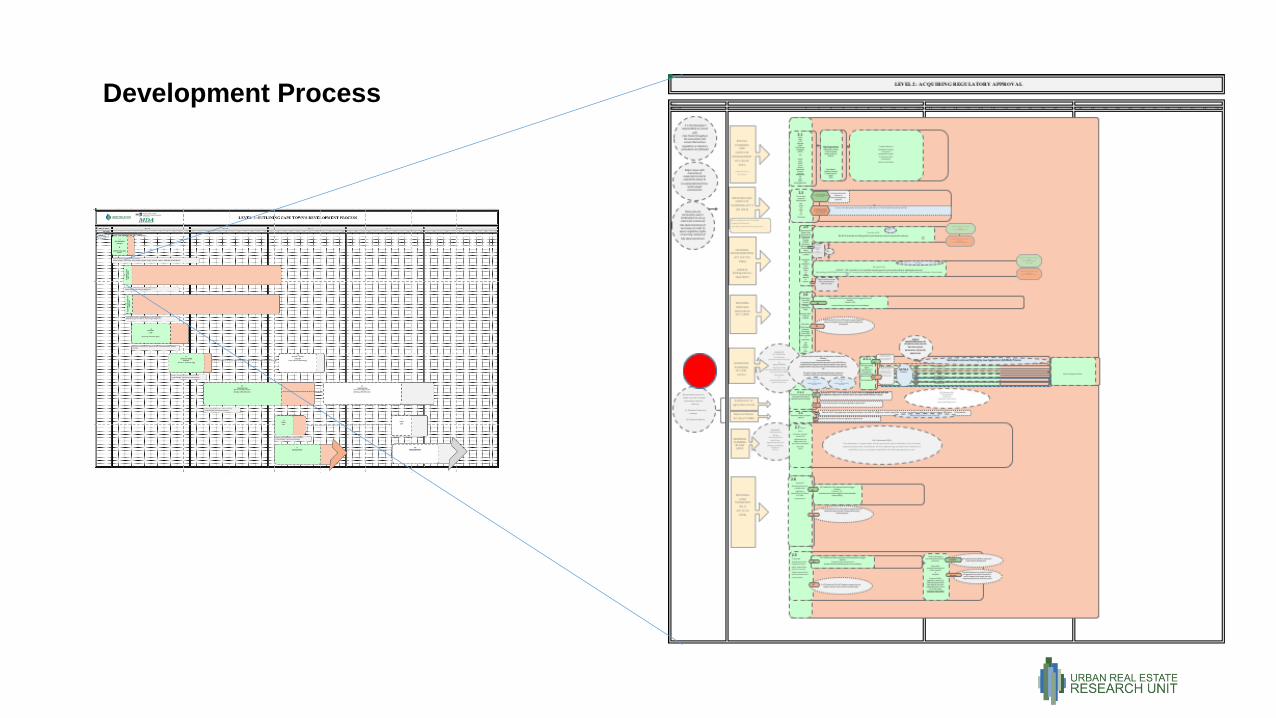
Development Process

Development Process

Planning, EIA, HIA, Water License
Does not show depencies
Not applicable to every application

Process Triggers
Triggers Relevant Legislation
Building plans
• No approved building plans for intended
development
• National Building Regulations and Building Standards Act
103 of 1977. (NBR)
Planning
• Change in land use rights from what is permitted in
MPBL and Scheme
• Deviation from permitted development parameters
• Deviation from conditions applicable to land (title
deed or other past approvals)
• Subdivision of land
• Planning By-Law of relevant Municipality
• Relevant Municipal Zoning Scheme ( eg. Development
Management Scheme in Cape Town)
• Roads Ordinance No 19 of 1975
• Roads and Ribbons Development Act 21 of 1940
• Western Cape Land Use Planning Act 3 of 2014 (LUPA)
• National Spatial Planning and Land Use Management Act 16
of 2013 (SPLUMA)
Heritage
• Permits: Building older than 60 years, Provincial or
National Heritage site, protected area, heritage
objects, monument.
• Various triggers for NID submission (S38)
• National Heritage Resources Heritage Act 25 of 1999.
(NHRA)
Environmental
• Various triggers i.t.o. the NEMA regulations for BAR
or EIA
• National Environmental Management Act 107 of 1998
(NEMA)
• Various other associated acts such as Water Use License
Act, Waste management Act, Air Quality Act, Noise
regulations
Agricultural
• Agricultural land outside previous municipal
boundaries
• Transformation of cultivated land
• Subdivision of Agricultural Land Act 70 of 1970)
• Western Cape Land Use Planning Act 3 of 2014 (LUPA) (S
53 application)

Common Development Application Types (Before delays):
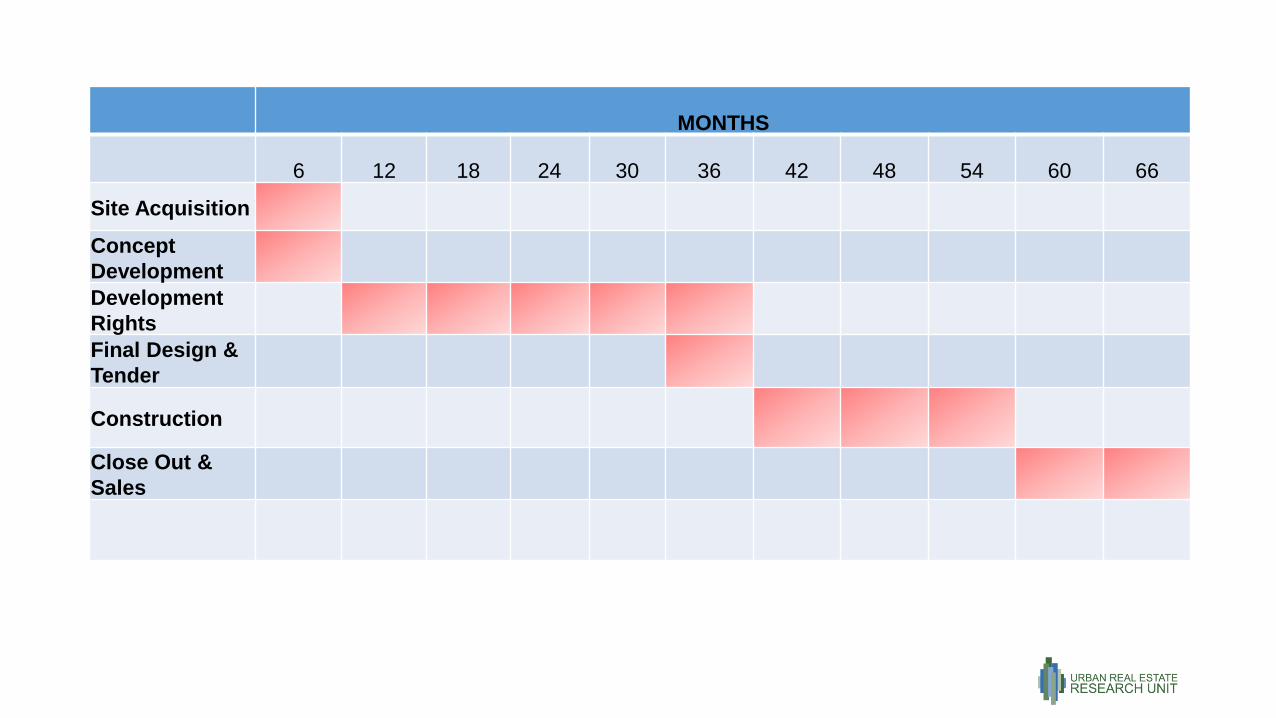
MONTHS
6 12 18 24 30 36 42 48 54 60 66
Site Acquisition
Concept
Development
Development
Rights
Final Design &
Tender
Construction
Close Out &
Sales

No delay 1 year 2 Year 3 Year 4 Year Year 5
1. Finance Cost on
Land R22 204 069 R24 651 034 R27 367 663 R30 383 674 R33 732 060 R37 449 449
Difference R2 446 965 R5 163 594 R8 179 605 R11 527 991 R15 245 380
2. Construction Cost
Escalation R101 720 500 R110 711 667 R120 497 572 R131 148 461 R142 740 793 R155 357 780
Difference R8 991 167 R18 777 072 R29 427 961 R41 020 293 R53 637 2803.
3. Rates & Taxes R220 000 R237 600 R256 608 R277 137 R299 308 R323 252
Total Difference R11 675 732 R24 197 274 R37 884 703 R52 847 591 R69 205 913
TOTAL COST R171 000 000 R182 675 732 R195 197 274 R208 884 703 R223 847 591 R240 205 913
% Increase in Total
Cost 7% 14% 22% 31% 40%

No delay 1 year 2 Year 3 Year 4 Year Year 5
Cost of Rentable Area m2 R19 322,03 R20 641,33 R22 056,19 R23 602,79 R25 293,51 R27 141,91
Required Rental to Repay
Finance R255,00 R273,00 R291,00 R312,00 R334,00 R359,00
Floor Area Affordable 20 20 20 20 20 20
Rent R5 000,00 R5 352,94 R5 705,88 R6 117,65 R6 549,02 R7 039,22
Required Income R20 000,00 R21 411,76 R22 823,53 R24 470,59 R26 196,08 R28 156,86
41% Increase
Causes of Delay
• Stipulated time-frames • Not all stipulated
• Impacted by dependencies – Relationships within and between processes
• Actual time-frames • Poor quality applications
• Resource shortages
• Lack of prioritisation
• Resource allocation to simple vs complex projects
• Personality-driven
• “Gaming of the system“

Causes of Delay
• Additional regulation • Increases preparation time and cost e.g. Specialist studies
• Increased opportunity for objections
• Conditions of approval • Direct cost
• Impact on H&B Use
• Appeal process

Selected Impacts Per Stage of the Development Process (Focus Group)
1. LAND PRODUCTION
• Availability and cost of options
• Direct costs: • Finance costs
• Rates & Taxes
• Finance costs
• Opportunity costs
• Professional costs
• Fees – flat rate, no repition factor or sliding scale

2. CONSTRUCTION
• Characteristed by sub-contracting to avoid fixed costs: • Property cycle
• Land production process
• Specialist requirements
• Increases costs: • Project management costs – coordination
• Profit ratcheting
• Poor work – “lowest tender to ensure viability“

3. GENERAL
• Inability to secure a project pipeline • Ability to carry fixed costs
• Ability to retain “IP“ ito development team (sub-contractors)
• Project managment cost of addressing the delay
• Over specification by professionals to ensure endemnity

3. GENERAL
• Change in market conditions: • Construction costs
• Rental and sales rates
• Property type demand
• Time AND Timing of the delay is important • Issues need to be identified early in the process
• Time AND Uncertainty of the outcome increases contigency and profit requirement

Phase 2:
• Refine in terms of trigger processes
• Include accessing development finance process
• Development a user-friendly interface
• Allow adaption to bespoke project types
Thank you to the following for their assistance to date:
• Lewin Rolls
• MDA Projects, Talani and WPCDF
• CoCT
• Interviewed Planning and Development Professionals

www.ureru.uct.ac.za