maps and data types in gis - lakehead...
TRANSCRIPT
Lecture 3
Maps and Data Types in GIS
Tomislav Sapic
GIS Technologist
Faculty of Natural Resources Management
Lakehead University
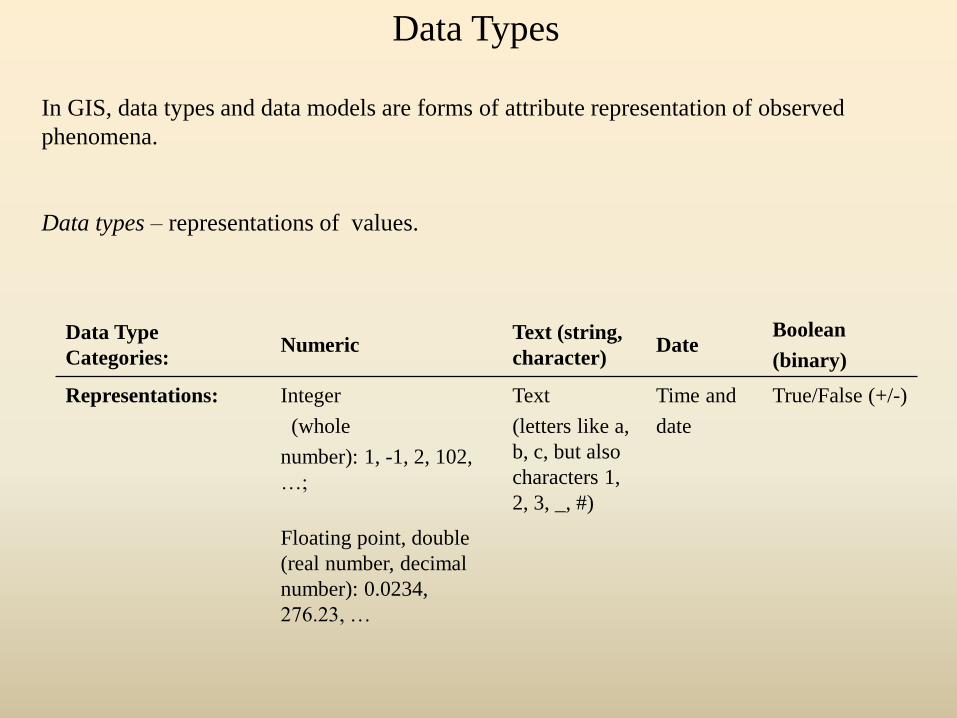
Data Types
In GIS, data types and data models are forms of attribute representation of observed
phenomena.
Data types – representations of values.
Data Type
Categories:Numeric
Text (string,
character)Date
Boolean
(binary)
Representations: Integer
(whole
number): 1, -1, 2, 102,
…;
Text
(letters like a,
b, c, but also
characters 1,
2, 3, _, #)
Time and
date
True/False (+/-)
Floating point, double
(real number, decimal
number): 0.0234,
276.23, …
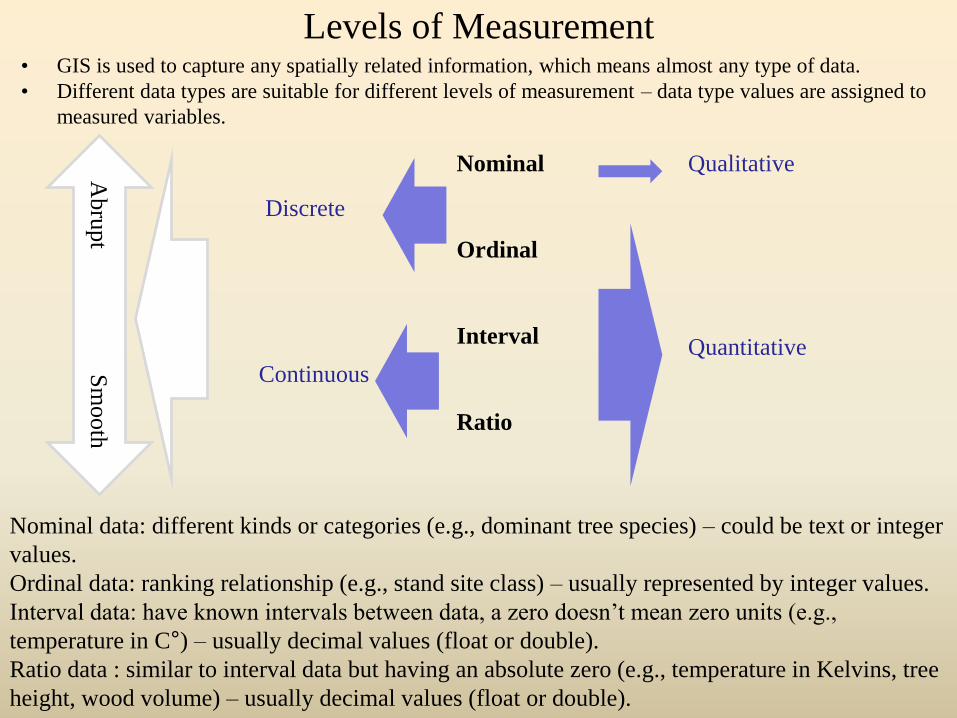
Levels of Measurement
Nominal
Ordinal
Interval
Ratio
Qualitative
Quantitative
Discrete
Continuous
Abru
pt S
mooth
Nominal data: different kinds or categories (e.g., dominant tree species) – could be text or integer
values.
Ordinal data: ranking relationship (e.g., stand site class) – usually represented by integer values.
Interval data: have known intervals between data, a zero doesn’t mean zero units (e.g.,
temperature in C°) – usually decimal values (float or double).
Ratio data : similar to interval data but having an absolute zero (e.g., temperature in Kelvins, tree
height, wood volume) – usually decimal values (float or double).
• GIS is used to capture any spatially related information, which means almost any type of data.
• Different data types are suitable for different levels of measurement – data type values are assigned to
measured variables.
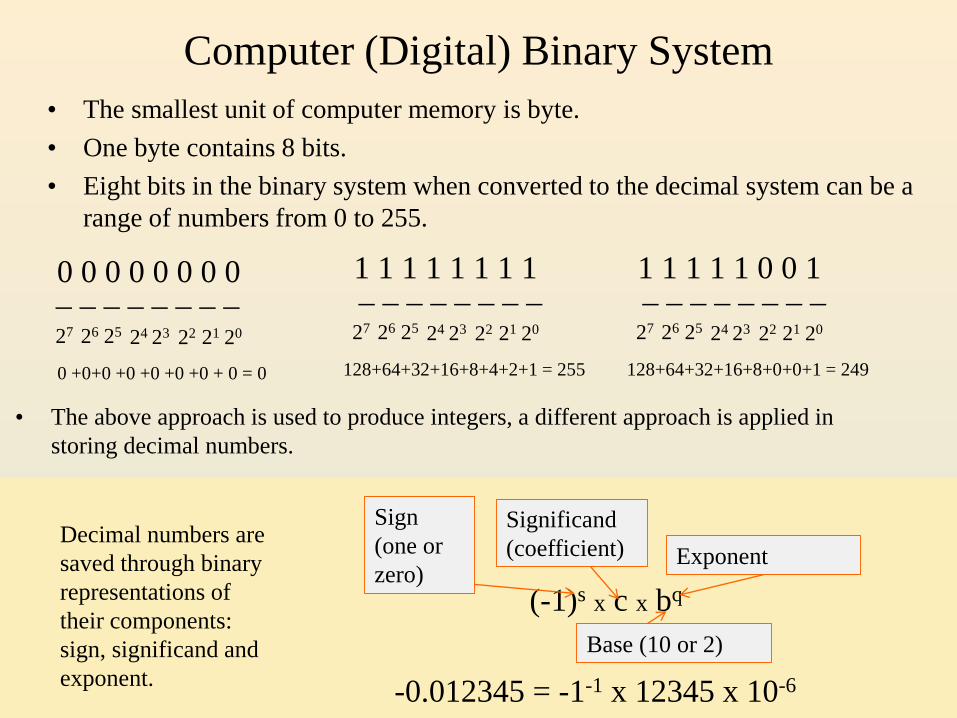
Computer (Digital) Binary System
• The smallest unit of computer memory is byte.
• One byte contains 8 bits.
• Eight bits in the binary system when converted to the decimal system can be a
range of numbers from 0 to 255.
_ _ _ _ _ _ _ _ 0 0 0 0 0 0 0 0
27 26 25 24 23 22 21 20
0 +0+0 +0 +0 +0 +0 + 0 = 0
1 1 1 1 1 1 1 1
27 26 25 24 23 22 21 20
128+64+32+16+8+4+2+1 = 255
_ _ _ _ _ _ _ _ 1 1 1 1 1 0 0 1
27 26 25 24 23 22 21 20
128+64+32+16+8+0+0+1 = 249
_ _ _ _ _ _ _ _
(-1)s x c x bq
Sign
(one or
zero)
Significand
(coefficient)
Base (10 or 2)
Exponent
-0.012345 = -1-1 x 12345 x 10-6
Decimal numbers are
saved through binary
representations of
their components:
sign, significand and
exponent.
• The above approach is used to produce integers, a different approach is applied in
storing decimal numbers.
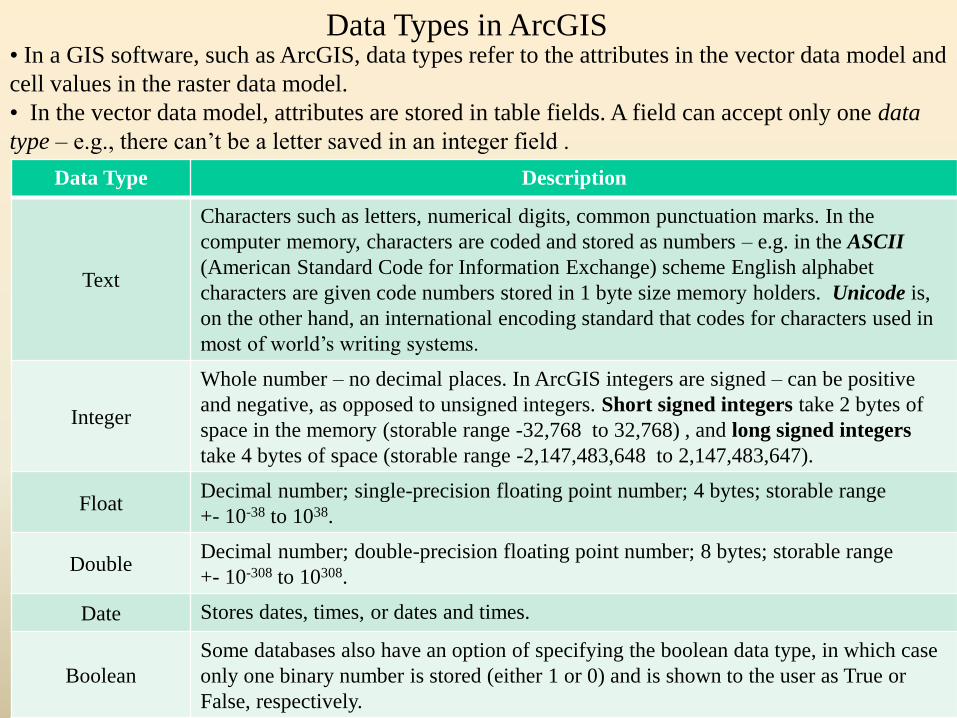
Data Types in ArcGIS• In a GIS software, such as ArcGIS, data types refer to the attributes in the vector data model and
cell values in the raster data model.
• In the vector data model, attributes are stored in table fields. A field can accept only one data
type – e.g., there can’t be a letter saved in an integer field .
Data Type Description
Text
Characters such as letters, numerical digits, common punctuation marks. In the
computer memory, characters are coded and stored as numbers – e.g. in the ASCII
(American Standard Code for Information Exchange) scheme English alphabet
characters are given code numbers stored in 1 byte size memory holders. Unicode is,
on the other hand, an international encoding standard that codes for characters used in
most of world’s writing systems.
Integer
Whole number – no decimal places. In ArcGIS integers are signed – can be positive
and negative, as opposed to unsigned integers. Short signed integers take 2 bytes of
space in the memory (storable range -32,768 to 32,768) , and long signed integers
take 4 bytes of space (storable range -2,147,483,648 to 2,147,483,647).
Float Decimal number; single-precision floating point number; 4 bytes; storable range
+- 10-38 to 1038.
DoubleDecimal number; double-precision floating point number; 8 bytes; storable range
+- 10-308 to 10308.
Date Stores dates, times, or dates and times.
Boolean
Some databases also have an option of specifying the boolean data type, in which case
only one binary number is stored (either 1 or 0) and is shown to the user as True or
False, respectively.
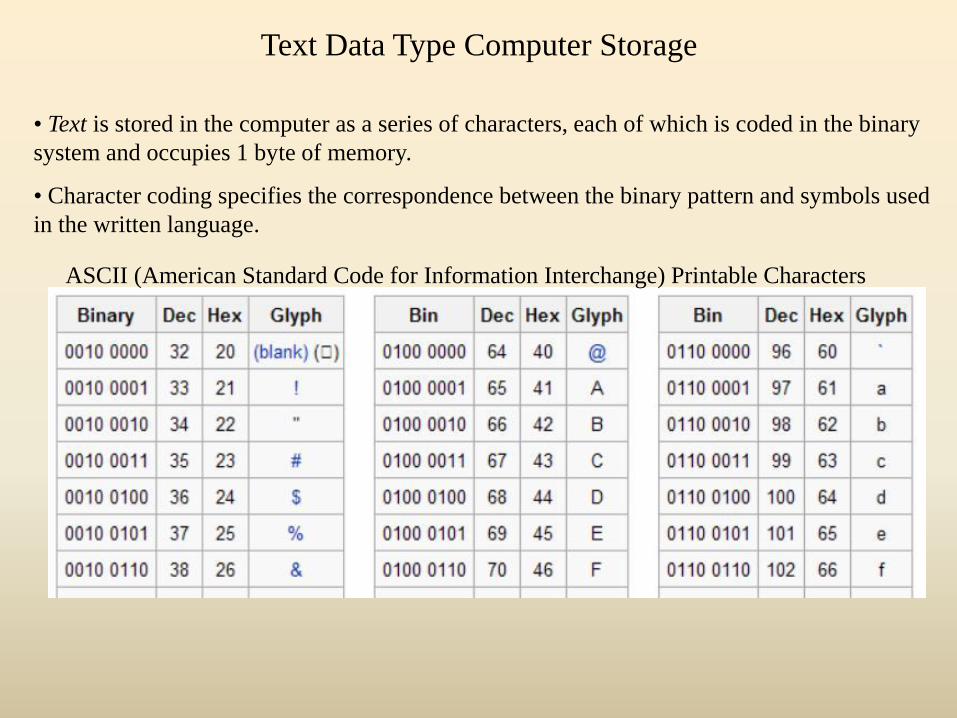
• Text is stored in the computer as a series of characters, each of which is coded in the binary
system and occupies 1 byte of memory.
• Character coding specifies the correspondence between the binary pattern and symbols used
in the written language.
ASCII (American Standard Code for Information Interchange) Printable Characters
Text Data Type Computer Storage
Data Types in Vector Data Model
• In the vector data model, data types refer to designations of the fields in the table – each field
is assigned a certain data type and only values of that data type can be stored in that particular
field.
• Data types are decided on during the process of the table design and are based on the data
that are being stored or anticipated to be stored and the type of analysis one expects to carry
out.
• Issues such as expected range of numerical values, length of a text (character) values string
are part of the decision.
Ontario_major_cities.shp• Fields are attributes,
meaning, variables,
and values for each
attribute/variable are
stored for individual
records (i.e., one or
multiple spatial
features).
• Fields created of a
certain data type occupy
the memory space
relative to the number of
records (rows) and
irrespective of the values
stored in them.
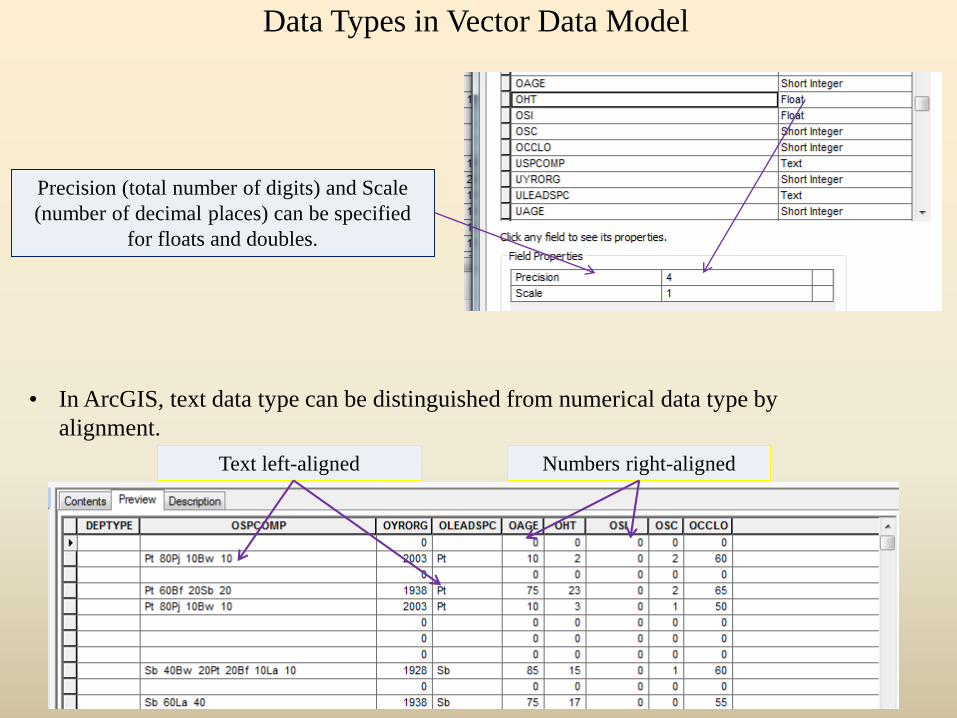
Numbers right-alignedText left-aligned
Precision (total number of digits) and Scale
(number of decimal places) can be specified
for floats and doubles.
Data Types in Vector Data Model
• In ArcGIS, text data type can be distinguished from numerical data type by
alignment.
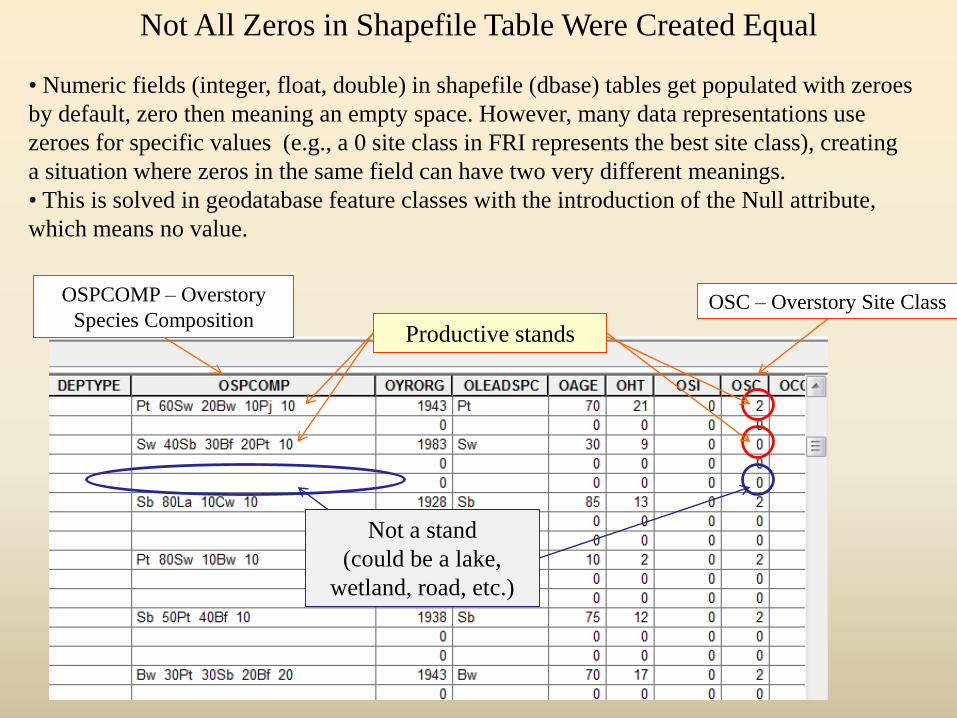
Not All Zeros in Shapefile Table Were Created Equal
• Numeric fields (integer, float, double) in shapefile (dbase) tables get populated with zeroes
by default, zero then meaning an empty space. However, many data representations use
zeroes for specific values (e.g., a 0 site class in FRI represents the best site class), creating
a situation where zeros in the same field can have two very different meanings.
• This is solved in geodatabase feature classes with the introduction of the Null attribute,
which means no value.
Not a stand
(could be a lake,
wetland, road, etc.)
Productive stands
OSC – Overstory Site ClassOSPCOMP – Overstory
Species Composition
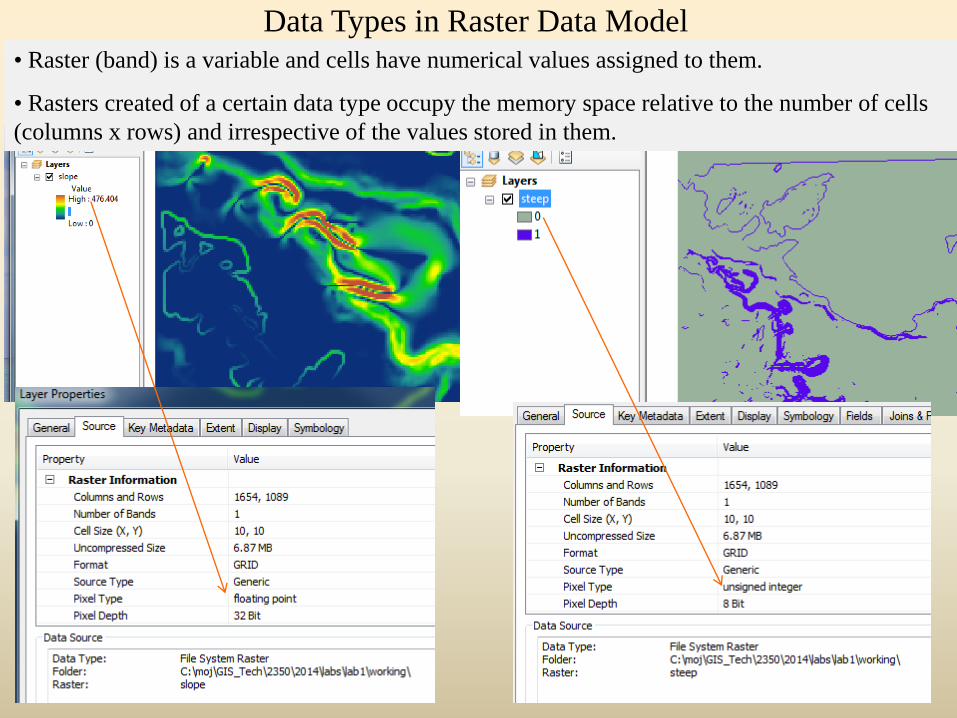
Data Types in Raster Data Model• Raster (band) is a variable and cells have numerical values assigned to them.
• Rasters created of a certain data type occupy the memory space relative to the number of cells
(columns x rows) and irrespective of the values stored in them.
Maps in GIS
Several definitions from different sources on what a map is:
1. A map is a representation of spatial information.
2. A map is a spatial representation of the environment.
3. A map is a simplified depiction of a space, a navigational aid
which highlights relations between objects within that space.
Maps in GIS
Two points to keep in mind regarding maps:
• Maps are a form of communication, which means that what they show should
be clear and understandable to a broad range of users. This then invokes
symbology, selectiveness and narration.
• Being a simplified spatial representation and (almost exclusively) a scaled-
down one, maps have to provide information in a way that will enable the users
to understand orientation, spatial characteristics and spatial relations between
the represented features (phenomena).
Maps in GIS
• Easiness with which maps can be made with GIS software and abundance of GIS
datasets have opened room for an easy creation of maps that often end up being of
poor quality in terms of their content and functionality.
• When creating maps, GIS users should at the very least include all map elements,
make the content clear and understandable (proper names of legend items, clear
labelling, etc.), and use conventional colours for basic features (blue for lakes and
streams, black or red for roads, etc.).
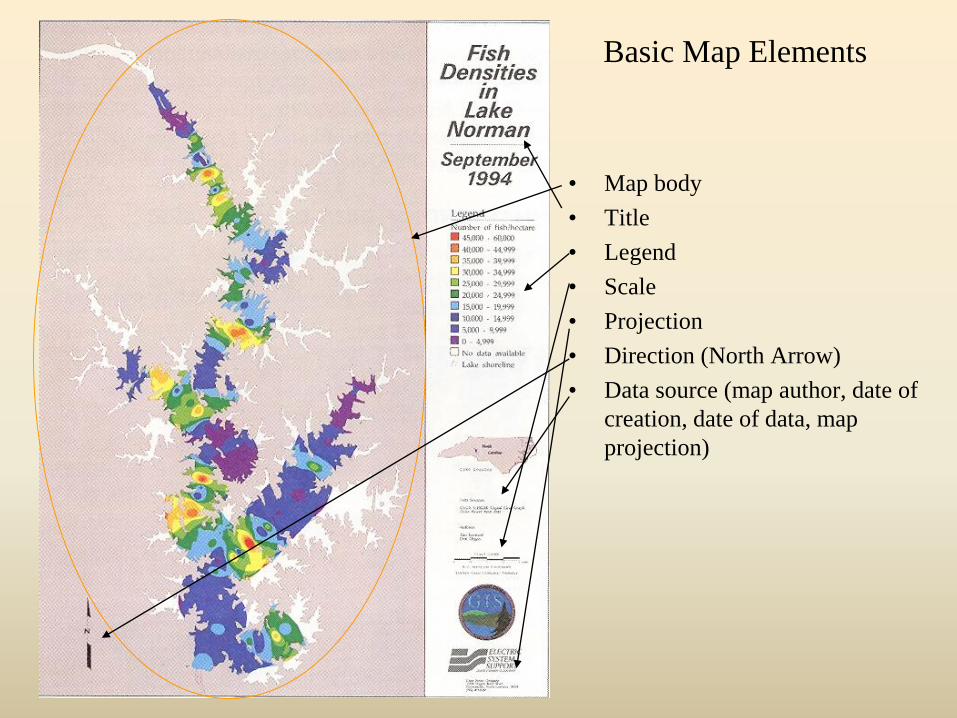
Basic Map Elements
• Map body
• Title
• Legend
• Scale
• Projection
• Direction (North Arrow)
• Data source (map author, date of
creation, date of data, map
projection)
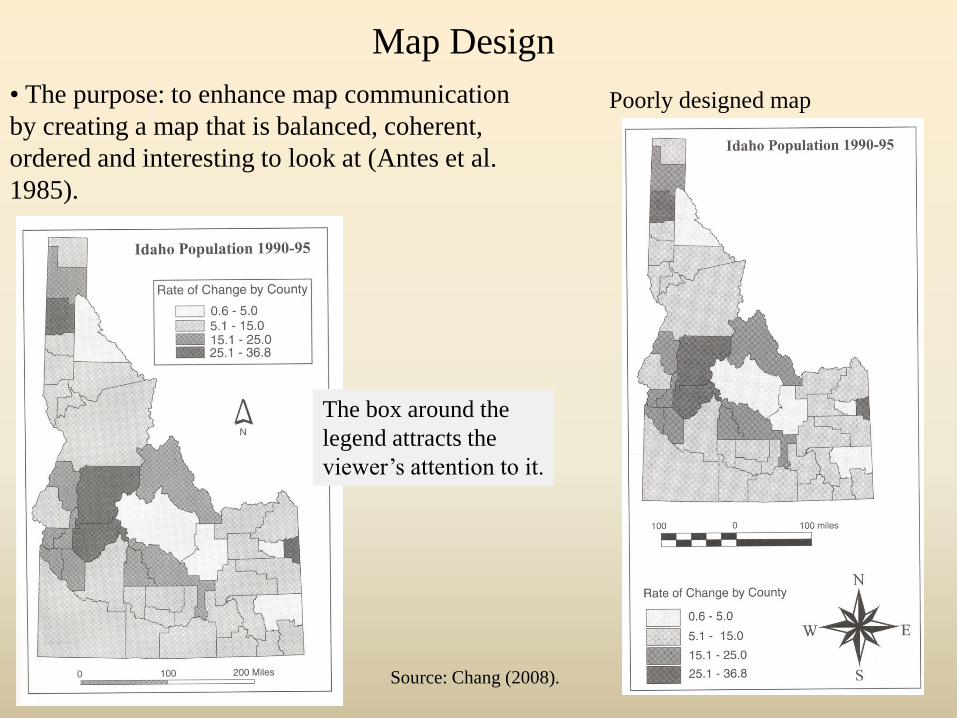
Map Design
• The purpose: to enhance map communication
by creating a map that is balanced, coherent,
ordered and interesting to look at (Antes et al.
1985).
Poorly designed map
The box around the
legend attracts the
viewer’s attention to it.
Source: Chang (2008).
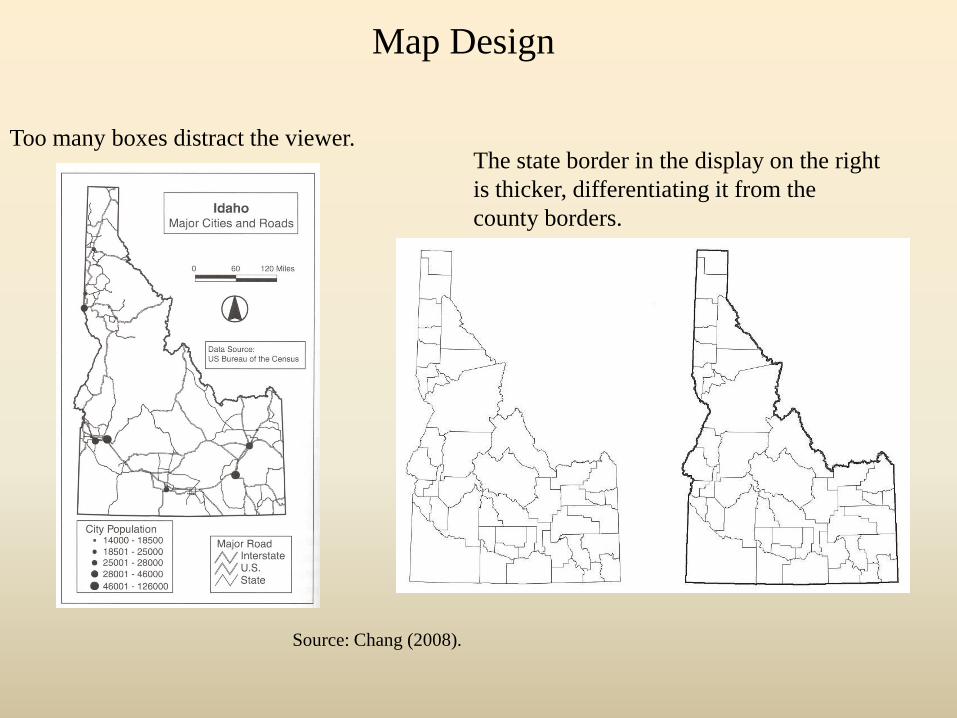
Too many boxes distract the viewer.The state border in the display on the right
is thicker, differentiating it from the
county borders.
Source: Chang (2008).
Map Design
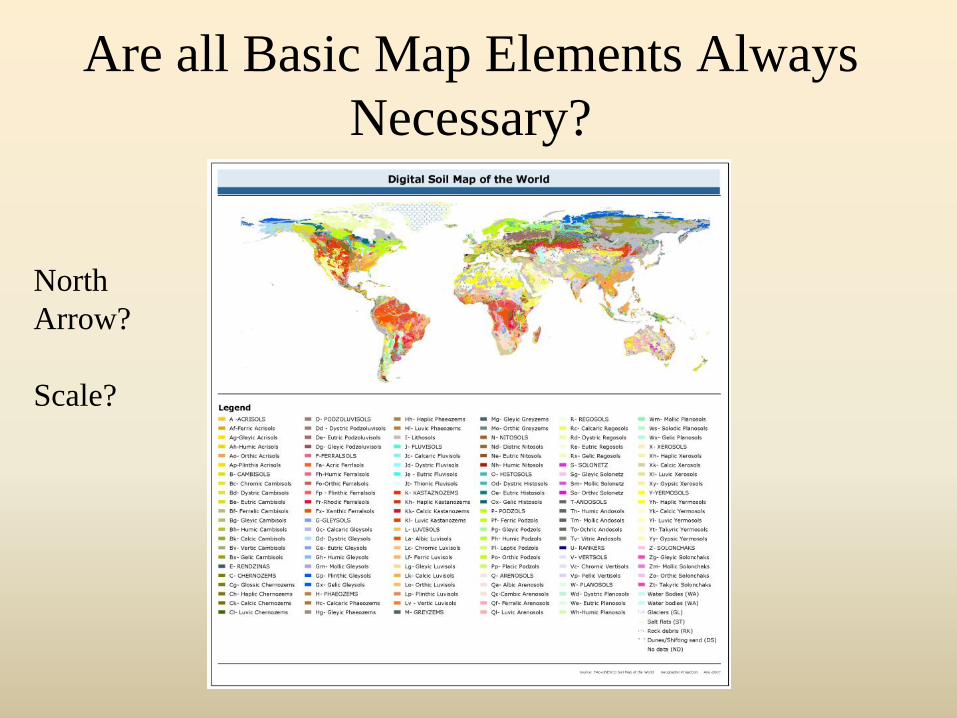
Are all Basic Map Elements Always
Necessary?
North
Arrow?
Scale?
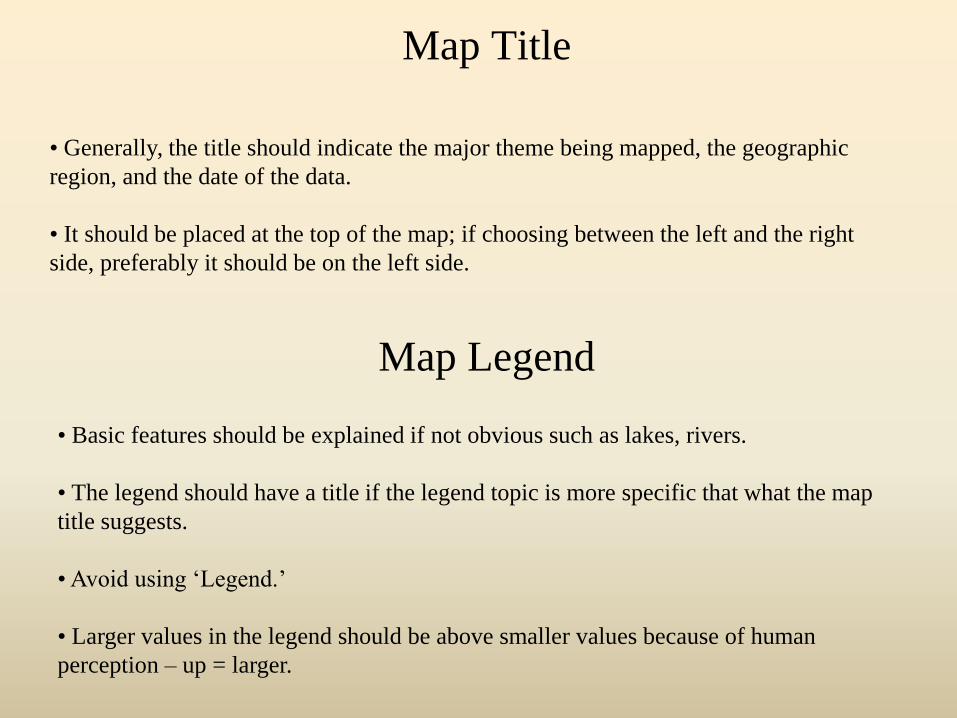
Map Title
• Generally, the title should indicate the major theme being mapped, the geographic
region, and the date of the data.
• It should be placed at the top of the map; if choosing between the left and the right
side, preferably it should be on the left side.
Map Legend
• Basic features should be explained if not obvious such as lakes, rivers.
• The legend should have a title if the legend topic is more specific that what the map
title suggests.
• Avoid using ‘Legend.’
• Larger values in the legend should be above smaller values because of human
perception – up = larger.
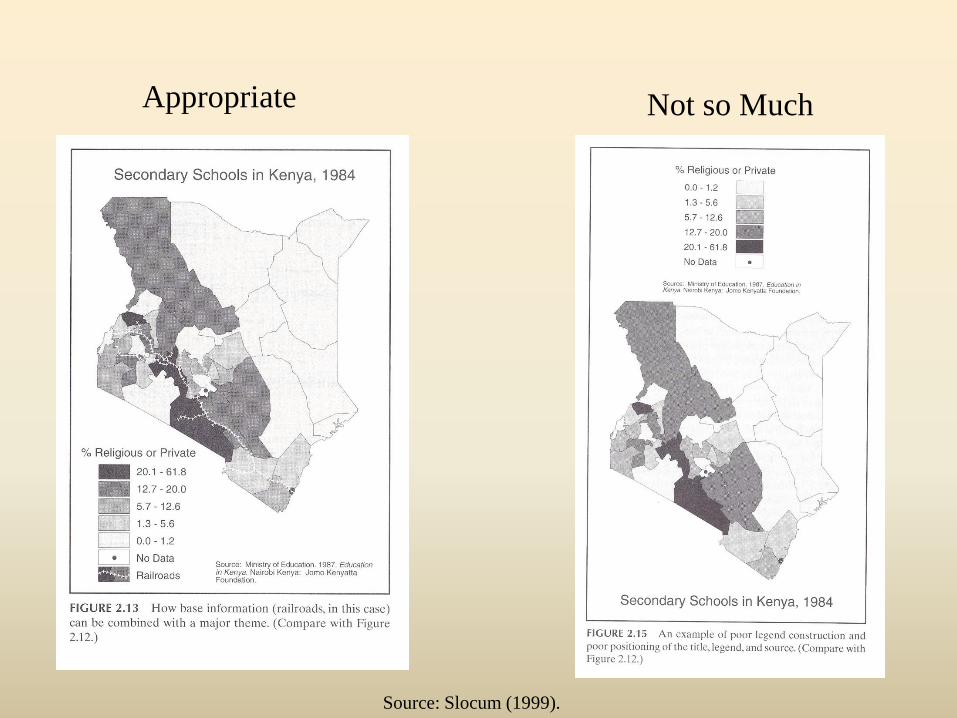
Appropriate Not so Much
Source: Slocum (1999).
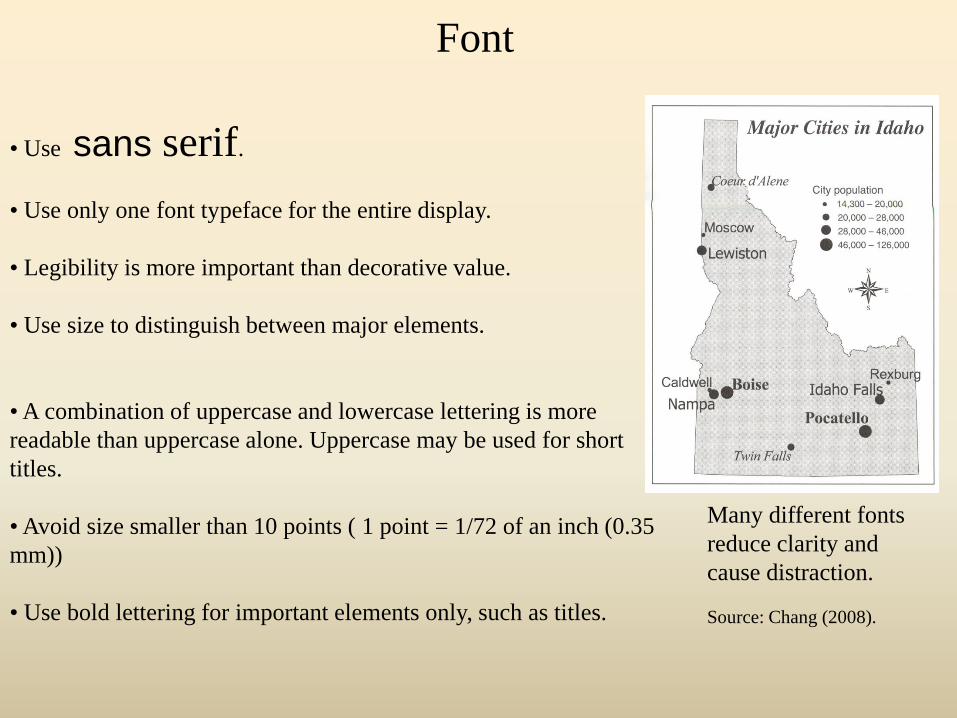
Font
• Use sans serif.
• Use only one font typeface for the entire display.
• Legibility is more important than decorative value.
• Use size to distinguish between major elements.
• A combination of uppercase and lowercase lettering is more
readable than uppercase alone. Uppercase may be used for short
titles.
• Avoid size smaller than 10 points ( 1 point = 1/72 of an inch (0.35
mm))
• Use bold lettering for important elements only, such as titles.
Many different fonts
reduce clarity and
cause distraction.
Source: Chang (2008).
Fonts in ArcGIS
• To keep it on the safe side, if not sure how the map file will react to the
displaying device, use common fonts, such as Aerial or Times New Roman.
• Special characters can be copied over from the operating system character
dataset.

Labels
• In GIS, labels usually refer to
the feature attributes displayed on
their respective features.
• Maps’ primary function is to
convey spatial information.
• Labels should be brought down
to minimal and tables used
instead.
• Sometimes, though, labels are a
part of the requirement, e.g.
regulations.
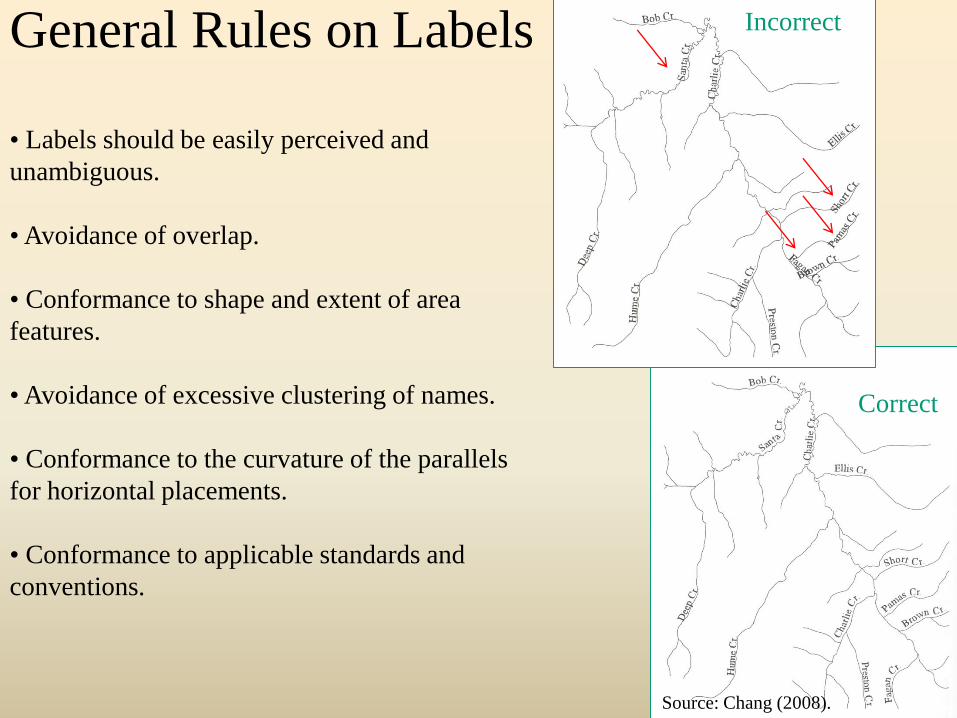
General Rules on Labels
• Labels should be easily perceived and
unambiguous.
• Avoidance of overlap.
• Conformance to shape and extent of area
features.
• Avoidance of excessive clustering of names.
• Conformance to the curvature of the parallels
for horizontal placements.
• Conformance to applicable standards and
conventions.
Incorrect
Correct
Source: Chang (2008).
Printing and Displaying Maps
• Maps are created to be viewed on different media.
• Some examples of the map media are:
o Paper sheets (e.g., standalone maps, poster and journal figures, etc.)
o Digital files (e.g., pdf, jpg)
o Powerpoint presentations
• The spatial size (e.g. map scale) and the amount of the information on a map should
reflect the means of viewing by the map viewers (Can one zoom in onto the map, from
how close will average viewers be looking at the map (posters behind a presentation
booth!), for how long is the map displayed (powerpoint presentation!)?).
• Maps are a message, and the message should be clear and effective.
Printing and Displaying Maps
• The first thing when creating maps is to set the size of the map printout (display).
• Sizes can vastly vary. From a small figure in a report or a journal paper to a several-
feet-across standalone map poster.
• The set size will dictate the map scale.
• Letters two inches high are seen at a distance of fourteen feet at approximately the
same size as a 10-point type seen at a reading distance of one foot.
• Test seeing the map in a display that is intended for (e.g., projector, black and white
printout, etc.)
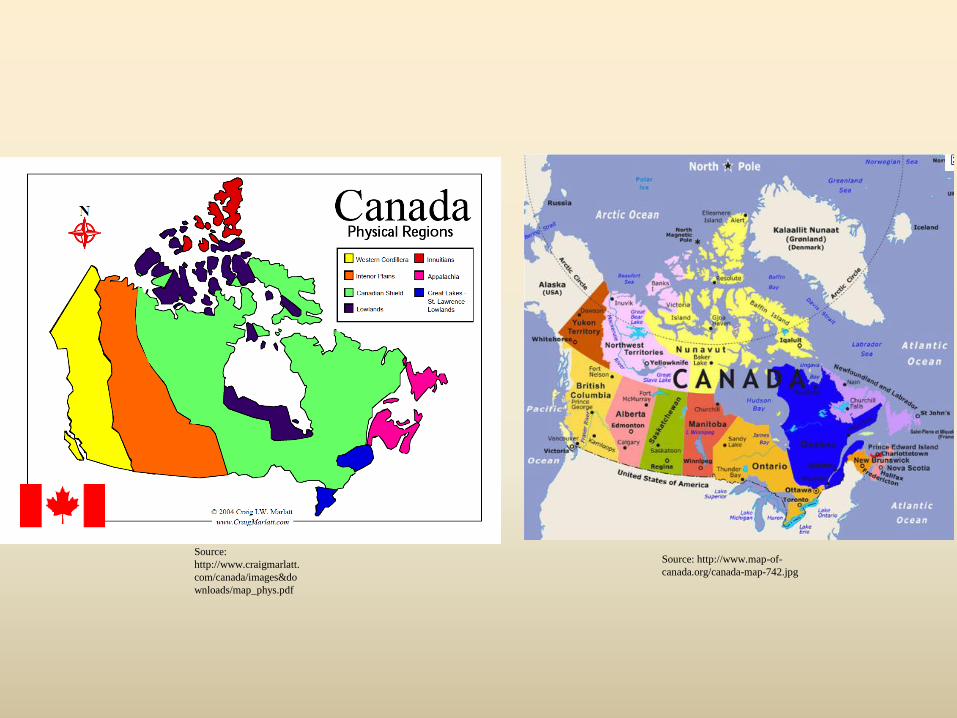
Source:
http://www.craigmarlatt.
com/canada/images&do
wnloads/map_phys.pdf
Source: http://www.map-of-
canada.org/canada-map-742.jpg
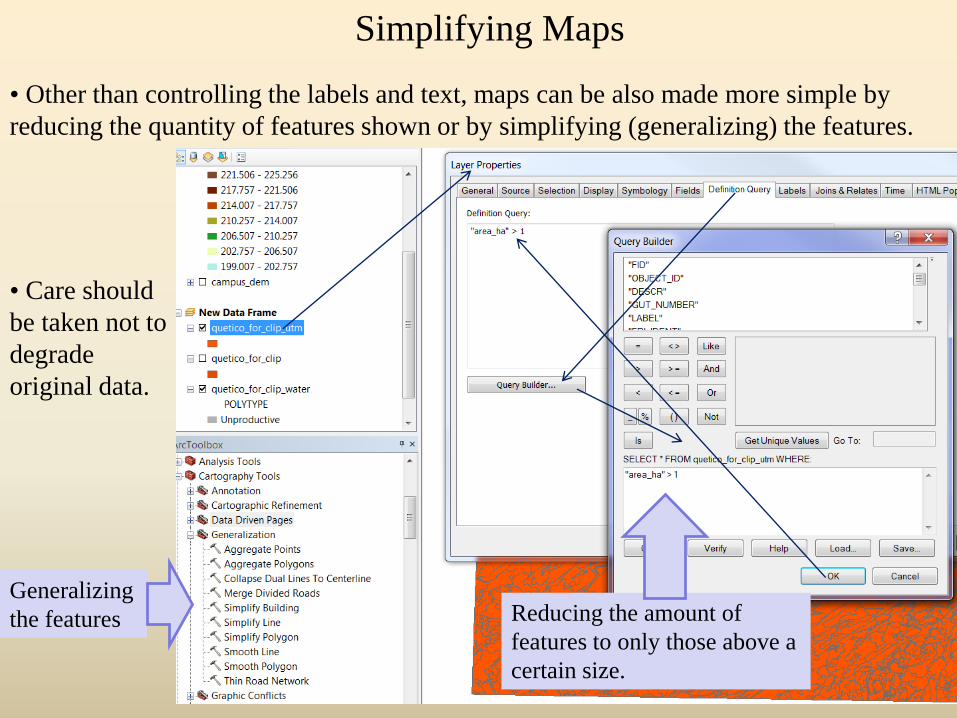
Simplifying Maps
• Other than controlling the labels and text, maps can be also made more simple by
reducing the quantity of features shown or by simplifying (generalizing) the features.
Reducing the amount of
features to only those above a
certain size.
Generalizing
the features
• Care should
be taken not to
degrade
original data.
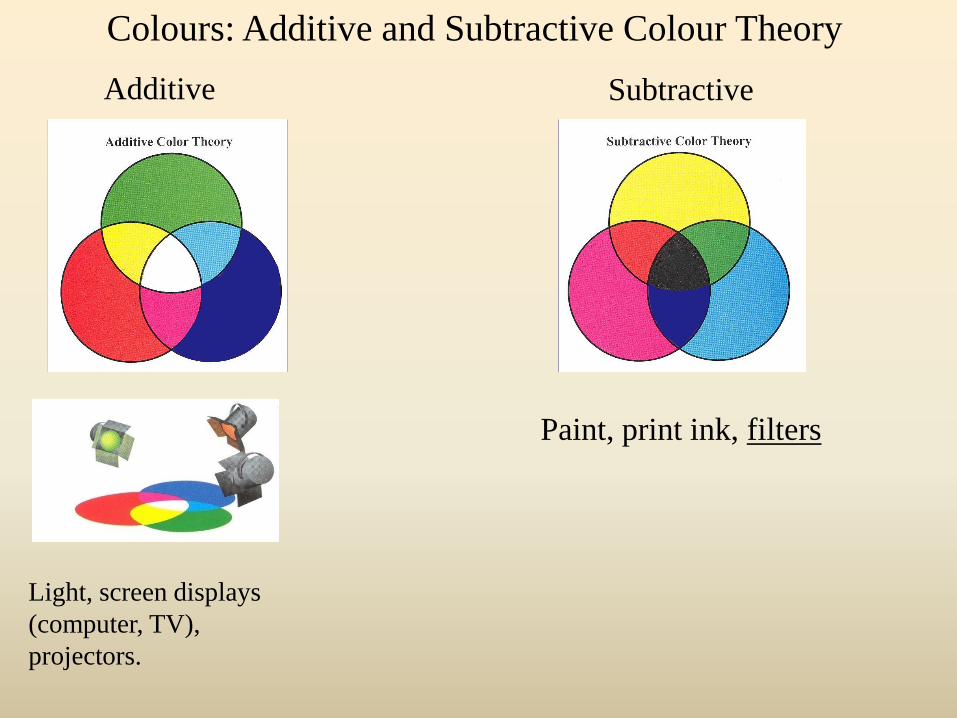
Light, screen displays
(computer, TV),
projectors.
Paint, print ink, filters
Colours: Additive and Subtractive Colour Theory
Additive Subtractive
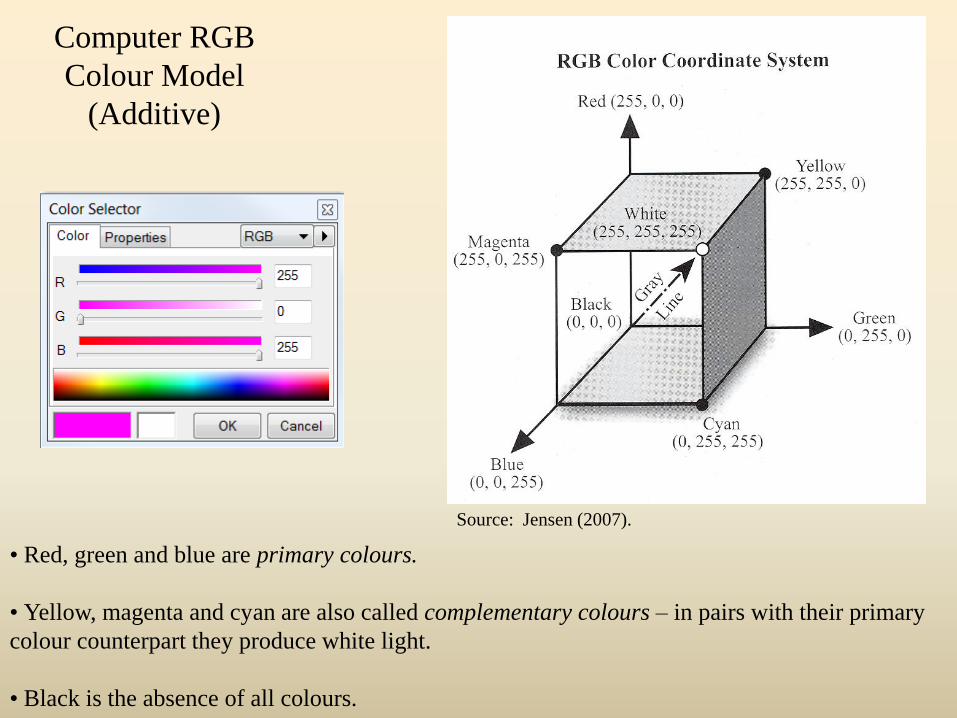
Computer RGB
Colour Model
(Additive)
• Red, green and blue are primary colours.
• Yellow, magenta and cyan are also called complementary colours – in pairs with their primary
colour counterpart they produce white light.
• Black is the absence of all colours.
Source: Jensen (2007).
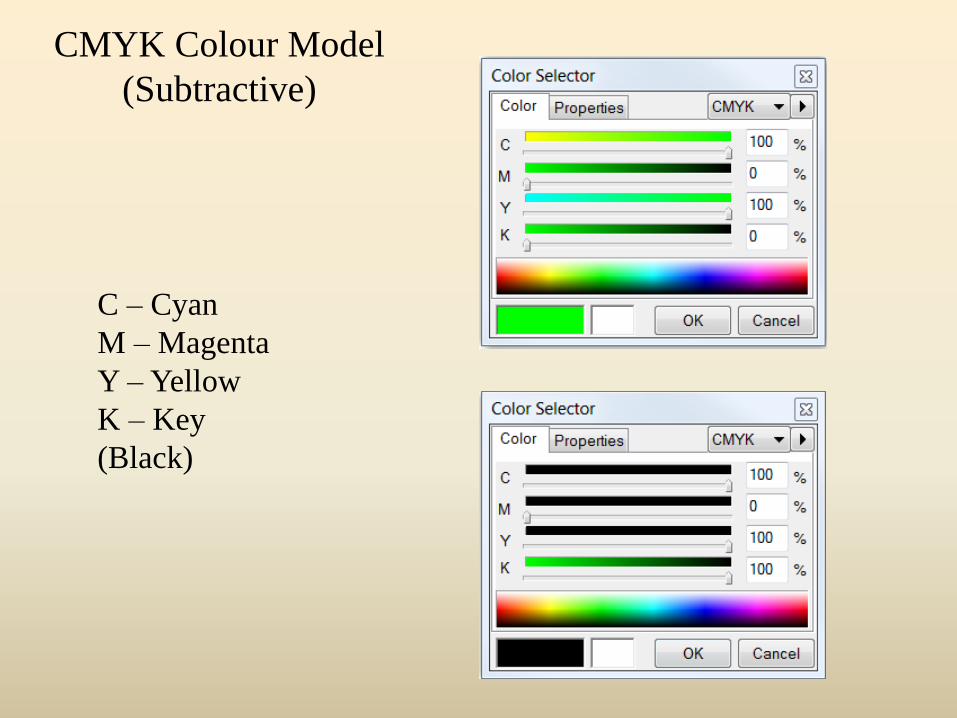
CMYK Colour Model
(Subtractive)
C – Cyan
M – Magenta
Y – Yellow
K – Key
(Black)
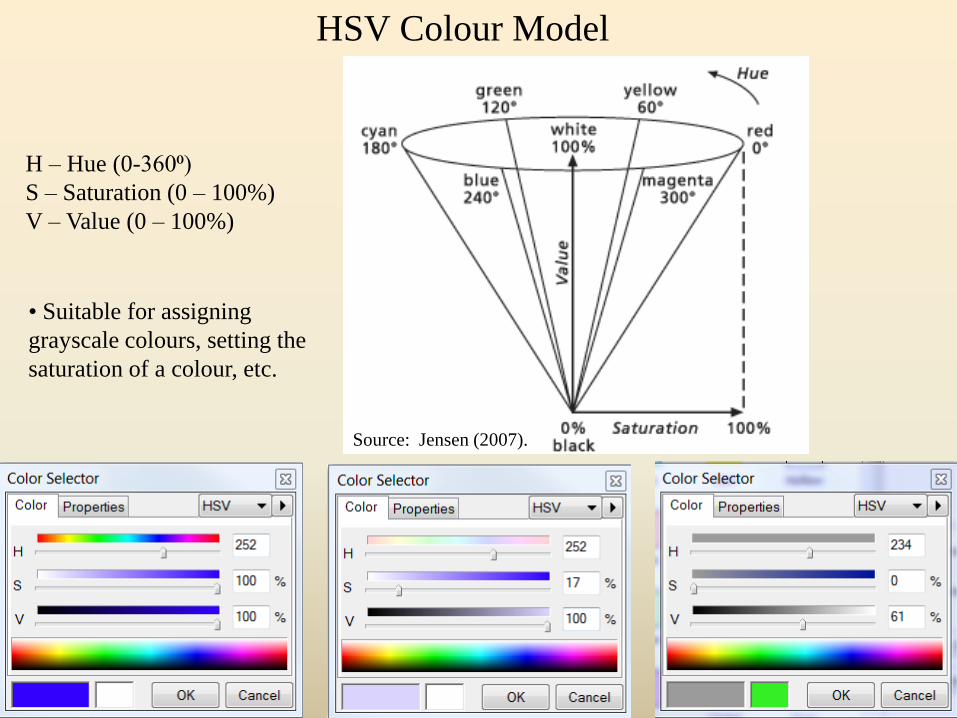
HSV Colour Model
H – Hue (0-360⁰)
S – Saturation (0 – 100%)
V – Value (0 – 100%)
Source: Jensen (2007).
• Suitable for assigning
grayscale colours, setting the
saturation of a colour, etc.
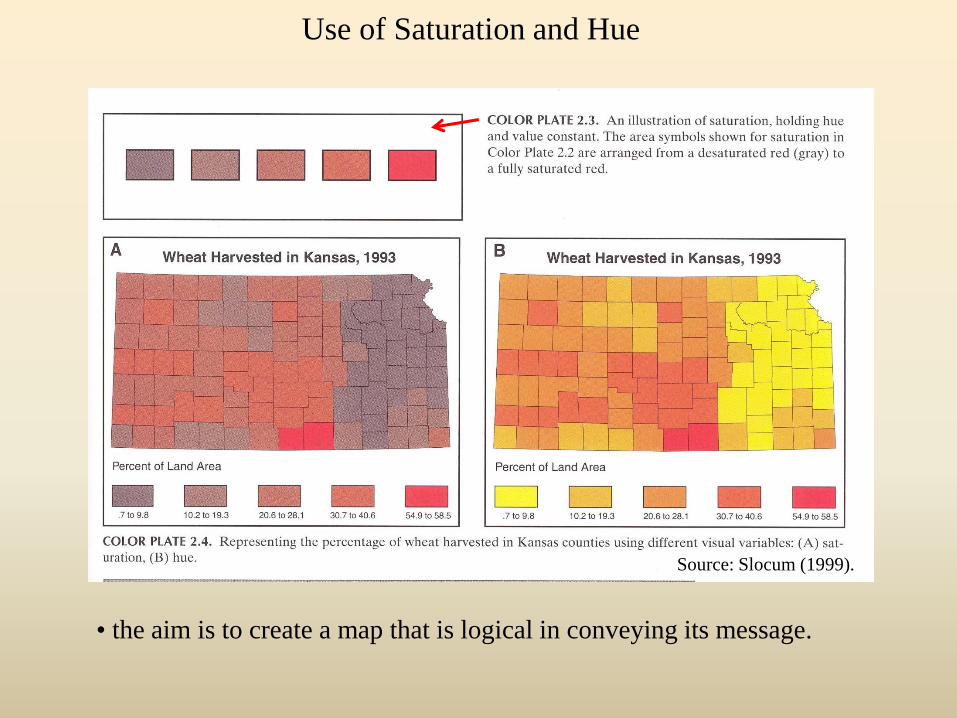
Use of Saturation and Hue
• the aim is to create a map that is logical in conveying its message.
Source: Slocum (1999).
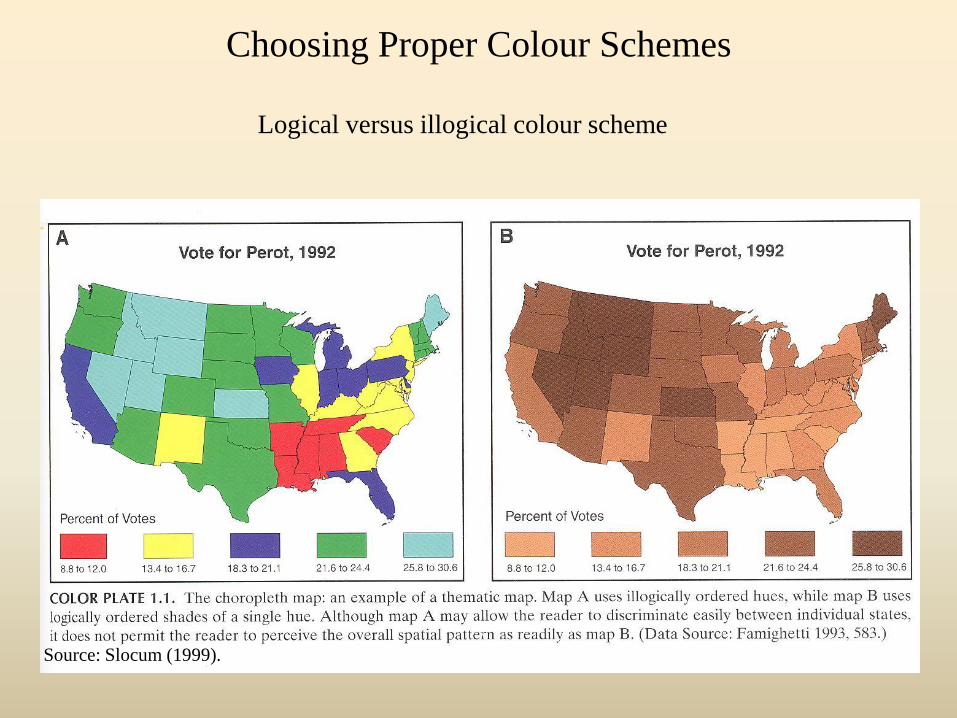
Choosing Proper Colour Schemes
Logical versus illogical colour scheme
Source: Slocum (1999).
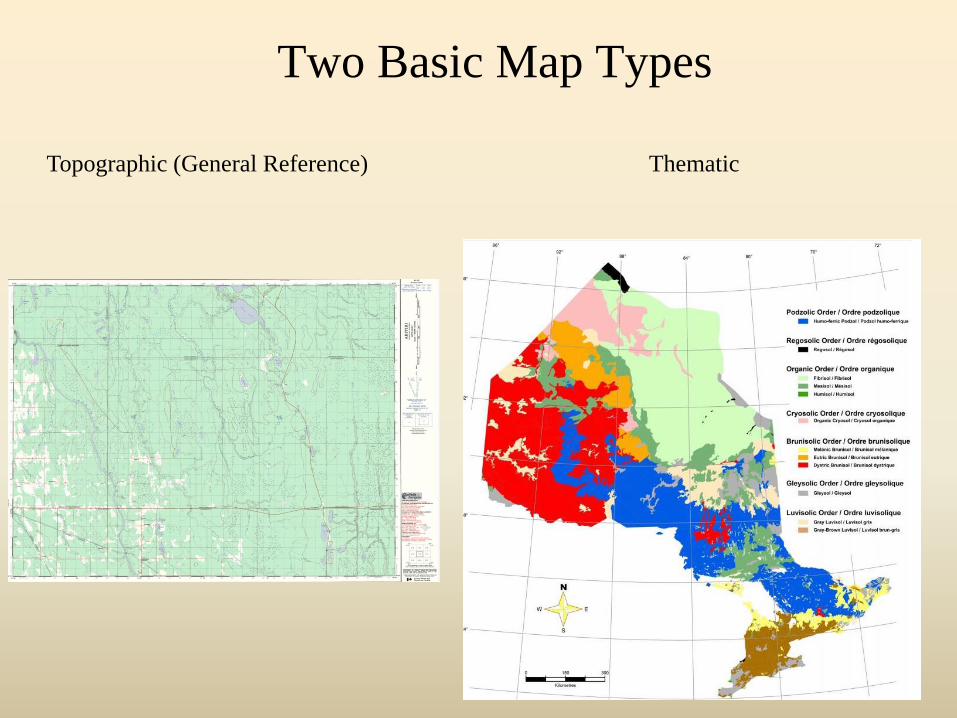
Two Basic Map Types
Topographic (General Reference) Thematic
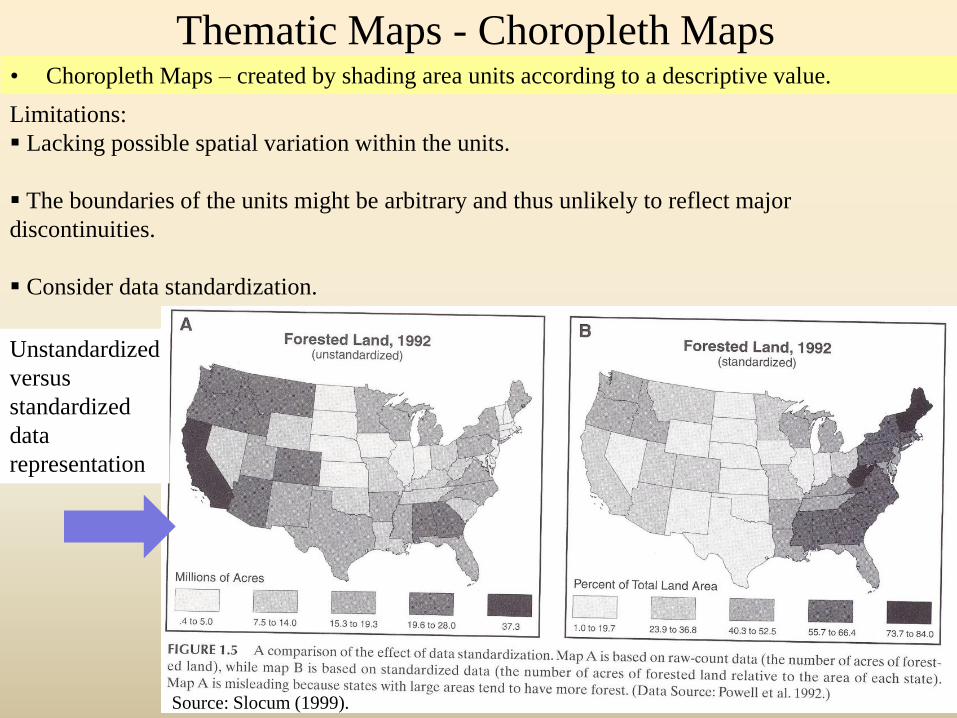
Thematic Maps - Choropleth Maps
Limitations:
Lacking possible spatial variation within the units.
The boundaries of the units might be arbitrary and thus unlikely to reflect major
discontinuities.
Consider data standardization.
Unstandardized
versus
standardized
data
representation
Source: Slocum (1999).
• Choropleth Maps – created by shading area units according to a descriptive value.
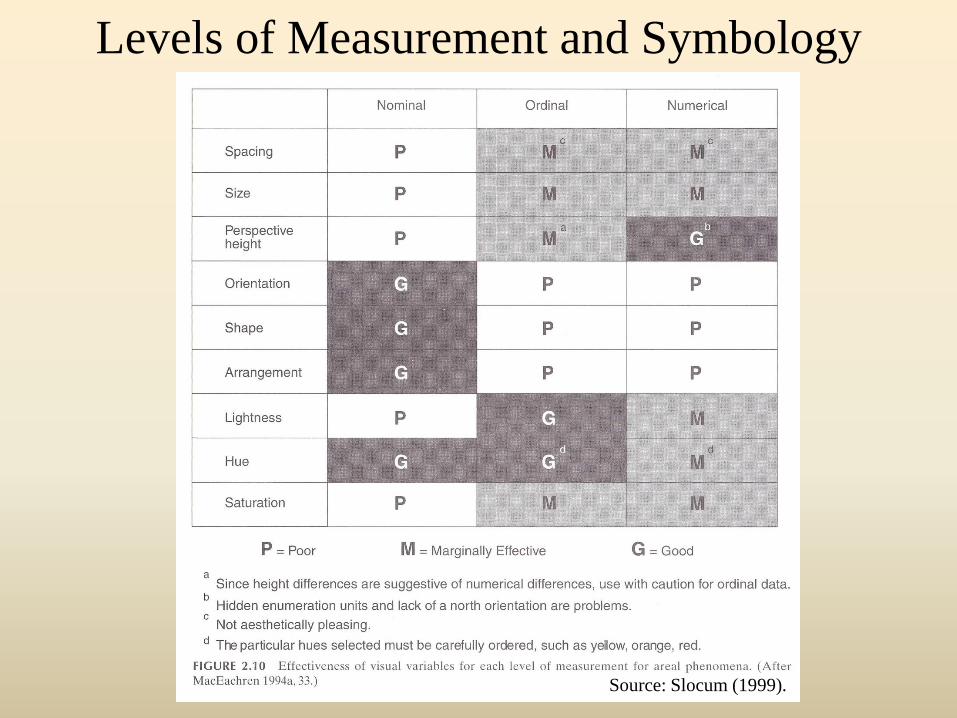
Levels of Measurement and Symbology
Source: Slocum (1999).
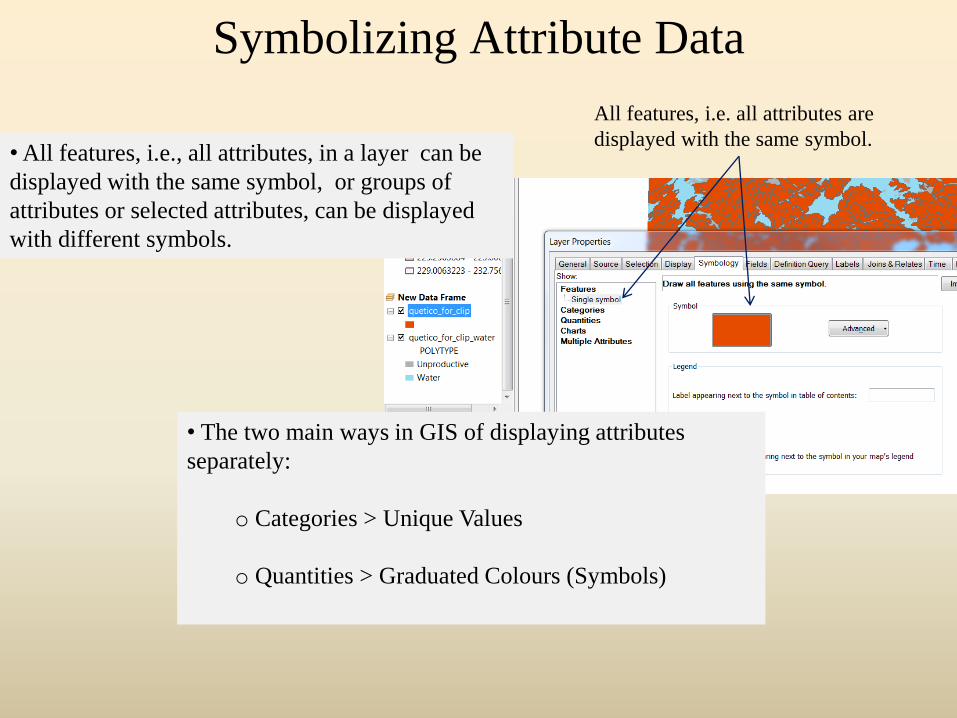
Symbolizing Attribute Data
• All features, i.e., all attributes, in a layer can be
displayed with the same symbol, or groups of
attributes or selected attributes, can be displayed
with different symbols.
All features, i.e. all attributes are
displayed with the same symbol.
• The two main ways in GIS of displaying attributes
separately:
o Categories > Unique Values
o Quantities > Graduated Colours (Symbols)
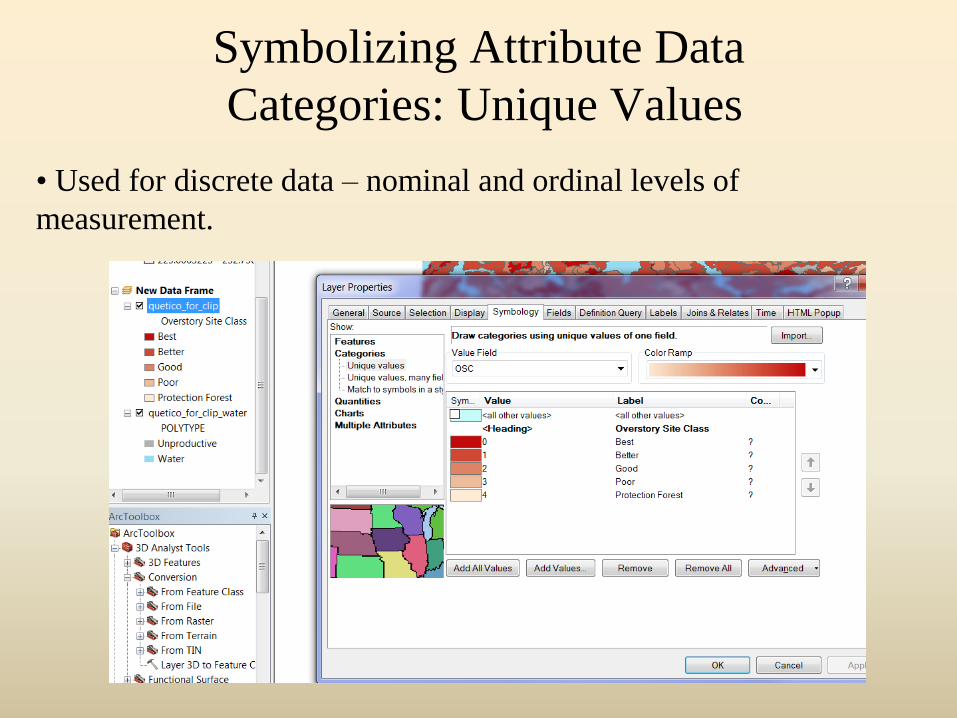
Symbolizing Attribute Data
Categories: Unique Values
• Used for discrete data – nominal and ordinal levels of
measurement.
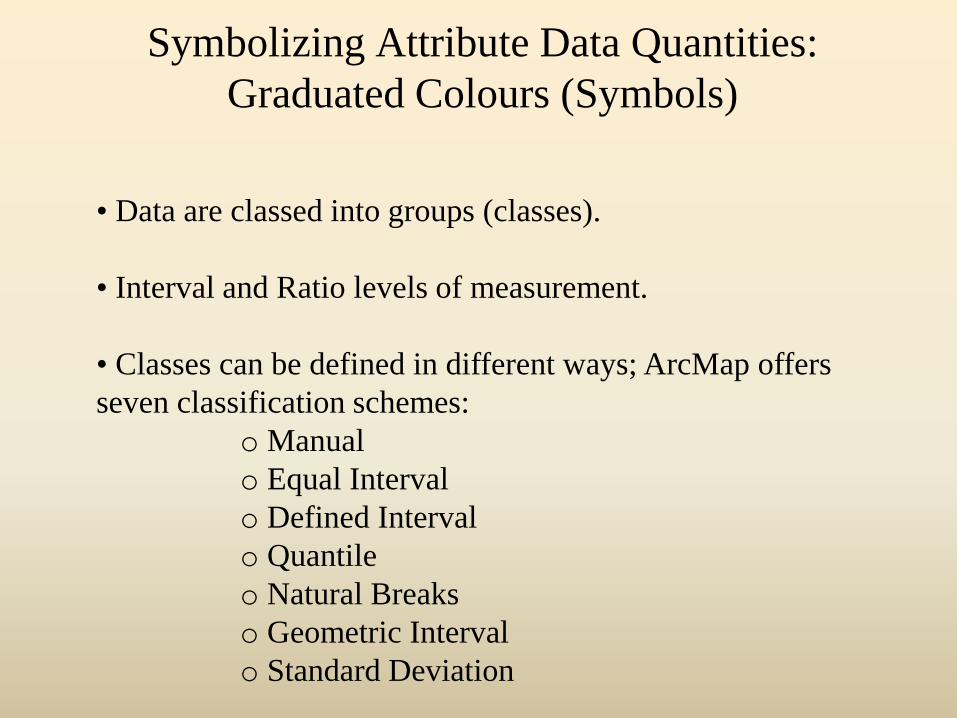
Symbolizing Attribute Data Quantities:
Graduated Colours (Symbols)
• Data are classed into groups (classes).
• Interval and Ratio levels of measurement.
• Classes can be defined in different ways; ArcMap offers
seven classification schemes:
o Manual
o Equal Interval
o Defined Interval
o Quantile
o Natural Breaks
o Geometric Interval
o Standard Deviation
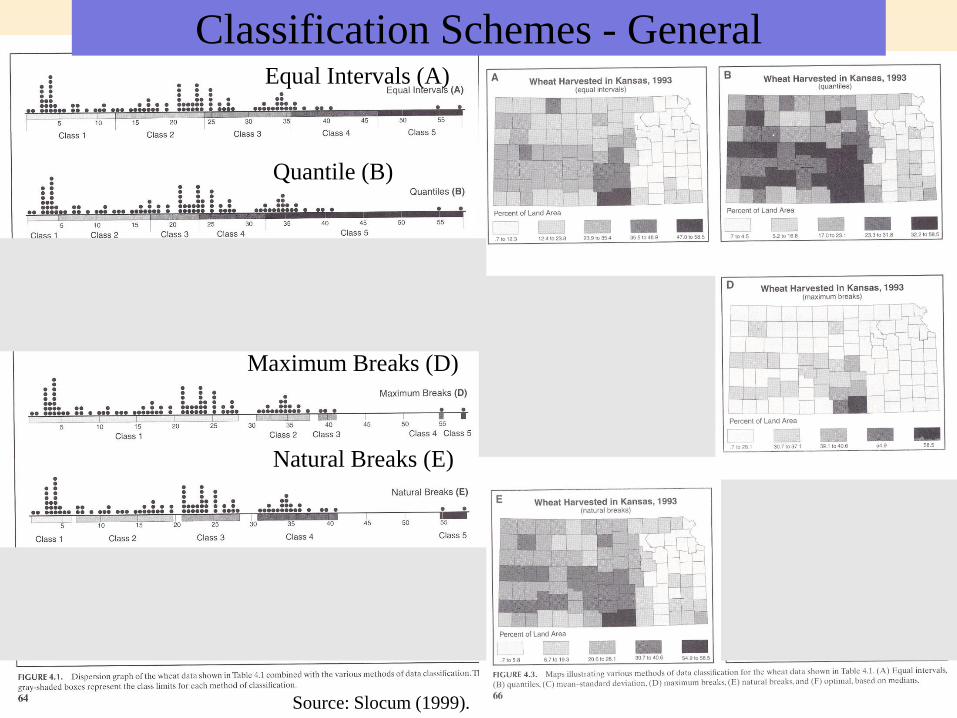
Classification Schemes - GeneralEqual Intervals (A)
Quantile (B)
Mean – Standard Deviation (C)
Maximum Breaks (D)
Natural Breaks (E)
Optimal (F)
Source: Slocum (1999).
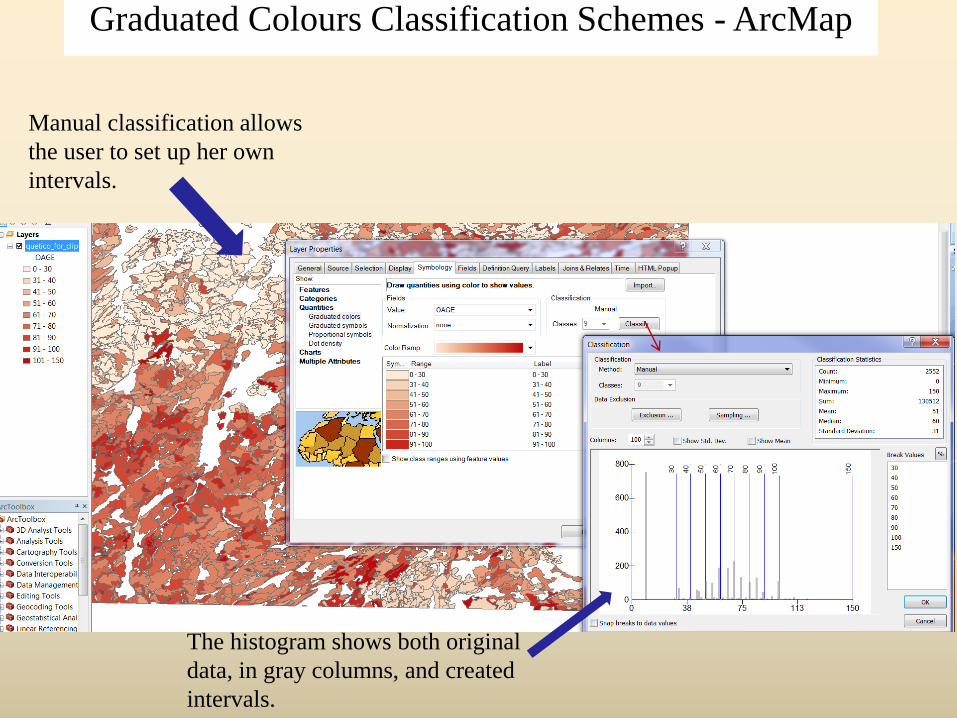
Graduated Colours Classification Schemes - ArcMap
Manual classification allows
the user to set up her own
intervals.
The histogram shows both original
data, in gray columns, and created
intervals.
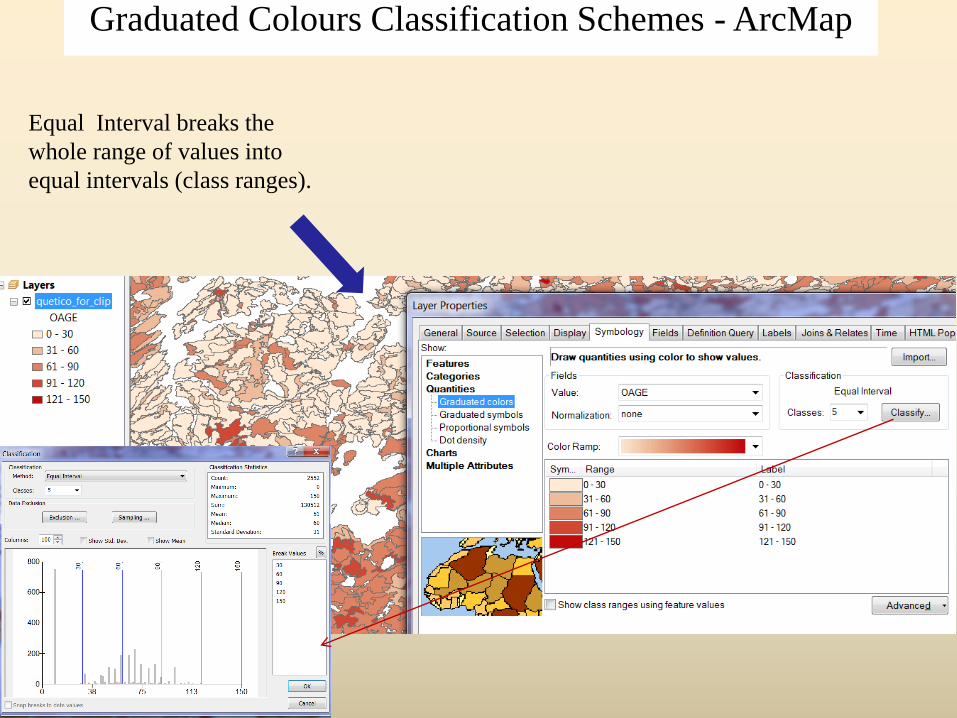
Equal Interval breaks the
whole range of values into
equal intervals (class ranges).
Graduated Colours Classification Schemes - ArcMap
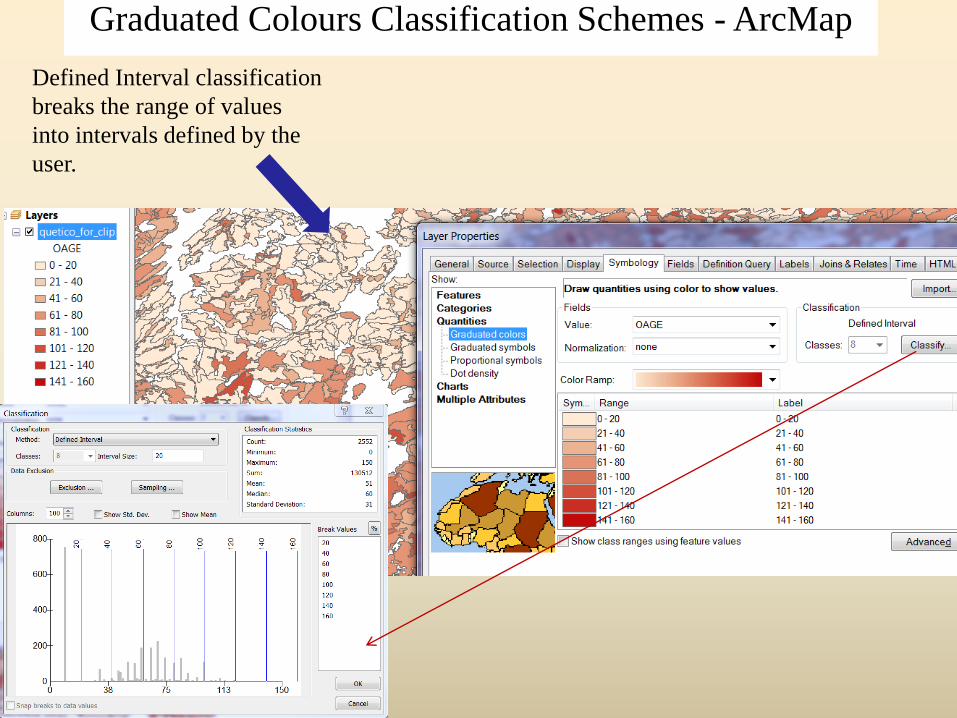
Defined Interval classification
breaks the range of values
into intervals defined by the
user.
Graduated Colours Classification Schemes - ArcMap
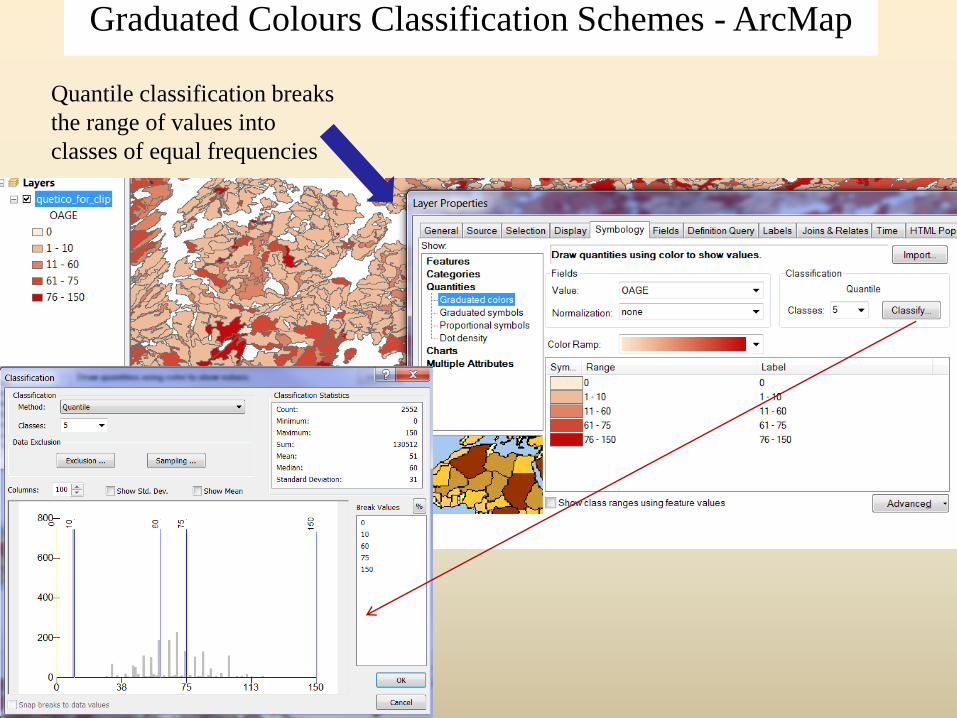
Quantile classification breaks
the range of values into
classes of equal frequencies
Graduated Colours Classification Schemes - ArcMap
Graduated Colours Classification Schemes - ArcMap
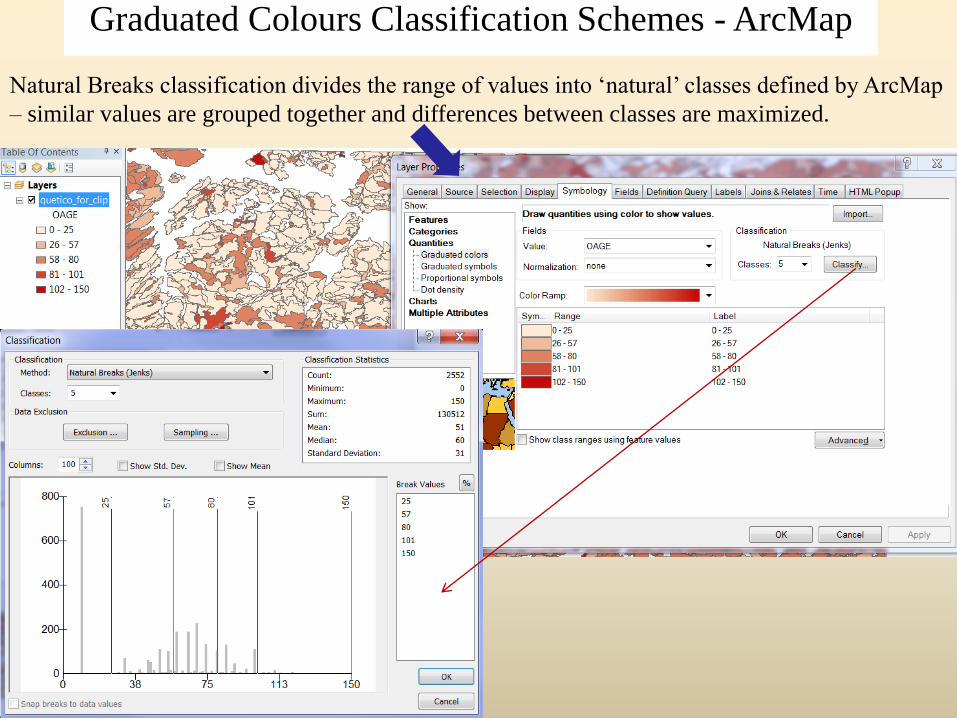
Natural Breaks classification divides the range of values into ‘natural’ classes defined by ArcMap
– similar values are grouped together and differences between classes are maximized.
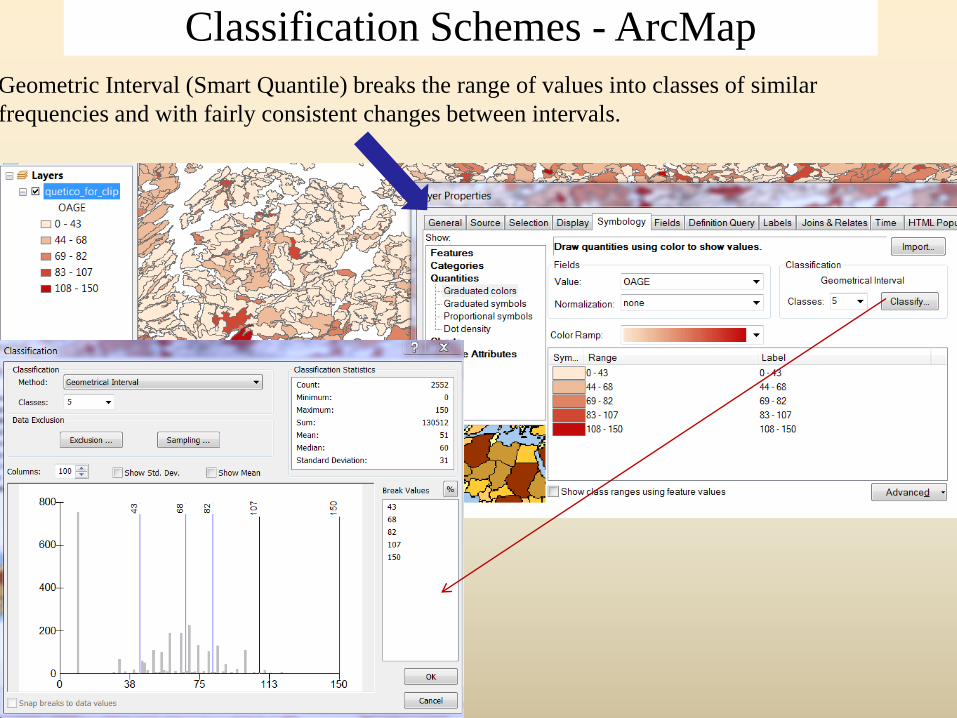
Geometric Interval (Smart Quantile) breaks the range of values into classes of similar
frequencies and with fairly consistent changes between intervals.
Classification Schemes - ArcMap
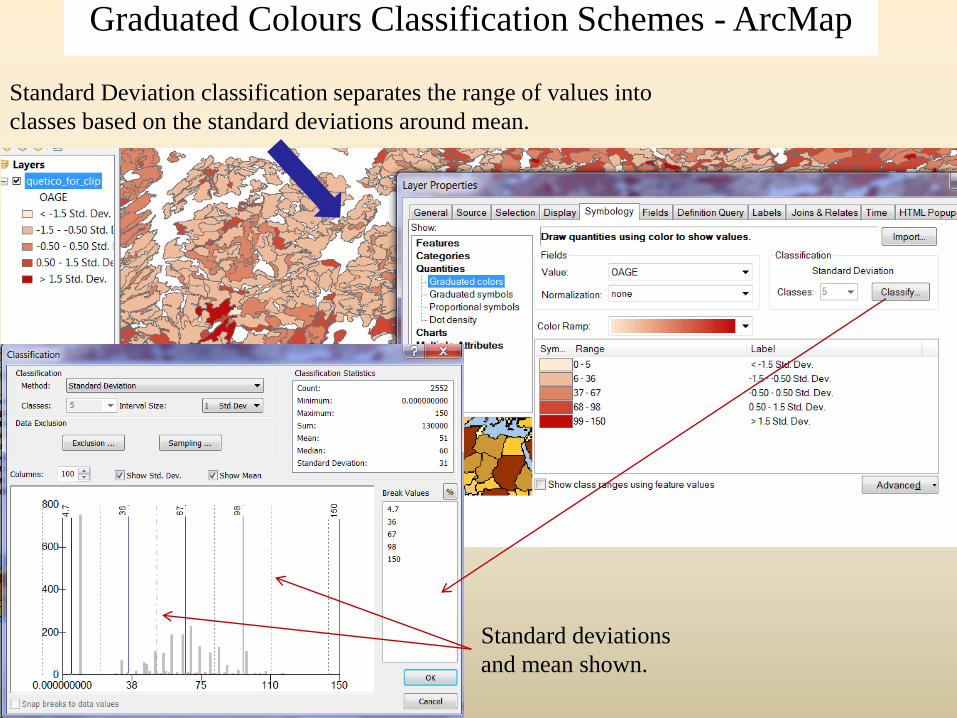
Standard Deviation classification separates the range of values into
classes based on the standard deviations around mean.
Graduated Colours Classification Schemes - ArcMap
Standard deviations
and mean shown.
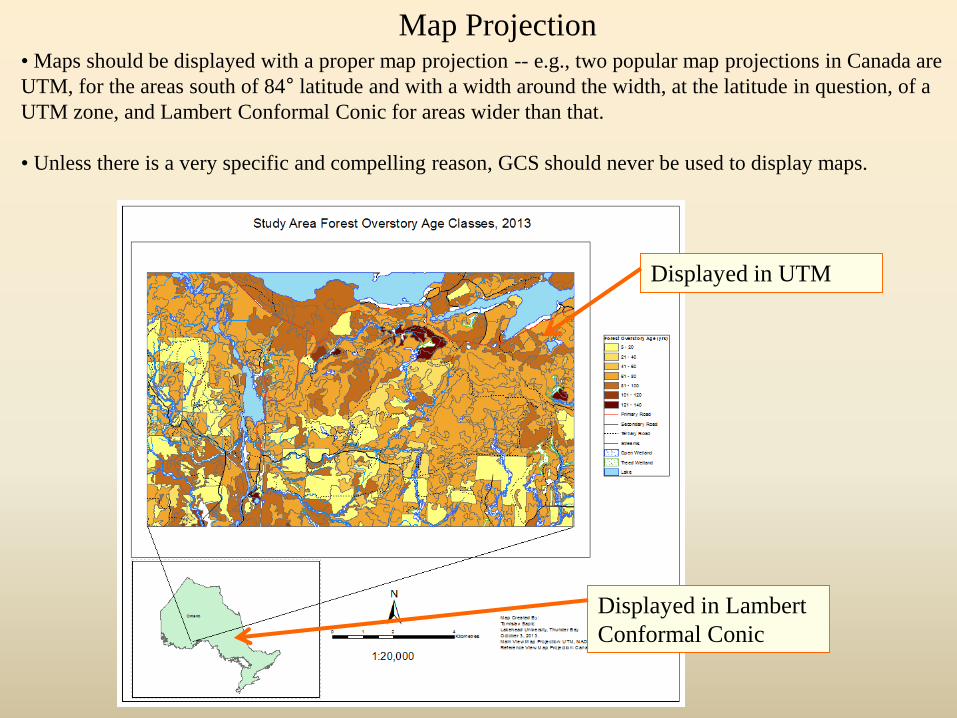
Map Projection• Maps should be displayed with a proper map projection -- e.g., two popular map projections in Canada are
UTM, for the areas south of 84° latitude and with a width around the width, at the latitude in question, of a
UTM zone, and Lambert Conformal Conic for areas wider than that.
• Unless there is a very specific and compelling reason, GCS should never be used to display maps.
Displayed in UTM
Displayed in Lambert
Conformal Conic
Forest Management Planning Maps
• Overall directions on maps are provided in the Forest
Information Manual (FIM),
https://dr6j45jk9xcmk.cloudfront.net/documents/2822/forest-
information-manual-2009.pdf, (Part B, Section 7.0 – Forest
Management Planning Maps).
• FIM then directs to look for more specifics on map standards
and content in other specialized manuals, such as FIM Forest
Management Planning Technical Specifications and FIM Base
and Values Technical Specifications.
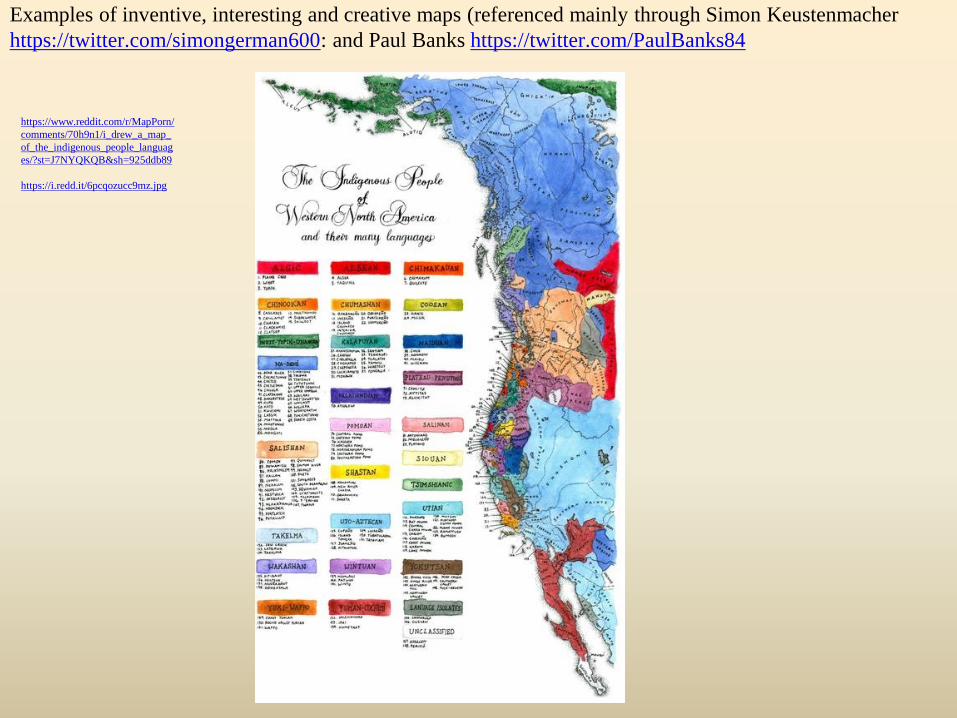
Examples of inventive, interesting and creative maps (referenced mainly through Simon Keustenmacher
https://twitter.com/simongerman600: and Paul Banks https://twitter.com/PaulBanks84
https://www.reddit.com/r/MapPorn/
comments/70h9n1/i_drew_a_map_
of_the_indigenous_people_languag
es/?st=J7NYQKQB&sh=925ddb89
https://i.redd.it/6pcqozucc9mz.jpg
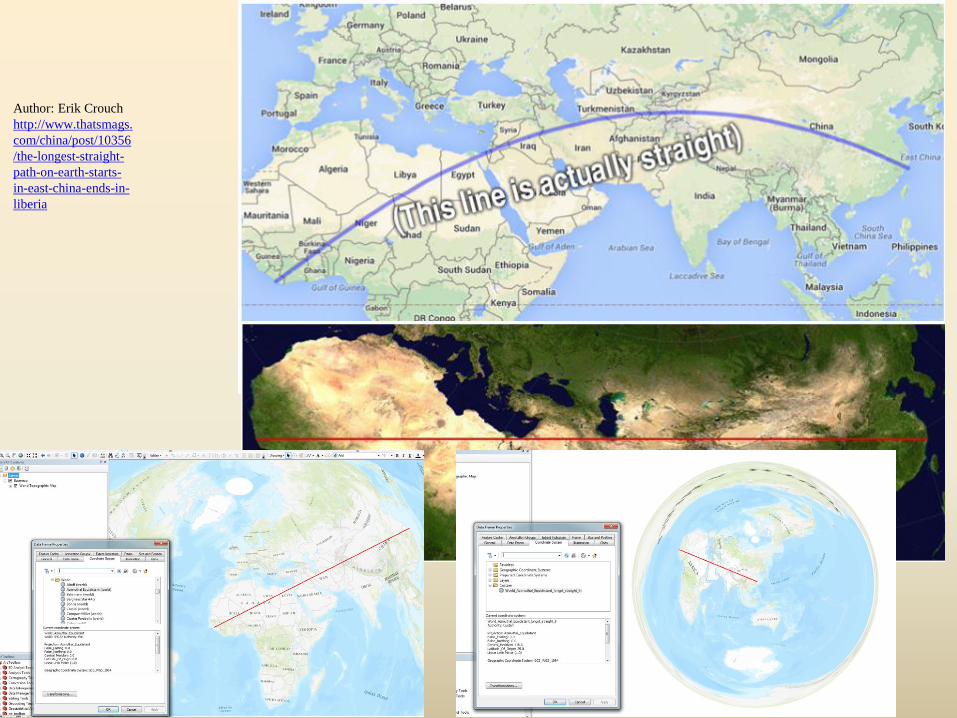
Author: Erik Crouch
http://www.thatsmags.
com/china/post/10356
/the-longest-straight-
path-on-earth-starts-
in-east-china-ends-in-
liberia
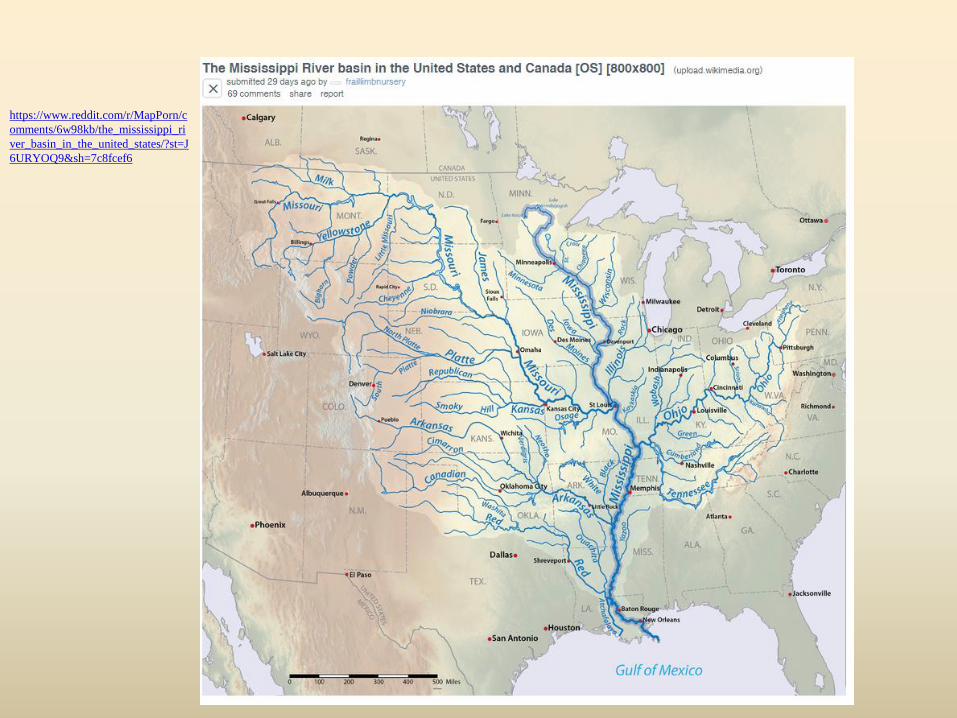
https://www.reddit.com/r/MapPorn/c
omments/6w98kb/the_mississippi_ri
ver_basin_in_the_united_states/?st=J
6URYOQ9&sh=7c8fcef6
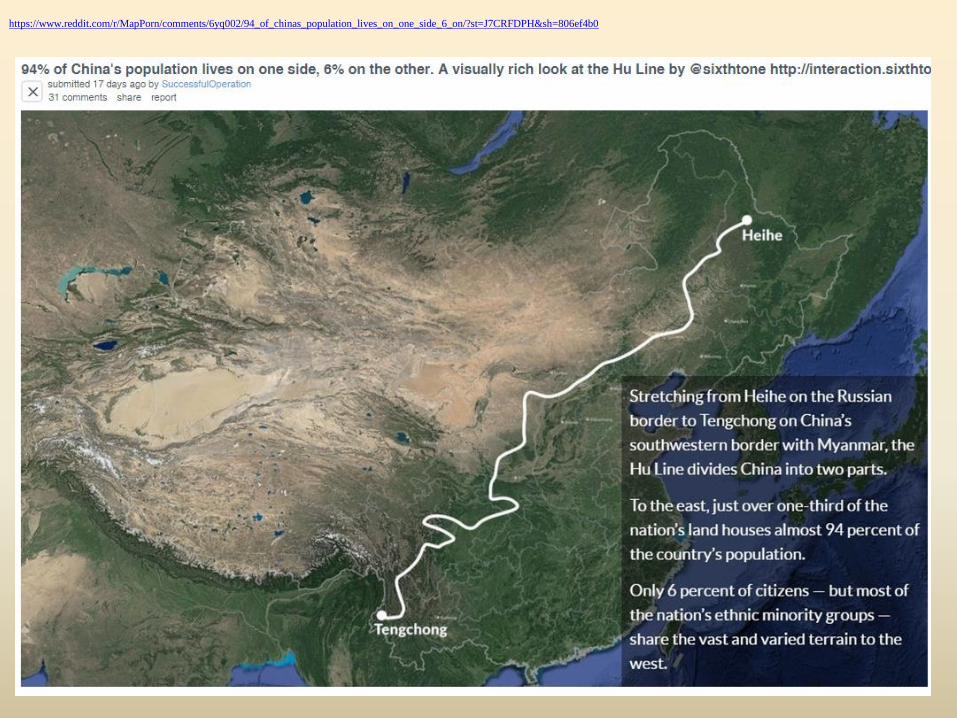
https://www.reddit.com/r/MapPorn/comments/6yq002/94_of_chinas_population_lives_on_one_side_6_on/?st=J7CRFDPH&sh=806ef4b0

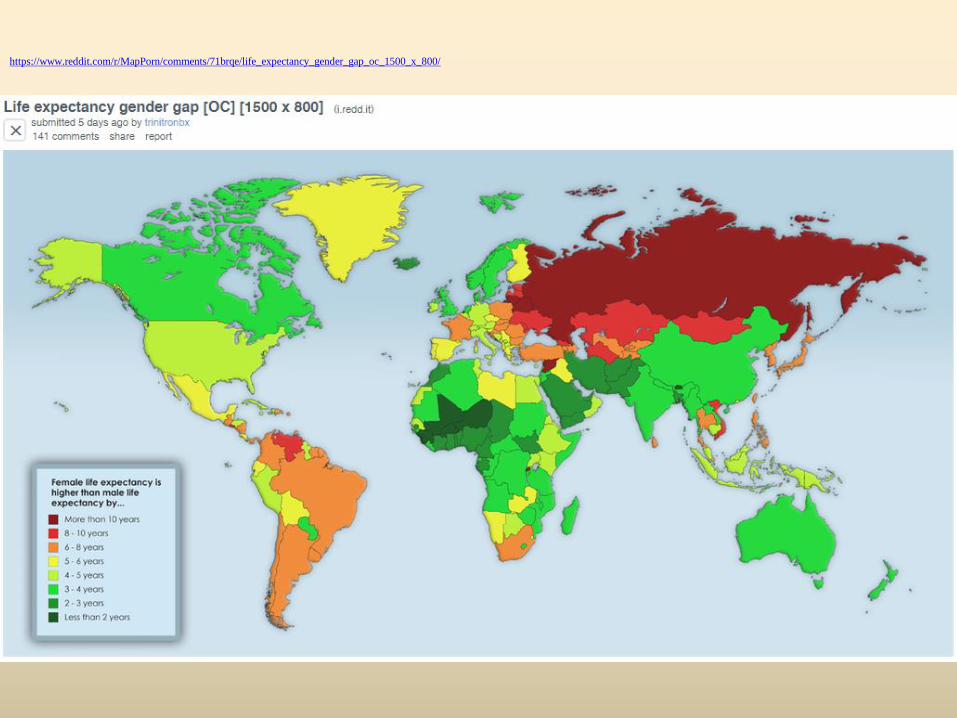
https://www.reddit.com/r/MapPorn/comments/71brqe/life_expectancy_gender_gap_oc_1500_x_800/
Resources:
Antes, J. R., K. Chang, and C Mullis. 1985. The visual effects of map design: an eye
movement analysis. The American Cartographer 12:143-155.
Brewer, C. A. 2005. Designing Better Maps: A Guide for GIS Users. ESRI Press. 202 pp.
Chang, Kang-Tsung. 2008. Introduction to Geographic Information System. McGraw-Hill.
450 pp.
ESRI. 2012. ArcGIS 10.
ESRI. 2012. ArcGIS 10 Help.
http://desktop.arcgis.com/en/desktop/latest/main/map/mapping-and-visualization-in-arcgis-
for-desktop.htm .
Jensen., J. R. 2007. Remote Sensing of the Environment: An Earth Resource Perspective.
Pearson Prentice Hall.
Lo, C. P. and A. K. W. Yeung. 2007. Concepts and Techniques of Geographic
Information Systems. Pearson Education Inc. 532 pp.
Slocum, T. A. 1999. Thematic Cartography and Visualization. Prentice-Hall, Inc. 293 pp.