march 2016 ceri commodity report — crude oil · ceri commodity report -crude oil page 2 north...
TRANSCRIPT

Relevant • Independent • Objective
CERI Commodity Report – Crude Oil Editorial Committee: Paul Kralovic, Dinara Millington, Megan Murphy, Jon Rozhon, Allan Fogwill About CERI The Canadian Energy Research Institute is an independent, not-for-profit research establishment created through a partnership of industry, academia, and government in 1975. Our mission is to provide relevant, independent, objective economic research in energy and related environmental issues. For more information about CERI, please visit our website at www.ceri.ca or contact us at [email protected].
Figure 1: Tokyo Emissions Reductions: FY2010 to 2014
Source: Tokyo Metropolitan Government
Like any system, cap-and-trade is not without challenges. Chief among them is the setting of emissions targets. Set a target too stringent and it causes financial stress on the emitters and the economy; set a target too lax, and optimal reduction levels are not reached. This is what happened in Phase I of the European Union Emission Trading Scheme from 2005 to 2007. The caps were proposed by EU member states and approved by the European Commission. They were initially provided free to emitters and in “too generous an overall allocation... the oversupply drove the carbon price down to 0 in 2007”.3 In Australia, the cap-and-trade system has been highly politicized, with the system being changed according to the outcome of every national election since 2007.4 This highlights another challenge with cap and trade, the artificial nature of the market can be changed much more quickly than economic decision makers can react. There has been more success in New Zealand, which first legislated a trading scheme in 2008, though to make it palatable to all stakeholders, there presently exists no price signal and the system has been marginal at best in achieving emissions reductions over the years.5 Cap-and-trade systems in major emitting countries like China, Korea, and India are only now getting underway, so it is too early to judge these schemes.
Cap-and-Trade: Emissions Reductions Plan in Ontario Jon Rozhon Cap-and-Trade throughout the World A number of policy options exist for reducing greenhouse gases1 (GHGs) in any economy. There may be taxes applied to energy producers and consumers, energy efficiency measures can be legislated, and subsidies and financing may be made available for renewable energy alternatives to GHG-producing hydrocarbons. These policies and measures can be instituted across the economy in question – including the industrial, commercial, transportation, residential, agricultural, fossil fuel production and power sectors – and may all be targeted. Emissions cap and trade systems represent one way to reduce GHGs – a means that is usually directed at large industrial and power sector emitters. When cap-and-trade works well, it can be simple and effective in reaching GHG reduction goals: a government sets an emissions ceiling for a specific trading period, distributes allowances to large GHG emitters, and then those emitters trade or sell allowances to meet emissions obligations. Cap-and-trade, in theory, minimizes government interference and utilizes free market efficiencies. The invisible hand works to reduce carbon in the atmosphere at the lowest market price. One system that has appeared to work well is the one implemented by the Tokyo Metropolitan Government, which managed to reach a 25 percent emission reduction in FY 2014 after the 5th year of their cap-and-trade program.2 With a population in excess of 13 million people and a large, vibrant industrial base, Tokyo’s achievement in GHG emissions reduction is something for other cities and nations to note (see Figure 1).
March 2016
CERI Commodity Report — Crude Oil

CERI Commodity Report - Crude Oil
Page 2
North American Cap-and-Trade The United States has a long history of cap-and-trade programs of varying description to manage environmental externalities. Perhaps the most famous of these systems was the Acid Rain Program implemented in 1990 to reduce sulfur dioxide emissions – largely from the power sector. After 10 years, the US saw “an approximately 50 percent reduction from 1980 levels, when power-sector emissions were about 17.5 million tons”.6 This particular program was a textbook application of cap-and-trade principles: at the outset, the US federal government freely allocated allowances, and the power facility owners were permitted either to buy more allowances or reduce emissions. Their emissions reductions options were to install pollution controls, to change facility fuel mixes, or to scale back operations. When operators managed to reduce emissions below their allowance allocations, they could sell extra allowances or bank them. Incentives were therefore created to reduce emissions at the lowest cost.7 In the end, society met its SO2 emissions goals, electricity producers operated more cleanly, and the power system continued to supply ample energy to the nation. The Western Climate Initiative (WCI) is an ongoing emissions strategy, which began in 2007 as a US scheme but saw expansion into Canada (and at one point several Mexican states and a number of Canadian provinces that were “observers” to the initiative). The WCI was initially an agreement between the Governors of several western US states to consider various market-driven tools and government policies to deal with GHGs. However, today, the initiative is registered as a non-profit corporation and includes as participants only five jurisdictions: the US state of California, and the Canadian provinces of British Columbia, Quebec, Manitoba, and Ontario. Why the withdrawals? In the US, several governorships changed, with newly elected officials philosophically opposed to cap-and-trade as a way to address GHGs. Furthermore, when the recession hit North America in 2009, many of the states that rely on hydrocarbons as a pillar of their economies decided not to pass legislation “authorizing participation in WCI’s cap and trade…”8 Long-term climate change strategy took a backseat to short-term economic recovery for certain states and that remains the state of matters today. Ontario’s place in the WCI In the meantime, much has happened in Canada on the climate change front. Two of the remaining participants
in the WCI – Quebec and California – agreed in 2013 to link their emissions trading programs. During the Paris climate conference in 2015, Ontario, Quebec, and Manitoba signed a memorandum of understanding to harmonize their cap-and-trade programs under the WCI.9 Manitoba and Quebec each rely heavily on GHG-neutral hydro resources to power their economies. However, Ontario is not nearly as well endowed with hydropower as its eastern and western neighbours and therefore must rely on a more varied electricity energy mix that includes 28 percent natural gas (see Figure 2). Ontario is also home to Canada’s largest provincial economy, with a significant industrial sector. Figure 2: Ontario Electric Power Mix, April 2016
Source: IESO
Ontario has a long history of innovation in energy, being the only province that has developed a significant nuclear power industry – 20 total reactors. Ontario also made the decision to phase-out coal-powered generation, which it managed to complete in 2014. Over the past decade, the province has developed a renewable energy feed-in-tariff system, which permits both large and small renewable energy producers to feed their energy into the provincial grid and receive a subsidy. What does Ontario plan to achieve through cap-and-trade? The province provided details of its strategy through Bill 172, “Climate Change Mitigation and Low-carbon Economy Act, 2016”, which states two main goals: a) to reduce greenhouse gas in order to respond to climate change, to protect the environment and to assist
CERI Commodity Report - Crude Oil
Page 3
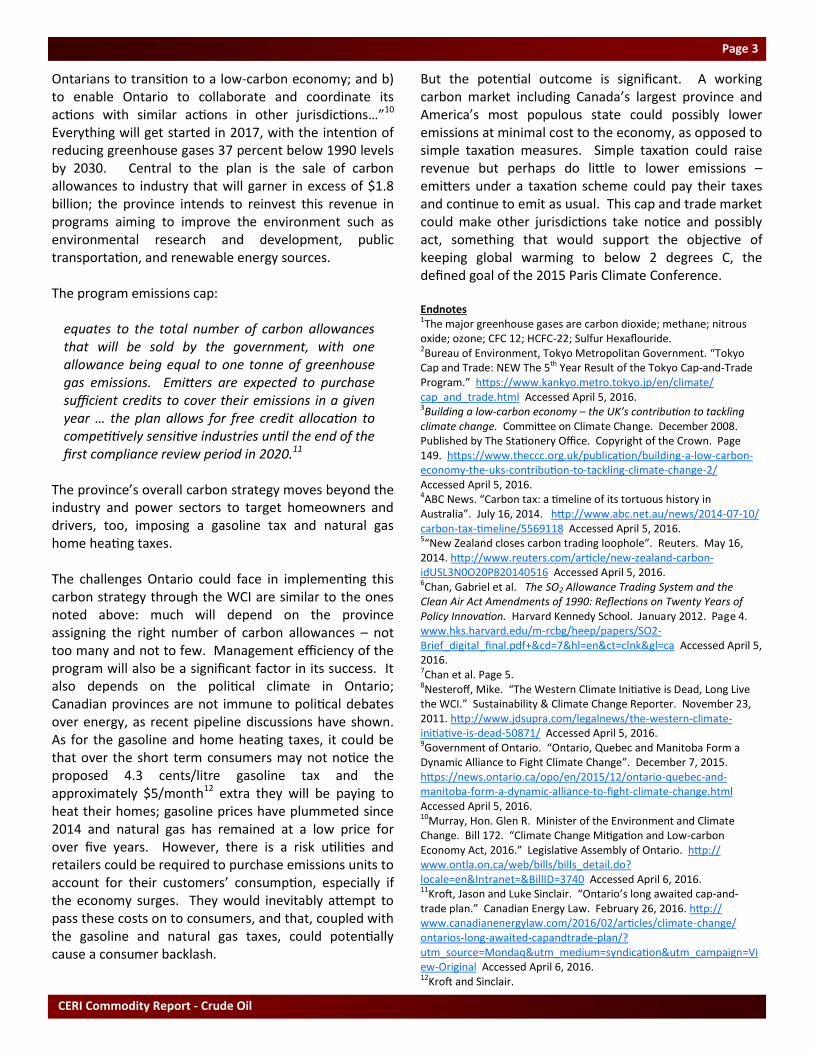
Ontarians to transition to a low-carbon economy; and b) to enable Ontario to collaborate and coordinate its actions with similar actions in other jurisdictions…”10 Everything will get started in 2017, with the intention of reducing greenhouse gases 37 percent below 1990 levels by 2030. Central to the plan is the sale of carbon allowances to industry that will garner in excess of $1.8 billion; the province intends to reinvest this revenue in programs aiming to improve the environment such as environmental research and development, public transportation, and renewable energy sources. The program emissions cap:
equates to the total number of carbon allowances that will be sold by the government, with one allowance being equal to one tonne of greenhouse gas emissions. Emitters are expected to purchase sufficient credits to cover their emissions in a given year … the plan allows for free credit allocation to competitively sensitive industries until the end of the first compliance review period in 2020.11
The province’s overall carbon strategy moves beyond the industry and power sectors to target homeowners and drivers, too, imposing a gasoline tax and natural gas home heating taxes. The challenges Ontario could face in implementing this carbon strategy through the WCI are similar to the ones noted above: much will depend on the province assigning the right number of carbon allowances – not too many and not to few. Management efficiency of the program will also be a significant factor in its success. It also depends on the political climate in Ontario; Canadian provinces are not immune to political debates over energy, as recent pipeline discussions have shown. As for the gasoline and home heating taxes, it could be that over the short term consumers may not notice the proposed 4.3 cents/litre gasoline tax and the approximately $5/month12 extra they will be paying to heat their homes; gasoline prices have plummeted since 2014 and natural gas has remained at a low price for over five years. However, there is a risk utilities and retailers could be required to purchase emissions units to account for their customers’ consumption, especially if the economy surges. They would inevitably attempt to pass these costs on to consumers, and that, coupled with the gasoline and natural gas taxes, could potentially cause a consumer backlash.
But the potential outcome is significant. A working carbon market including Canada’s largest province and America’s most populous state could possibly lower emissions at minimal cost to the economy, as opposed to simple taxation measures. Simple taxation could raise revenue but perhaps do little to lower emissions – emitters under a taxation scheme could pay their taxes and continue to emit as usual. This cap and trade market could make other jurisdictions take notice and possibly act, something that would support the objective of keeping global warming to below 2 degrees C, the defined goal of the 2015 Paris Climate Conference. Endnotes 1The major greenhouse gases are carbon dioxide; methane; nitrous oxide; ozone; CFC 12; HCFC-22; Sulfur Hexaflouride. 2Bureau of Environment, Tokyo Metropolitan Government. “Tokyo Cap and Trade: NEW The 5th Year Result of the Tokyo Cap-and-Trade Program.” https://www.kankyo.metro.tokyo.jp/en/climate/cap_and_trade.html Accessed April 5, 2016. 3Building a low-carbon economy – the UK’s contribution to tackling climate change. Committee on Climate Change. December 2008. Published by The Stationery Office. Copyright of the Crown. Page 149. https://www.theccc.org.uk/publication/building-a-low-carbon-economy-the-uks-contribution-to-tackling-climate-change-2/ Accessed April 5, 2016. 4ABC News. “Carbon tax: a timeline of its tortuous history in Australia”. July 16, 2014. http://www.abc.net.au/news/2014-07-10/carbon-tax-timeline/5569118 Accessed April 5, 2016. 5“New Zealand closes carbon trading loophole”. Reuters. May 16, 2014. http://www.reuters.com/article/new-zealand-carbon-idUSL3N0O20P820140516 Accessed April 5, 2016. 6Chan, Gabriel et al. The SO2 Allowance Trading System and the Clean Air Act Amendments of 1990: Reflections on Twenty Years of Policy Innovation. Harvard Kennedy School. January 2012. Page 4. www.hks.harvard.edu/m-rcbg/heep/papers/SO2-Brief_digital_final.pdf+&cd=7&hl=en&ct=clnk&gl=ca Accessed April 5, 2016. 7Chan et al. Page 5. 8Nesteroff, Mike. “The Western Climate Initiative is Dead, Long Live the WCI.” Sustainability & Climate Change Reporter. November 23, 2011. http://www.jdsupra.com/legalnews/the-western-climate-initiative-is-dead-50871/ Accessed April 5, 2016. 9Government of Ontario. “Ontario, Quebec and Manitoba Form a Dynamic Alliance to Fight Climate Change”. December 7, 2015. https://news.ontario.ca/opo/en/2015/12/ontario-quebec-and-manitoba-form-a-dynamic-alliance-to-fight-climate-change.html Accessed April 5, 2016. 10Murray, Hon. Glen R. Minister of the Environment and Climate Change. Bill 172. “Climate Change Mitigation and Low-carbon Economy Act, 2016.” Legislative Assembly of Ontario. http://www.ontla.on.ca/web/bills/bills_detail.do?locale=en&Intranet=&BillID=3740 Accessed April 6, 2016. 11Kroft, Jason and Luke Sinclair. “Ontario’s long awaited cap-and-trade plan.” Canadian Energy Law. February 26, 2016. http://www.canadianenergylaw.com/2016/02/articles/climate-change/ontarios-long-awaited-capandtrade-plan/?utm_source=Mondaq&utm_medium=syndication&utm_campaign=View-Original Accessed April 6, 2016. 12Kroft and Sinclair.
CERI Commodity Report - Crude Oil
Page 4
SOU
RC
E: E
IA.
SOU
RC
E: E
IA.
SOU
RC
E: N
RC
an, E
IA, B
ayte
x.
SOU
RC
E: E
IA, C
ERI.
-4-20246810
12
0
10
20
30
40
50
60
70 M
ar-
15
Ap
r-1
5M
ay
-15
Jun
-15
Jul-
15
Au
g-1
5Se
p-1
5O
ct-1
5N
ov-
15
De
c-1
5Ja
n-1
6Fe
b-1
6M
ar-
16
Ap
r-1
6
US$
/bb
l
Dif
fere
nti
al
WT
IB
ren
t
Sp
ot
Cru
de
Pri
ces
Sp
ot
Cru
de
Pri
ces
Sp
ot
Cru
de
Pri
ces
Sp
ot
Cru
de
Pri
ces
US
$/b
bl
WT
I -
Ed
mo
nto
n L
igh
tP
rice
Dif
fere
nti
als
WT
I -
Ed
mo
nto
n L
igh
tP
rice
Dif
fere
nti
als
WT
I -
Bre
nt
Pri
ce D
iffe
ren
tia
ls (U
S$
/bb
l)
Spot Price
sW
TI
Bre
nt
Cdn.L
ight*
H.H
ard
isty
Year-
to-D
ate
33.7
334.2
628.1
518.2
3
Quart
er-
to-D
ate
33.3
533.8
428.1
518.2
3
April 11, 2016
40.4
641.5
826.72
19.37
-200
20
40
60
80
10
0
12
0
14
0 Ma
r-1
0M
ar-
11
Ma
r-1
2M
ar-
13
Ma
r-1
4M
ar-
15
Ma
r-1
6
US
$/b
bl
Dif
fere
nti
al
WT
IE
dm
on
ton
Lig
ht
WT
I -
Ed
mo
nto
n L
igh
tP
rice
Dif
fere
nti
als
(US
$/b
bl)
20
25
30
35
40
45
50
12
34
US
$/b
bl
11
-Ja
n-1
61
2-F
eb
-16
12
-Ap
r-1
6
NN
YM
EX
WT
I C
rud
e F
orw
ard
Cu
rve
4
co
ntr
act
mo
nth
s
0
20
40
60
80
10
0
12
0 Ma
r-1
0M
ar-
11
Ma
r-1
2M
ar-
13
Ma
r-1
4M
ar-
15
Ma
r-1
6
US
$/b
bl
WT
IH
ard
isty
He
av
yW
CS
WW
TI
-H
ard
isty
He
av
yP
rice
Dif
fere
nti
als
WT
I -
Ca
na
dia
n H
ea
vy
Be
nch
ma
rks
(US
$/b
bl)
Relevant • Independent • Objective
Page 5
SOU
RC
E: E
IA, C
ERI.
SO
UR
CE:
NR
Can
.
SOU
RC
E: I
EA O
il M
arke
t R
epo
rt.
SOU
RC
E: E
IA W
eekl
y P
etro
leu
m S
tatu
s R
epo
rt.
0.5
0
0.7
5
1.0
0
1.2
5
1.5
0
1.7
5
2.0
0
2.2
5 Ma
r-1
5A
pr-
15
Ma
y-1
5Ju
n-1
5Ju
l-1
5A
ug-
15
Sep
-15
Oct
-15
No
v-1
5D
ec-
15
Jan
-16
Feb
-16
Ma
r-1
6A
pr-
16
US
$/g
al
RB
OB
Ga
soli
ne
He
ati
ng
Oil
NY
ME
X P
etr
ole
um
Pro
du
cts
NYM
EX P
rice
sUnle
aded G
aso
line
Heating O
il
Year-
to-D
ate
1.1
994
1.0
899
Quart
er-
to-D
ate
1.1
751
1.0
843
April 11, 2016
1.5
080
1.2
150
0.6
0
0.7
0
0.8
0
0.9
0
1.0
0
1.1
0
1.2
0
1.3
0
1.4
0
1.5
0 Ma
r-1
0M
ar-
11
Ma
r-1
2M
ar-
13
Ma
r-1
4M
ar-
15
Ma
r-1
6
CD
N/U
S$
CD
N/U
S$
Exc
ha
ng
e R
ate
49
.0%
49
.5%
50
.0%
50
.5%
51
.0%
51
.5%
52
.0%
52
.5%
0
10
20
30
40
50
60
70
80
90
10
0
11
0
4Q
14
1Q
15
2Q
15
3Q
15
4Q
15
1Q
16
2Q
16
3Q
16
4Q
16
MM
bp
d
To
tal
OE
CD
To
tal
No
n-O
EC
Dn
on
-OE
CD
De
ma
nd
sh
are
Oil
Dem
an
d in
Se
lec
ted
Co
un
trie
sG
lob
al
Oil
De
ma
nd
-20
%
0%
20
%
40
%
60
%
80
%
10
0%
To
tal
Ga
soli
ne
Jet
Fu
el
Dis
till
ate
Re
sid
ua
lP
rop
an
eO
the
r
%
UU
S P
rod
uct
s D
em
an
dM
arc
h 2
01
5 -
Ma
rch
20
16
Y-o
n-Y
ch
an
ge
CERI Commodity Report - Crude Oil
Page 6
SOU
RC
E: I
EA O
il M
arke
t R
epo
rt, C
ERI.
SO
UR
CE:
IEA
Oil
Mar
ket
Rep
ort
.
SOU
RC
E: I
EA O
il M
arke
t R
epo
rt.
SOU
RC
E: I
EA O
il M
arke
t R
epo
rt.
57
.0%
57
.5%
58
.0%
58
.5%
59
.0%
59
.5%
60
.0%
60
.5%
61
.0%
61
.5%
0
20
40
60
80
10
0
12
0
4Q
14
1Q
15
2Q
15
3Q
15
4Q
15
1Q
16
2Q
16
3Q
16
4Q
16
MM
bp
d
no
n-O
PE
C S
up
ply
OP
EC
Su
pp
lyn
on
-OP
EC
Sh
are
of
Glo
ba
l S
up
ply
SG
lob
al
Oil
Su
pp
ly
0
2,0
00
4,0
00
6,0
00
8,0
00
10
,00
0
12
,00
0
14
,00
0
4Q
15
1Q
16
2Q
16
3Q
16
4Q
16
Mb
pd
Ala
ska
Ca
lifo
rnia
Te
xa
sF
ed
era
l G
OM
Oth
er
Low
er
48
NG
LsO
the
r
US
Oil
Pro
du
ctio
nb
y r
eg
ion
0
50
0
1,0
00
1,5
00
2,0
00
2,5
00
3,0
00
3,5
00
4,0
00
4,5
00
5,0
00
4Q
15
1Q
16
2Q
16
3Q
16
4Q
16
Mb
pd
AB
L/M
/HA
B B
itu
me
nS
KO
the
rN
GLs
Sy
nth
eti
c
Ca
na
dia
n O
il P
rod
uct
ion
by
pro
du
ct
0
50
0
1,0
00
1,5
00
2,0
00
2,5
00
3,0
00
3,5
00
Fe
b-1
3F
eb
-14
Fe
b-1
5F
eb
-16
Mb
pd
OE
CD
No
rth
Am
eri
caO
EC
D E
uro
pe
OE
CD
Pa
cifi
c
OE
CD
Co
mm
erc
ial
Sto
cks
by
re
gio
n
Relevant • Independent • Objective
Page 7
SOU
RC
E: E
IA W
eekl
y P
etro
leu
m S
tatu
s R
epo
rt.
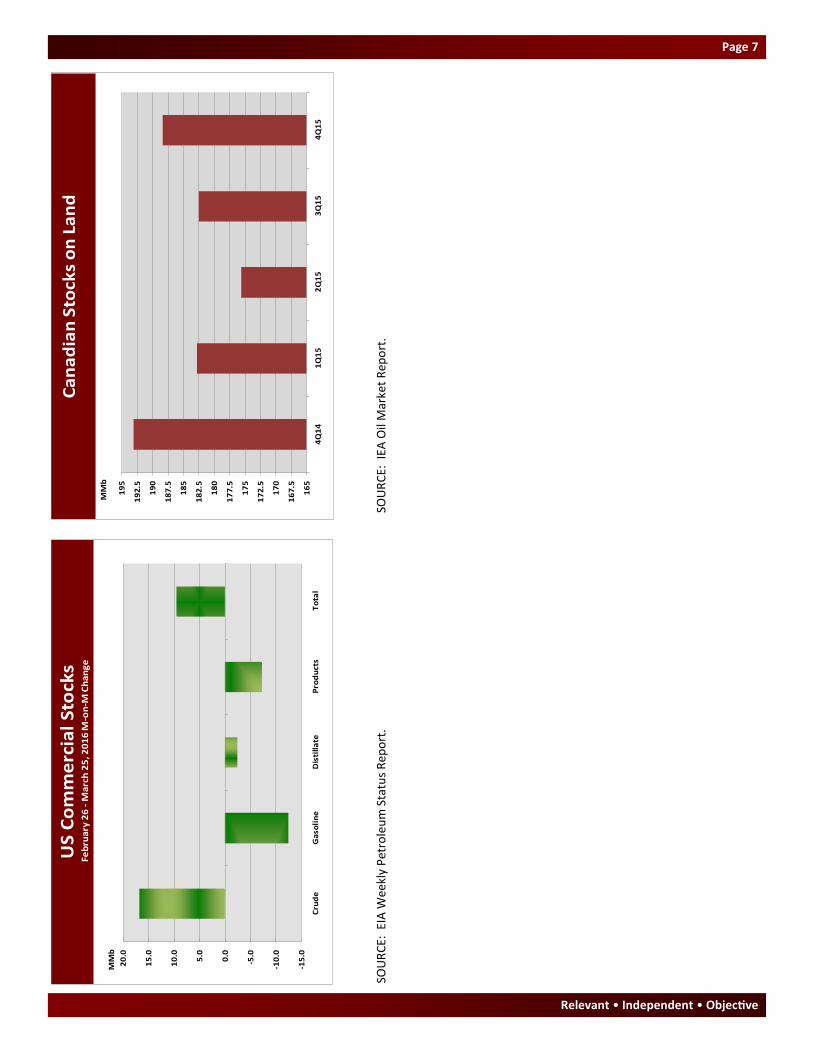
SOU
RC
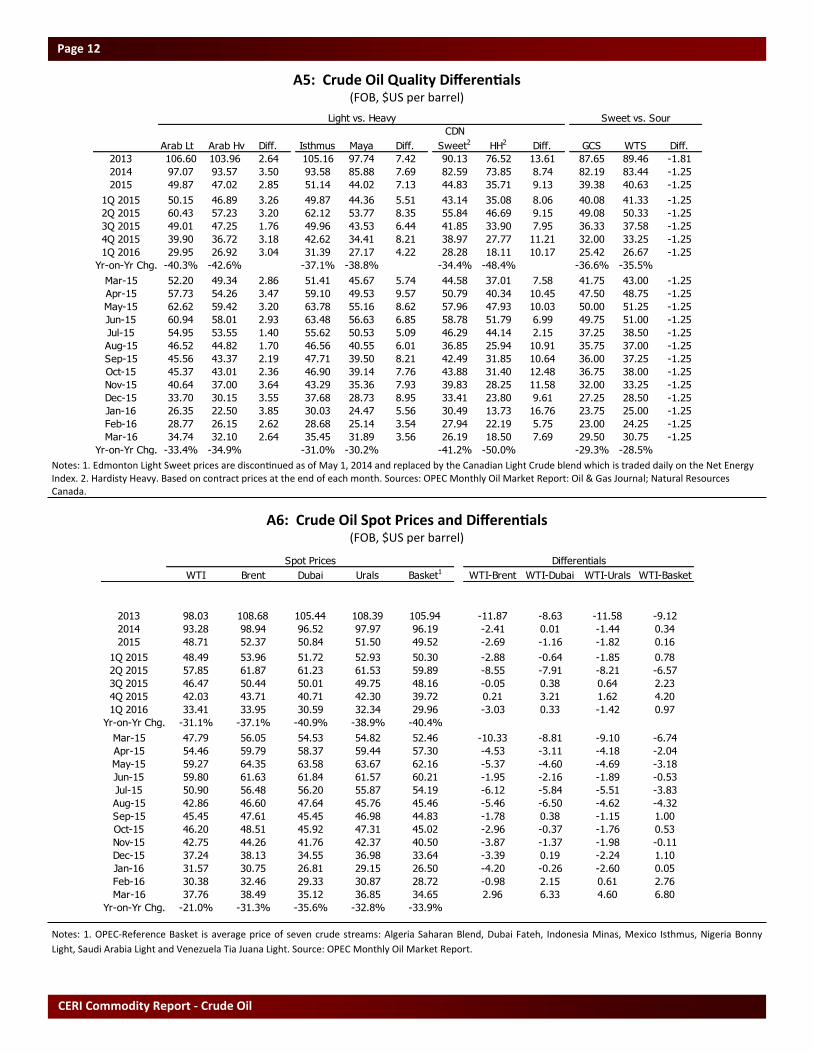
E: I
EA O
il M
arke
t R
epo
rt.
-15
.0
-10
.0
-5.0
0.0
5.0
10
.0
15
.0
20
.0
Cru
de
Ga
soli
ne
Dis
till
ate
Pro
du
cts
To
tal
MM
b
US
Co
mm
erc
ial
Sto
cks
Feb
rua
ry 2
6 -
Ma
rch
25
, 20
16
M-o
n-M
Ch
an
ge
16
5
16
7.5
17
0
17
2.5
17
5
17
7.5
18
0
18
2.5
18
5
18
7.5
19
0
19
2.5
19
5
4Q
14
1Q
15
2Q
15
3Q
15
4Q
15
MM
b
Ca
na
dia
n S
tock
s o
n L
an
d

CERI Commodity Report - Crude Oil
Page 8
World Supply and Demand Balance (MMbpd)
OPEC Crude Oil Production (MMbpd)
WTI Price Projections ($US/barrel)
2013 2014 2015 2016 1Q14 2Q14 3Q14 4Q14 1Q15 2Q15 3Q15 4Q15 1Q16 2Q16 3Q16 4Q16
World Demand 91.9 92.9 94.7 95.9 91.9 92.1 93.3 94.1 93.6 94.1 95.6 95.5 94.8 95.2 96.6 96.8
OECD 46.0 45.7 46.2 46.1 45.8 44.8 45.9 46.4 46.4 45.3 46.6 46.3 46.1 45.5 46.6 46.3
non-OECD 45.9 47.1 48.5 49.7 46.1 47.3 47.4 47.7 47.1 48.8 49.0 49.2 48.7 49.7 50.1 50.4
World Supply 91.4 93.7 96.4 0.0 92.1 93.0 94.3 95.5 95.1 96.3 96.9 97.3 96.4 95.8 96.4 96.5
Non-OPEC 53.8 56.3 57.7 57.0 55.0 55.8 56.5 57.7 57.3 57.4 57.8 58.1 57.0 56.9 56.9 57.0
OPEC NGLs 6.3 6.5 6.7 6.9 6.4 6.4 6.6 6.6 6.6 6.7 6.7 6.8 6.8 6.8 6.9 6.9
OPEC Crude 27.4 27.7 28.1 28.2 30.7 30.8 31.2 31.2 31.2 32.2 32.4 32.4 32.6 32.1 32.6 32.6
Supply - Demand1 -0.6 0.8 1.7 -95.9 0.2 1.0 0.9 1.4 1.5 2.2 1.4 1.7 1.6 0.6 -0.2 -0.3
OECD
Stocks (MMbbls) 2566 2582 2652 2720 2712 2815 2905 2984 3015 3084 3112 3103
Days Cover 56 58 58 59 58 62 62 64 65 68 67 67
Sustainable
Capacity Jan-16 Feb-16 Mar-16 Jan-16 Feb-16 Mar-16
Saudi Arabia 12.26 10.21 10.22 10.16 2.05 2.04 2.10
Iran 3.60 3.00 3.22 3.30 0.60 0.38 0.30
UAE 2.93 2.93 2.78 2.73 0.00 0.15 0.20
Kuwait 2.83 2.83 2.83 2.83 0.00 0.00 0.00
Qatar 0.67 0.64 0.67 0.67 0.03 0.00 0.00
Angola 1.81 1.75 1.76 1.80 0.06 0.05 0.01
Nigeria 1.90 1.85 1.76 1.70 0.05 0.14 0.20
Libya 0.40 0.38 0.37 0.34 0.02 0.03 0.06
Algeria 1.12 1.10 1.10 1.11 0.02 0.02 0.01
Ecuador 0.55 0.53 0.55 0.54 0.02 0.00 0.01
Venezuela 2.46 2.35 2.37 2.35 0.11 0.09 0.11
Indonesia 0.72 0.70 0.71 0.72 0.02 0.01 0.00
Production Spare Capacity vs Production
2014 2015 2016 2017 1Q15 2Q15 3Q15 4Q15 1Q16 2Q16 3Q16 4Q16 1Q17
High Price Case 39.88 45.10 37.40 39.60 40.70 41.80 44.00
Reference Case 93.28 48.71 36.25 41.00 48.49 57.85 46.47 42.03 34.00 36.00 37.00 38.00 40.00
Low Price Case 30.81 34.85 28.90 30.60 31.45 32.30 34.00

Relevant • Independent • Objective
Page 9
Data Appendix

CERI Commodity Report - Crude Oil
Page 10
A1: Historic Light Sweet Crude Futures Prices ($US per barrel)
A2: Historic Crude Product Futures Prices (¢US per gallon)
Notes (Tables A1 and A2): Prices are listed by contract month. Close: final contract close on the last day of trading. Last 3 Day Average Close: simple average con-
tract close on last three days of trading. Average When Near Month: simple average closing price on trading days when contract was near month. 12-Month Strip
Average: simple average of daily near 12-month contract closing prices in a given contract month. Spread: difference between one-month and two-month forward
prices in a given period. Source: New York Mercantile Exchange (NYMEX).
NYMEX Light Sweet Crude
Last 3 Day Avg. When 12-Month Spread
Close Average Near Mo. Strip Avg. (1-2 Mo.)
2013 96.82 97.37 97.01 97.45 -0.12
2014 96.53 96.37 96.73 87.56 0.54
2015 49.68 49.80 51.41 53.75 -0.78
1Q 2015 51.08 51.34 54.75 56.95 -0.47
2Q 2015 53.32 53.04 52.84 56.55 -1.51
3Q 2015 50.39 50.63 53.14 54.10 -0.42
4Q 2015 43.92 44.17 44.89 47.38 -0.70
1Q 2016 30.92 31.19 34.29 38.10 -1.44
Yr-on-Yr Chg. -39.5% -39.2% -37.4% -33.1%
Apr-15 45.72 44.78 47.98 52.78 -1.84
May-15 55.26 55.79 51.65 55.42 -1.57
Jun-15 58.98 58.56 58.89 61.46 -1.12
Jul-15 59.68 59.91 59.63 61.11 -0.41
Aug-15 50.36 50.47 54.66 53.70 -0.36
Sep-15 41.14 41.52 45.12 47.50 -0.49
Oct-15 45.83 45.73 44.47 46.73 -0.57
Nov-15 45.55 46.23 46.32 48.55 -0.51
Dec-15 40.39 40.56 43.88 46.86 -1.03
Jan-16 34.74 34.81 38.61 42.22 -1.39
Feb-16 26.55 28.14 33.74 36.96 -1.10
Mar-16 31.48 30.63 30.52 35.13 -1.83
Apr-16 41.45 40.27 36.44 40.15 -1.69
Yr-on-Yr Chg. -9.3% -10.1% -24.1% -23.9%
NYMEX Unleaded Gasoline NYMEX Heating Oil
Last 3 Day Avg. When 12-Month Spread Last 3 Day Avg. When 12-Month Spread
Close Average Near Mo. Strip Avg. (1-2 Mo.) Close Average Near Mo. Strip Avg. (1-2 Mo.)
2013 284.3 285.6 284.5 274.2 0.5 298.2 299.0 298.9 304.9 -0.5
2014 270.6 272.8 271.8 260.8 1.7 285.9 287.7 286.4 290.2 1.4
2015 168.8 166.0 166.4 157.8 0.5 174.8 171.9 173.2 179.6 0.5
1Q 2015 153.9 151.7 152.1 165.9 -9.1 194.4 189.3 188.0 186.9 5.3
2Q 2015 197.2 194.1 191.8 181.2 0.5 188.3 185.6 186.1 192.9 0.3
3Q 2015 185.7 180.9 186.1 156.3 8.6 171.5 167.9 170.0 179.2 -1.1
4Q 2015 138.4 137.2 135.5 127.8 1.9 145.0 144.9 148.7 159.5 -2.3
1Q 2016 114.0 112.5 111.5 125.9 -9.2 107.7 106.9 107.4 117.8 -2.0
Yr-on-Yr Chg. -25.9% -25.8% -26.7% -24.1% -44.6% -43.6% -42.9% -36.9%
Apr-15 178.0 179.3 182.6 172.6 0.3 171.8 172.6 178.2 183.2 1.8
May-15 205.0 202.3 189.9 180.4 0.1 197.6 194.7 184.0 191.9 -0.5
Jun-15 208.6 200.5 202.8 190.6 1.2 195.5 189.4 196.3 203.6 -0.4
Jul-15 209.0 205.6 206.9 180.1 3.7 188.7 186.2 188.9 197.6 -0.7
Aug-15 184.1 183.0 191.1 157.2 6.0 158.4 159.3 168.2 177.8 -1.3
Sep-15 164.0 154.0 160.4 131.6 16.3 167.4 158.2 152.8 162.1 -1.4
Oct-15 138.9 136.7 138.2 127.7 1.8 151.3 149.6 153.9 164.3 -2.1
Nov-15 140.5 136.8 134.9 128.3 1.8 149.9 148.6 149.9 161.4 -2.6
Dec-15 135.9 138.2 133.5 127.3 2.1 133.7 136.4 142.4 152.6 -2.3
Jan-16 126.7 125.8 125.4 137.4 -1.0 110.1 110.3 117.9 129.9 -3.1
Feb-16 110.3 107.6 109.4 123.6 -2.6 105.5 103.7 100.1 109.8 -1.7
Mar-16 105.0 104.1 99.5 116.7 -24.1 107.6 106.6 104.3 113.9 -1.3
Apr-16 143.6 145.3 139.9 137.4 -4.3 118.5 116.7 119.3 128.5 -1.2
Yr-on-Yr Chg. -19.3% -19.0% -23.4% -20.4% -31.0% -32.4% -33.0% -29.9%

Relevant • Independent • Objective
Page 11
A3: World Crude Oil Contract Prices (FOB, $US per barrel)
A4: North American Posted Crude Prices (FOB, $US per barrel)
Notes: 1. ANS is Delivered price on US West Coast. 2. Edmonton Light Sweet prices are discontinued as of May 1, 2014 and replaced by the Canadian Light Crude
blend which is traded daily on the Net Energy Index. 3. Hardisty Heavy. Posted prices are based on price at the end of each month. Sources: Oil & Gas Journal;
Natural Resources Canada.
Notes: 1. Urals is Delivered price at Mediterranean. Contract prices are based on prices at the end of each month. Source: OPEC Monthly Oil Market Report.
Saudi U.A.E. Oman U.K. Norway Russia Venez. Kuwait Ecuador Mexico Nigeria Indon.
Arab Lgt Dubai Oman Brent Ekofisk Urals1 T.J. Light Blend Oriente Isthmus Bonny Lgt Minas
2013 106.60 105.51 105.57 108.69 109.89 108.05 96.71 105.10 97.77 105.16 111.41 107.32
2014 97.07 96.61 96.94 99.00 99.78 98.01 86.87 95.21 87.25 93.58 100.77 98.63
2015 49.87 50.96 51.24 52.44 53.20 51.94 41.17 48.15 44.97 51.14 52.99 49.24
1Q 2015 50.15 52.03 52.77 53.97 54.96 53.30 44.05 48.36 45.02 49.87 54.57 52.13
2Q 2015 60.43 61.28 61.34 61.84 62.53 62.18 52.11 58.72 55.83 62.12 62.72 60.54
3Q 2015 49.01 49.80 49.92 50.29 50.93 49.75 37.94 47.70 42.85 49.96 50.62 45.46
4Q 2015 39.90 40.74 40.93 43.67 44.38 42.50 30.59 37.83 36.16 42.62 44.04 38.82
1Q 2016 29.95 30.47 31.50 33.91 34.41 32.30 22.67 27.89 26.73 31.39 33.72 31.64
Yr-on-Yr Chg. -40.3% -41.4% -40.3% -37.2% -37.4% -39.4% -48.5% -42.3% -40.6% -37.1% -38.2% -39.3%
Mar-15 52.20 54.66 55.12 55.93 57.18 55.07 45.79 50.52 45.79 51.41 56.75 54.11
Apr-15 57.73 58.55 58.66 59.50 60.51 59.70 49.49 55.96 52.73 59.10 60.65 58.55
May-15 62.62 63.54 63.60 64.32 64.86 64.33 55.09 60.92 58.04 63.78 65.31 62.98
Jun-15 60.94 61.76 61.77 61.69 62.21 62.52 51.74 59.29 56.71 63.48 62.19 60.09
Jul-15 54.95 56.15 56.23 56.54 57.02 55.84 44.43 53.85 47.78 55.62 56.77 51.86
Aug-15 46.52 47.87 47.87 46.72 47.53 46.22 35.26 45.28 39.75 46.56 47.07 42.46
Sep-15 45.56 45.38 45.65 47.61 48.24 47.19 34.13 43.96 41.03 47.71 48.01 42.05
Oct-15 45.37 45.84 46.07 48.56 49.23 47.49 35.48 43.61 39.91 46.90 49.16 42.13
Nov-15 40.64 41.79 42.10 44.30 45.10 43.05 31.87 38.39 36.40 43.29 44.81 40.79
Dec-15 33.70 34.59 34.61 38.16 38.80 36.97 24.42 31.49 32.18 37.68 38.16 33.53
Jan-16 26.35 26.81 27.48 30.75 31.45 29.15 20.80 23.92 24.03 30.03 30.40 30.80
Feb-16 28.77 29.44 30.37 32.46 32.86 30.87 21.38 26.77 24.70 28.68 32.24 29.49
Mar-16 34.74 35.15 36.66 38.51 38.91 36.87 25.83 32.99 31.45 35.45 38.53 34.62
Yr-on-Yr Chg. -33.4% -35.7% -33.5% -31.1% -32.0% -33.0% -43.6% -34.7% -31.3% -31.0% -32.1% -36.0%
United States Canada Light vs. Heavy
ANS1 Lost Hills Kern R. WTI WTS GCS
Okla.
Sw.
Kans.
Sw.
Mich.
So.
Wyo.
Sw.
CDN
Sweet2 HH3
2013 100.20 106.62 99.05 94.46 89.46 87.65 94.46 93.48 86.46 90.27 90.13 76.52
2014 94.79 94.13 87.39 88.44 83.44 82.19 88.44 85.77 80.44 83.52 82.59 73.85
2015 51.64 50.91 42.28 45.63 40.63 39.38 45.63 44.40 37.63 42.34 44.83 35.71
1Q 2015 60.55 52.27 41.63 46.33 41.33 40.08 46.33 44.42 38.33 42.56 43.14 35.08
2Q 2015 48.46 61.76 53.02 55.33 50.33 49.08 55.33 54.42 47.33 51.58 55.84 46.69
3Q 2015 57.69 47.85 40.37 42.58 37.58 36.33 42.58 41.50 34.58 39.26 41.85 33.90
4Q 2015 39.88 41.77 34.08 38.25 33.25 32.00 38.25 37.25 30.25 35.94 38.97 27.77
1Q 2016 34.14 33.54 27.08 31.67 26.67 25.42 31.67 30.75 23.67 30.20 28.28 18.11
Yr-on-Yr Chg. -43.6% -35.8% -34.9% -31.7% -35.5% -36.6% -31.7% -30.8% -38.3% -29.0% -34.4% -48.4%
Mar-15 42.65 54.47 42.95 48.00 43.00 41.75 48.00 44.25 40.00 44.18 44.58 37.01
Apr-15 46.82 61.44 51.15 53.75 48.75 47.50 53.75 52.75 45.75 49.90 50.79 40.34
May-15 46.61 62.72 54.05 56.25 51.25 50.00 56.25 55.25 48.25 52.47 57.96 47.93
Jun-15 51.94 61.13 53.85 56.00 51.00 49.75 56.00 55.25 48.00 52.38 58.78 51.79
Jul-15 57.76 49.87 41.75 43.50 38.50 37.25 43.50 42.50 35.50 39.87 46.29 44.14
Aug-15 57.55 47.72 40.65 42.00 37.00 35.75 42.00 40.75 34.00 37.97 36.85 25.94
Sep-15 57.76 45.95 38.70 42.25 37.25 36.00 42.25 41.25 34.25 39.95 42.49 31.85
Oct-15 41.44 47.09 38.85 43.00 38.00 36.75 43.00 42.00 35.00 40.84 43.88 31.40
Nov-15 40.48 42.46 33.85 38.25 33.25 32.00 38.25 37.25 30.25 35.96 39.83 28.25
Dec-15 37.72 35.76 29.55 33.50 28.50 27.25 33.50 32.50 25.50 31.01 33.41 23.80
Jan-16 37.72 31.62 24.85 30.00 25.00 23.75 30.00 29.00 22.00 27.87 30.49 13.73
Feb-16 41.77 31.78 25.15 29.25 24.25 23.00 29.25 28.25 21.25 27.03 27.94 22.19
Mar-16 22.94 37.21 31.25 35.75 30.75 29.50 35.75 35.00 27.75 35.71 26.19 18.50
Yr-on-Yr Chg. -46.2% -31.7% -27.2% -25.5% -28.5% -29.3% -25.5% -20.9% -30.6% -19.2% -41.2% -50.0%
CERI Commodity Report - Crude Oil
Page 12
A5: Crude Oil Quality Differentials (FOB, $US per barrel)
A6: Crude Oil Spot Prices and Differentials (FOB, $US per barrel)
Notes: 1. OPEC-Reference Basket is average price of seven crude streams: Algeria Saharan Blend, Dubai Fateh, Indonesia Minas, Mexico Isthmus, Nigeria Bonny
Light, Saudi Arabia Light and Venezuela Tia Juana Light. Source: OPEC Monthly Oil Market Report.
Notes: 1. Edmonton Light Sweet prices are discontinued as of May 1, 2014 and replaced by the Canadian Light Crude blend which is traded daily on the Net Energy Index. 2. Hardisty Heavy. Based on contract prices at the end of each month. Sources: OPEC Monthly Oil Market Report: Oil & Gas Journal; Natural Resources Canada.
Light vs. Heavy Sweet vs. Sour
Arab Lt Arab Hv Diff. Isthmus Maya Diff.
CDN
Sweet2 HH2 Diff. GCS WTS Diff.
2013 106.60 103.96 2.64 105.16 97.74 7.42 90.13 76.52 13.61 87.65 89.46 -1.81
2014 97.07 93.57 3.50 93.58 85.88 7.69 82.59 73.85 8.74 82.19 83.44 -1.25
2015 49.87 47.02 2.85 51.14 44.02 7.13 44.83 35.71 9.13 39.38 40.63 -1.25
1Q 2015 50.15 46.89 3.26 49.87 44.36 5.51 43.14 35.08 8.06 40.08 41.33 -1.25
2Q 2015 60.43 57.23 3.20 62.12 53.77 8.35 55.84 46.69 9.15 49.08 50.33 -1.25
3Q 2015 49.01 47.25 1.76 49.96 43.53 6.44 41.85 33.90 7.95 36.33 37.58 -1.25
4Q 2015 39.90 36.72 3.18 42.62 34.41 8.21 38.97 27.77 11.21 32.00 33.25 -1.25
1Q 2016 29.95 26.92 3.04 31.39 27.17 4.22 28.28 18.11 10.17 25.42 26.67 -1.25
Yr-on-Yr Chg. -40.3% -42.6% -37.1% -38.8% -34.4% -48.4% -36.6% -35.5%
Mar-15 52.20 49.34 2.86 51.41 45.67 5.74 44.58 37.01 7.58 41.75 43.00 -1.25
Apr-15 57.73 54.26 3.47 59.10 49.53 9.57 50.79 40.34 10.45 47.50 48.75 -1.25
May-15 62.62 59.42 3.20 63.78 55.16 8.62 57.96 47.93 10.03 50.00 51.25 -1.25
Jun-15 60.94 58.01 2.93 63.48 56.63 6.85 58.78 51.79 6.99 49.75 51.00 -1.25
Jul-15 54.95 53.55 1.40 55.62 50.53 5.09 46.29 44.14 2.15 37.25 38.50 -1.25
Aug-15 46.52 44.82 1.70 46.56 40.55 6.01 36.85 25.94 10.91 35.75 37.00 -1.25
Sep-15 45.56 43.37 2.19 47.71 39.50 8.21 42.49 31.85 10.64 36.00 37.25 -1.25
Oct-15 45.37 43.01 2.36 46.90 39.14 7.76 43.88 31.40 12.48 36.75 38.00 -1.25
Nov-15 40.64 37.00 3.64 43.29 35.36 7.93 39.83 28.25 11.58 32.00 33.25 -1.25
Dec-15 33.70 30.15 3.55 37.68 28.73 8.95 33.41 23.80 9.61 27.25 28.50 -1.25
Jan-16 26.35 22.50 3.85 30.03 24.47 5.56 30.49 13.73 16.76 23.75 25.00 -1.25
Feb-16 28.77 26.15 2.62 28.68 25.14 3.54 27.94 22.19 5.75 23.00 24.25 -1.25
Mar-16 34.74 32.10 2.64 35.45 31.89 3.56 26.19 18.50 7.69 29.50 30.75 -1.25
Yr-on-Yr Chg. -33.4% -34.9% -31.0% -30.2% -41.2% -50.0% -29.3% -28.5%
Spot Prices Differentials
WTI Brent Dubai Urals Basket1 WTI-Brent WTI-Dubai WTI-Urals WTI-Basket
2013 98.03 108.68 105.44 108.39 105.94 -11.87 -8.63 -11.58 -9.12
2014 93.28 98.94 96.52 97.97 96.19 -2.41 0.01 -1.44 0.34
2015 48.71 52.37 50.84 51.50 49.52 -2.69 -1.16 -1.82 0.16
1Q 2015 48.49 53.96 51.72 52.93 50.30 -2.88 -0.64 -1.85 0.78
2Q 2015 57.85 61.87 61.23 61.53 59.89 -8.55 -7.91 -8.21 -6.57
3Q 2015 46.47 50.44 50.01 49.75 48.16 -0.05 0.38 0.64 2.23
4Q 2015 42.03 43.71 40.71 42.30 39.72 0.21 3.21 1.62 4.20
1Q 2016 33.41 33.95 30.59 32.34 29.96 -3.03 0.33 -1.42 0.97
Yr-on-Yr Chg. -31.1% -37.1% -40.9% -38.9% -40.4%
Mar-15 47.79 56.05 54.53 54.82 52.46 -10.33 -8.81 -9.10 -6.74
Apr-15 54.46 59.79 58.37 59.44 57.30 -4.53 -3.11 -4.18 -2.04
May-15 59.27 64.35 63.58 63.67 62.16 -5.37 -4.60 -4.69 -3.18
Jun-15 59.80 61.63 61.84 61.57 60.21 -1.95 -2.16 -1.89 -0.53
Jul-15 50.90 56.48 56.20 55.87 54.19 -6.12 -5.84 -5.51 -3.83
Aug-15 42.86 46.60 47.64 45.76 45.46 -5.46 -6.50 -4.62 -4.32
Sep-15 45.45 47.61 45.45 46.98 44.83 -1.78 0.38 -1.15 1.00
Oct-15 46.20 48.51 45.92 47.31 45.02 -2.96 -0.37 -1.76 0.53
Nov-15 42.75 44.26 41.76 42.37 40.50 -3.87 -1.37 -1.98 -0.11
Dec-15 37.24 38.13 34.55 36.98 33.64 -3.39 0.19 -2.24 1.10
Jan-16 31.57 30.75 26.81 29.15 26.50 -4.20 -0.26 -2.60 0.05
Feb-16 30.38 32.46 29.33 30.87 28.72 -0.98 2.15 0.61 2.76
Mar-16 37.76 38.49 35.12 36.85 34.65 2.96 6.33 4.60 6.80
Yr-on-Yr Chg. -21.0% -31.3% -35.6% -32.8% -33.9%
Relevant • Independent • Objective
Page 13
A7: World Petroleum Product Spot Prices ($US per barrel)
A8: Product Spot Prices in Selected American Cities (¢US per gallon)
Notes: 1. Reformulated regular unleaded gasoline. Spot prices are based on average daily prices over a specific timeframe. Source: EIA Weekly Petroleum Status
Report.
Notes: 1. Regular unleaded gasoline. 2. Waterborne 3. High Sulfur (3.5-4.0%) Residual Fuel Oil. Spot prices are based on average daily prices over a specific timeframe. Source: IEA Oil Market Report.
US Gulf Coast, Pipeline Rotterdam, Barges Singapore, Cargoes
Gasoline1 No. 6 3%2 Jet/Ker. Gasoline1 Gasoil Resid.3 Gasoline1 Gasoil Resid.3
2013 114.66 92.96 122.77 116.69 123.40 91.47 118.98 123.24 96.39
2014 106.68 82.82 113.25 108.16 112.63 81.04 110.75 112.53 87.22
2015 66.94 40.73 63.92 67.02 65.48 37.85 69.09 64.47 44.55
1Q 2015 63.89 44.30 68.11 63.79 69.16 40.74 67.08 68.08 48.30
2Q 2015 82.07 50.94 73.83 80.08 76.66 48.84 80.94 75.00 55.91
3Q 2015 69.59 38.07 60.48 70.31 63.48 35.94 69.27 60.75 41.10
4Q 2015 52.06 29.74 53.25 54.42 53.23 26.49 59.34 54.36 33.25
1Q 2016 44.62 21.14 41.50 43.78 40.63 18.71 49.31 40.27 24.87
Yr-on-Yr Chg. -30.2% -52.3% -39.1% -31.4% -41.3% -54.1% -26.5% -40.8% -48.5%
Mar-15 70.31 45.84 68.32 70.86 70.27 43.18 73.82 70.73 49.83
Apr-15 76.63 48.56 71.50 75.57 73.77 47.19 75.56 72.38 52.92
May-15 83.36 52.41 77.25 80.72 79.43 51.12 83.68 78.05 58.72
Jun-15 86.09 51.88 72.75 83.63 76.89 48.37 83.70 74.73 56.22
Jul-15 81.50 44.40 64.77 81.21 68.74 42.27 75.84 65.06 47.86
Aug-15 69.72 35.11 58.37 68.23 60.19 33.11 65.89 57.12 37.68
Sep-15 56.97 34.42 58.29 60.82 60.98 31.89 65.26 59.45 36.92
Oct-15 54.57 34.66 58.40 56.78 58.97 32.12 63.46 59.09 37.30
Nov-15 52.06 31.77 55.75 56.64 55.44 27.75 58.92 57.41 35.26
Dec-15 49.54 23.08 45.61 49.73 44.98 19.33 55.60 46.86 27.38
Jan-16 42.89 19.09 38.96 44.86 37.05 15.54 50.33 36.16 23.14
Feb-16 39.22 20.41 40.67 40.93 39.12 18.46 44.33 38.51 23.65
Mar-16 51.03 23.58 44.88 45.60 45.55 21.97 52.68 45.52 27.51
Yr-on-Yr Chg. -27.4% -48.6% -34.3% -35.6% -35.2% -49.1% -28.6% -35.6% -44.8%
NY Harbor US Gulf Los Angeles
Gasoline1 No. 2 H.O. Distill. Gasoline1 Jet Fuel Distill. Gasoline1 Distill.
2013 281.29 292.59 301.40 269.60 292.34 296.78 292.19 301.28
2014 261.23 269.64 280.48 248.81 269.65 271.08 266.81 278.58
2015 161.18 154.68 166.33 155.30 152.55 157.92 194.58 166.03
1Q 2015 153.83 170.70 184.17 151.73 163.03 168.87 175.33 174.50
2Q 2015 191.20 177.20 189.87 185.43 176.10 183.17 227.10 191.60
3Q 2015 164.67 145.57 157.20 159.57 144.43 151.03 215.10 157.90
4Q 2015 135.00 125.23 134.10 124.47 126.63 128.60 160.77 140.13
1Q 2016 112.67 101.43 106.83 105.70 99.07 102.80 127.27 108.63
Yr-on-Yr Chg. -26.8% -40.6% -42.0% -30.3% -39.2% -39.1% -27.4% -37.7%
Mar-15 164.40 163.20 185.60 167.80 162.90 171.10 201.70 172.50
Apr-15 179.30 172.20 184.30 173.40 170.20 177.60 215.40 181.20
May-15 193.80 183.20 196.50 188.40 184.90 191.70 247.20 204.00
Jun-15 200.50 176.20 188.80 194.50 173.20 180.20 218.70 189.60
Jul-15 186.00 155.70 168.40 186.00 154.90 162.40 266.30 171.60
Aug-15 162.00 138.70 151.60 157.40 138.90 146.30 207.50 151.90
Sep-15 146.00 142.30 151.60 135.30 139.50 144.40 171.50 150.20
Oct-15 139.70 140.40 147.20 130.70 139.10 141.80 166.90 155.30
Nov-15 137.70 131.60 141.30 124.60 132.60 135.10 150.70 143.80
Dec-15 127.60 103.70 113.80 118.10 108.20 108.90 164.70 121.30
Jan-16 112.10 93.90 97.90 102.10 93.00 95.80 132.00 103.60
Feb-16 105.80 97.20 103.60 93.60 97.30 99.90 97.00 103.30
Mar-16 120.10 113.20 119.00 121.40 106.90 112.70 152.80 119.00
Yr-on-Yr Chg. -26.9% -30.6% -35.9% -27.7% -34.4% -34.1% -24.2% -31.0%

CERI Commodity Report - Crude Oil
Page 14
B1: World Petroleum Supply and Demand Balance (million barrels per day)
Notes: 1. Totals for OECD and non-OECD supply include net refining gains; specific regions/groupings within each do not. 2. OPEC demand is an estimate based on
historical annual data. 3. Balance for World equals global stockbuilds (+) and stockdraws (-) for crude oil and petroleum products and miscellaneous gains and loss-
es. Regional surpluses (+) and deficits (-) are balanced through net-imports and stock changes in the short-term, and net-imports in the longer term. Supply includes
crude oil, condensates, NGLs, oil from non-conventional sources and processing gains. Demand is for petroleum products.
Source: IEA Oil Market Report.
OECD Non-OECD OPEC World
N. A. Europe Asia-Pac Total1 Asia Non-Asia FSU Total1 P. Gulf Non-Gulf Total2 Total3
Demand
2011 24.0 14.3 8.2 46.4 19.3 11.4 4.6 35.3 4.9 2.9 7.9 89.5
2012 23.6 13.8 8.5 45.9 19.9 12.0 4.6 36.5 5.1 3.0 8.2 90.7
2013 24.1 13.6 8.3 46.0 20.7 12.1 4.7 37.5 5.3 3.1 8.5 91.9
2014 24.1 13.5 8.1 45.7 21.2 12.1 4.9 38.2 5.5 3.2 8.9 92.9
2015 24.4 13.7 8.1 46.2 22.4 12.1 4.9 39.4 5.8 3.4 9.2 94.7
1Q 2014 23.9 13.0 8.9 45.8 21.0 11.6 4.6 37.2 5.5 3.2 8.9 91.9
2Q 2014 23.7 13.4 7.7 44.8 21.3 12.3 4.9 38.5 5.5 3.2 8.9 92.1
3Q 2014 24.4 13.9 7.7 45.9 20.8 12.6 5.1 38.5 5.5 3.2 8.9 93.3
4Q 2014 24.6 13.5 8.3 46.4 21.7 12.0 5.0 38.7 5.5 3.2 8.9 94.1
1Q 2015 24.2 13.4 8.7 46.4 22.0 11.3 4.6 37.9 5.8 3.4 9.2 93.6
2Q 2015 24.1 13.6 7.6 45.3 22.4 12.2 4.9 39.5 5.8 3.4 9.2 94.1
3Q 2015 24.7 14.1 7.8 46.6 22.3 12.5 5.0 39.8 5.8 3.4 9.2 95.6
4Q 2015 24.4 13.7 8.3 46.3 22.8 12.1 5.0 39.9 5.8 3.4 9.2 95.5
1Q 2016 24.1 13.5 8.6 46.1 22.9 11.4 4.8 39.1 6.0 3.5 9.6 94.8
Supply
2011 14.6 3.8 0.6 20.1 7.7 8.5 13.6 30.7 25.7 9.6 35.8 88.6
2012 15.8 3.5 0.6 21.0 6.9 8.0 13.8 29.6 26.2 10.6 37.6 90.9
2013 17.2 3.3 0.5 22.2 6.9 7.9 13.9 29.7 26.2 9.8 36.7 91.4
2014 19.1 3.3 0.5 24.1 6.8 8.1 13.9 29.8 26.8 9.0 37.5 93.7
2015 19.9 3.5 0.5 25.1 7.0 8.3 14.0 30.3 28.2 8.6 38.7 96.4
1Q 2014 18.3 3.5 0.5 23.5 6.8 8.0 13.9 29.7 26.7 9.0 36.3 92.1
2Q 2014 18.9 3.2 0.5 23.8 6.8 8.0 13.8 29.6 26.8 9.0 36.4 93.1
3Q 2014 19.3 3.1 0.5 24.1 6.8 8.2 13.8 29.8 26.9 9.3 37.0 94.2
4Q 2014 19.9 3.4 0.5 25.0 7.1 8.3 13.9 30.3 26.8 9.4 37.0 95.5
1Q 2015 20.0 3.4 0.4 25.0 7.1 8.3 14.0 30.4 27.3 8.8 36.9 95.1
2Q 2015 19.6 3.5 0.4 24.7 7.1 8.2 14.0 30.3 28.3 8.9 38.0 96.3
3Q 2015 20.1 3.4 0.5 25.1 7.0 8.1 13.9 30.0 28.7 8.6 39.1 97.0
4Q 2015 20.1 3.6 0.5 25.3 7.1 8.1 14.0 30.2 28.6 8.7 39.2 97.2
1Q 2016 19.7 3.5 0.5 24.9 6.9 7.9 14.2 30.1 28.9 8.5 39.4 96.4
Balance
2011 -9.4 -10.5 -7.6 -26.3 -11.6 -2.9 9.0 -4.6 20.8 6.7 28.0 -0.9
2012 -7.8 -10.3 -7.9 -24.9 -13.0 -4.0 9.2 -6.9 21.1 7.6 29.4 0.2
2013 -6.9 -10.3 -7.8 -23.8 -13.8 -4.2 9.2 -7.8 20.9 6.7 28.2 -0.5
2014 -5.0 -10.2 -7.6 -21.6 -14.4 -4.0 9.0 -8.4 21.2 5.7 28.6 0.8
2015 -4.5 -10.2 -7.6 -21.1 -15.4 -3.8 9.1 -9.1 22.4 5.3 29.5 1.7
1Q 2014 -5.6 -9.5 -8.4 -22.3 -14.2 -3.6 9.3 -7.5 21.2 5.8 27.4 0.2
2Q 2014 -4.8 -10.2 -7.2 -21.0 -14.5 -4.3 8.9 -8.9 21.3 5.7 27.6 1.0
3Q 2014 -5.1 -10.8 -7.2 -21.8 -14.0 -4.4 8.7 -8.7 21.3 6.1 28.1 0.9
4Q 2014 -4.7 -10.1 -7.8 -21.4 -14.6 -3.7 8.9 -8.4 21.3 6.1 28.1 1.4
1Q 2015 -4.2 -10.0 -8.3 -21.4 -14.9 -3.0 9.4 -7.5 21.5 5.4 27.7 1.5
2Q 2015 -4.5 -10.1 -7.2 -20.6 -15.3 -4.0 9.1 -9.1 22.5 5.5 28.8 2.2
3Q 2015 -4.6 -10.7 -7.3 -21.5 -15.3 -4.4 8.9 -9.8 22.9 5.2 29.9 1.4
4Q 2015 -4.3 -10.1 -7.8 -21.0 -15.7 -4.0 9.0 -9.7 22.9 5.3 29.9 1.7
1Q 2016 -4.4 -10.0 -8.1 -21.2 -16.0 -3.5 9.4 -9.0 22.9 5.0 29.7 1.6

Relevant • Independent • Objective
Page 15
B2: World Petroleum Production (million barrels per day)
B3: OECD Commercial Petroleum Stocks (million barrels)
Notes: 1. Production includes crude oil, condensates and NGLs. 2. Reserve-Production ratio is based on latest month production and British Petroleum reserve
estimates. Sources: IEA Oil Market Report and BP Statistical Review of World Energy.
Notes: 1. Product includes only finished petroleum products. 2. Total stocks include NGLs, refinery feedstocks, additives/oxygenates and other hydrocarbons. All
stocks are closing levels for respective reporting period. Source: IEA Oil Market Report.
OECD Non-OECD OPEC World
N. A. Europe Asia-Pac Total Asia Non-Asia FSU Total P. Gulf Non-Gulf Total Total1
2013 17.14 3.32 0.48 20.94 7.73 7.97 13.80 29.50 26.18 9.80 36.72 87.16
2014 19.08 3.32 0.51 22.91 6.88 8.16 13.87 28.90 26.77 8.96 37.48 89.29
2015 19.93 3.46 0.46 23.85 7.06 8.22 13.99 29.28 28.20 8.64 38.73 91.86
1Q 2015 19.88 3.41 0.43 23.72 7.90 8.39 14.05 30.33 27.26 8.81 36.94 90.99
2Q 2015 19.51 3.49 0.44 23.45 7.95 8.23 13.97 30.15 28.27 8.92 38.03 91.63
3Q 2015 20.05 3.35 0.50 23.91 7.01 8.21 13.92 29.15 28.66 8.63 39.13 92.19
4Q 2015 20.08 3.60 0.47 24.15 7.09 8.16 14.04 29.30 28.62 8.67 39.15 92.60
1Q 2016 19.73 3.54 0.46 23.73 6.94 8.00 14.18 29.13 28.94 8.50 39.35 92.21
Yr-on-Yr Chg. -0.8% 3.8% 7.0% 0.0% -12.2% -4.6% 0.9% -4.0% 6.2% -3.5% 6.5% 1.3%
Mar-15 20.11 3.48 0.37 23.96 8.01 8.41 14.06 30.48 27.82 8.89 37.55 91.99
Apr-15 20.12 3.54 0.45 24.12 7.98 8.22 14.01 30.22 28.09 9.10 37.96 92.30
May-15 19.54 3.53 0.39 23.46 7.89 8.23 14.01 30.13 28.22 8.98 38.00 91.59
Jun-15 19.58 3.45 0.49 23.52 8.03 8.22 13.97 30.21 28.66 8.80 38.35 92.08
Jul-15 20.01 3.44 0.49 23.94 7.90 8.16 13.93 30.00 28.67 8.81 38.36 92.30
Aug-15 20.03 3.36 0.51 23.91 7.94 8.21 13.88 30.03 28.60 8.80 38.17 92.11
Sep-15 19.65 3.31 0.48 23.44 7.95 8.17 13.92 30.04 28.66 8.84 38.37 91.85
Oct-15 19.93 3.53 0.46 23.93 7.05 8.16 13.94 29.15 28.46 8.76 39.09 92.17
Nov-15 20.06 3.60 0.49 24.15 7.18 8.15 14.07 29.40 28.71 8.70 39.23 92.78
Dec-15 20.01 3.65 0.47 24.13 7.09 8.33 14.08 29.48 28.69 8.62 39.15 92.76
Jan-16 19.83 3.55 0.44 23.83 6.96 8.00 14.19 29.15 29.02 8.59 39.47 92.45
Feb-16 19.80 3.49 0.46 23.75 6.95 7.99 14.19 29.13 28.92 8.53 39.33 92.21
Mar-16 19.58 3.57 0.46 23.61 6.92 8.01 14.16 29.10 28.90 8.41 39.24 91.95
Yr-on-Yr Chg. -2.6% 2.6% 24.3% -1.5% -13.6% -4.8% 0.7% -4.5% 3.9% -5.4% 4.5% 0.0%
R/P Ratio2 32.5 9.7 24.4 28.9 13.8 23.1 27.5 23.0 75.8 130.2 83.7 50.7
North America Europe Asia-Pacific OECD
Crude Product Total Crude Product Total Crude Product Total Crude Product1 Total2
2013 500 670 1,315 307 497 869 145 170 382 952 1,337 2,566
2014 553 727 1,443 311 505 880 157 169 389 1,020 1,401 2,712
2015 641 773 1,591 361 563 989 206 166 435 1,208 1,502 3,015
4Q 2014 553 727 1,443 311 505 880 157 169 389 1,020 1,401 2,712
1Q 2015 625 695 1,483 344 524 939 178 153 392 1,148 1,372 2,815
2Q 2015 626 735 1,537 344 523 939 201 165 430 1,171 1,423 2,906
3Q 2015 617 763 1,572 339 559 967 202 176 445 1,158 1,498 2,984
4Q 2015 641 773 1,591 361 563 989 206 166 435 1,208 1,502 3,015
Yr-on-Yr Chg. 16.0% 6.4% 10.2% 16.2% 11.5% 12.4% 31.3% -1.8% 11.8% 18.4% 7.2% 11.1%
Feb-15 601 693 1,454 322 526 914 173 158 392 1,096 1,377 2,761
Mar-15 625 695 1,483 344 524 939 178 153 392 1,148 1,372 2,815
Apr-15 638 704 1,512 350 520 939 171 158 391 1,158 1,382 2,842
May-15 629 725 1,528 344 532 947 198 168 430 1,171 1,425 2,905
Jun-15 626 735 1,537 344 523 939 201 165 430 1,171 1,423 2,906
Jul-15 617 738 1,542 339 526 933 205 170 439 1,161 1,434 2,914
Aug-15 614 759 1,564 343 553 964 205 178 449 1,162 1,490 2,976
Sep-15 617 763 1,572 339 559 967 202 176 445 1,158 1,498 2,984
Oct-15 642 745 1,576 347 556 972 205 169 439 1,194 1,469 2,987
Nov-15 647 762 1,593 346 570 982 191 170 428 1,184 1,503 3,003
Dec-15 641 773 1,591 361 563 989 206 166 435 1,208 1,502 3,015
Jan-16 661 780 1,614 358 588 1,014 192 167 425 1,210 1,534 3,053
Feb-16 675 769 1,620 357 591 1,018 198 163 423 1,230 1,523 3,060
Yr-on-Yr Chg. 12.4% 11.0% 11.4% 10.8% 12.4% 11.3% 14.4% 2.8% 8.0% 12.3% 10.6% 10.9%

CERI Commodity Report - Crude Oil
Page 16
B4: OPEC Crude Oil Production and Targets (million barrels per day)
Notes: 1. Does not include NGLs; OPEC production targets apply to crude oil only. 2. Iraq does not have an official OPEC target. 3. OPEC-10 production targets. 4. As
of latest month. Source: IEA Oil Market Report.
B5: OECD Refinery Activity Crude Input (MMbpd) - Utilization (percent) - Refining Margins ($US/barrel)
Notes: 1. Based on dated Brent being processed in average US Gulf cracking refinery. 2. Based on dated Brent in average Rotterdam cracking refinery. 3. Based on
spot Dubai in average Singapore hydroskimming refinery. Source: IEA Oil Market Report.
Non-Persian Gulf OPEC-11 OPEC-11
Arabia Iran UAE Kuwait Qatar Venez. Nigeria Libya Algeria Angola Ecuador Total1 Target Iraq2
2013 9.66 2.68 2.76 2.81 0.73 2.50 1.95 0.90 1.15 1.72 0.52 27.38 30.00 3.08
2014 9.72 2.81 2.76 2.80 0.71 2.46 1.90 0.46 1.12 1.66 0.55 27.65 30.00 3.33
2015 10.17 2.86 2.88 2.79 0.66 2.40 1.80 0.40 1.11 1.76 0.54 28.06 30.00 3.99
1Q 2015 9.87 2.82 2.84 2.80 0.67 2.39 1.81 0.37 1.11 1.77 0.55 26.99 30.00 3.50
2Q 2015 10.34 2.85 2.87 2.77 0.66 2.43 1.77 0.46 1.11 1.76 0.55 27.56 30.00 3.94
3Q 2015 10.29 2.87 2.92 2.78 0.64 2.40 1.80 0.38 1.12 1.77 0.53 28.19 30.00 4.25
4Q 2015 10.18 2.89 2.89 2.78 0.66 2.38 1.84 0.40 1.11 1.76 0.54 28.11 30.00 4.28
1Q 2016 10.21 3.17 2.81 2.83 0.66 2.36 1.77 0.36 1.10 1.77 0.54 28.30 30.00 4.28
Yr-on-Yr Chg. 3.4% 12.4% -1.1% 1.1% -1.5% -1.3% -2.2% -2.7% -0.9% 0.0% -1.8% 4.9% 22.3%
Mar-15 10.19 2.79 2.84 2.80 0.68 2.40 1.74 0.48 1.12 1.75 0.55 27.34 30.00 3.70
Apr-15 10.21 2.88 2.87 2.81 0.67 2.44 1.80 0.52 1.11 1.73 0.55 27.57 30.00 3.75
May-15 10.31 2.85 2.87 2.77 0.66 2.44 1.76 0.45 1.11 1.77 0.55 27.52 30.00 3.84
Jun-15 10.48 2.82 2.88 2.74 0.66 2.42 1.78 0.41 1.11 1.78 0.54 27.62 30.00 4.19
Jul-15 10.38 2.87 2.91 2.74 0.62 2.42 1.77 0.39 1.11 1.80 0.54 27.55 30.00 4.25
Aug-15 10.28 2.87 2.93 2.80 0.65 2.40 1.77 0.37 1.13 1.73 0.53 27.46 30.00 4.17
Sep-15 10.20 2.88 2.91 2.81 0.65 2.38 1.86 0.37 1.12 1.79 0.53 27.5 30.00 4.30
Oct-15 10.21 2.88 2.89 2.73 0.67 2.38 1.90 0.43 1.11 1.78 0.53 28.18 30.00 4.17
Nov-15 10.19 2.87 2.89 2.80 0.68 2.40 1.84 0.39 1.11 1.74 0.54 28.14 30.00 4.33
Dec-15 10.14 2.91 2.89 2.81 0.64 2.37 1.80 0.38 1.11 1.75 0.54 28.04 30.00 4.35
Jan-16 10.21 3.00 2.93 2.83 0.64 2.35 1.85 0.38 1.10 1.75 0.53 28.27 30.00 4.43
Feb-16 10.22 3.22 2.78 2.83 0.67 2.37 1.76 0.37 1.10 1.76 0.55 28.34 30.00 4.22
Mar-16 10.19 3.30 2.73 2.83 0.67 2.35 1.70 0.34 1.11 1.80 0.54 28.28 30.00 4.19
Yr-on-Yr Chg. 0.0% 18.3% -3.9% 1.1% -1.5% -2.1% -2.3% -29.2% -0.9% 2.9% -1.8% 3.4% 13.2%
Quotas3 8.05 3.34 2.22 2.22 0.73 1.99 1.67 1.47 1.20 1.52 0.43 30.00
Over/Under4 26.6% -1.2% 23.0% 27.5% -8.2% 18.1% 1.8% -76.9% -7.5% 18.4% 25.6% -5.7%
Persian Gulf
North America Europe Asia-Pacific OECD
Input Util. Margin1 Input Util. Margin2 Input Util. Margin3 Input Util.
2013 18.4 87.7 1.40 11.5 75.2 3.48 6.7 75.1 -1.63 36.6 81.0
2014 18.9 90.0 1.67 11.4 75.0 3.35 6.5 73.2 -1.98 36.8 81.6
2015 19.1 91.1 5.65 12.1 79.4 7.28 6.7 75.1 0.62 37.9 84.0
4Q 2014 18.9 90.0 -1.03 11.8 77.4 4.72 6.6 74.1 -0.1 37.3 82.6
1Q 2015 18.5 88.2 5.93 12.0 78.4 7.03 7.1 78.8 2.6 37.5 83.0
2Q 2015 19.4 92.3 5.89 11.8 77.4 8.10 6.4 71.8 0.5 37.6 83.2
3Q 2015 19.5 93.0 7.30 12.4 81.3 8.91 6.7 75.3 -1.1 38.6 85.5
4Q 2015 19.1 91.0 3.49 12.3 80.4 5.09 6.7 74.4 0.6 38.0 84.1
Yr-on-Yr Chg. 1.1% -438.1% 3.9% 7.8% 0.5% -605.9% 1.8%
Feb-15 18.4 87.7 8.01 12.2 79.9 6.60 7.2 80.0 2.6 37.7 83.6
Mar-15 18.6 88.7 6.98 11.8 77.5 8.75 6.9 76.8 2.5 37.3 82.6
Apr-15 19.1 91.1 4.55 11.8 77.6 7.71 6.7 75.2 0.5 37.7 83.4
May-15 19.3 92.2 5.58 11.9 78.0 7.40 6.4 71.0 0.7 37.6 83.2
Jun-15 19.6 93.7 7.53 11.7 76.5 9.18 6.2 69.2 0.2 37.5 83.0
Jul-15 19.8 94.2 9.75 12.3 80.8 9.53 6.8 75.4 -2.3 38.8 86.0
Aug-15 19.7 93.9 8.54 12.4 81.4 10.05 7.0 78.0 -1.4 39.1 86.5
Sep-15 19.0 90.7 3.60 12.5 81.7 7.15 6.5 72.4 0.2 38.0 84.1
Oct-15 18.2 86.9 4.12 12.4 81.0 4.24 6.4 71.1 -0.8 36.9 81.8
Nov-15 19.3 91.9 3.60 12.2 79.7 6.65 6.6 73.7 1.8 38.0 84.2
Dec-15 19.7 94.0 2.76 12.3 80.5 4.38 7.0 78.4 0.7 39.0 86.4
Jan-16 19.0 90.8 4.27 12.0 78.9 5.50 7.1 79.5 2.8 38.2 84.5
Feb-16 18.6 88.8 3.10 11.9 77.9 3.66 7.3 81.3 0.9 37.8 83.6
Yr-on-Yr Chg. 1.3% -61.3% -2.5% -45% 1.8% -63.8% 0.1%

Relevant • Independent • Objective
Page 17
C1: US Petroleum Supply and Demand Balance (million barrels per day)
Notes: 1. Does not balance because of unaccounted for crude oil. Regional surpluses (+) and deficits (-) are balanced through net-imports/transfers and stock chang-
es in the short-term, and net-imports/transfers in the longer term. 2. As of most recent month. Supply includes crude oil, condensates, NGLs, oil from non-
conventional sources and processing gains. Demand is for petroleum products. Source: EIA Petroleum Supply Monthly.
United States1 East Mid-West
Supply Demand Net-Imp. Stk. Chg. Supply Demand Balance Supply Demand Balance
2013 12.11 18.89 6.20 -0.13 0.19 5.23 -5.04 2.90 4.88 -1.97
2014 13.67 19.03 5.04 0.26 0.31 5.45 -5.14 3.35 4.91 -1.56
2015 14.78 19.39 4.65 0.43 0.41 5.58 -5.17 3.63 5.01 -1.38
4Q 2014 14.38 19.45 4.62 0.24 0.37 5.55 -5.18 3.55 5.10 -1.55
1Q 2015 14.45 19.29 4.93 0.56 0.36 5.81 -5.45 3.56 4.99 -1.43
2Q 2015 14.91 19.25 4.61 0.69 0.43 5.49 -5.06 3.64 4.99 -1.36
3Q 2015 14.85 19.67 4.73 0.33 0.42 5.54 -5.12 3.60 5.11 -1.50
4Q 2015 14.89 19.36 4.31 0.15 0.42 5.46 -5.05 3.74 4.97 -1.24
Yr-on-Yr Chg. 3.5% -0.5% -6.8% 13.1% -1.5% 5.1% -2.5%
Jan-15 14.24 19.25 4.83 0.57 0.36 5.64 -5.28 3.54 4.91 -1.37
Feb-15 14.34 19.40 4.54 0.13 0.33 5.99 -5.65 3.54 5.08 -1.54
Mar-15 14.76 19.24 5.43 0.99 0.39 5.79 -5.40 3.59 4.97 -1.38
Apr-15 15.12 19.04 4.36 0.90 0.42 5.49 -5.07 3.58 4.88 -1.30
May-15 14.91 19.12 4.60 0.73 0.43 5.52 -5.09 3.65 5.01 -1.37
Jun-15 14.69 19.59 4.88 0.44 0.44 5.47 -5.03 3.68 5.08 -1.40
Jul-15 14.82 19.98 4.54 -0.09 0.43 5.58 -5.15 3.65 5.18 -1.53
Aug-15 14.91 19.81 5.20 0.73 0.42 5.61 -5.20 3.60 5.07 -1.47
Sep-15 14.83 19.23 4.45 0.33 0.41 5.42 -5.01 3.56 5.06 -1.51
Oct-15 14.90 19.35 4.17 0.26 0.41 5.50 -5.10 3.70 5.15 -1.44
Nov-15 14.92 19.19 4.31 0.42 0.41 5.27 -4.86 3.74 4.80 -1.06
Dec-15 14.86 19.54 4.45 -0.22 0.43 5.62 -5.18 3.76 4.97 -1.21
Jan-16 14.69 19.06 4.86 0.83 0.44 5.31 -4.86 3.66 5.04 -1.38
Yr-on-Yr Chg. 3.2% -1.0% 0.6% 23.1% -6.0% 3.3% 2.5%
% of Total2 100.0% 100.0% 3.0% 27.9% 24.9% 26.4%
South-Central North-West West Finished Petroleum Products
Supply Demand Balance Supply Demand Balance Supply Demand Balance
2013 6.77 5.28 1.49 0.87 0.71 0.16 1.37 2.79 -1.42
2014 7.65 5.16 2.50 0.98 0.71 0.27 1.38 2.81 -1.43
2015 8.31 5.20 3.11 1.10 0.69 0.41 1.33 2.91 -1.59
4Q 2014 8.01 5.31 2.70 1.03 0.71 0.32 1.42 2.78 -1.36
1Q 2015 8.08 5.02 3.06 1.08 0.70 0.38 1.37 2.78 -1.41
2Q 2015 8.38 5.15 3.24 1.12 0.69 0.43 1.34 2.93 -1.58
3Q 2015 8.44 5.29 3.15 1.12 0.70 0.41 1.27 3.04 -1.77
4Q 2015 8.32 5.33 2.99 1.10 0.67 0.42 1.32 2.92 -1.60
Yr-on-Yr Chg. 3.8% 0.4% 6.9% -4.9% -6.9% 4.9%
Jan-15 7.96 5.28 2.68 1.03 0.72 0.30 1.35 2.69 -1.33
Feb-15 8.03 4.78 3.24 1.08 0.73 0.35 1.36 2.82 -1.46
Mar-15 8.27 5.00 3.27 1.14 0.66 0.48 1.38 2.82 -1.44
Apr-15 8.59 5.05 3.54 1.14 0.69 0.46 1.39 2.93 -1.54
May-15 8.39 5.07 3.32 1.10 0.66 0.44 1.34 2.86 -1.51
Jun-15 8.17 5.32 2.85 1.10 0.72 0.38 1.30 3.00 -1.70
Jul-15 8.33 5.40 2.93 1.12 0.71 0.41 1.29 3.10 -1.82
Aug-15 8.54 5.33 3.21 1.12 0.74 0.38 1.23 3.06 -1.83
Sep-15 8.46 5.13 3.33 1.11 0.66 0.45 1.30 2.95 -1.65
Oct-15 8.39 5.05 3.34 1.10 0.69 0.42 1.31 2.96 -1.66
Nov-15 8.33 5.62 2.71 1.11 0.66 0.44 1.33 2.83 -1.50
Dec-15 8.25 5.33 2.92 1.08 0.67 0.41 1.33 2.96 -1.63
Jan-16 8.16 5.36 2.80 1.07 0.66 0.41 1.36 2.69 -1.33
Yr-on-Yr Chg. 2.5% 1.5% 4.1% -8.6% 0.8% 0.1%
% of Total2 55.6% 28.1% 7.3% 3.5% 9.3% 14.1%

CERI Commodity Report - Crude Oil
Page 18
C2: US Petroleum Demand by Product (million barrels per day)
Notes: 1. Total includes other finished petroleum products. 2. Total petroleum demand includes refinery feedstocks, additives/oxygenates and other hydrocarbons.
Source: EIA Petroleum Supply Monthly.
C3: US Petroleum Stocks (million barrels)
Notes: 1. Petroleum stocks include crude oil, finished products, NGLs, refinery feedstocks, additives/oxygenates and other hydrocarbons. 2. Includes Strategic
Petroleum Reserves. 3. Total includes other finished petroleum products. All stocks are closing levels for respective reporting period. Source: EIA Petroleum Supply
Monthly.
Finished Petroleum Products NGLs Petroleum
Gasoline Jet Fuel Distil. Resid. Total1 Total Total2
2013 8.77 1.42 3.84 0.32 16.32 2.45 18.89
2014 8.92 1.47 4.01 0.26 16.64 2.40 19.03
2015 9.16 1.54 3.98 0.26 16.94 2.47 19.39
4Q 2014 9.05 1.50 4.08 0.30 16.90 2.60 19.45
1Q 2015 8.81 1.45 4.27 0.24 16.62 2.72 19.29
2Q 2015 9.26 1.54 3.88 0.19 16.93 2.27 19.25
3Q 2015 9.39 1.59 3.93 0.31 17.41 2.29 19.67
4Q 2015 9.17 1.57 3.83 0.30 16.79 2.58 19.36
Yr-on-Yr Chg. 1.3% 4.5% -6.1% -0.1% -0.6% -0.6% -0.5%
Jan-15 8.72 1.37 4.24 0.27 16.50 2.83 19.25
Feb-15 8.65 1.44 4.54 0.20 16.56 2.84 19.40
Mar-15 9.06 1.54 4.05 0.26 16.80 2.50 19.24
Apr-15 9.14 1.48 4.00 0.15 16.74 2.34 19.04
May-15 9.25 1.51 3.79 0.23 16.84 2.17 19.12
Jun-15 9.39 1.64 3.85 0.17 17.20 2.30 19.59
Jul-15 9.44 1.64 3.88 0.33 17.52 2.40 19.98
Aug-15 9.47 1.60 3.89 0.32 17.53 2.34 19.81
Sep-15 9.28 1.54 4.02 0.28 17.18 2.14 19.23
Oct-15 9.25 1.58 3.99 0.21 17.06 2.43 19.35
Nov-15 9.11 1.55 3.70 0.36 16.60 2.55 19.19
Dec-15 9.14 1.58 3.80 0.33 16.71 2.77 19.54
Jan-16 8.67 1.45 3.82 0.34 16.12 2.96 19.06
Yr-on-Yr Chg. -0.6% 6.0% -9.9% 24.6% -2.3% 4.6% -1.0%
Petroleum Stocks1 Crude Oil Finished Products
East Mid-West S-Cent N-West West U.S. Total2 Gasoline Jet Fuel Distil. Resid. Total3
2013 151 269 1,162 39 139 1,760 1,054 40 37 127 38 291
2014 158 289 1,227 42 140 1,856 1,085 31 38 136 34 287
2015 193 335 1,298 46 144 2,015 1,176 28 40 161 42 325
4Q 2014 158 289 1,227 42 140 1,856 1,085 31 38 136 34 287
1Q 2015 152 316 1,247 44 150 1,908 1,166 27 37 128 38 288
2Q 2015 171 322 1,290 43 145 1,971 1,163 26 44 139 42 305
3Q 2015 184 318 1,311 43 145 2,001 1,156 29 40 149 41 308
4Q 2015 193 335 1,298 46 144 2,015 1,176 28 40 161 42 325
Yr-on-Yr Chg. 22.2% 15.8% 5.7% 8.5% 2.7% 8.5% 8.5% -7.1% 7.3% 18.1% 25.3% 13.3%
Jan-15 164 297 1,227 42 145 1,874 1,112 30 38 132 34 287
Feb-15 152 302 1,235 42 146 1,878 1,139 31 39 123 37 284
Mar-15 152 316 1,247 44 150 1,908 1,166 27 37 128 38 288
Apr-15 157 323 1,267 45 144 1,935 1,174 26 38 129 39 289
May-15 164 320 1,285 44 145 1,958 1,172 27 42 134 41 301
Jun-15 171 322 1,290 43 145 1,971 1,163 26 44 139 42 305
Jul-15 173 323 1,289 43 141 1,969 1,151 24 44 142 40 302
Aug-15 179 329 1,299 42 142 1,991 1,153 26 43 152 39 310
Sep-15 184 318 1,311 43 145 2,001 1,156 29 40 149 41 308
Oct-15 185 314 1,319 43 148 2,009 1,182 28 38 143 43 299
Nov-15 188 331 1,306 44 151 2,022 1,183 28 38 157 44 316
Dec-15 193 335 1,298 46 144 2,015 1,176 28 40 161 42 325
Jan-16 200 338 1,302 46 154 2,041 1,195 27 42 161 44 330
Yr-on-Yr Chg. 22.2% 14.0% 6.1% 9.3% 6.3% 8.9% 7.4% -10.4% 10.4% 21.7% 28.6% 14.9%

Relevant • Independent • Objective
Page 19
C4: US Petroleum Net Imports by Source (million barrels per day)
Notes: 1. Total includes net-imports from Russia and Asia-Pacific region. 2. Total OPEC includes the other eight cartel members. 3. As of latest month. Source EIA
Petroleum Supply Monthly.
C5: US Regional Crude Oil Production (million barrels per day)
Notes: 1. California includes Federal Offshore crude oil production. 2. Gulf of Mexico includes Federal Offshore production adjacent to Texas and Louisiana. 3. Crude
oil Reserve-Production ratio as of latest production month. Crude oil production does not include NGLs. Source: EIA Petroleum Supply Monthly.
OPEC
Canada Mexico Lat. Am. Europe Africa M.E. Total1 Venez. S. Arabia Nigeria Total2 P. Gulf
2013 2.59 0.39 0.74 -0.08 0.37 1.99 6.20 0.71 1.32 0.24 3.47 1.99
2014 2.58 0.29 0.56 -0.12 0.17 1.85 5.04 0.71 1.16 0.04 2.98 1.86
2015 2.81 0.07 0.73 -0.18 0.17 1.49 4.65 0.75 1.05 0.06 2.65 1.50
4Q 2014 2.72 0.21 0.59 -0.07 0.15 1.41 4.62 0.64 0.88 0.03 2.50 1.41
1Q 2015 2.97 0.16 0.65 -0.12 0.13 1.39 4.93 0.68 0.93 0.04 2.49 1.40
2Q 2015 2.69 0.12 0.71 -0.14 0.15 1.61 4.61 0.74 1.16 0.02 2.67 1.61
3Q 2015 2.80 0.01 0.88 -0.15 0.22 1.32 4.73 0.79 1.01 0.08 2.58 1.33
4Q 2015 2.77 -0.01 0.70 -0.31 0.19 1.64 4.31 0.79 1.11 0.08 2.87 1.64
Yr-on-Yr Chg. 1.6% -105.1% 19.0% 322.1% 26.1% 16.2% -6.8% 23.2% 26.0% 203.7% 15.1% 16.4%
Jan-15 2.95 0.04 0.63 -0.12 0.12 1.32 4.83 0.60 0.82 0.04 2.36 1.33
Feb-15 2.93 0.09 0.51 -0.10 0.11 1.41 4.54 0.71 0.94 -0.01 2.55 1.42
Mar-15 3.03 0.34 0.82 -0.14 0.17 1.44 5.43 0.74 1.04 0.09 2.56 1.45
Apr-15 2.84 0.15 0.78 -0.36 0.14 1.52 4.36 0.80 1.20 0.03 2.63 1.53
May-15 2.51 0.03 0.71 0.05 0.19 1.71 4.60 0.77 1.21 0.05 2.82 1.72
Jun-15 2.73 0.20 0.63 -0.12 0.12 1.60 4.88 0.64 1.08 -0.01 2.55 1.60
Jul-15 2.53 -0.05 0.81 -0.10 0.24 1.45 4.54 0.70 1.17 0.11 2.63 1.46
Aug-15 2.98 0.09 1.03 -0.01 0.18 1.25 5.21 0.85 1.01 0.05 2.50 1.25
Sep-15 2.88 0.00 0.79 -0.34 0.25 1.28 4.45 0.81 0.86 0.08 2.61 1.28
Oct-15 2.43 0.03 0.67 -0.27 0.14 1.54 4.17 0.73 0.98 0.04 2.68 1.54
Nov-15 2.73 0.03 0.61 -0.33 0.20 1.65 4.31 0.77 1.23 0.08 2.91 1.65
Dec-15 3.14 -0.09 0.81 -0.32 0.22 1.72 4.45 0.86 1.12 0.13 3.02 1.73
Jan-16 3.19 -0.02 0.62 -0.17 0.23 1.51 4.86 0.65 1.05 0.12 2.82 1.51
Yr-on-Yr Chg. 8.1% -154.5% -0.8% 39.5% 94.1% 13.7% 0.7% 8.2% 28.9% 241.7% 19.7% 13.7%
% of Total3 65.7% -0.5% 12.8% -3.6% 4.7% 31.0% 100.0% 13.3% 21.7% 2.5% 58.1% 31.1%
Region of Origin
PAD District U.S. Major Producers
East Mid-West S-Cent N-West West Total Alaska Calif.1 Louis. Texas G. of Mex.2
2013 0.03 1.34 4.33 0.50 1.11 7.31 0.52 0.59 0.20 2.47 1.28
2014 0.04 1.62 5.00 0.58 1.11 8.35 0.50 0.60 0.19 3.04 1.35
2015 0.05 1.81 5.69 0.73 1.08 9.35 0.49 0.59 0.17 3.50 1.50
4Q 2014 0.04 1.77 5.32 0.63 1.08 8.85 0.47 0.61 0.19 3.26 1.43
1Q 2015 0.05 1.86 5.65 0.68 1.14 9.38 0.53 0.62 0.19 3.52 1.46
2Q 2015 0.05 1.77 5.65 0.73 1.09 9.28 0.49 0.59 0.17 3.54 1.43
3Q 2015 0.06 1.82 5.71 0.76 1.05 9.39 0.47 0.58 0.17 3.52 1.48
4Q 2015 0.05 1.78 5.75 0.75 1.02 9.35 0.46 0.56 0.17 3.41 1.65
Yr-on-Yr Chg. 6.7% 0.6% 8.1% 19.1% -5.8% 5.7% -2.9% -7.9% -8.9% 4.5% 15.4%
Jan-15 0.04 1.72 5.25 0.62 1.09 8.73 0.50 0.59 0.18 3.29 1.34
Feb-15 0.05 2.03 6.15 0.74 1.25 10.21 0.58 0.67 0.20 3.82 1.60
Mar-15 0.05 1.82 5.55 0.68 1.09 9.19 0.50 0.58 0.18 3.46 1.44
Apr-15 0.04 1.67 5.21 0.66 1.04 8.62 0.46 0.58 0.16 3.23 1.36
May-15 0.05 1.84 5.78 0.76 1.11 9.53 0.51 0.60 0.18 3.67 1.41
Jun-15 0.07 1.80 5.95 0.76 1.12 9.70 0.51 0.61 0.18 3.71 1.51
Jul-15 0.07 1.82 5.79 0.74 1.08 9.51 0.47 0.61 0.18 3.66 1.41
Aug-15 0.06 1.77 5.43 0.73 1.01 9.00 0.47 0.54 0.17 3.35 1.40
Sep-15 0.05 1.87 5.90 0.80 1.05 9.67 0.46 0.58 0.17 3.56 1.64
Oct-15 0.05 1.77 5.77 0.77 0.97 9.32 0.41 0.56 0.17 3.42 1.65
Nov-15 0.05 1.74 5.81 0.76 1.04 9.39 0.47 0.56 0.17 3.42 1.69
Dec-15 0.04 1.84 5.68 0.73 1.05 9.35 0.50 0.55 0.17 3.39 1.61
Jan-16 0.04 1.77 5.45 0.71 1.05 9.02 0.51 0.55 0.16 3.29 1.50
Yr-on-Yr Chg. 2.6% 2.4% 3.8% 13.7% -3.7% 3.3% 1.1% -7.7% -8.0% -0.1% 12.0%
R/P Ratio3 21.9 13.2 10.7 14.1 15.7 12.1 15.5 16.0 11.0 11.7 8.6

CERI Commodity Report - Crude Oil
Page 20
C6: US Refinery Activity Crude Input (MMbpd) - Utilization (percent)
Notes: 1) As of most recent month. Source: EIA Petroleum Supply Monthly.
C7: US Refinery Margins ($US per barrel)
Note: Based on specific crude being processed in average cracking refinery in a given area. As of February 2010, NY Harbor Arab Med. is now East Coast Composite.
Source: Oil and Gas Journal.
East Mid-West South-Central North-West West U.S.
Input Util. Input Util. Input Util. Input Util. Input Util. Input Util.
2013 1.10 85.1 3.42 90.7 8.22 90.4 0.58 92.7 2.56 84.8 15.88 89.2
2014 1.09 84.2 3.52 92.5 8.38 91.5 0.58 90.5 2.57 87.0 16.14 90.4
2015 1.15 90.7 3.59 93.1 8.70 93.4 0.60 93.2 2.58 88.2 16.61 92.3
4Q 2014 1.11 86.6 3.48 91.5 8.49 92.6 0.59 91.5 2.59 89.0 16.25 91.3
1Q 2015 1.14 90.9 3.60 93.8 8.54 93.2 0.60 92.6 2.63 91.5 16.51 92.9
2Q 2015 1.15 91.0 3.70 96.2 8.77 94.4 0.60 93.4 2.46 84.0 16.69 92.8
3Q 2015 1.15 90.4 3.65 94.6 8.77 93.5 0.61 94.2 2.67 91.0 16.85 93.2
4Q 2015 1.15 90.6 3.41 87.7 8.71 92.4 0.60 92.5 2.54 86.5 16.40 90.3
Yr-on-Yr Chg. 4.1% -2.1% 2.6% 1.7% -1.9% 0.9%
Jan-15 1.09 85.5 3.43 88.8 8.20 89.1 0.58 90.0 2.51 86.1 15.81 88.4
Feb-15 1.27 102.6 3.84 101.1 9.20 101.1 0.65 100.6 2.92 104.5 17.87 101.7
Mar-15 1.08 85.0 3.52 91.5 8.24 89.6 0.56 87.2 2.46 84.4 15.86 88.7
Apr-15 1.13 89.1 3.70 96.4 8.66 93.5 0.60 92.9 2.43 82.7 16.52 92.0
May-15 1.16 91.1 3.68 95.7 8.75 94.3 0.60 92.6 2.44 83.0 16.61 92.5
Jun-15 1.18 92.7 3.71 96.6 8.91 95.5 0.61 94.7 2.53 86.2 16.94 94.0
Jul-15 1.19 93.6 3.82 99.3 8.89 95.0 0.62 95.4 2.66 90.6 17.18 95.1
Aug-15 1.20 94.0 3.64 94.7 8.83 94.3 0.62 94.6 2.68 91.4 16.96 93.9
Sep-15 1.06 83.5 3.48 89.8 8.58 91.3 0.60 92.5 2.67 91.1 16.39 90.4
Oct-15 1.13 89.0 3.01 77.5 8.39 89.4 0.61 92.9 2.55 87.1 15.69 86.6
Nov-15 1.19 93.5 3.55 91.6 8.76 92.8 0.60 92.5 2.57 87.5 16.67 91.8
Dec-15 1.14 89.2 3.66 94.0 8.96 95.0 0.60 92.0 2.49 85.0 16.85 92.6
Jan-16 1.14 88.9 3.72 94.9 8.39 88.2 0.57 84.1 2.55 87.1 16.37 89.4
Yr-on-Yr Chg. 4.7% 8.6% 2.3% -1.5% 1.3% 3.5%
% of Total1 6.9% 22.7% 51.3% 3.5% 15.6% 100.0%
NY Harbor Chicago US Gulf Los Angeles
(East Coast Comp.) (WTI) (WTS) (ANS)
2013 9.20 21.63 12.83 10.25
2014 8.62 16.57 11.76 8.68
2015 12.86 18.05 12.96 19.50
1Q 2015 12.42 15.57 14.05 15.73
2Q 2015 17.81 18.79 15.02 21.83
3Q 2015 12.47 24.84 13.79 23.75
4Q 2015 8.74 12.99 8.98 16.67
1Q 2016 9.15 7.50 8.58 10.63
Yr-on-Yr Chg. -26.3% -51.9% -38.9% -32.4%
Mar-15 13.76 22.41 16.51 22.35
Apr-15 12.22 16.73 14.22 20.81
May-15 19.58 19.79 14.96 28.22
Jun-15 21.63 19.84 15.87 16.46
Jul-15 12.74 23.51 16.50 33.40
Aug-15 14.54 30.64 15.80 22.98
Sep-15 10.13 20.37 9.07 14.88
Oct-15 7.03 19.61 9.08 14.45
Nov-15 9.83 10.00 9.25 13.00
Dec-15 9.35 9.35 8.62 22.57
Jan-16 9.37 5.65 8.70 13.01
Feb-16 7.20 5.28 7.38 3.38
Mar-16 10.87 11.56 9.66 15.51
Yr-on-Yr Chg. -21.0% -48.4% -41.5% -30.6%
Relevant • Independent • Objective
Page 21
D1: Canada Petroleum Supply and Demand Balances (million barrels per day)
D2: Canada Demand by Product (million barrels per day)
Notes: 1. As of most recent month. See notes for Table C1 for additional comments. Source: Statistics Canada’s Energy Statistics Handbook.
D3: Canada Petroleum Stocks (million barrels)
Notes: 1. Total includes other finished petroleum products. 2. Total petroleum demand includes refinery feedstocks, additives/oxygenates and other hydrocarbons. Source: Statistics Canada’s Energy Statistics Handbook.
Notes: 1. Total includes other finished petroleum products. 2. Total petroleum stocks include NGLs, refinery feedstocks, additives/oxygenates and other hydrocarbons. All stocks are closing levels. Source: Statistics Canada’s Energy Statistics Handbook.
Canada East West
Supply Demand Net-Exp Stk. Chg. Supply Demand Balance Supply Demand Balance
2013 4.04 1.65 2.40 0.01 0.28 0.98 -0.70 3.76 0.66 3.09
2014 4.35 1.56 2.80 0.02 0.27 0.93 -0.67 4.08 0.63 3.45
2015 4.51 1.58 2.96 0.03 0.22 0.96 -0.74 4.29 0.62 3.67
4Q 2014 4.54 1.58 3.05 0.08 0.31 0.95 -0.64 4.24 0.63 3.61
1Q 2015 4.70 1.69 2.98 -0.04 0.31 1.03 -0.72 4.39 0.65 3.74
2Q 2015 4.24 1.54 2.65 -0.04 0.24 0.94 -0.70 4.00 0.60 3.40
3Q 2015 4.59 1.60 3.09 0.10 0.22 0.96 -0.74 4.37 0.64 3.73
4Q 2015 4.65 1.49 3.27 0.12 0.25 0.92 -0.67 4.40 0.58 3.82
Yr-on-Yr Chg. 2.3% -5.3% 7.5% -18.8% -3.4% 3.8% -8.1%
Dec-14 4.58 1.68 2.89 0.00 0.31 1.02 -0.71 4.28 0.67 3.61
Jan-15 4.76 1.69 3.03 -0.04 0.34 1.01 -0.67 4.42 0.68 3.74
Feb-15 4.72 1.71 2.96 -0.05 0.32 1.06 -0.74 4.40 0.65 3.75
Mar-15 4.64 1.67 2.94 -0.03 0.28 1.03 -0.74 4.36 0.64 3.71
Apr-15 4.32 1.56 2.73 -0.03 0.27 0.95 -0.68 4.05 0.61 3.44
May-15 4.08 1.48 2.55 -0.04 0.22 0.91 -0.69 3.85 0.58 3.28
Jun-15 4.31 1.58 2.69 -0.05 0.22 0.96 -0.74 4.09 0.62 3.47
Jul-15 4.69 1.63 3.27 0.21 0.22 0.98 -0.76 4.47 0.65 3.83
Aug-15 4.79 1.64 3.19 0.05 0.23 0.98 -0.76 4.56 0.66 3.90
Sep-15 4.28 1.53 2.80 0.05 0.21 0.92 -0.71 4.08 0.61 3.46
Oct-15 4.47 1.36 3.26 0.15 0.17 0.83 -0.66 4.30 0.53 3.78
Nov-15 4.69 1.59 3.26 0.15 0.28 0.96 -0.68 4.41 0.63 3.79
Dec-15 4.78 1.53 3.30 0.05 0.30 0.95 -0.65 4.48 0.58 3.90
Yr-on-Yr Chg. 4.4% -9.0% 14.1% -2.4% -6.3% 4.8% -13.0%
% of Total1 100.0% 100.0% 6.3% 62.1% 93.7% 37.9%
Finished Products NGLs Petrol.
Gasoline Distil. Resid. Total1 Total Total2
2013 0.77 0.56 0.05 1.84 0.66 2.50
2014 0.78 0.56 0.07 1.86 0.65 2.51
2015 0.77 0.55 0.05 1.80 0.65 2.45
4Q 2014 0.78 0.57 0.07 1.85 0.65 2.49
1Q 2015 0.74 0.57 0.07 1.79 0.65 2.44
2Q 2015 0.78 0.55 0.04 1.78 0.65 2.42
3Q 2015 0.80 0.56 0.03 1.86 0.65 2.50
4Q 2015 0.76 0.53 0.04 1.77 0.65 2.42
Yr-on-Yr Chg. -3.0% -7.4% -34.5% -4.0% 0.0% -2.9%
Dec-14 0.78 0.54 0.09 1.82 0.65 2.47
Jan-15 0.75 0.56 0.05 1.76 0.65 2.40
Feb-15 0.75 0.62 0.08 1.87 0.65 2.52
Mar-15 0.72 0.54 0.07 1.74 0.65 2.39
Apr-15 0.73 0.53 0.06 1.71 0.65 2.36
May-15 0.77 0.59 0.03 1.76 0.65 2.41
Jun-15 0.82 0.55 0.04 1.86 0.65 2.51
Jul-15 0.82 0.52 0.03 1.88 0.65 2.52
Aug-15 0.82 0.56 0.04 1.86 0.65 2.51
Sep-15 0.77 0.60 0.03 1.84 0.65 2.48
Oct-15 0.77 0.56 0.05 1.85 0.65 2.49
Nov-15 0.76 0.51 0.04 1.75 0.65 2.40
Dec-15 0.74 0.52 0.05 1.72 0.65 2.37
Yr-on-Yr Chg. -4.8% -4.1% -95.3% -5.5% 0.0% -4.0%
Finished Products Crude Oil Petrol.
Gasoline Distil. Resid. Total1 Total Total2
2013 16.5 13.8 2.4 52.4 98.9 151.3
2014 18.9 18.1 3.0 59.4 105.9 165.3
2015 16.7 15.3 3.2 52.1 106.9 159.0
4Q 2014 18.9 18.1 3.0 59.4 105.9 165.3
1Q 2015 17.0 15.7 2.9 54.1 104.0 158.1
2Q 2015 15.1 11.0 1.8 45.7 102.0 147.7
3Q 2015 15.7 10.5 1.8 46.5 103.9 150.4
4Q 2015 16.7 15.3 3.2 52.1 106.9 159.0
Yr-on-Yr Chg. -11.3% -15.5% 8.0% -12.3% 1.0% -3.8%
Dec-14 18.9 18.1 3.0 59.4 105.9 165.3
Jan-15 19.6 19.1 2.6 62.1 104.0 166.1
Feb-15 18.2 16.3 2.7 54.6 103.2 157.8
Mar-15 17.0 15.7 2.9 54.1 104.0 158.1
Apr-15 17.0 15.2 2.3 53.3 99.9 153.2
May-15 17.1 14.0 2.8 52.2 98.8 151.0
Jun-15 15.1 11.0 1.8 45.7 102.0 147.7
Jul-15 14.5 11.2 2.1 44.6 109.2 153.8
Aug-15 15.2 14.0 1.9 47.5 109.3 156.8
Sep-15 15.7 10.5 1.8 46.5 103.9 150.4
Oct-15 14.9 12.3 2.5 45.5 109.3 154.8
Nov-15 15.0 13.8 2.5 47.1 107.5 154.6
Dec-15 16.7 15.3 3.2 52.1 106.9 159.0
Yr-on-Yr Chg. -11.3% -15.5% 8.0% -12.3% 1.0% -3.8%

CERI Commodity Report - Crude Oil
Page 22
D4: Canada Crude Oil Production (million barrels per day)
Note: Total includes small amounts of production from Manitoba and Ontario. Source: Statistics Canada’s Energy Statistics Handbook.
D5: Canada Petroleum Imports by Source (thousand barrels per day)
Notes: 1. Includes all non-OPEC production. 2. Includes production by the other seven OPEC members. 3. As of most recent month. Sources: Statistics Canada’s
Energy Statistics Handbook.
Major Producers Canada Petroleum Type
Alta. Sask. B.C. N.W.T. Atlantic Total1 Light SCO Heavy Bitumen NGLs
2013 2.63 0.47 0.04 0.01 0.23 3.46 0.91 0.94 0.45 0.98 0.15
2014 2.91 0.51 0.05 0.01 0.22 3.76 0.94 0.95 0.46 1.21 0.22
2015 3.09 0.53 0.05 0.01 0.17 3.91 0.85 0.98 0.45 1.39 0.22
4Q 2014 3.04 0.53 0.05 0.01 0.22 3.90 0.95 1.00 0.46 1.28 0.27
1Q 2015 3.17 0.55 0.05 0.01 0.22 4.05 0.95 1.09 0.47 1.32 0.21
2Q 2015 2.81 0.51 0.05 0.01 0.15 3.61 0.83 0.81 0.45 1.28 0.21
3Q 2015 3.17 0.52 0.05 0.01 0.14 3.95 0.79 1.02 0.45 1.46 0.22
4Q 2015 3.19 0.52 0.06 0.01 0.17 4.00 0.82 0.98 0.44 1.51 0.25
Yr-on-Yr Chg. 5.2% -1.4% 5.0% 1.1% -22.2% 2.6% -13.4% -2.1% -4.2% 18.0% -7.8%
Dec-14 3.07 0.53 0.06 0.01 0.22 3.94 0.96 0.99 0.46 1.30 0.28
Jan-15 3.16 0.58 0.05 0.01 0.24 4.05 0.99 1.10 0.49 1.31 0.20
Feb-15 3.21 0.51 0.05 0.01 0.22 4.08 0.95 1.11 0.45 1.34 0.22
Mar-15 3.13 0.56 0.06 0.01 0.19 4.04 0.92 1.07 0.47 1.32 0.22
Apr-15 2.86 0.52 0.06 0.01 0.18 3.71 0.88 0.81 0.45 1.31 0.22
May-15 2.65 0.53 0.05 0.01 0.14 3.46 0.82 0.70 0.45 1.24 0.21
Jun-15 2.92 0.50 0.05 0.01 0.14 3.67 0.79 0.93 0.44 1.30 0.21
Jul-15 3.28 0.52 0.05 0.00 0.14 4.04 0.80 1.09 0.45 1.49 0.21
Aug-15 3.35 0.54 0.05 0.01 0.15 4.16 0.81 1.16 0.46 1.50 0.21
Sep-15 2.89 0.51 0.05 0.01 0.13 3.65 0.78 0.81 0.44 1.38 0.23
Oct-15 3.08 0.53 0.06 0.01 0.09 3.83 0.75 0.87 0.45 1.51 0.24
Nov-15 3.22 0.51 0.06 0.01 0.20 4.05 0.85 1.04 0.44 1.47 0.25
Dec-15 3.28 0.53 0.05 0.01 0.21 4.13 0.87 1.02 0.44 1.54 0.26
Yr-on-Yr Chg. 6.9% -1.6% -3.4% 4.7% -3.7% 4.7% -9.7% 2.5% -3.8% 18.2% -8.5%
Non-OPEC OPEC Imports
Mexico U.S. U.K. Norway Total1 Algeria Nigeria S. Arabia Venez. Total2 P. Gulf Total
2013 24 15 36 55 466 71 47 16 2 177 57 643
2014 17 164 3 12 453 38 27 0 1 90 23 543
2015 0 256 4 8 496 45 26 0 0 71 0 567
4Q 2014 21 118 2 19 451 43 21 0 0 64 0 515
1Q 2015 0 303 0 7 485 61 30 0 0 91 0 576
2Q 2015 0 344 15 11 592 12 21 0 0 33 0 625
3Q 2015 0 191 0 3 461 74 42 0 0 116 0 577
4Q 2015 0 187 1 11 446 33 10 0 0 43 0 489
Yr-on-Yr Chg. -100.0% 58.9% -42.0% -1.1% -23.0% -53.1% -32.9% -5.1%
Dec-14 12 0 0 34 505 18 0 0 0 18 0 523
Jan-15 0 300 0 20 495 83 0 0 0 83 0 577
Feb-15 0 286 0 0 439 33 91 0 0 125 0 564
Mar-15 0 322 0 0 522 67 0 0 0 67 0 588
Apr-15 0 287 0 0 643 0 0 0 0 0 0 643
May-15 0 366 44 14 573 0 29 0 0 29 0 602
Jun-15 0 378 0 21 561 36 33 0 0 70 0 631
Jul-15 0 321 0 0 481 66 61 0 0 127 0 608
Aug-15 0 254 0 0 469 87 35 0 0 122 0 590
Sep-15 0 0 0 9 434 69 29 0 0 98 0 532
Oct-15 0 332 0 10 388 33 30 0 0 63 0 451
Nov-15 0 229 3 23 507 67 0 0 0 67 0 574
Dec-15 0 0 0 0 443 0 0 0 0 0 0 443
Yr-on-Yr Chg. -100.0% 0.0% 0.0% -99.9% -12.4% -100.0% 0.0% 0.0% -100.0% 0.0% -15.4%
% of Total3 0.0% 0.0% 0.0% 0.0% 100.0% 0.0% 0.0% 0.0% 0.0% 0.0% 0.0% 100.0%

Relevant • Independent • Objective
Page 23
E1: World Drilling Activity (active oil and gas rigs)
Notes: 1. Does not include active rigs in the Former Soviet Union and onshore rigs in China. 2. As of latest month. Source: Baker Hughes, Inc.
E2: North American Drilling Activity (active oil and gas rigs)
Notes: 1. Excluding Mexico. 2. Includes drilling on inland waterways. 3. As of latest month. Source: Baker Hughes, Inc.
OECD Non-OECD OPEC World
N. A. Europe Asia-Pac Total Asia Non-Asia Total1 P. Gulf Non-Gulf Total Total1
2013 2,221 117 27 2,365 219 368 586 288 195 483 3,435
2014 2,323 122 26 2,472 228 371 598 318 185 503 3,573
2015 1,222 96 17 1,336 202 296 498 348 156 503 2,337
1Q 2015 1,755 109 21 1,886 214 357 571 322 172 494 2,950
2Q 2015 1,068 96 17 1,181 203 326 529 313 155 468 2,177
3Q 2015 1,098 91 16 1,205 201 193 394 436 153 589 2,187
4Q 2015 967 90 15 1,072 191 307 498 320 143 463 2,033
1Q 2016 749 87 10 847 176 256 432 309 141 451 1,729
Yr-on-Yr Chg. -57.3% -20.2% -51.6% -55.1% -17.8% -28.3% -24.4% -3.9% -17.7% -8.7% -41.4%
Mar-15 1,372 112 22 1,506 211 352 563 319 167 486 2,555
Apr-15 1,133 97 20 1,250 208 337 545 319 154 473 2,268
May-15 1,029 96 15 1,140 202 322 524 308 155 463 2,127
Jun-15 1,041 95 16 1,152 199 318 517 312 155 467 2,136
Jul-15 1,094 90 16 1,200 196 320 516 300 149 449 2,165
Aug-15 1,130 91 15 1,236 205 325 530 304 156 460 2,226
Sep-15 1,070 92 16 1,178 202 -67 135 703 155 858 2,171
Oct-15 1,013 90 16 1,119 197 311 508 311 148 459 2,086
Nov-15 976 87 14 1,077 194 310 504 325 141 466 2,047
Dec-15 913 92 16 1,021 182 299 481 325 139 464 1,966
Jan-16 887 88 14 989 179 268 447 314 139 453 1,889
Feb-16 769 90 9 868 173 256 429 311 140 451 1,748
Mar-16 592 83 8 683 175 244 419 303 145 448 1,550
Yr-on-Yr Chg. -56.8% -25.9% -63.6% -54.6% -17.1% -30.7% -25.6% -5.0% -13.2% -7.8% -39.3%
% of Total2 38.2% 5.4% 0.5% 44.1% 11.3% 15.7% 27.0% 19.5% 9.4% 28.9% 100.0%
United States Canada North America1
East Mid-West S-Cent N-West West Total Land2 Offshore Total Oil Gas Total
2013 89 420 1,049 153 50 1,761 1,705 56 351 1,728 384 2,112
2014 86 453 1,114 156 53 1,861 1,804 57 376 1,905 332 2,238
2015 64 248 395 216 65 977 941 35 193 944 226 1,170
1Q 2015 74 358 814 107 27 1,380 1,330 49 309 1,400 289 1,688
2Q 2015 69 233 516 69 24 909 878 31 100 785 223 1,008
3Q 2015 58 214 203 310 97 866 833 32 191 849 208 1,056
4Q 2015 54 187 45 378 111 754 724 29 174 741 187 928
1Q 2016 37 132 32 279 98 546 520 27 163 600 109 709
Yr-on-Yr Chg. -49.8% -63.0% -96.1% 161.9% 257.3% -60.4% -60.9% -46.0% -47.2% -57.1% -62.1% -58.0%
Mar-15 69 288 649 78 27 1,109 1,066 43 195 1,054 250 1,304
Apr-15 72 252 557 71 27 976 943 33 90 844 222 1,066
May-15 68 226 505 69 23 889 857 32 80 746 223 969
Jun-15 68 220 486 67 22 861 833 28 129 766 224 989
Jul-15 63 213 501 67 22 866 835 31 183 834 216 1,049
Aug-15 56 221 56 443 133 883 849 34 206 880 209 1,089
Sep-15 54 209 52 421 135 848 816 32 183 833 198 1,031
Oct-15 48 194 50 402 117 791 758 33 184 782 193 975
Nov-15 58 194 47 378 107 760 729 31 178 744 194 938
Dec-15 56 174 37 355 108 711 686 24 160 697 174 871
Jan-16 48 155 34 332 107 643 615 28 190 700 133 833
Feb-16 35 123 29 266 98 519 493 26 211 628 102 730
Mar-16 28 119 32 240 88 477 451 27 88 472 93 565
Yr-on-Yr Chg. -59.4% -58.7% -95.1% 207.7% 225.9% -56.9% -57.7% -37.6% -54.9% -55.2% -62.8% -56.6%
% of Total3 5.0% 21.1% 5.7% 42.5% 15.6% 84.4% 79.7% 4.7% 15.6% 83.5% 16.5% 100.0%

CERI Commodity Report - Crude Oil
Page 24
Geographical Specifications
1. The World: OECD is comprised of countries from three regions: North America (Canada, Mexico, US); Europe (Austria, Belgium, Czech Republ ic,
Denmark, Finland, France, Germany, Greece, Hungary, Iceland, Ireland, Italy, Luxembourg, the Netherlands, Norway, Poland, Portugal, the Slovak
Republic, Spain, Sweden, Switzerland, Turkey, UK); and Asia-Pacific (Australia, Japan, New Zealand, South Korea). OPEC is comprised of Persian Gulf (Iran,
Iraq, Kuwait, Qatar, Saudi Arabia, United Arab Emirates) and non-Persian Gulf countries (Algeria, Indonesia, Libya, Nigeria, Venezuela). Non-OECD is
comprised of countries from three regions: Former Soviet Union (Armenia, Azerbaijan, Belarus, Georgia, Kazakhstan, Kirghizstan, Moldova, Russia,
Tajikistan, Turkmenistan, Ukraine, Uzbekistan); Asia (including non-OECD
Oceania); and non-Asia (Africa, Middle East, Latin America, and non-
OECD Europe). 2. United States: East (PADD I) – New England
(Connecticut, Maine, Massachusetts, New Hampshire, Rhode Island,
Vermont); Central Atlantic (Delaware, Maryland, New Jersey, New York,
Pennsylvania, and the District of Columbia) and Lower Atlantic (Florida,
Georgia, North Carolina, South Carolina, Virginia, and West Virginia). Mid
-West (PADD II) – Illinois, Indiana, Iowa, Kansas, Kentucky, Michigan,
Minnesota, Missouri, Nebraska, North Dakota, Ohio, Oklahoma, South
Dakota, Tennessee, and Wisconsin. South-Central (PADD III) – Alabama,
Arkansas, Louisiana, Mississippi, New Mexico and Texas. North-West
(PADD IV) – Colorado, Idaho, Montana, Idaho, Montana, Wyoming. West
(PADD V) – Alaska, Arizona, California, Hawaii, Nevada, Oregon,
Washington.
3. Canada: East is comprised of Ontario, Manitoba, Quebec and the
Maritime provinces (New Brunswick, Newfoundland and Labrador, Nova
Scotia, and Prince Edward Island). West is comprised of Alberta, British
Columbia, Saskatchewan and the northern territories (NorthWest
Territories, Nunavuut, and Yukon).
Additional Notes
1. Petroleum and oil refer to crude oil and natural gas liquids (NGLs),
whereas crude oil refers to its namesake and field condensates.
Condensates derived from natural gas processing plants are classified as
NGLs. 2. The spot price is for immediate delivery of crude oil or refined
products at a specific location. Spot transactions are generally on a cargo
by cargo basis. In contrast, a futures price is for delivery of a specified
quantity of a commodity at a specified time and place in the future. 3.
Crude oil sold Free-On-Board (FOB) is made available to the buyer at the
loading port at a particular time, with transportation and insurance the
responsibility of the buyer. Crude oil sold Cost-Insurance-Freight (CIF) is
priced at a major destination point, with the seller responsible for the
transportation and insurance to that point. A “Delivered” transaction is
similar to a CIF transaction, except the buyer in the former pays based on the quantity and quality ascertained at the unloading port, whereas in a CIF
transaction, the buyer accepts the quantity and quality as determined at the loading port. 4. Processing gain is the volume of which refinery output is
greater than crude oil inputs. The difference is due to the processing of crude oil products, which in total have a lower specific gravity than crude oil. 5.
Unaccounted for crude oil reconciles the difference between crude input to refineries and the sum of domestic production, net imports/exports, stock
changes and documented losses (in the U.S.). 6. Totals may not equal the sum of their parts in the statistical tables due to rounding.
Crude Stream
Producing
Country or
Region
API
Gravity
(@60° F)
Sulfur
Content
(%)
BBLs/Metric
Tonne
Tapis Blend Malaysia 44 0.1 7.910
Ekofisk Blend Norway 43 0.2 7.773
WTI Texas 40 0.3 7.640
GCS Gulf of Mexico 40 0.3 7.640
Oklahoma Sweet Oklahoma 40 0.3 7.640
Kansas Sweet Kansas 40 0.4 7.640
Wyoming Sweet Wyoming 40 0.2 7.640
ELS Alberta 40 0.5 7.640
Brent Blend United kingdom 38 0.8 7.551
Bonny Light Nigeria 37 0.1 7.506
Oman Blend Oman 36 0.8 7.462
Arabian Light Saudi Arabia 34 1.8 7.373
Minas Indonesia 34 0.1 7.373
Isthmus Mexico 34 1.5 7.373
Michigan Sour Michigan 34 1.7 7.373
WTS Texas 33 1.7 7.328
Urals Russia 32 1.7 7.284
Tia Juana Light Venezuela 32 1.2 7.284
Dubai U.A.E. 31 1.7 7.239
Lost Hills California 30 0.6 7.194
Cano Limon Colombia 28 0.6 7.105
Arabian Heavy Saudi Arabia 27 2.8 7.061
ANS Alaska 27 1.1 7.061
Oriente Ecuador 25 1.4 6.971
Hardisty Heavy Alberta 25 2.1 6.971
Maya Mexico 22 3.3 6.838
Kern River California 13 1.0 6.436
Crude Oil Qualities
For more information, please contact Dinara Millington at [email protected]. Canadian Energy Research Institute 150, 3512 – 33 Street NW Calgary, AB T2L 2A6