june july 2015 ceri commodity report — natural gas ... · ceri commodity report – natural gas...
TRANSCRIPT

Relevant • Independent • Objective
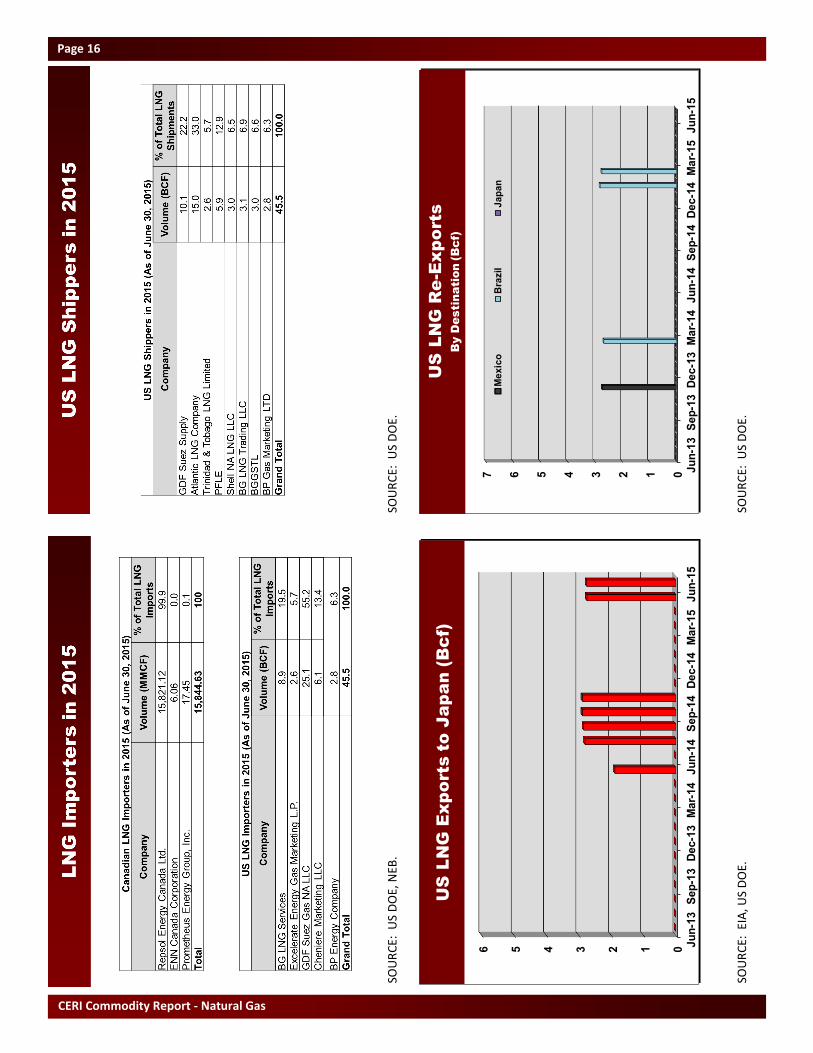
are under the jurisdiction of the United States Maritime Administration (MARAD) and the United States Coast Guard (USCG). Table 1 illustrates the existing import and export LNG terminals in the US, their company name, location and capacity. It is important to note that Freeport LNG, Sabine Pass LNG and Sempra-Cameron LNG are authorized to re-export delivered LNG. Re-exports of LNG occur when foreign shipments are offloaded in US storage tanks and are then subsequently reloaded onto tankers for delivery to other countries.2 This lets marketers and suppliers wait for price signals before delivering the LNG to higher-paying markets.3 Thus far, in 2015 only two shipments totaling 5.54 Bcf were re-exported from Freeport, Texas to Brazil. Table 1: Existing US LNG Terminals4
Source: FERC5 Approved (and Proposed) LNG Export Terminals in the US As of August 2015, five export facilities have been approved by the US Department of Energy and FERC and are already under construction: Sabine (Cheniere-Sabine Pass LNG), Hackberry (Sempra-Cameron LNG), Freeport (Freeport LNG), Cove Point (Dominion-Cove Point LNG) and Corpus Christi (Cheniere-Corpus Christi LNG).6 A sixth export facility, the Sabine Pass Liquefaction LLC (a subsidiary of Cheniere Energy Partners) has been approved but is not yet under construction.7 The US DOE issued a final authorization on June 26, 2015 to Sabine Pass Liquefaction to export domestically produced
June-July 2015
CERI Commodity Report — Natural Gas
The Changing LNG Landscape in the US Paul Kralovic While plunging oil prices have taken the lion's share of the spotlight on energy-related news, a monumental shift in the liquefied natural gas (LNG) landscape in the US is underway and has gone relatively unnoticed. Despite the fact that the first LNG facility in the US was the Kenai LNG export terminal located in the Cook Inlet area in Alaska, it is historically defined as a net importer of LNG. That, however, will change as early as late-2015. Fueled by advances in drilling and hydraulic fracturing technology and techniques, the production of shale gas is a game changer for the US, increasing production from 1.5 TCF in 2007 to 10.7 TCF in 2013.1 The shale gas boom is not only having a profound effect on natural gas production in the Lower-48, but also on how the US views energy and its role in a rapidly changing world. This article reviews the current LNG situation in the US, from a brief overview of existing facilities to reviewing approved export LNG facilities to the flood of proposed export LNG facilities awaiting their fates in various stages of the application process. With plummeting crude oil prices and changing economics, particularly for crude oil-inked LNG contracts, the situation is, however, dynamic. Existing LNG Import/Export Terminals in the US Currently, there are twelve liquefaction or regasification facilities in the US. Aside from the Kenai LNG export terminal, the remaining eleven terminals are import or regasification terminals. Nine terminals are under the Federal Energy Regulatory Commission (FERC) jurisdiction, responsible for the regulation of natural gas pipelines, storage and LNG, while two offshore facilities
Location Company Name Capacity (Bcfpd)
Everett, MA GDF SUEZ - DOMAC 1.035
Cove Point, MD Dominion – Cove Point LNG 1.8
Elba Island, GA El Paso – Southern LNG 1.6
Lake Charles, LA Southern Union – Trunkline LNG 2.1
Offshore Boston Excelerate Energy – Northeast Gateway 0.8
Freeport, TX Cheniere/Freeport LNG Dev. 1.5
Sabine, LA Cheniere/Sabine Pass LNG 4.0
Hackberry, LA Sempra – Cameron LNG 1.8
Offshore Boston, MA GDF SUEZ – Neptune LNG 0.4
Sabine Pass, TX ExxonMobil – Golden Pass (Phase I & II) 2.0
Pascagoula, MS El Paso/Creast/Sonangol – Gulf LNG Energy 1.5
Kenai, AK ConocoPhillips 0.2
CERI Commodity Report – Natural Gas Editorial Committee: Paul Kralovic, Dinara Millington, Megan Murphy, Jon Rozhon, Allan Fogwill About CERI The Canadian Energy Research Institute is an independent, not-for-profit research establishment created through a partnership of industry, academia, and government in 1975. Our mission is to provide relevant, independent, objective economic research in energy and related environmental issues. For more information about CERI, please visit our website at www.ceri.ca or contact us at [email protected].

Relevant • Independent • Objective
Page 2
natural gas to countries that do not have a free trade agreement with the US.8 With the exception of the 2.14 Bcfpd ‘greenfield’ export terminal in Corpus Christi, the remaining export terminals under construction are former import or regasification terminals. These ‘brownfield’ liquefaction projects hold a significant capital cost advantage because many engineering and infrastructure costs were sunk in years past when these sites were being built for regasification purposes. Of the five export facilities under construction, Sabine Pass LNG is leading the way, operational as early as 2015. Cheniere began construction of Trains 1 & 2 in August 2012 and Trains 3 & 4 in May 2013.9 Train 1 is scheduled to be operational in late-2015 with Trains 2 & 3 coming online in 2016.10 Each train has a production capacity of approximately 4.5 million tonnes per annum (Mtpa).11 Sabine Pass LNG’s clients include Chevron (US), Total (France), BG Group (Shell), Gas Natural Fenosa (Spain), KOGAS (Korea), and GAIL (India). Cheniere secured a sales agreement for up to 26 cargoes of LNG through 2019 with French-based EDF.12 With Russia supplying one-third of Europe’s gas, the latest deal announced on August 12, 2015 is attracting attention, highlighting possible geopolitical impacts or repercussions of the US entering the export game. Cove Point, located in Maryland, is the only export terminal under construction that is not located in the Gulf of Mexico. Cove Point began receiving LNG from Algeria in 1978 and after a period of disuse the facility was transformed to store domestic natural gas. Dominion Cove Point LNG received approval in May 2015 to build a liquefaction facility to export domestic natural gas.13 Construction of the 5.25 Mtpa facility began in 2014 and is scheduled to be operational in 2017.14 Sempra-Cameron LNG, located in Hackberry, Louisiana, received approval from the US Department of Energy to export up to 12 Mtpa, or approximately 1.7 Bcfpd, of domestically produced natural gas, and received authorization from FERC to operate a liquefaction facility in June 2014.15 Three trains are planned, with Trains 1, 2 & 3 coming online in early, mid- and late-2018, respectively.16 The planned expansion (Trains 4 & 5) is currently in the application process and, if approved, will increase the facilities capacity to 24.92 Mtpa, or 3.53 Bcfpd.17
Freeport LNG will have a capacity of 1.8 Bcfpd and is scheduled to be operational in 2018. All 13.2 Mtpa of production capacity has been contracted under tolling agreements with Osaka Gas (Japan), Chubu Electric (Japan), BP (UK), Toshiba (Japan), and SK E&S (South Korea).18 The fifth export terminal that is currently under construction is Cheniere’s Corpus Christi LNG export terminal. The liquefaction project is comprised of three trains, each with a capacity of 4.5 Mtpa (a total of 13.5 Mtpa) or approximately 2.1 Bcfpd.19 Construction began on May 13, 2015 and is slated to be completed in 2018.20 The project received FERC approval on April 6, 2015.21 The Corpus Christi LNG project also includes the construction and operation of a 78-inch diameter bi-directional pipeline.22 In June 2015, Cheniere Energy announced plans to expand by adding two trains (Trains 4 & 5), expanding capacity by approximately 9 Mtpa, and the project, dubbed Corpus Christi Liquefaction, is at the pre-filing stage with FERC.23 There are currently another 24 proposed export terminals in the US, nine of which are pending applications and the remainder are in the pre-filing stage.24 Seventeen projects are proposed in the Gulf of Mexico region (nine are located in Texas and seven are located in Louisiana). A further three are located on the US East Coast (Florida, Georgia and Maine), two are located on the US West Coast (Coos Bay and Astoria, Oregon) and one is proposed in Nikiski, Alaska. It is not a coincidence that the majority of liquefaction projects are located in the Gulf of Mexico, poised to take advantage of the expansion of the Panama Canal, to be completed in early 2016. The US$5.2 billion expansion project is large enough to handle the vast majority of the global LNG fleet, cutting the costs and time for LNG vessels departing the US east coast and Gulf of Mexico to the LNG-hungry Asian markets of Japan, South Korea and China. The new dimensions will likely open Atlantic Basin LNG to Asian markets, currently satisfied by either Middle Eastern or Pacific-Australian Basin LNG. While there are several reasons why LNG export projects may not go through, such as environmental challenges or opposition from gas-intensive industries, the price of oil may yet define the US LNG story. Lower oil prices are certainly eroding the spread between US and global prices, particularly as low oil prices have reduced the cost of oil-linked contracts that still dominate the

Relevant • Independent • Objective
Page 3
industry. This will challenge some LNG suppliers. As a result, many industry pundits are questioning how many export liquefaction terminals will indeed be built and how many of the under construction projects may be delayed due to the drop in oil prices. This reinforces CERI’s US supply/demand forecast in its Western Canada Natural Gas Forecasts and Impacts (2015-2035) study. Part of its North American gas market assumptions include 13 Bcfpd of LNG exports from the Gulf of Mexico and 1 Bcfpd of LNG exports from Cove Point over the 2015-2035 period.25 For additional information on LNG Liquefaction in a global setting, please download a recent CERI study, LNG Liquefaction in the Asia-Pacific Market: Canada’s Place in the Global Game.26 Endnotes 1EIA website, Table 4 Principal shale gas plays, 2012-2013, http://www.eia.gov/naturalgas/crudeoilreserves/pdf/table_4.pdf 2EIA Website, U.S. Natural Gas Exports and Re-Exports by Country, http://www.eia.gov/dnav/ng/ng_move_expc_s1_a.htm 3ibid 4FERC, North American LNG Import/Export Terminals – Existing, http://www.ferc.gov/industries/gas/indus-act/lng/lng-existing.pdf 5ibid 6FERC, North American LNG Import/Export Terminals: Approved as of June 18, 2015, http://www.ferc.gov/industries/gas/indus-act/lng/lng-approved.pdf 7Cheniere Website, Sabine Pass LNG, Train 5 & 6, http://www.cheniere.com/terminals/sabine-pass/trains-5-6/ 8US Department of Energy, Energy Department Authorizes Sabine Pass Liquefaction Expansion, http://www.energy.gov/articles/energy-department-authorizes-sabine-pass-liquefaction-s-expansion-project-export-liquefied
9Cheniere Website, Sabine Pass LNG, Trains 1 & 4, http://www.cheniere.com/terminals/sabine-pass/trains-1-4/ 10ibid 11ibid 12UPI Website, France Secures LNG from United States, http://www.upi.com/Business_News/Energy-Industry/2015/08/12/France-secures-LNG-from-United-States/6421439374351/ 13Dominion Cove Point LNG Website, Cove Point, https://www.dom.com/covepoint 14ibid 15Cameron LNG Website, Project Timeline, http://cameronlng.com/project-timeline.html 16ibid 17Cameron LNG Website, Liquefaction Expansion, http://cameronlng.com/liquefaction-expansion.html 18CERI Study 148, LNG Liquefaction for the Asia-Pacific Market, Jon Rozhon, June 2015, pp. 27. 19Cheniere Website, http://www.cheniere.com/terminals/corpus-christi-project/ 20Cheniere Website, http://www.cheniere.com/terminals/corpus-christi-project/liquefaction-project-trains-1-3/cc-schedule/ 21ibid 22Oil Online Website, EIA: LNG export terminals under construction, more planned, https://www.oilonline.com/news/midstream/eia-lng-export-terminals-under-construction-more-planned 23Cheniere Website, Corpus Christi Liquefaction, Stage 3 Under Development, http://www.cheniere.com/terminals/corpus-christi-project/stage-3-expansion-project-trains-4-5/ 24FERC, North American LNG Export Terminals – Proposed, http://www.ferc.gov/industries/gas/indus-act/lng/lng-existing.pdf 25Western Canada Natural Gas Forecasts and Impacts (2015-2035), CERI Study No. 149, July 2015. 26CERI Study 148, June 2015.

CERI Commodity Report - Natural Gas
Page 4
SOU
RC
E: C
ERI,
Pla
tts
Gas
Dai
ly P
rice
Gu
ide.
SO
UR
CE:
CER
I, P
latt
s G
as D
aily
Pri
ce G
uid
e.
SOU
RC
E: C
ERI,
Pla
tts
Gas
Dai
ly P
rice
Gu
ide.
SO
UR
CE:
CER
I, P
latt
s G
as D
aily
Pri
ce G
uid
e.
-113579
11
13
15 Jan
-05
Ju
l-06
Jan
-08
Ju
l-09
Jan
-11
Ju
l-12
Jan
-14
Ju
l-15
Dif
fere
nti
al
He
nry
Hu
bR
oc
kie
s
He
nry H
ub
/R
oc
kie
s
Beginning o
f N
ext M
onth S
pot P
rice (U
S$/M
MB
tu)
-113579
11
13
15 Ja
n-0
5J
ul-
06
Jan
-08
Ju
l-0
9J
an
-11
Ju
l-1
2J
an
-14
Ju
l-1
5
Dif
fere
nti
al
He
nry
Hu
bS
ou
the
rn C
ali
forn
ia
He
nry H
ub
/S
ou
th
ern
C
alifo
rn
ia
Be
gin
nin
g o
f N
ex
t M
on
th
S
po
t P
ric
e (U
S$
/M
MB
tu
)
-202468
10
12
14 Jan
-05
Ju
l-06
Jan
-08
Ju
l-09
Jan
-11
Ju
l-12
Jan
-14
Ju
l-15
Dif
fere
nti
al
He
nry
Hu
bA
EC
O-C
He
nry H
ub
/A
EC
O-C
Beginning of N
ext M
onth S
pot P
rice (U
S$/M
MB
tu)
-7-5-3-113579
11
13
15 Jan
-05
Ju
l-06
Jan
-08
Ju
l-09
Jan
-11
Ju
l-12
Jan
-14
Ju
l-15
Dif
fere
nti
al
He
nry
Hu
bC
hic
ag
o
He
nry H
ub
/C
hic
ag
o
Be
gin
nin
g o
f N
ex
t M
on
th
S
po
t P
ric
e (U
S$
/M
MB
tu
)

Relevant • Independent • Objective
Page 5
SOU
RC
E: C
anad
ian
Gas
Ass
oci
atio
n.
SOU
RC
E: C
ERI,
Can
adia
n G
as A
sso
ciati
on
, Sta
tisti
cs C
anad
a.
SOU
RC
E: N
OA
A.
SOU
RC
E: C
ERI,
NO
AA
, EIA
.
0
100
200
30
0
400
500
600
700
800
JF
MA
MJ
JA
SO
ND
5-Y
ea
r A
vg
.2
01
42
01
5
Ca
na
dia
n H
ea
tin
g D
eg
re
e D
ays
0
100
200
300
400
500
600
70
0
800
90
0
1,0
00
JF
MA
MJ
JA
SO
ND
5-Y
ea
r A
vg
.2
01
42
01
5
US
H
ea
tin
g D
eg
re
e D
ays
01234567
0
200
400
600
800
1,0
00
1,2
00 J
an
-09
Jan
-10
Jan
-11
Jan
-12
Jan
-13
Jan
-14
Jan
-15
De
gre
e D
ay
sC
on
su
mp
tio
n
Ca
na
dia
n H
eatin
g D
eg
re
e D
ays vs R
esid
en
tia
l a
nd
Co
mm
erc
ia
l C
on
su
mptio
n
Deg
ree D
ays
BC
FP
D
010
20
30
40
50
60
0
200
400
600
800
1,0
00
1,2
00 J
an
-09
Jan
-10
Jan
-11
Jan
-12
Jan
-13
Ja
n-1
4J
an
-15
De
gre
e D
ay
sC
on
su
mp
tio
n
US
H
ea
tin
g D
eg
re
e D
ays vs
Re
sid
en
tia
l a
nd
C
om
me
rc
ia
l C
on
su
mp
tio
n
De
gre
e D
ay
sB
CF
PD

CERI Commodity Report - Natural Gas
Page 6
SOU
RC
E: E
nvi
ron
men
t C
anad
a.
SOU
RC
E: E
nvi
ron
men
t C
anad
a.
SOU
RC
E: N
OA
A.
SOU
RC
E: N
OA
A.

Relevant • Independent • Objective
Page 7
SOU
RC
E: N
OA
A.
SOU
RC
E: E
nvi
ron
men
t C
anad
a.
SOU
RC
E: N
OA
A.

CERI Commodity Report - Natural Gas
Page 8
SOU
RC
E: S
tati
stics
Can
ada.
SO
UR
CE:
Sta
tisti
cs C
anad
a, N
EB.
SOU
RC
E: E
IA.
SOU
RC
E: E
IA.
02468
10
12
14
16 J
an
-09
Jan
-10
Ja
n-1
1J
an
-12
Ja
n-1
3J
an
-14
Ja
n-1
5
Ind
us
tria
l &
Po
we
rC
om
me
rcia
lR
es
ide
nti
al
Ca
na
dia
n C
on
su
mp
tio
n
By S
ec
to
r (B
cfp
d)
02468
10
12
14
16
18
20 J
an
-09
Jan
-10
Jan
-11
Jan
-12
Jan
-13
Jan
-14
Jan
-15
BC
, Y
uk
on
, N
WT
AB
SK
E.
Co
as
t
Ca
na
dia
n M
arke
ta
ble
Pro
du
ctio
n
By P
ro
vin
ce
/R
eg
io
n (B
cfp
d)
0
20
40
60
80
100
120
140 J
an
-09
Jan
-10
Jan
-11
Jan
-12
Jan
-13
Jan
-14
Jan
-15
Ind
us
tria
lE
lec
tric
Po
we
rC
om
me
rcia
lR
es
ide
nti
al
US
C
on
su
mp
tio
n
By S
ec
to
r (B
cfp
d)
0
10
20
30
40
50
60
70
80
90 J
an
-09
Jan
-10
Jan
-11
Jan
-12
Jan
-13
Jan
-14
Jan
-15
US
To
tal
Lo
uis
ian
aG
OM
Fe
de
ral
Wa
ters
Te
xa
s
US
M
ark
eta
ble
P
ro
du
ctio
n (B
cfp
d)
Relevant • Independent • Objective
Page 9
SOU
RC
E: S
tati
stics
Can
ada,
NEB
. SO
UR
CE:
Sta
tisti
cs C
anad
a, N
EB.
SOU
RC
E: S
tati
stics
Can
ada,
NEB
. SO
UR
CE:
Sta
tisti
cs C
anad
a, N
EB.
0.0
1.0
2.0
3.0
4.0
5.0
JF
MA
MJ
JA
SO
ND
20
13
20
14
20
15
BC
, Y
uk
on
, N
WT
M
ark
eta
ble
Pro
du
ctio
n (B
cfp
d)
02468
10
12
14
16
JF
MA
MJ
JA
SO
ND
20
13
20
14
20
15
Alb
erta
M
ark
eta
ble
P
ro
du
ctio
n (B
cfp
d)
0.0
0.5
1.0
JF
MA
MJ
JA
SO
ND
20
13
20
14
20
15
Sa
sk
atc
he
wan M
arke
ta
ble
Pro
du
ctio
n (B
cfp
d)
0.0
0
0.2
5
0.5
0
JF
MA
MJ
JA
SO
ND
20
13
20
14
20
15
Ea
st C
oa
st M
ark
eta
ble
P
ro
du
ctio
n (B
cfp
d)

CERI Commodity Report - Natural Gas
Page 10
SOU
RC
E: C
ERI.
SO
UR
CE:
CER
I.
SOU
RC
E: N
EB.
SOU
RC
E: N
EB.
02468
10
12
14
16
JF
MA
MJ
JA
SO
ND
20
13
20
14
20
15
Syste
m F
ie
ld
R
ec
eip
ts
Tra
nsC
an
ad
a +
W
estc
oa
st; M
on
th
ly A
ve
ra
ge
(B
cfp
d)
02468
10
12
14
16
Ju
l-14
Sep
-14
No
v-1
4Jan
-15
Mar-
15
May-1
5Ju
l-15
Em
pre
ss
Mc
Ne
ill
AB
-BC
All
ian
ce
Alb
erta
S
yste
m D
elive
rie
s (B
cfp
d)
0123456789
10
Ju
n-1
4A
ug
-14
Oct-
14
Dec-1
4F
eb
-15
Ap
r-15
Ju
n-1
5
Kin
gs
ga
teM
on
ch
yE
lmo
reH
un
tin
gd
on
Ca
na
dia
n G
as E
xp
orts to
th
e U
S
By E
xp
ort P
oin
t -W
est (B
cfp
d)
0123456
Ju
n-1
4A
ug
-14
Oct-
14
Dec-1
4F
eb
-15
Ap
r-15
Ju
n-1
5
Em
ers
on
Iro
qu
ois
Oth
ers
Nia
ga
ra
Ca
na
dia
n G
as E
xp
orts to
th
e U
S
By E
xp
ort P
oin
t -E
ast (
Bc
fp
d)

Relevant • Independent • Objective
Page 11
SOU
RC
E: N
EB.
SOU
RC
E: N
EB.
SOU
RC
E: N
EB, E
IA.
SOU
RC
E: N
EB.
02468
10
12
Ju
n-1
4A
ug
-14
Oct-
14
Dec-1
4F
eb
-15
Ap
r-15
Ju
n-1
5
We
st
Mid
We
st
Ea
st
US
Im
po
rts o
f C
an
ad
ia
n G
as
By U
S R
eg
io
n (B
cfp
d)
02468
10
12
14
16
18
Ju
n-1
4A
ug
-14
Oct-
14
Dec-1
4F
eb
-15
Ap
r-15
Ju
n-1
5
We
st
Mid
We
st
Ea
st
Ave
ra
ge
C
an
ad
ia
n E
xp
ort P
ric
e
By U
S R
eg
io
n (C
$/G
J)
01234
Ju
n-1
4A
ug
-14
Oc
t-1
4D
ec
-14
Fe
b-1
5A
pr-
15
Ju
n-1
5
Co
urt
rig
ht
Sa
rnia
St.
Cla
irO
the
r
Ca
na
dia
n G
as Im
po
rts
By Im
po
rt P
oin
t (B
cfp
d)
02468
10
12
14 Ma
y-1
4J
ul-
14
Sep
-14
No
v-1
4J
an
-15
Ma
r-1
5M
ay
-15
Ca
na
da
Me
xic
o
To
ta
l U
S P
ip
elin
e G
as Im
po
rts (B
cfp
d)

CERI Commodity Report - Natural Gas
Page 12
SOU
RC
E: C
ERI,
Pla
tts
Gas
Dai
ly.
SOU
RC
E: C
ERI,
Pla
tts
Gas
Dai
ly.
SOU
RC
E: C
ERI,
Pla
tts
Gas
Dai
ly.
SOU
RC
E: C
ERI,
Pla
tts
Gas
Dai
ly.
0
100
200
300
400
500
600
700
800
900
1,0
00
JF
MA
MJ
JA
SO
ND
5-Y
ea
r A
vg
.2
01
42
01
5
Ca
na
dia
n W
ork
ing
G
as S
to
ra
ge
(B
cf, M
onth-end)
0
500
1,0
00
1,5
00
2,0
00
2,5
00
3,0
00
3,5
00
4,0
00
4,5
00
Ju
l-1
4S
ep
-14
No
v-1
4J
an
-15
Ma
r-1
5M
ay
-15
Ju
l-1
5
Ea
st
We
st
Pro
du
cin
g R
eg
ion
US
S
torage by R
egion (B
cf, M
onth
-end)
0
500
1,0
00
1,5
00
2,0
00
2,5
00
3,0
00
3,5
00
4,0
00
4,5
00
JF
MA
MJ
JA
SO
ND
5-Y
ea
r A
vg
.2
01
42
01
5
US
L
ow
er-4
8 W
ork
in
g G
as S
to
ra
ge
(B
cf, M
on
th
-e
nd
)
0
10
0
200
300
400
500
600
700
80
0
900
Ju
l-1
4S
ep
-14
No
v-1
4J
an
-15
Ma
r-1
5M
ay
-15
Ju
l-1
5
We
st
Ea
st
Canadian S
torage by R
egion (B
cf, M
onth-end)

Relevant • Independent • Objective
Page 13
SOU
RC
E: C
ERI,
Pla
tts
Gas
Dai
ly.
SOU
RC
E: C
ERI,
Pla
tts
Gas
Dai
ly.
SOU
RC
E: C
ERI,
Pla
tts
Gas
Dai
ly.
-140
-100
-60
-20
20
60
100
JF
MA
MJ
JA
SO
ND
WC
_IJ
_W
D
5-Y
ea
r A
vg
.2
01
42
01
5
We
ste
rn
C
an
ad
a S
to
ra
ge
In
je
ctio
ns/W
ith
dra
wals
(B
cf, M
on
th
-e
nd
)
-250
-200
-150
-100
-500
50
100
150
JF
MA
MJ
JA
SO
ND
5-Y
ea
r A
vg
.2
01
42
01
5
Canadian S
torage
Injections/W
ithdraw
als (B
cf, M
onth
-end)
-100
-80
-60
-40
-200
20
40
60
80
JF
MA
MJ
JA
SO
ND
5-Y
ea
r A
vg
.2
01
42
01
5
Eastern C
anadian S
torage Injections/W
ithdraw
als
(B
cf, M
onth-end)

CERI Commodity Report - Natural Gas
Page 14
SOU
RC
E: C
ERI,
Pla
tts
Gas
Dai
ly.
SOU
RC
E: C
ERI,
Pla
tts
Gas
Dai
ly.
SOU
RC
E: C
ERI,
Pla
tts
Gas
Dai
ly.
SOU
RC
E: C
ERI,
Pla
tts
Gas
Dai
ly.
-150
-100
-500
50
100
JF
MA
MJ
JA
SO
ND
5-Y
ea
r A
vg
.2
01
42
01
5
US
W
estern C
onsum
ing R
egion S
torage
Injections/W
ithdraw
als (B
cf, M
onth-end)
-400
-300
-200
-1000
10
0
200
JF
MA
MJ
JA
SO
ND
5-Y
ea
r A
vg
.2
01
42
01
5
US
P
roducing R
egion S
torage Injections/W
ithdraw
als
(B
cf, M
onth-end)
-12
00
-10
00
-800
-600
-400
-2000
200
400
600
800
JF
MA
MJ
JA
SO
ND
5-Y
ea
r A
vg
.2
01
42
01
5
US
S
torage
Injections/W
ithdraw
als (B
cf, M
onth-end)
-700
-500
-300
-100
100
300
500
JF
MA
MJ
JA
SO
ND
5-Y
ea
r A
vg
.2
01
42
01
5
US
E
astern S
torage

Relevant • Independent • Objective
Page 15
SOU
RC
E: U
S D
OE.
SO
UR
CE:
US
DO
E.
SOU
RC
E: U
S D
OE.
No
te:
Ther
e w
ere
no
LN
G im
po
rts
for
the
mo
nth
of
No
vem
ber
20
14
.
SOU
RC
E: U
S D
OE.
02468
Ju
n-1
3S
ep
-13
Dec-1
3M
ar-
14
Ju
n-1
4S
ep
-14
Dec-1
4M
ar-
15
Ju
n-1
5
Fre
ep
ort
La
ke
Ch
arl
es
Sa
bin
e P
as
sC
am
ero
nG
old
en
Pa
ss
Gu
lf L
NG
US
G
oM
L
NG
Im
po
rts B
y F
ac
ility (B
cf)
05
10
15
20
Ju
n-1
3S
ep
-13
Dec-1
3M
ar-
14
Ju
n-1
4S
ep
-14
Dec-1
4M
ar-
15
Ju
n-1
5
Oth
er
Nig
eri
aT
rin
ida
dN
orw
ay
Qa
tar
Ye
me
n
US
L
NG
Im
po
rts B
y O
rig
in
(B
cf)
02468
10
12
14
16
Ju
n-1
3S
ep
-13
De
c-1
3M
ar-
14
Ju
n-1
4S
ep
-14
De
c-1
4M
ar-
15
Ju
n-1
5
Co
ve
Po
int
Elb
a I
sla
nd
Ev
ere
ttN
E G
ate
wa
yN
ep
tun
e
Ea
ste
rn
U
S L
NG
Im
po
rts B
y F
ac
ility (B
cf)
02468
10
12
14
16
18
JF
MA
MJ
JA
SO
ND
20
13
20
14
20
15
Volum
e-W
eighted A
verage LN
G P
rice (U
S$/M
MB
tu)
CERI Commodity Report - Natural Gas
Page 16
SOU
RC
E: U
S D
OE,
NEB
. SO
UR
CE:
US
DO
E.
SOU
RC
E: E
IA, U
S D
OE.
SO
UR
CE:
US
DO
E.
0123456 Ju
n-1
3S
ep
-13
Dec-1
3M
ar-
14
Ju
n-1
4S
ep
-14
Dec-1
4M
ar-
15
Ju
n-1
5
Japan
US
L
NG
E
xp
orts to
J
ap
an
(B
cf)
01234567 Ju
n-1
3S
ep
-13
Dec-1
3M
ar-
14
Ju
n-1
4S
ep
-14
Dec-1
4M
ar-
15
Ju
n-1
5
Me
xic
oB
razil
Ja
pa
n
US
L
NG
R
e-E
xp
orts
By D
estina
tion
(B
cf)
Relevant • Independent • Objective
Page 17
SOU
RC
E: C
ERI,
CA
OD
C, B
aker
Hu
ghes
. SO
UR
CE:
CER
I, C
AO
DC
.
SOU
RC
E: C
ERI,
CA
OD
C.
SOU
RC
E: C
ERI,
CA
OD
C.
0
500
1,0
00
1,5
00
2,0
00
2,5
00
3,0
00 Jan
-06
Jan
-07
Jan
-08
Jan
-09
Jan
-10
Jan
-11
Jan
-12
Jan
-13
Jan
-14
Jan
-15
US
WC
SB
North A
merican A
ctive R
igs
0
100
200
300
400
500
600
700
800
900
1,0
00 Ja
n-0
6J
an
-07
Ja
n-0
8J
an
-09
Ja
n-1
0J
an
-11
Jan
-12
Jan
-13
Ja
n-1
4J
an
-15
Ac
tiv
e R
igs
To
tal
Rig
Dri
llin
g F
lee
t
Ca
na
dia
n R
ig
F
le
et U
tiliza
tio
n
We
ek
ly A
ve
ra
ge
Ac
tive
Rig
s
0
100
200
300
400
500
600
70
0 Jan
-09
Jan
-10
Jan
-11
Jan
-12
Jan
-13
Jan
-14
Jan
-15
SK
AB
BC
WC
SB
A
ctive
R
ig
s b
y P
ro
vin
ce
We
ek
ly A
ve
ra
ge
-
100
200
300
400
500
600
700
800
15
913
17
21
25
29
33
37
41
45
49
5-Y
ea
r A
vg
.2
01
42
01
5
We
ste
rn
C
an
ad
a A
ctive
R
ig
s
Wee
kly A
ve
ra
ge
Week N
um
ber

CERI Commodity Report - Natural Gas
Page 18
SOU
RC
E: C
ERI,
Bak
er H
ugh
es.
SO
UR
CE:
CER
I, B
aker
Hu
ghe
s.
SOU
RC
E: C
ERI,
Bak
er H
ugh
es.
0%
10%
20%
30%
40%
50%
60%
70%
80
%
90%
100%
0
200
400
600
800
1,0
00
1,2
00
1,4
00
1,6
00
1,8
00
2,0
00
2,2
00
2,4
00 Jan
-06
Jan
-07
Jan
-08
Jan
-09
Jan
-10
Jan
-11
Jan
-12
Jan
-13
Jan
-14
Jan
-15
Oil
-dir
ec
ted
Ga
s-d
ire
cte
dG
as-d
ire
cte
d %
US
T
ota
l A
ctive
R
ig
s
0
50
0
1,0
00
1,5
00
2,0
00
2,5
00 Jan
-06
Ja
n-0
7J
an
-08
Ja
n-0
9J
an
-10
Jan
-11
Jan
-12
Jan
-13
Ja
n-1
4J
an
-15
To
tal
Oil
-dir
ec
ted
Go
M G
as
-dir
ec
ted
On
sh
ore
Ga
s-d
ire
cte
d
US
T
ota
l A
ctive
R
ig
s
0
20
40
60
80
100
120 J
an
-06
Jan
-07
Jan
-08
Jan
-09
Jan
-10
Jan
-11
Jan
-12
Jan
-13
Jan
-14
Jan
-15
Oil
-dir
ec
ted
Ga
s-d
ire
cte
d
US
G
ulf o
f M
ex
ic
o A
ctive
R
ig
s